

Abstract
Predictive analytics with electronic health record (EHR) data holds promise for improving outcomes of psychiatric care. This study evaluated models for predicting outcomes of psychotherapy for depression in a clinical practice setting. EHR data from two large integrated health systems (Kaiser Permanente Colorado and Washington) included 5,554 new psychotherapy episodes with a baseline Patient Health Questionnaire (PHQ-9) score ≥ 10 and a follow-up PHQ-9 14–180 days after treatment initiation. Baseline predictors included demographics and diagnostic, medication, and encounter history. Prediction models for two outcomes—follow-up PHQ-9 score and treatment response (≥ 50% PHQ-9 reduction)—were trained in a random sample of 70% of episodes and validated in the remaining 30%. Two methods were used for modeling: generalized linear regression models with variable selection and random forests. Sensitivity analyses considered alternate predictor, outcome, and model specifications. Predictions of follow-up PHQ-9 scores poorly estimated observed outcomes (mean squared error = 31 for linear regression, 40 for random forest). Predictions of treatment response had low discrimination (AUC = 0.57 for logistic regression, 0.61 for random forest), low classification accuracy, and poor calibration. Sensitivity analyses showed similar results. We note that prediction model performance may vary for settings with different care or EHR documentation practices. In conclusion, prediction models did not accurately predict depression treatment outcomes despite using rich EHR data and advanced analytic techniques. Health systems should proceed cautiously when considering prediction models for psychiatric outcomes using baseline intake information. Transparent research should be conducted to evaluate performance of any model intended for clinical use.
Keywords: Depression, Machine learning, Measurement-based care, Patient-reported outcomes, Prediction, Quality measures
1. Introduction
The last decade brought growing enthusiasm for the potential of predictive analytic techniques to transform healthcare delivery(Bates et al., 2014; Parikh et al., 2017; Rajkomar et al., 2019). Widespread adoption of electronic health record (EHR) systems since the HITECH Act of 2019 has made rich clinical and administrative data available as input for prediction models(Charles et al., 2015). Advanced statistical algorithms, frequently branded as “machine learning” and “artificial intelligence”, promise to learn from EHR data and return actionable information to providers(Obermeyer and Emanuel, 2016; Parikh et al., 2016). That enthusiasm, however, is balanced by significant concerns regarding the accuracy, clinical utility, fairness, and generalizability of prediction models based on health records data(Char et al., 2018; Obermeyer and Emanuel, 2016; Rajkomar et al., 2019; Rajkomar et al., 2018; Shah et al., 2018). These questions can only be answered with observed data regarding the specific clinical decision that a prediction model aims to address.
Within mental health care, statistical models using health records data have been developed to predict specific adverse outcomes such as suicidal behavior, physical restraint during psychiatric hospitalization, and psychiatric hospital readmission (Danielsen et al., 2019; Edgcomb et al., 2019; Matarazzo et al., 2019; McCarthy et al., 2015; Simon et al., 2018). Success in predicting adverse outcomes has raised hope that EHR data could predict favorable outcomes of mental health treatment and inform individualized medicine in mental health. Despite that hope, we lack examples of accurate treatment outcome prediction from real-world health records data.
In this study, we consider using EHR data at treatment onset to predict outcomes of psychotherapy for depression. Prediction models for depression treatment outcomes may perform well using more detailed measures collected in clinical trial settings (Chekroud et al., 2016; Webb et al., 2019), but accuracy of prediction models using routinely collected data available at a patient’s first psychotherapy visit has not yet been examined. There are several possible uses for such a prediction model. First, this model could inform treatment planning for individual patients at the point of care (Fortney et al., 2017). Second, a prediction model using baseline data (before provider behavior affects outcomes) could provide case-mix adjustment for comparing quality measures for mental health care, thereby enabling fair comparisons of providers or health systems. Third, the ability to predict depression psychotherapy outcomes with baseline data could improve comparative effectiveness research embedded in clinical practice. An accurate prediction model could inform estimation of treatment effectiveness by increasing statistical power in randomized trials or, in an observational setting, enable comparison of observed outcomes to those expected in the absence of additional treatment.
Evaluation of a prediction model for depression psychotherapy outcomes first depends on examining its accuracy and ability to distinguish between patients likely to experience improvement in depression symptoms and those who are unlikely. The objective of this study is to develop a prediction model for the outcome of psychotherapy for depression using EHR data including records of diagnoses, medications, encounters, and patient-reported outcomes from two large integrated health systems. We evaluate prediction model performance and consider adequacy for clinical use.
2. Methods
Prediction analyses used EHR data from the Colorado and Washington regions of Kaiser Permanente (KPCO and KPWA, respectively). KPCO and KPWA provide insurance coverage and comprehensive health care (including specialty mental health care) to a combined population of approximately 1.4 million members. Health system members are enrolled through employer-sponsored insurance, individual insurance, capitated Medicare or Medicaid, and subsidized low-income programs. Member demographics are generally representative of each system’s service area. KPCO and KPWA each maintain a research data warehouse containing medical record and insurance claims data following the Health Care Systems Research Network’s virtual data warehouse model (Ross et al., 2014). Use of health system data for this research was approved by each site’s institutional review board.
New episodes for depression treatment were identified for analysis using the following criteria for the initial psychotherapy visit (“base-line”): patient aged 13 or older, no procedure code for psychotherapy in the prior 365 days, visit occurred between February 1, 2016 and January 31, 2017, and total baseline 9-item Patient Health Questionnaire (PHQ-9) score ≥10 (Kroenke et al., 2001). For new psychotherapy episodes without a PHQ-9 observed at the initial visit, the nearest PHQ-9 observed in the 14 days prior or 7 days following the initial visit was taken as the baseline PHQ-9 score. Analyses were further restricted to episodes with at least one PHQ-9 score observed between 14–180 days after baseline (“follow-up”). Only psychotherapy visits to internal or group practice providers were included in analysis to ensure availability of EHR data. Patients received a range of psychotherapy treatments, per provider discretion, and cognitive behavioral therapy is a typical treatment in both systems.
Both health systems use the PHQ-9 to assess depression symptoms at mental health specialty visits. At KPCO, PHQ-9 data were collected on tablets in the waiting room before appointments. At KPWA, patients completed paper questionnaires which were then entered into the EHR by the treating provider. For this analysis, all PHQ-9 responses for eligible episodes were extracted from the EHR. For incomplete PHQ-9 surveys with six or more completed items, a total score was obtained by assigning the mean score for completed items to unanswered items. Total scores for questionnaires with fewer than six items completed were considered missing.
Potential baseline predictors were extracted from health systems records for up to five years prior to episode initiation and included patient demographics (age, sex, race, ethnicity, and source of insurance), baseline PHQ-9 score, current and past prescriptions for psychiatric medications, current and past mental health and substance use diagnoses, and past use of mental health and general medical services. Baseline predictors reflecting clinical history were represented as 112 binary variables indicating presence of psychiatric diagnoses, prescriptions, or encounter codes (including outpatient mental health visits and emergency department or inpatient hospitalizations with psychiatric diagnoses) in non-overlapping time periods before baseline to reflect temporal patterns: 1–3 months (1–90 days), 3–6 months (91–180), 6–12 months (181–365), and 1–5 years (366–1,825 days). A full list of predictors is provided in the Supplemental Materials (Table S1).
Depression treatment outcomes to be predicted were defined by PHQ-9 scores observed 14–180 days after episode onset. Primary analyses developed prediction models for the best (i.e., lowest) follow-up PHQ-9 score and for the binary indicator of depression treatment response, defined as 50% or greater reduction in total PHQ-9 between baseline and best follow-up score. All predictor and outcome variables were completely specified and calculated prior to prediction model development.
Prediction models were developed in a random sample of 70% of episodes from each site, and the remaining 30% of episodes were used for model validation. To predict best follow-up PHQ-9 score, we used linear regression with LASSO (least absolute shrinkage and selection operator) for variable selection (Hastie et al., 2009). LASSO is a regression penalization method that selects stronger predictors of an outcome while shrinking the association with weaker predictors to zero. To avoid over-fitting, 10-fold cross validation was used to identify the optimal degree of penalization as measured by minimizing the Mean-Squared Error (MSE) between predictions and observations. After using LASSO for variable selection, a linear regression model with chosen predictors was fit in the training dataset. Estimated coefficients were then applied to predictors in the validation set to calculate predictions. Predicted follow-up PHQ-9 scores in the validation set were compared to observed scores to evaluate model performance. Results are reported as correlation between predictions and observed scores, MSE, and spread of residuals.
Prediction of binary treatment response followed a similar approach with logistic regression. LASSO was used for variable selection. The LASSO penalization factor was chosen to maximize area under the curve (AUC, equivalent to the c-statistic) (Hanley and McNeil, 1982). Logistic regression estimates of the likelihood of response given selected variables were obtained in the training set and applied to the validation set to generate predicted probabilities of response. Accurate discrimination of predictions was evaluated with AUC estimates. Classification accuracy was assessed in strata defined by the distribution of predictions in the training set. Sensitivity, specificity, positive predictive value, and negative predictive value were quantified for episodes in the validation set with predicted probabilities of success above the 99th, 95th, 90th, 75th, and 50th percentiles of the prediction distribution in the training set to measure accurate identification of episodes likely to show treatment response. Classification accuracy for episodes unlikely to show treatment response was also examined. Calibration curves were constructed to compare predictions to observed rates of success.
Prediction models for both outcomes were also estimated using random forests (Breiman, 2001). This method uses a data-driven approach to explore and include important interactions between predictors, rather than specifying interactions a priori. Random forest is ideal for identifying risk modification by subgroups if, for example, predictors of treatment outcome varied for episodes with and without pharmacological treatment. 10-fold cross validation was used to limit tree depth based on MSE for continuous outcomes and AUC for binary outcomes. Random forest models with 200 trees were fit for each outcome in the training set and applied to the validation set to generate new predictions. Predictions were compared to observed outcomes using the same performance measures described above.
Extensive sensitivity analyses were conducted to identify possible variability in predictive performance due to model specification. Site stratification was considered in LASSO variable selection for both outcomes by including all interactions between site and other predictors as candidate variables. In random forest estimation, site was included as a predictor. Additional sensitivity analyses repeated prediction model development for different specifications of the model outcome: using final (rather than best) observed follow-up PHQ-9 for the continuous outcome and alternate binary definitions of treatment outcome (remission, effect size ≥ 0.8, and severity-adjusted effect size ≥ 0.8) (Seidel et al., 2014). Specification of predictors was also varied; rather than binary indicators, counts of all diagnosis, medication, and encounter codes were used for model estimation.
Our analysis focused on evaluating the accuracy of prediction models, rather than identifying the predictors of depression treatment outcomes. To better understand model performance, we examined predictors selected by the LASSO models and variable importance measures from random forest (Breiman et al., 2018a). We did not perform inference on the relationship between predictors and treatment outcomes. The coefficient penalization performed by LASSO does not accurately estimate standard errors, and machine learning approaches like random forest do not produce interpretable coefficient estimates, such as slope or odds ratio estimates.
Analyses were completed in the R statistical package, version 3.5.1 using the glmnet package for LASSO and randomForest package for random forests (Breiman et al., 2018b; Friedman et al., 2010; R Core Team, 2019).
3. Results
We identified 5,554 new psychotherapy episodes during the study period (Table 1). Episodes had a mean (standard deviation, sd) baseline PHQ-9 score of 16.7 (4.5). People with episodes in the sample were primarily female (68%), White (76%), non-Hispanic (89%), and had diagnoses of anxiety (54%) and depression (65%) prior to the baseline visit. Approximately half of the patients had current prescriptions for antidepressant medication at episode onset (48%). The mean (sd) best follow-up score for episodes was 9.6 (5.9) and 2,533 episodes (46%) showed successful treatment response (50% or greater reduction in PHQ-9 from baseline). The median (interquartile range) number of follow-up PHQ-9 observations was 2 (1, 5) (Table S2). Characteristics of episodes randomly assigned to the training set were similar to those in the validation set.
Table 1.
Characteristics of psychotherapy episodes
| Characteristic | Training (n = 3,888) | Validation (n = 1,666) |
|---|---|---|
| Mean (SDa) | Mean (SD) | |
|
| ||
| Baseline PHQ-9 b | 16.70 (4.49) | 16.81 (4.52) |
| Best follow-up PHQ-9 score | 9.52 (5.93) | 9.66 (5.94) |
| No. (%) | No. (%) | |
| Treatment response c | 1,787 (46.0) | 746 (44.8) |
| Kaiser Permanente Washington | 2,089 (53.7) | 906 (54.4) |
| Age | ||
| 13–17 | 200 (5.1) | 90 (5.4) |
| 18–29 | 1,039 (26.7) | 433 (26.0) |
| 30–44 | 1,070 (27.5) | 447 (26.8) |
| 45–64 | 1,156 (29.7) | 500 (30.0) |
| 65+ | 423 (10.9) | 196 (11.8) |
| Male gender | 1,263 (32.5) | 536 (32.2) |
| Race | ||
| White | 2,959 (76.1) | 1,278 (76.7) |
| African American or Black | 185 (4.8) | 86 (5.2) |
| Asian | 142 (3.7) | 57 (3.4) |
| American Indian or Alaskan Native | 79 (2.0) | 24 (1.4) |
| Native Hawaiian or Pacific Islander | 41 (1.1) | 16 (1.0) |
| Other race | 162 (4.2) | 60 (3.6) |
| Race unspecified | 320 (8.2) | 145 (8.7) |
| Hispanic ethnicity | 423 (10.9) | 201 (12.1) |
| Insurance coverage | ||
| Commercial | 2,770 (71.2) | 1,166 (70.0) |
| Medicaid | 245 (6.3) | 130 (7.8) |
| Medicare | 549 (14.1) | 249 (14.9) |
| State-subsidized | 83 (2.1) | 28 (1.7) |
| Other insurance type | 1,147 (29.5) | 491 (29.5) |
| High deductible | 176 (4.5) | 80 (4.8) |
| Insurance information missing | 99 (2.5) | 46 (2.8) |
| Current medication use d | ||
| Antidepressants | 1,877 (48.3) | 802 (48.1) |
| Benzodiazepines, other hypnotics | 511 (13.1) | 233 (14.0) |
| Antipsychotics | 110 (2.8) | 57 (3.4) |
| Mood stabilizers, anticonvulsants | 310 (8.0) | 144 (8.6) |
| Other psychotropic medications | 345 (8.9) | 160 (9.6) |
| History of mental health (MH) diagnoses or services e | ||
| Alcohol use disorder | 228 (5.9) | 93 (5.6) |
| Substance use disorder | 276 (7.1) | 108 (6.5) |
| Depression | 2,634 (67.7) | 1,125 (67.5) |
| Anxiety | 2,098 (54.0) | 914 (54.9) |
| Bipolar disorder | 99 (2.5) | 42 (2.5) |
| Schizophrenia, other psychotic disorder | 70 (1.8) | 29 (1.7) |
| Self-harm | 51 (1.3) | 18 (1.1) |
| Emergency department, MH diagnosis | 488 (12.6) | 205 (12.3) |
| Inpatient hospitalization, MH diagnosis | 379 (9.7) | 162 (9.7) |
SD: standard deviation
PHQ-9: 9-item Patient Health Questionnaire
Treatment response is defined at 50% or greater improvement in score on the PHQ-9
Current medication use defined by medication fills in the 90 days preceding the baseline visit
Clinical history includes diagnoses and encounters in the 5 years preceding the baseline visit.
Models predicting best follow-up PHQ-9 score showed poor performance. Predictions from both models were weakly correlated with observed PHQ-9 scores (r = 0.35 for linear regression, r = 0.37 for random forest). Predicted scores also had a large mean squared error (MSE = 31 for linear regression, MSE = 30 for random forest) and wide distribution of residuals compared to observed scores (Table 2). Scatterplots of the association between predictions and observations showed a nearly flat linear relationship, rather than the strong positive association expected of accurate predictions (Fig. 1). Predicted values also fell within a narrow range (6–15) compared to the wider range of observed scores (0–27), indicating little variability across predictions for episodes.
Table 2.
Agreement between predicted and observed best follow-up PHQ-9 scores
| Prediction model | Correlation | MSE | Distribution of residuals |
|---|---|---|---|
| Mean (95% CIa) | Mean (95% CI) | Mean (95% CI) | |
|
| |||
| Linear regression with LASSO | 0.35 (0.29, 0.38) | 31.1 (29.3, 32.8) | −0.11 (−11.50, 9.90) |
| Random forest | 0.37 (0.33, 0.41) | 30.4 (28.8, 32.0) | −0.08 (−11.26, 9.89) |
CI: Confidence interval
Fig. 1.
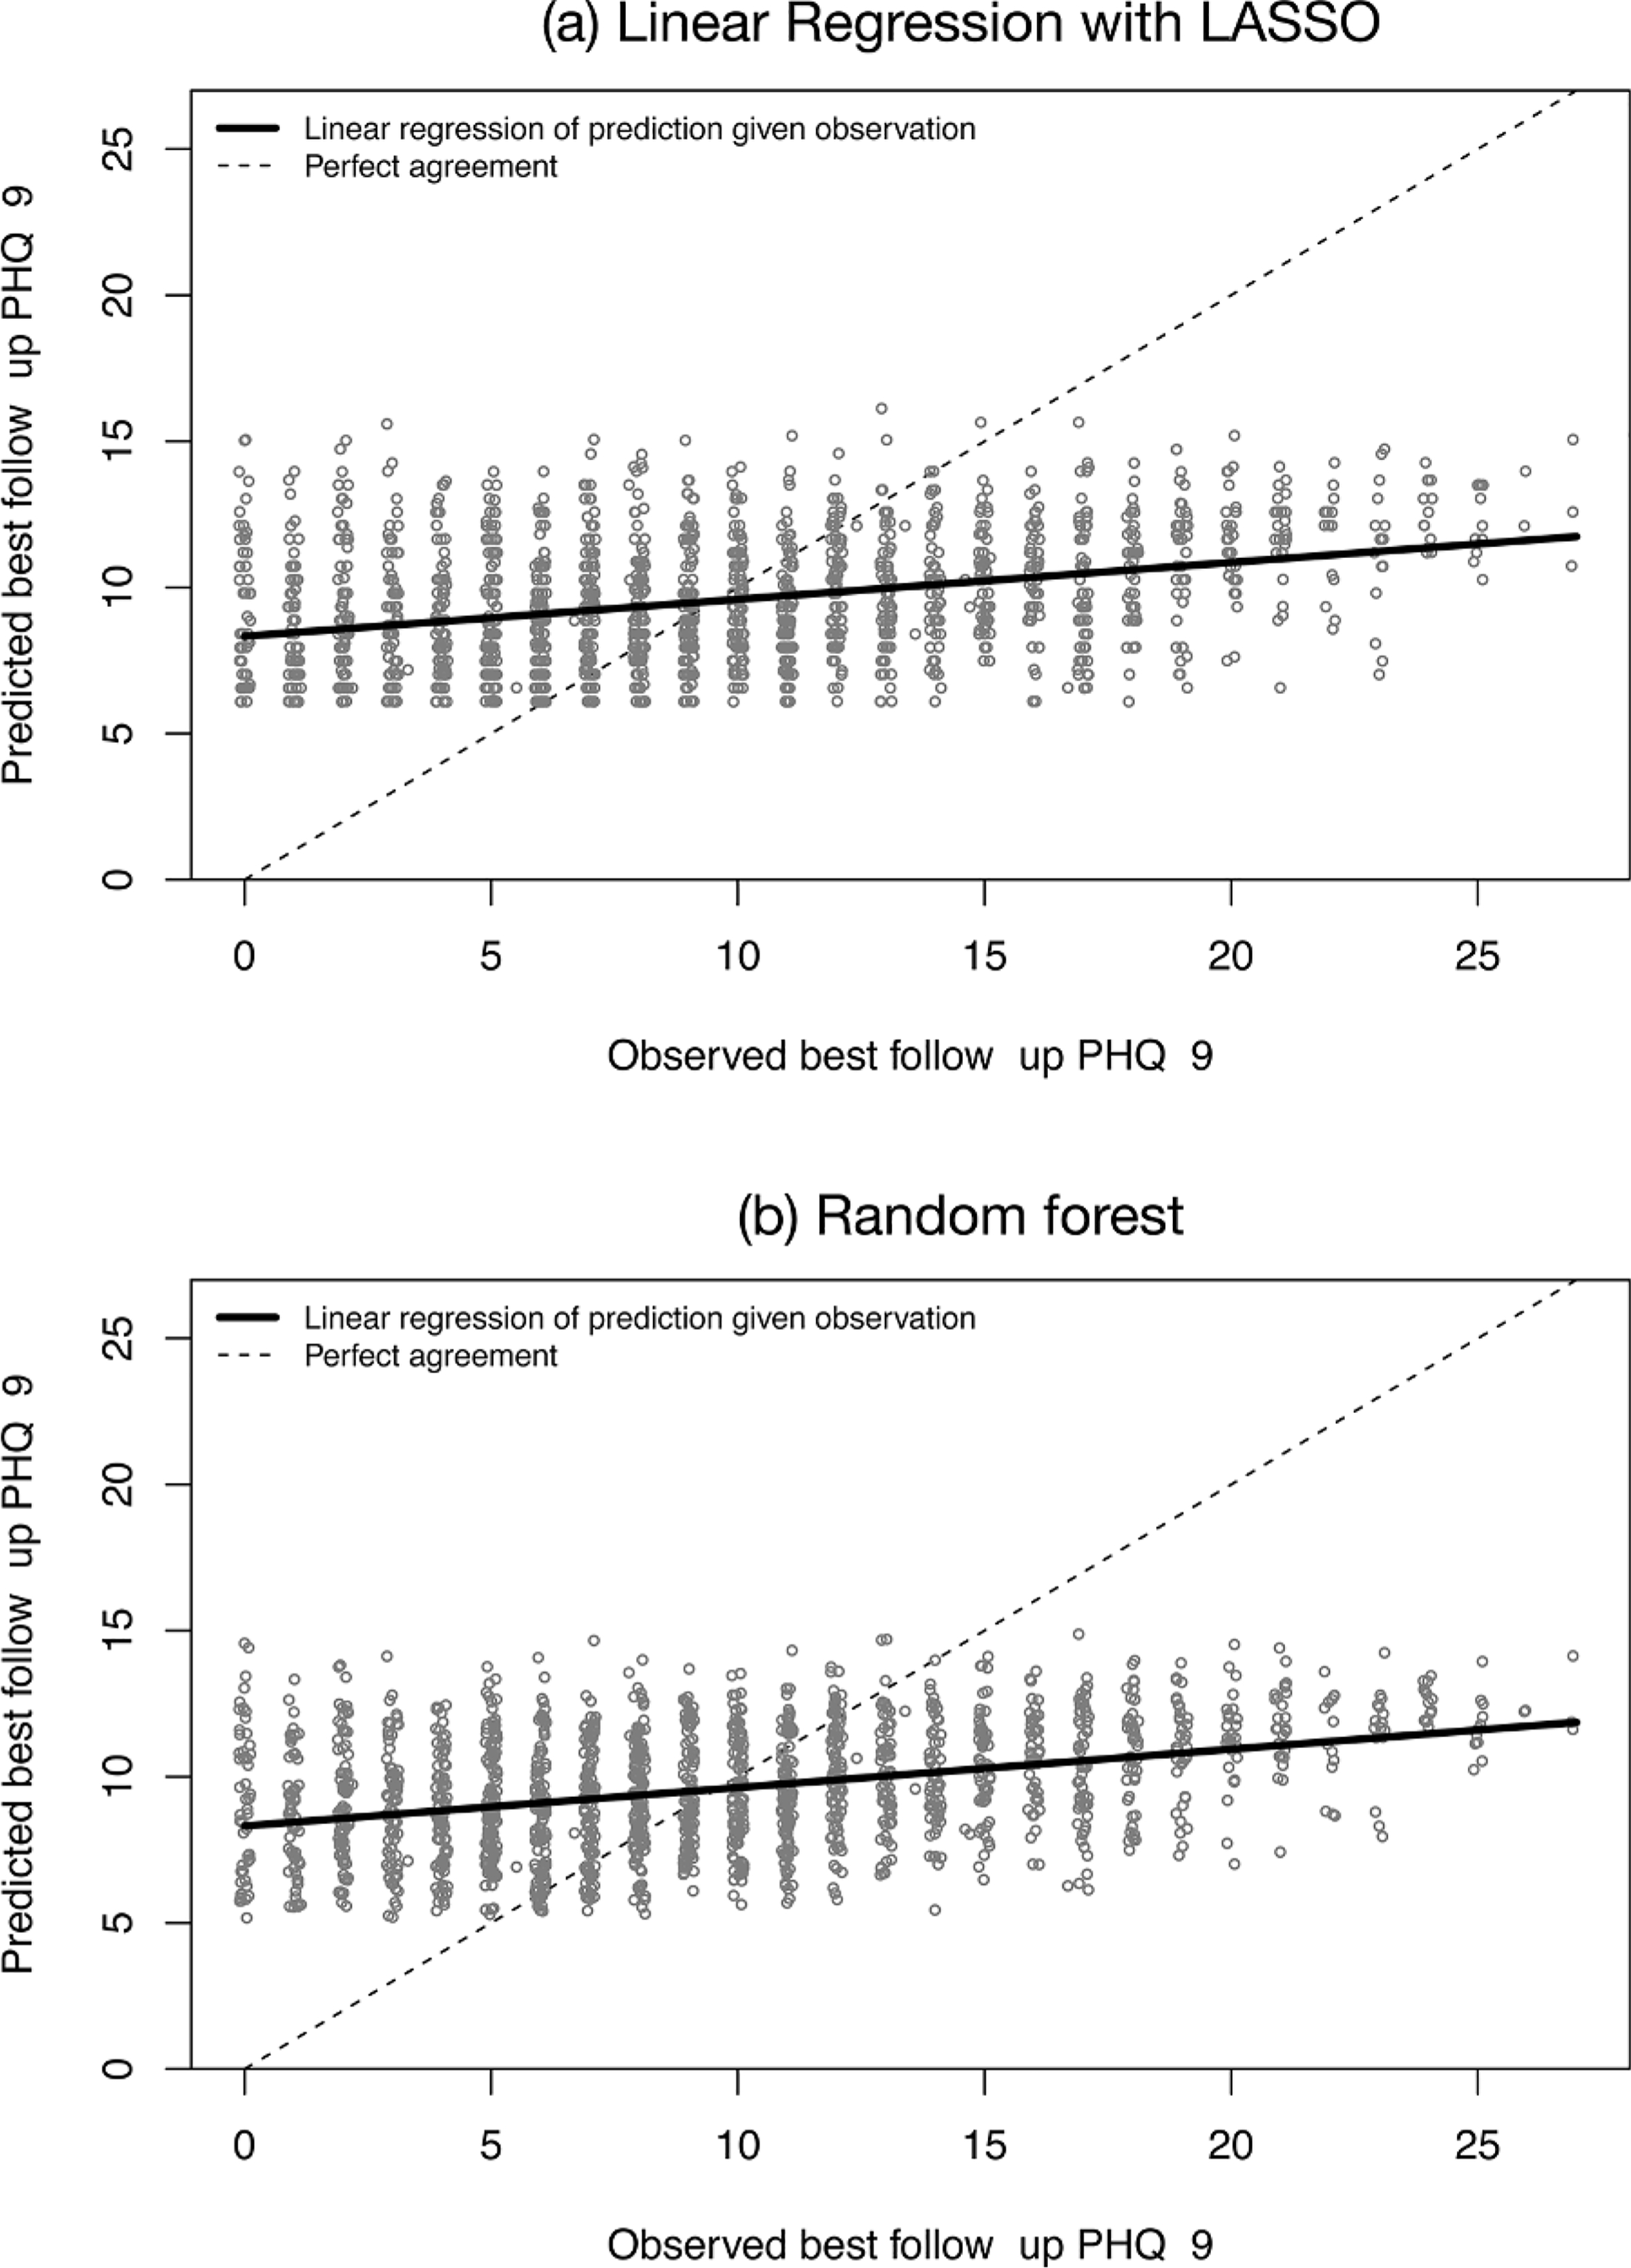
Scatter plots of predicted vs. observed best follow-up PHQ-9 scores for (a) logistic regression with LASSO variable selection and (b) random forest prediction models. Each plotting circle represents an episode of psychotherapy for depression. Solid lines show the linear relationship between predictions and observations, and dotted lines show perfect agreement.
Prediction models for treatment response showed poor discrimination. The AUCs were 0.57 (0.54, 0.60) for predictions with logistic regression and 0.61 (0.58, 0.64) for predictions with random forest. Classification accuracy of prediction models to identify episodes likely to show treatment response was also poor (Table 3). For example, in the logistic regression model, sensitivity of predictions above the 90th percentile showed a sensitivity of only 14%, that is, episodes estimated to be in the top 10% for likely treatment response only comprised 14% of all episodes with response. The positive predictive value of higher predictions was also modest as predictions in the top 10% of the logistic regression and random forest models indicated only a 54% and 58% chance of response, respectively. By comparison, the rate of response in the entire validation set was 45%. Classification accuracy for identifying episodes unlikely to show treatment response (validation set episodes with predicted probability of success below the 1st, 5th, 10th, 25th, and 50th percentiles of predictions in the training set) was similarly poor (online supplement).
Table 3.
Classification accuracy for predicting successful treatment response
| Risk score percentile cut-off |
Logistic regression with LASSO | PPVa (%) | NPVb (%) | Random forest Sensitivity (%) | Specificity (%) | PPV (%) | NPV (%) | |
|---|---|---|---|---|---|---|---|---|
| Sensitivity (%) | Specificity (%) | |||||||
|
| ||||||||
| >= 99%c | 1.9 | 99 | 58 | 55 | 0.1 | 100 | 25 | 55 |
| >= 95% | 7.0 | 95 | 51 | 56 | 1.3 | 99 | 50 | 55 |
| >= 90% | 14 | 90 | 54 | 56 | 2.9 | 98 | 58 | 56 |
| >= 75% | 31 | 77 | 53 | 58 | 8.0 | 96 | 61 | 56 |
| >= 50% | 56 | 55 | 50 | 61 | 68 | 42 | 49 | 62 |
PPV: Positive predictive value. By comparison, treatment response was observed in 45% of episodes in the validation set.
NPV: Negative predictive value. By comparison, treatment response was not observed in 55% of episodes in the validation set.
Cut-points defined in the training set based on distribution of predictions. Sensitivity, specificity, PPV, and NPV are measured for validation set episodes at or above these cut-points.
Calibration plots for both models show poor accuracy of predicting treatment response (Fig. 2). Observed rates of response did not vary considerably across deciles of predicted risk, indicating that model predictions are not informative of likely outcomes. The range of predictions was also particularly compact for the logistic regression with LASSO (Fig. 2a).
Fig. 2.

Calibration plots for predicted vs. observed rates of treatment response. Episodes were ordered by predicted probability of response and divided into deciles. Each plotting circle shows the average prediction in that decile (position on x-axis) and the observed proportion of episodes with response (position on the y-axis). Vertical lines represent 95% confidence intervals for the proportion in each decile with response.
Prediction models for all sensitivity analyses—site stratification, alternate outcome definitions, and alternate predictor specification—showed similarly poor performance (see online supplement, Tables S3–S9) indicating that study conclusions are robust to outcome, predictor, and model specification.
The LASSO variable selection approach identified only a small subset of the predictors for predicting follow-up PHQ-9 score (3 predictors) and treatment response (15 predictors) (Table 4). The estimated associations between predictors and treatment outcomes match what would be expected; for e.g., higher baseline PHQ-9 scores are associated with higher follow-up scores, and prior visits with diagnoses for depression and anxiety are associated with a lower probability of treatment response. Variable importance measures indicate that similar predictors were most influential in random forest models (Table S10).
Table 4.
Predictors selected by LASSO for linear and logistic regression models
| Predictors of best follow-up PHQ-9 | Slopea |
|---|---|
|
| |
| Baseline PHQ-9, 5-point increase | 2.32 |
| Anxiety diagnosis, 181–365 daysb | 1.09 |
| Medication management encounter, 366–1,825 days | 1.06 |
| Predictors of treatment response | Odds ratio |
| Age 33–39 | 1.36 |
| No Medicaid insurance | 1.26 |
| Age at episode onset, 1-year increase | 1.01 |
| Depression diagnosis, 181–365 days | 0.93 |
| Medication management visit, 366–1,825 days | 0.87 |
| Anxiety diagnosis, 181–365 days | 0.87 |
| Anticonvulsant prescription, 181–365 days | 0.86 |
| Primary care visit with mental health diagnosis, 366–1,825 days | 0.86 |
| Medication management visit, 181–365 days | 0.85 |
| Anticonvulsant prescription, 1–90 days | 0.82 |
| Substance use disorder diagnosis, 366–1,825 days | 0.78 |
| Unknown commercial insurance status | 0.77 |
| Antianxiety prescription, 181–365 days | 0.75 |
| Depression diagnosis, 91–180 days | 0.74 |
| Antipsychotic prescription, 91–180 days | 0.49 |
Points estimates only. LASSO does not estimate standard errors for coefficient estimates.
Days prior to episode onset
4. Discussion
The objective of this study was to evaluate whether we could accurately predict follow-up symptom severity and probability of treatment success for new psychotherapy episodes. We included EHR data on previous diagnoses, medications, and mental health encounters as potential predictors alongside demographics and baseline symptom severity. We used regression modeling methods as well as a modern machine learning algorithm (random forest). Despite leveraging a rich set of predictors and advanced analytic techniques, we were unable to develop accurate prediction models for depression symptoms or response. Extensive sensitivity analyses showed poor performance persisted when alternate predictor, outcome, and model specifications were used.
Our findings indicate that EHR-based prediction models for depression outcomes are likely inappropriate for quality monitoring and evaluating treatment effectiveness. Both uses of prediction models rely solely on baseline data as this information is not yet influenced by the provider or treatment being initiated. Our data and study design cannot distinguish improvement in depression specifically due to treatment from naturally occurring improvement. We can only say that improvement from any source is not predictable from records information available at a first visit.
The results of this study also suggest that health care administrators should proceed cautiously when considering clinical implementation of models to predict treatment success based on baseline characteristics. While the promised benefits of health care data analytics are alluring, some prediction models may not provide the expected gains. In our study, we were unable to predict depression treatment outcomes using detailed EHR data that exceeds the information health care providers would share with a third-party vendor. It follows that real-world performance of a proprietary model for this question would likely be worse. Our study also found that a data-driven machine learning approach did not perform better than standard regression techniques. Other machine prediction methods could be considered, but performance of alternate approaches is unlikely to show sufficient gains to reverse our conclusions (Christodoulou et al., 2019); more sophisticated modeling techniques will not improve performance if the available data are not predictive.
We strongly recommend that transparent and peer-reviewed research be conducted to evaluate performance of any prediction model intended for clinical use. Empirical examination is made more challenging as the business incentives of private companies developing and marketing clinical prediction models undermine transparent assessment of performance and bias. Many health care administrators don’t have the tools to interrogate vendor claims, particularly for newer, less interpretable “black box” methods, and private companies are unlikely to disclose the data and algorithms underlying models. A recent study by Obermeyer et al. (2019) demonstrated racial bias in the implementation of a widely used commercial algorithm to identify patients with complex health needs (Obermeyer et al., 2019). In the absence of critical review of model performance, use of inaccurate or even harmful models may continue unnoticed.
Poor performance of models predicting successful outcome of depression psychotherapy stands in contrast to clearly superior performance of models predicting suicidal behavior among people receiving mental health treatment. Models predicting suicidal behavior developed in these same settings using the same data sources, a similar set of potential predictors, and similar statistical methods yielded discrimination (AUC) of approximately 85% compared to 57–61% discrimination we observed for prediction of psychotherapy outcome (Simon et al., 2018). This unexpected contrast underscores our point that both enthusiasm and skepticism regarding use of prediction models in mental health care should be addressed with data regarding a specific prediction task and a specific set of potential predictors.
Recently published prediction models for depression outcomes in research settings with more detailed notes than EHR data show modest improvements in performance over our study (Chekroud et al., 2016; Dinga et al., 2018; Kautzky et al., 2017; Nigatu et al., 2016). While there is reasonable apprehension about the adequacy of EHR data for some research questions, concerns about data quality are unlikely to explain our findings considering the success of suicide prediction models using similar data (Goldstein et al., 2017). In this study, predictive performance was likely poor because we focused on new episodes of psychotherapy treatment, identified by an absence of mental health encounters or procedures in the prior year. The availability of relevant clinical history to inform a prediction model was limited accordingly.
Selection of a small number of predictors by LASSO for linear and logistic regression models underscored the weak predictive value of available information at baseline. Clinical relevance of selected predictors or variable importance measures from random forest models is limited given the overall poor performance of the prediction models.
Difficulty in predicting psychotherapy outcomes at treatment onset does not preclude use of predictive analytics to guide measurement-based care. In fact, our findings indicate that providers should consider measurement-based care approaches that include outcome measurement beyond baseline by incorporating information gained throughout the duration of care. Examples include patient-trajectory modeling, sequential decision-making, and recovery curves (Chekroud et al., 2016; Finch et al., 2001; Lewis et al., 2019).
More structured collection in the EHR of other likely predictors of treatment outcomes—including more detailed patient-reported outcomes, quality of therapeutic alliance, patient affect and presentation of symptoms and social determinants of health—may improve prediction capabilities. Following a strengths-based approach, additional predictors could also focus on a patient’s resilience rather than only capturing risk factors (Aspinwall and Staudinger, 2003; Padesky and Mooney, 2012; Saleeby, 1993). Improvements in predictive performance gained by increasing structured EHR data collection must be weighed against documentation burden on providers. Natural language processing may offer another tool for garnering information from provider notes and other unstructured data.
The particular characteristics of our study setting present both strengths and limitations. Both study sites use nearly random scheduling procedures such that provider selection is not associated with patient characteristics or likely outcomes and provider-level effects on treatment outcomes are minimal. By focusing our study on a real-world setting, the prediction models rely on data from health system members who attended both initial and follow-up psychotherapy for depression and may not represent the broader population of people with depression symptoms, particularly those who do not seek treatment or those who do not continue treatment after an initial visit. Predicting patient engagement in care, which may involve different factors than symptom improvement, is outside the scope of this research.
Other aspects of care delivery at Kaiser Permanente regions in Colorado and Washington will differ from other care settings. The episodes in this sample had low treatment intensity, likely influenced by each region’s depression care protocols and limited availability of more frequent visits. While measuring PHQ-9 at multiple time points may better capture treatment outcome, many episodes only had one PHQ-9 score recorded in the follow-up period. The impact of differential follow-up on treatment outcomes and prediction model performance is uncertain. Prior research suggests that treatment drop-out may indicate successful and satisfying treatment outcomes, but we cannot ascertain this in our study (Simon et al., 2012; Simon and Ludman, 2010). Prediction model performance may vary for settings with a greater number of visits or different EHR documentation practices. However, the patient population and care delivery measured here using EHR data is likely more typical of other health care settings than those of data collected as part of a randomized trial.
5. Conclusion
Our study was unable to develop accurate prediction models for the outcomes of new psychotherapy episodes for depression despite using detailed EHR data and advanced analytic techniques. We conclude that such a model is unsuitable for informing quality measurement and comparative effectiveness research (purposes that rely on baseline information to make predictions) and recommend that prediction models for measurement-based care incorporate information gathered after treatment initiation to guide care. Health care providers and administrators should exercise caution amidst growing excitement about the potential of predictive analytics with EHR data to transform mental and behavioral health care. The accuracy and impact of prediction models should be carefully and transparently examined prior to implementation.
Supplementary Material
Role of funding source
Sponsors had no involvement in the study design; the collection, analysis, and interpretation of data; the writing of the report; and the decision to submit the article for publication. The content is solely the responsibility of the authors and does not necessarily represent the official views of the Agency for Healthcare Research and Quality.
Declaration of Competing Interest
Dr. Simon has received research grant support from Novartis, though that support is unrelated to the research submitted here. Drs. Coley, Beck, and Boggs report no financial relationships with commercial interests.
Footnotes
Supplementary materials
Supplementary material associated with this article can be found, in the online version, at doi:10.1016/j.jadr.2021.100198.
References
- Aspinwall LG, Staudinger UM, 2003. A Psychology of Human Strengths: Fundamental Questions and Future Directions for a Positive Psychology. American Psychological Association. [Google Scholar]
- Bates DW, Saria S, Ohno-Machado L, Shah A, Escobar G, 2014. Big data in health care: using analytics to identify and manage high-risk and high-cost patients. Health Affairs 33, 1123–1131. [DOI] [PubMed] [Google Scholar]
- Breiman L, 2001. Statistical modeling: the two cultures. Stat Sci 16, 199–231. [Google Scholar]
- Breiman L, Cutler A, Liaw A, Weiner M, 2018a. Cutler’s random forests for classification and regression. [Google Scholar]
- Breiman L, Cutler A, Liaw A, Wiener M, 2018b. Breiman and Cutler’s random forests for classification and regression. [Google Scholar]
- Char DS, Shah NH, Magnus D, 2018. Implementing machine learning in health care—addressing ethical challenges. NEJM 378, 981. [DOI] [PMC free article] [PubMed] [Google Scholar]
- Charles D, Gabriel M, Searcy T, 2015. Adoption of electronic health record systems among U.S. non-federal acute care hospitals: 2008–2014. ONC Data Brief 23, 1–10. [Google Scholar]
- Chekroud AM, Zotti RJ, Shehzad Z, Gueorguieva R, Johnson MK, Trivedi MH, Cannon TD, Krystal JH, Corlett PR, 2016. Cross-trial prediction of treatment outcome in depression: a machine learning approach. Lancet Psychiat 3, 243–250. [DOI] [PubMed] [Google Scholar]
- Christodoulou E, Ma J, Collins GS, Steyerberg E, Verbakel JY, Calster BV, 2019. A systematic review shows no perfomance benefit of machine learning over logistic regression for clinical prediction models. J Clin Epidemiol 110, 12–22. [DOI] [PubMed] [Google Scholar]
- Danielsen AA, Fenger MH, Østergaard SD, Nielbo KL, Mors O, 2019. Predicting mechanical restraint of psychiatric inpatients by applying machine learning on electronic health data. Acta Psychiatr. Scand. [DOI] [PubMed] [Google Scholar]
- Dinga R, Marquand AF, Veltman DJ, Beekman AT, Schoevers RA, van Hemert AM, Penninx BW, Schmaal L, 2018. Predicting the naturalistic course of depression from a wide range of clinical, psychological, and biological data: a machine learning approach. Transl. Psychiatr. 8, 241. [DOI] [PMC free article] [PubMed] [Google Scholar]
- Edgcomb J, Shaddox T, Hellemann G, Brooks J, 2019. High-risk phenotypes of early psychiatric readmission in Bipolar Disorder with comorbid medical illness. Psychosomatics. [DOI] [PMC free article] [PubMed] [Google Scholar]
- Finch AE, Lambert MJ, Schaalje BG, 2001. Psychotherapy quality control: the statistical generation of expected recovery curves for integration into an early warning system. Clin. Psychol. Psychot. 8, 231–242. [Google Scholar]
- Fortney JC, Unutzer J, Wrenn G, Pyne JM, Smith GR, Schoenbaum M, Harbin HT, 2017. A tipping point for measurement-based care. Psychiatr. Serv. 68, 179–188. [DOI] [PubMed] [Google Scholar]
- Friedman J, Hastie T, Tibshirani R, 2010. Regularization paths for generalized linear models via coordinate descent. J Stat Softw 33, 1. [PMC free article] [PubMed] [Google Scholar]
- Goldstein BA, Navar AM, Pencina MJ, Ioannidis J, 2017. Opportunities and challenges in developing risk prediction models with electronic health records data: a systematic review. J. Am. Med. Inform. Assn. 24, 198–208. [DOI] [PMC free article] [PubMed] [Google Scholar]
- Hanley JA, McNeil BJ, 1982. The meaning and use of the area under a Receiver Operating Characteristic (ROC) curve. Radiology 143, 29–36. [DOI] [PubMed] [Google Scholar]
- Hastie T, Tibshirani R, Friedman J, 2009. The Elements of Statistical Learning: Data Mining, Inference, and Prediction, 2nd ed. Spinger-Verlga New York, New York. [Google Scholar]
- Kautzky A, Baldinger-Melich P, Kranz GS, Vanicek T, Souery D, Montgomery S, Mendlewicz J, Zohar J, Serretti A, Lanzenberger R, 2017. A new prediction model for evaluating treatment-resistant depression. J Clin Psychiatry 78, 215–222. [DOI] [PubMed] [Google Scholar]
- Kroenke K, Spitzer RL, Williams JB, 2001. The PHQ-9: validity of a brief depression severity measure. J. Gen. Intern. Med. 16, 606–613. [DOI] [PMC free article] [PubMed] [Google Scholar]
- Lewis CC, Boyd M, Puspitasari A, Navarro E, Howard J, Kassab H, Hoffman M, Scott K, Lyon A, Douglas S, 2019. Implementing measurement-based care in behavioral health: a review. JAMA psychiatry 76, 324–335. [DOI] [PMC free article] [PubMed] [Google Scholar]
- Matarazzo BB, Brenner LA, Reger MA, 2019. Positive predictive values and potential success of suicide prediction models. JAMA psychiatry. [DOI] [PubMed] [Google Scholar]
- McCarthy JF, Bossarte RM, Katz IR, Thompson C, Kemp J, Hannemann CM, Nielson C, Schoenbaum M, 2015. Predictive modeling and concentration of the risk of suicide: implications for preventive interventions in the US Department of Veterans Affairs. Am. J. Public Health 105, 1935–1942. [DOI] [PMC free article] [PubMed] [Google Scholar]
- Nigatu YT, Liu Y, Wang J, 2016. External validation of the international risk prediction algorithm for major depressive episode in the US general population: the PredictD-US study. BMC psychiatry 16, 256. [DOI] [PMC free article] [PubMed] [Google Scholar]
- Obermeyer Z, Emanuel EJ, 2016. Predicting the future—big data, machine learning, and clinical medicine. NEJM 375, 1216. [DOI] [PMC free article] [PubMed] [Google Scholar]
- Obermeyer Z, Powers B, Vogeli C, Mullainathan S, 2019. Dissecting racial bias in an algorithm used to manage the health of populations. Science 366, 447–453. [DOI] [PubMed] [Google Scholar]
- Padesky CA, Mooney KA, 2012. Strengths-based cognitive–behavioural therapy: A four-step model to build resilience. Clin Psychol Psychot 19, 283–290. [DOI] [PubMed] [Google Scholar]
- Parikh RB, Kakad M, Bates DW, 2016. Integrating predictive analytics into high-value care: the dawn of precision delivery. JAMA 315, 651–652. [DOI] [PubMed] [Google Scholar]
- Parikh RB, Schwartz JS, Navathe AS, 2017. Beyond genes and molecules- a precision delivery initiative for precision medicine. NEJM 376, 1609. [DOI] [PubMed] [Google Scholar]
- R Core Team, 2019. R: A Language and Environment for Statistical Computing. R Foundation for Statistical Computing, Vienna, Austria. [Google Scholar]
- Rajkomar A, Dean J, Kohane I, 2019. Machine learning in medicine. N Engl. J. Med. 380, 1347–1358. [DOI] [PubMed] [Google Scholar]
- Rajkomar A, Hardt M, Howell MD, Corrado G, Chin MH, 2018. Ensuring fairness in machine learning to advance health equity. Ann. Intern. Med. 169, 866–872. [DOI] [PMC free article] [PubMed] [Google Scholar]
- Ross TR, Ng D, Brown JS, Pardee R, Hornbrook MC, Hart G, Steiner JF, 2014. The HMO research network virtual data warehouse: a public data model to support collaboration. EGEMS (Washington, DC) 2, 1049. [DOI] [PMC free article] [PubMed] [Google Scholar]
- Saleeby D, 1993. The strengths perspective in social work practice. HeinOnline. [Google Scholar]
- Seidel JA, Miller SD, Chow DL, 2014. Effect size calculations for the clinician: methods and comparability. Psychother Res 24, 470–484. [DOI] [PubMed] [Google Scholar]
- Shah ND, Steyerberg EW, Kent DM, 2018. Big data and predictive analytics: recalibrating expectations. JAMA 320, 27–28. [DOI] [PubMed] [Google Scholar]
- Simon GE, Imel ZE, Ludman EJ, Steinfeld BJ, 2012. Is dropout after a first psychotherapy visit always a bad outcome? Psychiatr. Serv. 63, 705–707. [DOI] [PMC free article] [PubMed] [Google Scholar]
- Simon GE, Johnson E, Lawrence JM, Rossom RC, Ahmedani B, Lynch FL, Beck A, Waitzfelder B, Ziebell R, Penfold RB, Shortreed SM, 2018. Predicting suicide attempts and suicide deaths following outpatient visits using electronic health records. Am. J. Psychiatry 175, 951–960. [DOI] [PMC free article] [PubMed] [Google Scholar]
- Simon GE, Ludman EJ, 2010. Predictors of early dropout from psychotherapy for depression in community practice. Psychiatr Serv 61, 684–689. [DOI] [PubMed] [Google Scholar]
- Webb CA, Trivedi MH, Cohen ZD, Dillon DG, Fournier JC, Goer F, Fava M, McGrath PJ, Weissman M, Parsey R, 2019. Personalized prediction of antidepressant v. placebo response: evidence from the EMBARC study. Psychol Med 49, 1118–1127. [DOI] [PMC free article] [PubMed] [Google Scholar]
Associated Data
This section collects any data citations, data availability statements, or supplementary materials included in this article.