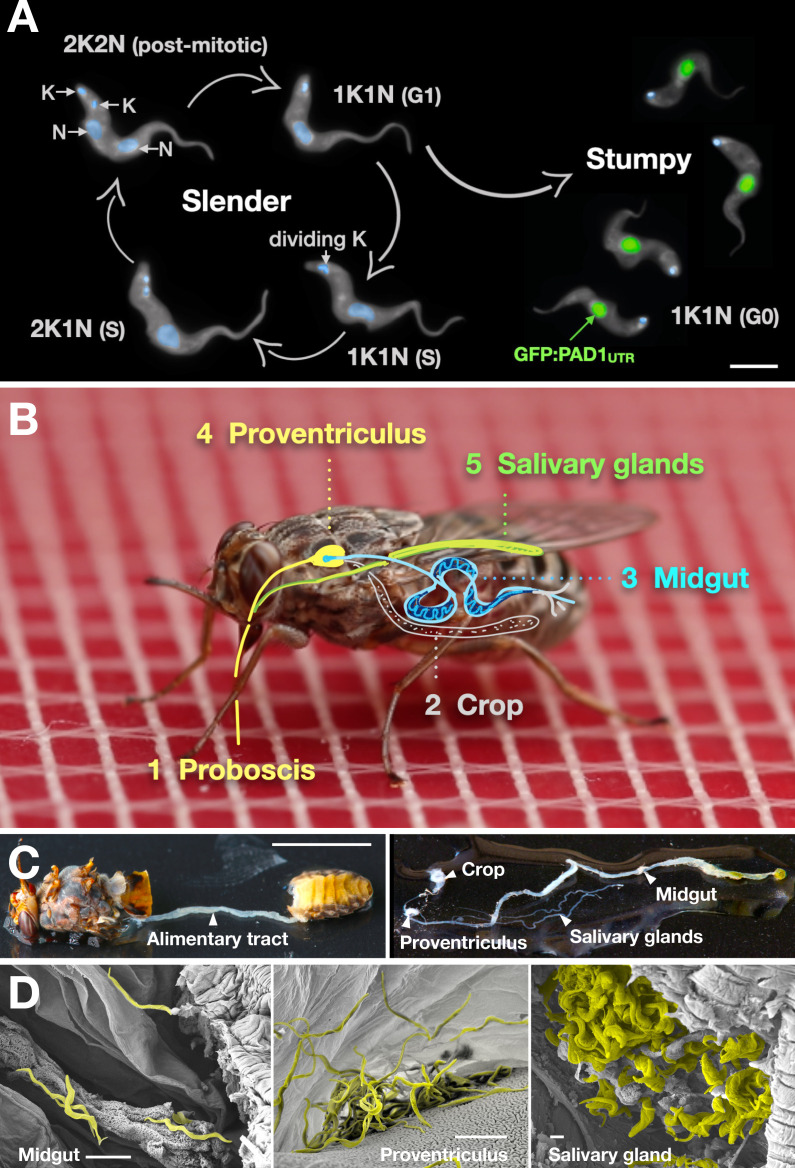
Figure 1. Slender trypanosomes can complete the entire life cycle in the tsetse fly vector.
(A) Cell cycle (G1/S/post-mitotic), morphology, and differentiation of bloodstream form (mammalian-infective stage) trypanosomes. Proliferation of slender trypanosomes is detectable by duplication and segregation of the mitochondrial genome (kinetoplast, K) and nuclear DNA (N) over time. Quorum sensing causes cell cycle arrest (G0) and expression of the stumpy marker PAD1. Images are false-coloured, maximum intensity projections of deconvolved 3D stacks. The green colour indicates the nuclear GFP:PAD1UTR fluorescence, the DAPI-stained kinetoplast and nucleus are shown in light blue, and the AMCA-sulfo-NHS-labelled parasite cell surface are shown in grey. Scale bar: 5 µm. (B) Trypanosome infections of tsetse flies were achieved via bloodmeal, which consists typically of 20 µl, through a silicon membrane. To complete infection in a tsetse fly after an infective blood-meal, trypanosomes first travel to the midgut, followed by the proventriculus, and finally must reach the salivary glands. (C) The first panel depicts a dissected tsetse fly for explantation of the alimentary tract. The second panel shows the explanted alimentary tract of the tsetse, with the different subcompartments labelled. Scale bar: 5 mm. (D) Scanning electron micrograph of a typical trypanosome infection of the tsetse midgut, proventriculus, and salivary glands. Parasites are false-coloured yellow. Scale bar: 1 µm.


