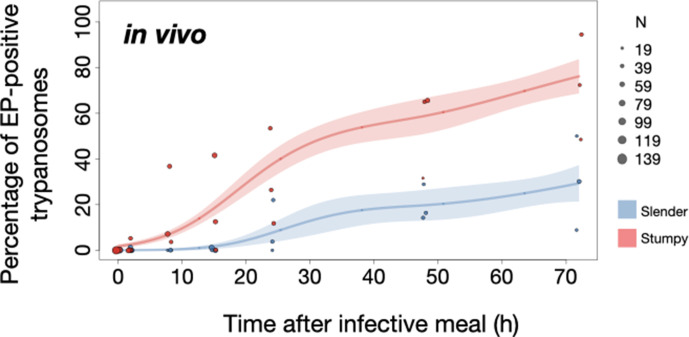
Figure 6. Slender trypanosomes show delayed expression of EP compared to stumpy trypanosomes, while directly differentiating to the procyclic life cycle stage in the tsetse fly.
Tsetse flies were infected with either slender (3.6% PAD1-positive) or stumpy (100% PAD1-positive) trypanosomes. 72 (slender) or 42 (stumpy) flies were dissected (equal sex ratios) at different timepoints after infection (for each time point, one hour was given to either slender or stumpy infected flies for dissection and cell analysis). Experiments were done at least three times. Living trypanosomes (>100 cells per time point) were microscopically analysed in explanted tsetse midguts and scored for the procyclic insect stage reporter EP1:YFP on the cell surface. Stumpy cells (n=1237) are shown in red and slender cells (n=1845) in blue. Points indicate the individual cell counts for either slender (blue) or stumpy (red). Point sizes correspond to the total number of cells counted per experiment. These data were fed into a point estimate model (see Materials and methods) and are shown as solid lines, indicating the predicted percentage of EP-positive cells, based on time vs. cell type. Shading above and below the lines indicates the associated 95% confidence bands. The difference between slender and stumpy cells over time was strongly significant (p<0.001).

