

Abstract
There are limited data on the nonprocurement of kidneys from solid organ donors. Analysis of Standard Transplant Analysis and Research files was undertaken on all deceased donors in the United States with at least 1 solid organ recovered. From 2000 to 2018, 21 731 deceased donor kidneys (averaging 1144 kidneys per year) were not procured. No kidneys were procured from 8% of liver donors, 3% of heart donors, and 3% of lung donors. Compared to donors with all kidneys procured, those with none procured were older and more likely obese, black, hypertensive, diabetic, hepatitis C positive, smokers, Public Health Service – Increased Risk designated, deceased after cardiac death, or deceased after cerebrovascular accident. Although these donors had lower quality kidneys (median Kidney Donor Risk Index (interquartile range) 1.9 (1.0) vs 1.2 (0.7)), there was substantial overlap in quality between nonprocured and procured kidneys. Nearly one third of nonprocurements were attributed to donor history. Donors with elevated terminal creatinine likely resulting from acute kidney injury (AKI) had higher odds of kidney nonprocurement. Nonprocurement odds varied widely across Organ Procurement and Transplantation Network regions, with a positive correlation between donor kidney nonprocurements and kidney discards at the donation service area level. These findings suggest current discard rates underestimate the underutilization of deceased donor kidneys and more research is needed to optimize safe procurement and utilization of kidneys from donors with AKI.
Keywords: clinical research/practice, donors and donation: deceased, health services and outcomes research, kidney transplantation/nephrology, organ acceptance, organ procurement, organ procurement and allocation, organ procurement organization, United Network for Organ Sharing (UNOS)
1 ∣. INTRODUCTION
Kidney transplantation is the treatment of choice for end-stage kidney disease (ESKD) and is associated with improved survival, quality of life, and long-term cost compared to dialysis.1,2 However, access to transplantation in the United States is limited by the shortage of available organs. Recent efforts to expand the organ donor pool have identified suboptimal deceased donor kidney utilization and concerns about the adequacy of procurement efforts.3
Although there remains debate over how to identify the true number of eligible deaths in order to determine the full extent of available organs in the United States, the number of solid organ donors—and in particular, the number of donors from whom a kidney was not procured—is known. Kidneys are the most commonly procured organs from deceased donors and tend to have less stringent criteria for acceptance than the heart or lungs.4 Organ procurement organizations (OPOs) attempt to be appropriately selective in organ procurement to optimize their efforts to obtain the largest number of organs that are going to be transplanted and avoid procuring organs that will subsequently be discarded. For example, organs with tumors and those with significant anatomical abnormalities that would preclude transplantation are usually not procured.5 However, it is surprising that in some donation service areas (DSAs), over 10% of deceased donors who have given other solid organs were not also kidney donors.6,7 There remains limited information on the extent of kidney nonprocurement in donors who have given at least 1 other solid organ for transplant, that is, a heart, lung, and/or liver, or the factors that contribute to this phenomenon.8 We attempt to measure the extent of kidney nonprocurement from deceased solid organ donors, identify factors associated with nonprocurement, and analyze variations in procurement practices across OPOs.
2 ∣. METHODS
2.1 ∣. Study design and participants
Using United Network for Organ Sharing (UNOS) Standard Transplant Analysis and Research (STAR) files based on the national Organ Procurement and Transportation Network (OPTN) database as of March 15, 2019, we conducted a retrospective cohort study on all deceased donors with at least 1 solid organ recovered between January 1, 2000 and December 31, 2018. Over the study period, we identified 152 702 deceased donors in the United States with 1 or more solid organs recovered, that is, kidney(s), liver, heart, lung(s), intestine, and pancreas (Figure S1). We then excluded donors where consent for kidney donation was not requested or obtained (n = 2359), donors whose kidneys were recovered for reasons other than transplant (eg, research) (n = 1022), procurements that were restricted by the medical examiner (n = 115), donors with ESKD reported by the OPO (n = 20), and donors with only a pancreas procured (n = 4) or only an intestine procured (n = 4). We also excluded donors with missing terminal serum creatinine values (n = 106), implausible terminal creatinine values (<0.1 or >40 mg/dL) (n = 11), and age <1 year or body weight <10 kg (n = 2349). Nonprocurement was defined as the failure by the procurement team to recover a kidney from the deceased donor, in contrast to kidney discard, in which the organ is recovered but not transplanted into a recipient.
Our final cohort of 146 712 deceased donors was categorized into 3 groups, based on the status of their kidney procurement: (1) no kidneys procured (n = 10 291); (2) single kidney procured (n = 1149); and (3) all kidneys procured (n = 135 252), which included cases where only 1 kidney was procured due to an absent partner kidney at the time of death (n = 345) (Figure S1).
The data that support the findings of this study are available via request to the OPTN.
2.2 ∣. Nonprocurement categories and organ quality
Reported reasons for kidney nonprocurement were mapped to 7 categories (Table S1): (1) poor organ quality and function, (2) anatomical abnormality, (3) donor history, (4) inability to locate a recipient, (5) logistical challenges, (6) procurement injury, and (7) other. When the code for “Other specify” was used, 2 authors reviewed the free-text field and mapped the field to 1 of the 7 categories. When moving from organ-level reasons to donor-level reasons (Tables 2 and 3), donors with different nonprocurement reasons listed for the left vs right kidney were assigned to an eighth category: (8) discordant.
TABLE 2.
Common reasons for kidney nonprocurement from donors by kidneys not procured (n = 11 440 deceased donors)
| Poor organ quality and function |
Donor history |
Inability to locate a recipient |
Anatomical abnormality |
Procurement injury |
Logistical challenges |
Other | Discordant reasons for L/R kidneys |
|
|---|---|---|---|---|---|---|---|---|
| n (row %) | 6125 (54) | 3349 (29) | 1432 (12) | 379 (3) | 56 (0.5) | 17 (0.2) | 69 (0.6) | 27 (0.24) |
| Nonprocurement type | ||||||||
| Bilateral nonprocurement2 | 54 | 30 | 13 | 1 | 0.2 | 0.2 | 0.4 | 0.3 |
| Unilateral nonprocurement3 | 46 | 20 | 4 | 24 | 3 | 4 | 2 | 4 |
| Organ quality | ||||||||
| Kidney Donor Risk Index | 1.8 (1.0) | 1.9 (1.1) | 1.9 (1.1) | 1.4 (0.8) | 1.4 (0.4) | 1.4 (1.2) | 1.5 (0.9) | 1.7 (1.0) |
| Bilateral nonprocurement | 1.8 (1.0) | 1.9 (1.1) | 1.9 (1.1) | 1.6 (0.8) | 1.4 (0.2) | 1.4 (1.2) | 1.8 (1.2) | 1.7 (1.0) |
| Unilateral nonprocurement | 1.1 (0.6) | 1.4 (0.7) | 1.4 (0.4) | 1.3 (0.7) | 1.3 (0.4) | 4 | 1.2 (0.6) | 4 |
| Terminal creatinine (mg/dL) | 3.4 (3.5) | 2.2 (3.8) | 1.5 (1.8) | 1 (0.7) | 1.1 (0.7) | 0.9 (3.2) | 1.4 (1.1) | 1.3 (1.7) |
| Bilateral nonprocurement | 3.6 (3.4) | 2.4 (4.0) | 1.6 (1.8) | 0.9 (0.9) | 1.0 (0.8) | 0.9 (3.2) | 1.6 (1.8) | 1.3 (1.7) |
| Unilateral nonprocurement | 1.1 (0.8) | 1.2 (0.8) | 0.9 (0.7) | 1.0 (0.7) | 1.1 (0.7) | **** | 1.2 (0.8) | **** |
Note: Data displayed as row % or median (interquartile range). P < .001 for all comparisons between groups.1
Pearson chi-squared tests and the nonparametric equality of median tests were performed for categorical and continuous variables, respectively.
Bilateral nonprocurement – 0 kidneys procured from the deceased donor.
Unilateral nonprocurement – 1 kidney procured from donors with 2 kidneys.
No observations.
TABLE 3.
Characteristics of donors with 1 or more kidneys not procured stratified by the reason for kidney nonprocurement (n = 11 440)
| Poor organ quality and function |
Donor history |
Inability to locate a recipient |
Anatomical abnormality |
Procurement injury |
Logistical challenges |
Other | Discordant reasons for L/R kidneys |
|
|---|---|---|---|---|---|---|---|---|
| n (row %) | 6125 (54) | 3349 (29) | 1432 (12) | 379 (3) | 56 (0.5) | 17 (0.2) | 69 (0.6) | 27 (0.24) |
| Donor characteristics1 | ||||||||
| Age | 49.4 ± 17.7 | 50.9 ± 17.0 | 50.3 ± 16.4 | 40.7 ± 21.0 | 40.2 ± 19.3 | 43.8 ± 25.4 | 40.9 ± 23.6 | 48.1 ± 18.9 |
| Female | 38 | 44 | 42 | 44 | 36 | 47 | 42 | 56 |
| BMI | 28.8 ± 7.3 | 27.7 ± 6.9 | 27.6 ± 6.3 | 26.1 ± 6.2 | 28.5 ± 8.7 | 25.0 ± 8.2 | 24.3 ± 5.0 | 26.7 ± 5.3 |
| Black/African American | 25 | 25 | 19 | 15 | 4 | 18 | 22 | 19 |
| History of hypertension | 58 | 68 | 52 | 38 | 29 | 35 | 36 | 81 |
| History of diabetes | 27 | 35 | 21 | 9 | 4 | 12 | 14 | 19 |
| HCV+ | 5 | 13 | 65 | 3 | 4 | 0 | 6 | 19 |
| Chronic smokers | 32 | 31 | 40 | 28 | 27 | 12 | 45 | 37 |
| PHS-IR | 13 | 27 | 49 | 7 | 7 | 6 | 1 | 15 |
| Death due to a CVA | 46 | 54 | 39 | 43 | 32 | 35 | 42 | 70 |
| DCD | 22 | 21 | 17 | 11 | 16 | 18 | 4 | 11 |
Note: Data displayed as column % or mean ± SD P < .001 for all comparisons between groups.1
Pearson chi-square tests and the nonparametric equality of median tests were performed for categorical and continuous variables, respectively.
Organ quality was estimated using the Kidney Donor Risk Index (KDRI). The KDRI estimates the relative risk of posttransplant allograft failure, with lower values suggestive of better quality kidneys.9,10 The KDRI was calculated using 10 donor-specific characteristics (age, height, weight, ethnicity, history of hypertension, history of diabetes, cause of death, terminal creatinine, hepatitis C-positive [HCV+] status, and donation after cardiac death [DCD])11 and mapped onto a cumulative percentage scale using the 2017 scaling factor to generate the Kidney Donor Profile Index (KDPI).11,12
Organ quality assessment is a complex, multifactorial clinical decision and the presence of multiple unfavorable characteristics can adversely affect perceptions of organ quality. To examine the potential additive impact of donors having multiple negative characteristics, we identified 14 donor characteristics previously shown to increase the risk of kidney discard, thus also likely making the kidneys less favorable for procurement and generated a count for each donor.13,14 These high-risk characteristics included age >50 years, black race, Public Health Service – Increased Risk (PHS-IR) designation, HCV+ status, death due to cerebrovascular accident (CVA), obesity (body mass index [BMI] >35 kg/m2), DCD, history of hypertension, history of diabetes, history of cancer, chronic smoking (>20 cigarette packs per year), history of drug use (non-IV), terminal creatinine >2 mg/dL, and KDPI > 85%.14,15 Missing data for any of these variables were counted as not having the risk factor. The total number of unfavorable characteristics in a deceased donor ranged from 0 to a maximum of 14.
2.3 ∣. Statistical analyses
With donor as our unit of analysis, we compared donors with no kidneys procured to donors with all kidneys procured. Pearson's chi-square tests and the nonparametric Wilcoxon rank sum or equality of medians tests were performed for categorical and continuous variables, respectively. We used logistic regression models to identify factors associated with kidney nonprocurement (vs procurement). Donors with only 1 of 2 available kidneys recovered were excluded from logistic regression analyses due to uncertainty over the degree to which the nonprocured kidneys differed from their procured counterparts and the possibility that nonprocurements secondary to unilateral abnormalities were potentially appropriate nonprocurements. Bivariable analysis was performed on each donor characteristic. All donor characteristics were used to generate an initial multivariable model. To avoid overfitting, well-defined risk factors for chronic kidney disease—including obesity, black race, hypertension, diabetes, HCV+ status, and proteinuria—were used along with terminal creatinine in the final multivariable model.16,17 Pearson correlation and linear regression were used to assess the relationship between the proportion of donors with no kidneys procured and the proportion of procured kidneys that were discarded within DSAs. To examine potential associations between OPOs and background donor risk level in explaining the aforementioned relationship, OPOs were stratified into “high-,” “medium-,” and “low”-risk groups based on the percentage of their available donors with KDPI over 85%: low proportion (<15%) of donors with KDPI > 85% (n = 20), medium proportion (16%-20%) of donors with KDPI > 85% (n = 23), and high proportion (21%-30%) of donors with KDPI > 85% (n = 14). To analyze how procurement decisions have changed over the study period, we stratify potential donors by donation year (2000-2006, 2007-2012, and 2013-2018). Within these 3 time periods we calculate the crude and adjusted odds of kidney nonprocurement by donor terminal creatinine levels and other donor risk factors. The degree of overlap in quality of procured and nonprocured kidneys was assessed using the Bhattacharyya coefficient, a measure of the similarity between 2 distributions in which a value of 1 reflects complete overlap and a value of 0 reflects no overlap.18 Statistical analyses were performed using Stata 15.1 (StataCorp, College Station, TX). Statistical significance was set at the 95% confidence level (P < .05).
3 ∣. RESULTS
3.1 ∣. Donor characteristics
From 2000 to 2018, we identified 146 712 deceased organ donors, among whom 10 291 (7.1%) had no kidneys recovered for transplant and another 1149 (0.8%) had only 1 of 2 available kidneys recovered (Figure S1). A total of 21 731 deceased donor kidneys, averaging 1144 kidneys/y, were left behind over our 19-year study period. Compared to donors with all kidneys procured, those with no kidneys procured were older and more likely to be obese, black, hypertensive, diabetic, HCV+, smokers, or PHS-IR designated (all P < .001; Table 1). Donors with no kidneys procured were also more likely to have died from a cerebrovascular accident or donated after cardiovascular death (all P < .001). These donors had lower quality kidneys (median KDRI 1.9 vs 1.2), higher terminal creatinine (3.7 ± 3.0 vs 1.2 ± 1.0 mg/dL), and higher numbers of unfavorable donor characteristics (Figure S2) than donors with all kidneys procured (all P < .001). Although nonprocured kidneys had higher KDRI scores and terminal creatinine levels than procured kidneys, there were large overlaps (Bhattacharya coefficients 0.88 and 0.87, respectively) in the quality of nonprocured vs procured donor kidneys (Figure 1A,B). Donors with any missing data (n = 13 300) had more than 2-fold higher odds of kidney nonprocurement, compared to donors with no missing data (n = 132 268) (P < .001; Table 1).
TABLE 1.
Donor characteristics by kidney procurement status
| n (%) or mean ± SD | No kidneys recovered1 (n = 10 296) |
All kidney(s) recovered2 (n = 135 272) |
|---|---|---|
| Age (y) | 50.8 ± 17.1 | 39.5 ± 17.3 |
| Age >50 | 5440 (53%) | 41 826 (31%) |
| Age >75 | 735 (7%) | 847 (0.6%) |
| Female | 4126 (40%) | 54 752 (40%) |
| BMI (kg/m2) | 28.3 ± 7.1 | 27.2 ± 6.8 |
| Obese (BMI > 35) | 1496 (15%) | 15 495 (12%) |
| Black/African American | 2575 (25%) | 19 022 (14%) |
| History of hypertension | 6448 (63%) | 40 814 (30%) |
| History of diabetes | 3067 (30%) | 11 856 (9%) |
| History of cancer | 626 (6%) | 4049 (3%) |
| Death due to CVA | 5017 (49%) | 49 896 (37%) |
| Terminal creatinine (mg/dL) | 3.7 ± 3.0 | 1.2 ± 1.0 |
| Terminal creatinine >2 | 6632 (64%) | 12 765 (9%) |
| Known clinical infection3 | 4965 (48%) | 69 658 (52%) |
| DCD | 2204 (21%) | 16 504 (12%) |
| HCV+ (Ab+ or NAT) | 1581 (15%) | 5687 (4%) |
| Median KDRI (IQR) | 1.9 (1.0) | 1.2 (0.7) |
| Median KDPI (%) (IQR)4 | 88 (34) | 50 (53) |
| Proteinuria | 6255 (61%) | 54 463 (40%) |
| Smoked >20 cigarette packs/y | 3403 (33%) | 36 083 (27%) |
| Alcohol abuse | 1270 (12%) | 19 698 (15%) |
| History of drug use (IV) | 988 (10%) | 7182 (5%) |
| History of drug use (non-IV) | 3056 (30%) | 45 315 (34%) |
| PHS-IR | 2265 (22%) | 16 057 (12%) |
| Organs recovered | ||
| Liver | 9831 (96%) | 112 025 (83%) |
| Heart | 1128 (11%) | 44 139 (33%) |
| Lung | 879 (9%) | 28 369 (21%) |
Note: Data displayed as column % or mean ± SD P < .001 for all comparisons between donors with no kidneys procured and donors with all kidneys procured, except female gender (P = .52).5
No kidneys recovered – 0 kidneys procured from the deceased donor.
All kidneys recovered – 2 kidneys procured (n = 134 927), or 1 kidney procured from donors who were missing the other kidney (due to previous living donation, congenital absence, previous nephrectomy, etc) (n = 345).
Known Clinical Infection: Deceased donor has an infection (viral, bacterial, fungal, mycobacterial, or parasitic) that is potentially transmissible to the recipient.
KDPI calculated based on the 2017 median KDRI value among all deceased donor kidneys procured as the scaling factor.
Pearson chi-square tests and nonparametric Wilcoxon rank-sum tests were performed for categorical and continuous variables, respectively.
FIGURE 1.

(A) Kidney Donor Risk Index (KDRI) and (B) terminal creatinine overlap of procured and nonprocured kidneys in donors with all available kidneys (n = 134 343) procured or no kidneys procured (n = 10 188). Median (interquartile index [IQR] boundaries) for each donor type is indicated
3.2 ∣. Organs recovered
Kidneys were the most commonly procured organs from deceased donors and were the only organs procured in 20 051 (13.7%) donors—including 19 848 bilateral kidney-only donors and 203 unilateral kidney-only donors (Figure 2; Figure S3). In contrast, 8% of liver donors (n = 9831) had no kidneys recovered for transplant, whereas 3% of heart (n = 1128) and 3% of lung donors (n = 765) had no kidneys recovered (Table S3). Compared to donors with all kidneys procured, donors with no kidneys procured were more likely to have a liver, and less likely to have a heart or lung recovered (Table 1). Liver donors who did not have a kidney procured were older and more likely to be obese, black, hypertensive, diabetic, HCV+, smokers, and designated PHS-IR (Table S2). These donors had higher median KDRI scores and terminal creatinine. The 1772 donors in whom a heart and/or lung was recovered but the kidneys were not (Figure 2) tended to be younger and have a lower BMI, in addition to being more likely to be black or have proteinuria, PHS-IR designation, or elevated creatinine than donors with all kidneys procured (Table S2).
FIGURE 2.

Procurement of nonrenal organs (heart, liver, and/or lung) based on kidney recovery status between 2000 and 2018. Includes single and bilateral procurement of lung(s)
3.3 ∣. Reported reasons for kidney nonprocurement
Approximately half (54%) of kidney nonprocurements were attributed to poor organ quality and function (Table 2), but nearly a third (30%) were for donor history—which presumably should have affected the procurement of the other solid organs as well. Over 1 in 8 kidney nonprocurements occurred due to allocation system-related reasons including purported inability to locate a recipient or logistical challenges. Donors whose kidneys were not procured because of an anatomical abnormality, procurement injury, or logistical challenges were significantly younger and less likely to be black, hypertensive, or diabetic (Table 3). They were also the least likely to be HCV+, smokers, designated PHS-IR, or died due to a CVA or have DCD status. Notably, kidney nonprocurement due to the inability to locate a recipient had higher rates of HCV+ (65%) and PHS-IR designation (49%) compared to other groups. Anatomical abnormality and procurement injury were more commonly cited as the reason for unilateral nonprocurement than bilateral nonprocurement (24% vs 1% and 3% vs 0.2%, respectively) (Table 2). Over two thirds of unilateral nonprocurements cited reasons that typically should have affected the partner kidney equally, that is, poor organ quality and function (46%), donor history (20%), and inability to locate a recipient (4%).19
3.4 ∣. Odds of kidney nonprocurement
Kidneys from donors who were older, obese, black, smokers, died due to a CVA, or had DCD status experienced higher odds of kidney nonprocurement (all P < .001, Table 4). Furthermore, donors with hypertension, diabetes, HCV+ status, PHS-IR designation, proteinuria, or a history of cancer were at least 2-4 times more likely to not have kidneys procured. Every unit increase in KDRI corresponded to 5-fold higher odds of nonprocurement (OR = 5.39 P < .001) and each 1% unit increase in KDPI corresponded to 4% higher odds of nonprocurement (OR = 1.04, P < .001). Kidneys with KDPI scores >85% were at 6-fold higher odds of nonprocurement (OR = 6.08, P < .001). The more unfavorable characteristics a donor had, the greater the likelihood that their kidneys would not be procured; compared to donors with no unfavorable characteristics, those possessing ≥1 characteristic experienced anywhere from a 1.99-fold (for 1 characteristic) to 38.09-fold (for ≥5 characteristics) higher odds of kidney nonprocurement (all P < .001). Among donors with no kidneys procured, 1 in 7 (n = 1432) had 2 or fewer unfavorable donor characteristics.
TABLE 4.
Bivariable and multivariable logistic regression model of the odds of kidney nonprocurement from 2000 to 2018
| Parameters | Crude OR (95% CI) | Adjusted OR (95% CI) All variables |
Adjusted OR (95% CI) Risk factors for CKD |
|---|---|---|---|
| Age (y) | 1.04 (1.04-1.04) | 1.04 (1.04-1.05) | |
| Age >50 | 2.51 (2.41-2.61) | ||
| Age >75 | 12.20 (11.03-13.50) | ||
| Female | 0.99 (0.95-1.03) | 1.20 (1.13-1.28) | |
| BMI | 1.02 (1.02-1.03) | 0.96 (0.96-0.96) | 0.96 (0.96-0.97) |
| Obese (BMI > 35) | 1.32 (1.24-1.39) | ||
| Black/African American | 2.04 (1.95-2.14) | 1.23 (1.16-1.30) | 1.11 (1.04-1.17) |
| History of hypertension | 3.88 (3.73-4.05) | 1.62 (1.53-1.72) | 2.74 (2.60-2.88) |
| History of diabetes | 4.42 (4.22-4.63) | 2.05 (1.93-2.18) | 2.38 (2.25-2.53) |
| History of cancer | 2.10 (1.92-2.29) | 1.70 (1.49-1.93) | |
| Death due to CVA | 1.63 (1.56-1.70) | 1.07 (0.99-1.16) | |
| Terminal creatinine (mg/dL) (ref = sCr<1) | |||
| 1.00-1.49 | 1.62 (1.50-1.75) | 1.40 (1.29-1.52) | 1.48 (1.37-1.61) |
| 1.50-2.00 | 3.50 (3.211-3.816) | 2.74 (2.50-3.00) | 2.89 (2.64-3.16) |
| >2.00 | 25.11 (23.58-26.75) | 25.22 (23.47-27.11) | 22.67 (21.17-24.28) |
| Terminal creatinine >2 | 17.39 (16.63-18.17) | ||
| DCD | 1.96 (1.87-2.06) | 1.16 (1.08-1.25) | |
| HCV+ | 4.13 (3.89-4.39) | 6.61 (6.07-7.21) | 6.93 (6.44-7.46) |
| KDRI (unit = 1) | 5.39 (5.21-5.57) | ||
| KDPI (unit = 1%) | 1.04 (1.04-1.04) | ||
| KDPI > 85% | 6.08 (5.84-6.34) | ||
| Proteinuria | 2.30 (2.21-2.39) | 1.39 (1.31-1.47) | 1.34 (1.28-1.40) |
| Smoked >20 cigarette packs/y (ref = no) | |||
| Yes | 1.38 (1.32-1.44) | 0.92 (0.86-0.98) | |
| Unknown | 1.73 (1.50-1.99) | 0.86 (0.69-1.06) | |
| Alcoholism (ref = no) | |||
| Yes | 0.80 (0.75-0.85) | 0.65 (0.60-0.71) | |
| Unknown | 1.41 (1.22-1.63) | 0.82 (0.65-1.03) | |
| IV drug use (ref = no) | |||
| Yes | 1.93 (1.80-2.07) | 1.09 (0.96-1.23) | |
| Unknown | 1.56 (1.31-1.86) | 0.86 (0.66-1.11) | |
| History of drug use (non-IV) (ref = no) | |||
| Yes | 0.85 (0.81-0.88) | 0.78 (0.73-0.84) | |
| Unknown | 1.45 (1.25-1.69) | 0.94 (0.74-1.20) | |
| Known clinical infection | 0.88 (0.84-0.91) | 0.70 (0.67-0.73) | |
| PHS-IR | 2.09 (1.99-2.20) | 1.84 (1.72-1.97) | |
| Risk count1 (ref = 0) | |||
| 1 | 1.99 (1.64-2.41) | ||
| 2 | 4.32 (3.61-5.18) | ||
| 3 | 7.81 (6.55-9.32) | ||
| 4 | 14.64 (12.30-17.43) | ||
| >=5 | 38.09 (32.14-45.15) | ||
| Missing data for ≥1 donor characteristic | 2.18 (2.06-2.30) |
Multivariable logistic regression includes (A) adjustment for all variables, and (B) adjustment for risk factors for CKD. KDRI/KDPI was not included in the “all variables” model as several of its component variables were included separately. Other variables were omitted from this model to avoid double counting, for example Age >50 is accounted for by the continuous age variable.
Potential risk factors (14) for nonrecovery include: Age >50 y, history of hypertension, history of diabetes, PHS-IR, terminal sCr > 2, HCV+, death due to CVA, BMI > 35, DCD, Black/African American, history of drug use (non-IV), chronic smoking, history of cancer, KDPI > 85%.
Analysis of procurement decisions by donor year shows that the effect sizes of older age, African American/black race, hypertension, diabetes, HCV+, KDPI > 85%, smoking, and number of donor risk factors on nonprocurement have been rising (Figure S4). The effect size of donor HCV+ status on kidney nonprocurement increased from 2.82 (2.46-3.22) in 2000-2006 to 5.28 (4.86-5.75) in 2013-2018. In 2000-2006, donors with KDPI > 85% were over 5 times more likely than those with KDRI < 85% to have no kidney procurements (odds ratio [OR]: 5.25 [4.87-5.67]); by 2013-2018, these donors were 7.6 times more likely to have no kidneys procured (OR: 7.59 [7.09-8.13]).
After controlling for risk factors of chronic kidney disease, terminal creatinine continued to have a strong effect on the odds of kidney nonrecovery (Table 4). Compared to donors with terminal creatinine <1.00 mg/dL, those with creatinine between 1.00-1.49 mg/dL were 48% more likely to have no kidneys procured, those with creatinine between 1.50 and 2.00 mg/dL were nearly 3 times more likely to have no kidneys procured, and those with creatinine greater than 2.00 mg/dL were over 22-fold more likely to have no kidneys recovered. The adjusted odds of kidney nonprocurement for donors with terminal creatinine >2 mg/dL decreased from 26.58 (95% confidence interval [CI], 23.55-30.01) in 2000-2006 to 21.02 (95% CI, 18.72-23.60) in 2013-2018, suggesting a small decrease in effect size of elevated creatinine on nonprocurement over our study period (Figure 3). Multivariable analysis also demonstrated the persistent effects of black race, hypertension, diabetes, HCV+, and proteinuria on kidney nonprocurement (Table 4).
FIGURE 3.

Adjusted odds of kidney nonprocurement, stratified by donation year and terminal creatinine level (reference donor creatinine <1.00 mg/dL)
3.5 ∣. Geographical variation
There was wide geographical variation in procurement practices across the United States. At the DSA level, donor kidney nonprocurement was moderately correlated with kidney discard (r = .35, P = .007). Higher proportions of donor nonprocurement were associated with higher proportions of kidney discards, with each 1% increase in donor nonprocurements corresponding to a 0.49% (95% CI, 0.13-0.85) higher proportion of kidneys discarded (Figure 4). The trend was not accounted for by differences in background donor risk across DSAs. Within low-risk OPOs (9%-15% of donors with KDPI > 85%), there was a strong positive correlation between proportion of kidneys discarded and proportion of donors whose kidneys were not procured (r = .57, P = .008). The relationships were nonsignificant for medium-risk (16%-20% of donors with KDPI > 85%; r = −.05, P = .81) and high-risk OPOs (21%-30% of donors with KDPI > 85%; r = −.31, P = .25).
FIGURE 4.
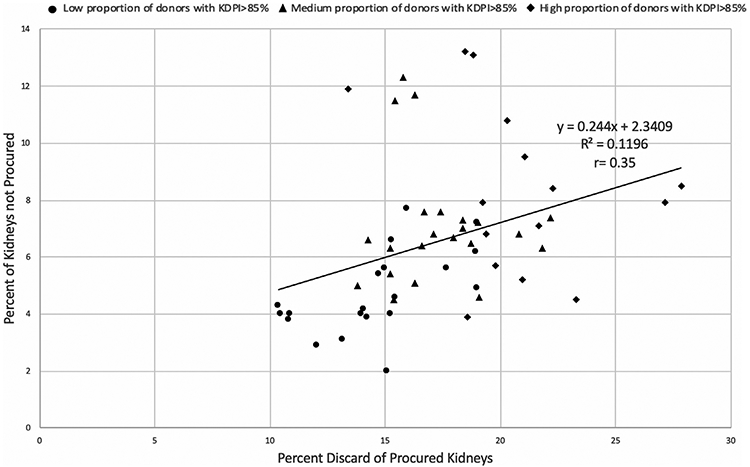
Proportion of donors with no kidneys recovered vs proportion of kidneys discarded across organ procurement organizations (OPOs) operating from 2000 to 2018, stratified by percentage of donor population with Kidney Donor Profile Index (KDPI) > 85%. There was a significant positive correlation between kidney discard and kidney nonprocurement rates across OPOs (r = .35, P = .007). Correlation for “low-risk” OPOs was r = .57 (P = .008), for “medium-risk” OPOs r = −.05 (P = .81), and for “high-risk” OPOs r = −.31 (P = .26). The percentage of donors with no kidneys procured was 6.55% (mean), 6.35% (median). The percentage of kidneys discarded was 17.26% (mean), 16.89% (median)
Across OPTN regions, donors’ odds of having no kidneys recovered ranged from 1.61 to 3.92 when compared to region 6 in the Pacific Northwest (Table S5). The Pacific Northwest was selected as the reference group because it had the lowest proportion of kidneys not procured (2.95%) among OPTN regions. After adjusting for risk factors of chronic kidney disease, 6 regions had significantly different odds of kidney nonprocurement when compared to the Pacific Northwest (Figure 5). Being a deceased donor in the Southwest (region 4) increased likelihood of kidney nonrecovery by 211%, in the Midwest (regions 7, 8, and 10) by 44% to 88%, in parts of the Southeast (region 3) by 223%, and in parts of the Northeast (region 9) by 232%.
FIGURE 5.

Adjusted odds ratio (aOR) of kidney nonprocurement by Organ Procurement and Transplantation Network (OPTN) region, 2000-2018. Region 6 was used as the reference region. The model was adjusted for body mass index (BMI), Black/African American race, hypertension, diabetes, terminal serum creatinine level, hepatitis C virus (HCV)+ status, and proteinuria
The adverse effect of terminal creatinine on likelihood of donor kidney procurement also differed markedly across OPTN regions (Table 5). With the exception of donors in regions 1 and 5, donors in all other OPTN regions had significantly higher odds of kidney nonprocurement with terminal creatinine between 1.00 and 1.49 mg/dL, when compared to donors in the same region with terminal creatinine below 1.00 mg/dL. Depending on OPTN region, donors with terminal creatinine between 1.00 and 1.49 faced anywhere from a 1.22 to 3.68 higher odds of kidney nonprocurement. The geographic variation in nonprocurement odds was even more striking at higher creatinine categories: donors with creatinine between 1.50 and 2.00 were at 2.34- to 4.19-fold higher odds of nonprocurement, and those with creatinine >2.00 mg/dL faced were at 17.63- to 60.04-fold higher odds of nonprocurement.
TABLE 5.
Bivariable and multivariable logistic regression models of the association between donor terminal serum creatinine and kidney nonprocurement, stratified by OPTN region
| Terminal creatinine (mg/dL) (reference creatinine <1.00) | ||||||
|---|---|---|---|---|---|---|
| 1.00-1.49 | 1.50-2.00 | >2.00 | ||||
| Crude OR (95% CI) |
Adjusted OR (95% CI) |
Crude OR (95% CI) |
Adjusted OR (95% CI) |
Crude OR (95% CI) | Adjusted OR (95% CI) |
|
| Region 1 | 1.65 (1.06-2.58) | 1.55 (0.98-2.46) | 3.20 (1.85-5.53) | 2.34 (1.31-4.19) | 23.33 (16.39-33.19) | 23.92 (16.19-35.35) |
| Region 2 | 1.72 (1.36-2.17) | 1.49 (1.17-1.90) | 3.77 (2.94-4.83) | 2.98 (2.29-3.87) | 24.86 (20.66-29.92) | 22.26 (18.20-27.21) |
| Region 3 | 1.59 (1.35-1.87) | 1.49 (1.26-1.77) | 3.11 (2.60-3.73) | 2.58 (2.14-3.11) | 23.26 (20.26-26.70) | 21.21 (18.26-24.63) |
| Region 4 | 1.60 (1.28-2.00) | 1.46 (1.16-1.84) | 3.16 (2.46-4.07) | 2.74 (2.11-3.56) | 26.87 (22.39-32.25) | 23.47 (19.23-28.65) |
| Region 5 | 1.28 (0.99-1.66) | 1.22 (0.93-1.60) | 3.08 (2.33-4.08) | 2.69 (2.00-3.62) | 19.23 (15.81-23.38) | 19.90 (16.02-24.71) |
| Region 6 | 3.84 (2.12-6.96) | 3.68 (2.00-6.77) | 4.63 (2.11-10.18) | 4.19 (1.85-9.49) | 62.31 (26.80-105.48) | 60.04 (33.96-106.12) |
| Region 7 | 1.77 (1.31-2.39) | 1.63 (1.20-2.22) | 4.51 (3.30-6.15) | 3.95 (2.85-5.46) | 28.48 (22.35-36.30) | 25.18 (19.36-32.76) |
| Region 8 | 1.83 (1.38-2.43) | 1.69 (1.26-2.27) | 4.45 (3.25-6.08) | 3.62 (2.60-5.03) | 28.01 (22.21-35.34) | 25.22 (19.49-32.63) |
| Region 9 | 1.54 (1.16-2.04) | 1.29 (0.96-1.74) | 3.44 (2.50-4.74) | 2.65 (1.89-3.71) | 20.52 (16.35-25.76) | 17.63 (13.78-22.55) |
| Region 10 | 1.53 (1.16-2.02) | 1.40 (1.05-1.86) | 3.42 (2.53-4.61) | 2.84 (2.08-3.89) | 31.32 (25.23-38.88) | 31.45 (24.85-39.80) |
| Region 11 | 1.35 (1.02-1.78) | 1.25 (0.95-1.66) | 2.96 (2.19-4.00) | 2.55 (1.87-3.48) | 28.26 (22.82-35.00) | 27.15 (21.55-34.22) |
Adjusted for BMI, Black/African American race, hypertension, diabetes, terminal serum creatinine level, HCV+ status, and proteinuria.
3.6 ∣. Sensitivity analysis
A sensitivity analysis was performed to assess the impact of donors with missing observations (n = 13 300). We examined the impact of including only donors with complete observations (n = 132 268) in our analysis, rather than grouping “missing” and “unknown” observations with the “no” category for each risk factor (n = 145 568). Our results were not meaningfully different when comparing both approaches (Table S6).
4 ∣. DISCUSSION
Improving organ availability for transplantation to meet the existing demand requires a multifaceted approach. Central to these efforts are OPOs and transplant centers, as outlined by the recent Executive Order on Advancing American Kidney Health's goal of “increasing recovery of kidneys by OPOs and utilization of kidneys by transplant centers.”20 Given the large number of patients waiting for kidney transplantation compared to the limited supply of organs, there is a need to better understand the factors that influence the identification and procurement of deceased donor kidneys.
Here, we demonstrate that nearly 8% of kidneys are not being recovered from deceased donors who have donated other solid organs for transplant, and that many of these donors have similar kidney quality as donors from whom both kidneys were procured. Despite the overlap in kidney quality, donor-level characteristics such as poor organ quality and function and donor history were reported as the primary reason for 80% of kidney nonprocurements. Nonetheless, donor history, which was a contraindication to kidney procurement for 29% of donors in our study, did not deter the successful procurement of another solid organ from these donors.
Although the KDRI and KDPI are widely used metrics for determining donor suitability, they have only moderate predictive power (KDPI c-statistic = 0.60).11 Recently, Aubert et al21 reported that many higher risk kidneys were successfully transplanted in France, even though their unfavorable KDRI scores would typically have resulted in their discard if instead the organs had been allocated in the United States. The KDRI is incomplete because it does not include all donor factors possibly associated with kidney graft outcomes, such as anatomical abnormalities or organ damage during procurement.22 It is surprising then that these anatomic reasons accounted for only 3.5% of kidney nonprocurements in our cohort (Table 2). Additionally, the inability to locate a recipient for kidneys was extremely common among HCV+ donors, smokers, and donors with PHS-IR designation (Table 3), despite evidence suggesting that these labels decrease utilization of organs that are in fact safe and transplantable.23-26
Of concern, time-stratified analysis demonstrated that the likelihood of kidney nonprocurement is increasing across our study period for donors who are older, African American/black race, HCV+ or have hypertension, diabetes, KDPI > 85%, a history of smoking, or increased number of donor risk factors. The increase in impact of HCV+ status predisposing toward kidney nonprocurement is alarming but may be more easily reversed given the recent increase in use of organs from HCV+ donors.27 Aubert et al’s28 comparison of donor kidney acceptance in the United States vs in France is consistent with these findings, given that the mean KDRI of transplanted kidneys in the United States has remained relatively stable in contrast to the rise noted in France.
When attempting to look at the multifactorial clinical decision-making that occurs at the time of organ procurement, we counted 14 donor characteristics typically viewed as unfavorable. We note that 14% of donors with no kidneys recovered had 2 or fewer unfavorable characteristics, whereas 15% of donors with all kidneys recovered had 5 or more adverse characteristics. These findings suggest that factors outside of organ quality are contributing to the decision to not procure deceased donor kidneys that might otherwise be well suited for transplant. Furthermore, uncertainty about donor characteristics may also drive OPO decision-making; donors with missing data for any donor characteristic had a 2.18-fold higher odds of kidney nonprocurements, compared to donors with no missing data.
Although there has been considerable attention focused on the rising rate of kidney discards,7,14,19,29-31 another barrier to organ availability exists upstream, in the decision of whether to procure a deceased donor kidney. Failure to place a procured organ is associated with financial disincentives for OPOs, as they must themselves cover the cost of organ recovery without reimbursement from the recipient's hospital. Placement of organs outside of the DSA is also associated with higher cost and greater effort on the part of the OPO to find a center that is willing to accept the organ and to manage the logistics of transporting the organ to that center. As a result, a decreased willingness to use less-than-optimal kidneys by transplant centers, reflected by the increasing number of organ declines, is likely to influence the willingness of the OPO to procure organs from similar donors in the future.5,32-35 Consistent with this hypothesis of the effect of transplant center risk aversion, we observed a positive correlation between the proportion of donors with no kidneys procured and the proportion of kidneys discarded on the DSA level. After risk-stratifying based on percentage of donors within a DSA with KDRI > 85%, a moderate correlation between kidney discard and donor nonprocurement was observed only among DSAs with a low proportion of high-risk donors, which disappeared among DSAs with medium or high proportions of high-risk donors. Following the July 2019 Executive Order on Advancing American Kidney Health, the Centers for Medicare and Medicaid Services (CMS) more recently issued a proposed rule to measure OPO performance based on donation rates (number of actual deceased donors as a percentage of the donor potential) and transplantation rates (the number of organs transplanted as a percentage of the donor potential).36 Scheduled to take effect in 2022, these changes are designed to improve organ procurement and placement by OPOs.
Given the desire to achieve adequate kidney function for recipients posttransplant, it is not surprising that kidneys from donors with higher terminal creatinine are viewed unfavorably. Due to the limitations in creatinine kinetics in our data set, acute kidney injury (AKI) was defined in our study as a terminal creatinine >2 mg/dL and is an independent risk factor for discard that is associated with a higher proportion of discards than kidneys from donors without AKI (30% vs 18%, respectively).37-39 However, there is now considerable evidence that AKI is often reversible and that kidneys from donors with AKI provide short- and long-term graft survival and function comparable to kidneys with nonelevated terminal creatinine.37,40-46 Liu et al’s47 recent comparison of propensity score-matched deceased donors with AKI to deceased donors without AKI demonstrated that deceased donor AKI had no independent association with short-term and long-term recipient graft survival across all AKI stages. Although elevated creatinine in the setting of chronic kidney disease (CKD) in the donor would be a justifiable reason for nonprocurement, severe kidney disease may also preclude procurement of nonrenal organs such as heart and lungs. Thus, the large number of donors in our study with elevated creatinine that had liver, lung, and/or heart procurements—but no kidneys procured—are presumably less likely to have CKD and more likely to have AKI, suggesting that their kidneys may have been suitable for procurement and transplantation. Given the absence of additional measures of renal function over time in our data set, we attempted to isolate the impact of elevated creatinine resulting from AKI by including factors that are commonly associated with CKD in our adjusted regression model. Controlling for CKD risk factors attenuated the association with terminal creatinine, but a strong association nonetheless persisted; donors with terminal creatinine of 1.00-1.49 mg/dL, 1.49-2.00 mg/dL, or >2.00 mg/dL were at 1.48, 2.89, and 22.67 higher odds of nonprocurement, respectively (Table 4). Transplant programs more frequently refuse offers for kidneys with creatinine >1.50 mg/dL, and these kidneys with high terminal creatinine are also more likely to end up discarded, which likely lowers their upstream procurement in a negative feedback loop.48 The decrease in adjusted odds of kidney nonprocurement for donors with creatinine levels >2.00 mg/dL between 2000 and 2018 suggest that multiple recent analyses demonstrating excellent performance of kidneys from donors with AKI is potentially having at least a small impact on clinical decision-making. Nonetheless, our findings underscore the need for greater awareness in the transplant community of the excellent outcomes reported with the transplant of kidneys from donors with AKI.37
This study has several limitations. We rely on OPTN registry data, which may contain reporting errors. The reported reasons for organ nonprocurement are subjective and the current data system fails to capture more than one justification that may have contributed to the OPO’s decision, in addition to the primary reported reason. Improved and more detailed reporting of reasons for nonprocurement is needed to allow a better understanding of the underlying factors that results in suboptimal organ recovery rates. Our analysis centered on whether extrarenal organs were procured as this established the baseline number of total solid organ donors. The procurement and utilization of extrarenal organs are highly variable by geography,49 thus, lower rates of kidney nonprocurement from available deceased donors may reflect higher-than-expected procurement and utilization of suboptimal extra-renal organs. Our current methodology also fails to account for the potential kidney-only donors that were lost. Given that 13.4% of our study cohort (n = 19 252) donated only kidneys, it is likely that a substantial number of potential donors are missing from our analysis, due to having no organs procured at all. The fact that our data set only captures each donor's final creatinine results in a limited ability to differentiate donor CKD vs AKI. More precise patient information, such as changes in creatinine during the hospitalization, should be analyzed in future studies to allow for greater accuracy in identification of AKI and/or CKD in the donor, thereby reducing potential misclassification biases. However, our analysis controls for risk factors of chronic disease and many previous studies analyzing AKI kidneys also define AKI based on terminal creatinine.40,43,44,50 Finally, our focus is on highlighting that many potentially procurable kidneys with elevated terminal creatinine levels are being left behind in donors. Given changing OPTN policies and recommended clinical practices over time, more detailed time-based analyses are important and should be the subject of further investigation.
In conclusion, it may be the case that in current practice many potentially transplantable kidneys are not being procured from certain deceased organ donors. Although the decision to procure a deceased donor kidney is complex, reluctance to recover kidneys from donors with AKI appears to be a major driver of this trend. The overlap in quality of nonprocured and procured kidneys, along with the geographical heterogeneity in procurement practices suggest that current discard rates in the United States underestimate the true number of kidneys lost to transplant. The interplay between organ procurement and utilization decisions, and the incentives and tradeoffs underlying these choices, should remain a focus of our efforts to expand the pool of kidneys available for transplantation.
Supplementary Material
ACKNOWLEDGMENTS
This work was supported in part by Health Resources and Services Administration contract 234-2005-370011C. The content is the responsibility of the authors alone and does not necessarily reflect the views or policies of the US Department of Health and Human Services, nor does mention of trade names, commercial products, or organizations imply endorsement by the US Government. KY acknowledges funding from the New York Academy of Medicine (Margaret E. Mahoney Fellowship). SAH is supported by the National Center for Advancing Translational Sciences (KL2 TR001874). CRP is supported by the National Institutes of Health/National Institutes of Diabetes and Digestive and Kidney Diseases (R01 DK93770). SM is supported by National Institutes of Health/National Institute of Diabetes and Digestive and Kidney Diseases (R01 DK114893, U01 DK116066) and the National Institute of Minority Health and Health Disparities (R01 MD014161).
Funding information
National Institute on Minority Health and Health Disparities, Grant/Award Number: R01 MD014161; National Center for Advancing Translational Sciences, Grant/Award Number: KL2 TR001874; Health Resources and Services Administration, Grant/Award Number: 234-2005-370011C; New York Academy of Medicine; National Institutes of Health/National Institutes of Diabetes and Digestive and Kidney Diseases, Grant/Award Number: R01 DK93770, R01 DK114893 and U01 DK116066
Abbreviations:
- AKI
acute kidney injury
- BMI
body mass index
- CKD
chronic kidney disease
- CVA
cerebrovascular accident
- DCD
deceased after cardiac death
- DSA
donation service area
- ESKD
end-stage kidney disease
- HCV+
hepatitis C positive
- KDPI
Kidney Donor Profile Index
- KDRI
Kidney Donor Risk Index
- OPO
Organ Procurement Organization
- OPTN
Organ Procurement and Transplantation Network
- PHS-IR
Public Health Service – Increased Risk
- STAR
Standard Transplant Analysis and Research
- UNOS
United Network for Organ Sharing
Footnotes
DISCLOSURE
The authors of this manuscript have conflicts of interests to disclose as described by the American Journal of Transplantation. Dr Stevens reports personal fees from Kidney International Reports. Dr Parikh is a member of the advisory board of RenalytixAI and owns equity in the same. He is also consultant for Genfit and Akebia therapeutics. Dr Mohan reports scientific advisory board membership with Angion Pharmaceuticals, personal fees from Kidney International Reports, CMS and HSAG outside the submitted work.
SUPPORTING INFORMATION
Additional supporting information may be found online in the Supporting Information section.
DATA AVAILABILITY STATEMENT
The data that support the findings of this study are available via request to the Organ Procurement and Transplantation Network (OPTN).
REFERENCES
- 1.Tonelli M, Wiebe N, Knoll G, et al. Systematic review: kidney transplantation compared with dialysis in clinically relevant outcomes. Am J Transplant. 2011;11(10):2093–2109. [DOI] [PubMed] [Google Scholar]
- 2.Wolfe RA, Ashby VB, Milford EL, et al. Comparison of mortality in all patients on dialysis, patients on dialysis awaiting transplantation, and recipients of a first cadaveric transplant. N Engl J Med. 1999;341(23):1725–1730. [DOI] [PubMed] [Google Scholar]
- 3.United States Executive Office of the President [Donald J. Trump]: Executive Order 13,879: Advancing American Kidney Health. Fed Regist. 2019;84:33817–33819. [Google Scholar]
- 4.Israni AK, Zaun D, Rosendale JD, Schaffhausen C, Snyder JJ, Kasiske BL. OPTN/SRTR 2017 annual data report: deceased organ donation. Am J Transplant. 2019;19(S2):485–516. [DOI] [PubMed] [Google Scholar]
- 5.Hart A, Smith JM, Skeans MA, et al. OPTN/SRTR 2017 annual data report: kidney. Am J Transplant. 2019;19(S2):19–123. [DOI] [PubMed] [Google Scholar]
- 6.King KL, Husain SA, Mohan S. Geographic variation in the availability of deceased donor kidneys per wait-listed candidate in the United States. Kidney Int Rep. 2019;4(11):1630–1633. [DOI] [PMC free article] [PubMed] [Google Scholar]
- 7.Mohan S, Foley K, Chiles MC, et al. The weekend effect alters the procurement and discard rates of deceased donor kidneys in the United States. Kidney Int. 2016;90(1):157–163. [DOI] [PMC free article] [PubMed] [Google Scholar]
- 8.Gore SM, Taylor RM, Wallwork J. Availability of transplantable organs from brain stem dead donors in intensive care units. BMJ. 1991;302(6769):149–153. [DOI] [PMC free article] [PubMed] [Google Scholar]
- 9.Rao PS, Schaubel DE, Guidinger MK, et al. A comprehensive risk quantification score for deceased donor kidneys: the kidney donor risk index. Transplantation. 2009;88(2):231–236. [DOI] [PubMed] [Google Scholar]
- 10.Zhong Y, Schaubel DE, Kalbfleisch JD, Ashby VB, Rao PS, Sung RS. Reevaluation of the Kidney Donor Risk Index (KDRI). Transplantation. 2019;103(8):1714–1721. [DOI] [PMC free article] [PubMed] [Google Scholar]
- 11.The Organ Procurement and Transplantation Network UN for Organ Sharing. A Guide to Calculating and Interpreting the Kidney Donor Profle Index (KDPI). https://optn.transplant.hrsa.gov/media/1512/guide_to_calculating_interpreting_kdpi.pdf. 2019. Accessed July 17, 2019.
- 12.The Organ Procurement and Transplantation Network UN, for Organ Sharing. KDRI to KDPI mapping table. https://optn.transplant.hrsa.gov/media/2150/kdpi_mapping_table.pdf. Updated March9, 2018. Accessed July 22, 2019.
- 13.Brennan C, Husain SA, King KL, et al. A donor utilization index to assess the utilization and discard of deceased donor kidneys perceived as high risk. Clin J Am Soc Nephrol. 2019;14(11):1634–1641. [DOI] [PMC free article] [PubMed] [Google Scholar]
- 14.Mohan S, Chiles MC, Patzer RE, et al. Factors leading to the discard of deceased donor kidneys in the United States. Kidney Int. 2018;94(1):187–198. [DOI] [PMC free article] [PubMed] [Google Scholar]
- 15.Brennan C, Husain SA, King KL, et al. A donor utilization index to assess the utilization and discard of deceased donor kidneys perceived as high risk. Clin J Am Soc Nephrol. 2019;14(11):1634–1641. Manuscript submitted for publication. [DOI] [PMC free article] [PubMed] [Google Scholar]
- 16.Denker M, Boyle S, Anderson AH, et al. Chronic renal insufficiency cohort study (CRIC): overview and summary of selected findings. Clin J Am Soc Nephrol. 2015;10(11):2073–2083. [DOI] [PMC free article] [PubMed] [Google Scholar]
- 17.Grams ME, Yang W, Rebholz CM, et al. Risks of adverse events in advanced CKD: the chronic renal insufficiency cohort (CRIC) study. Am J Kidney Dis. 2017;70(3):337–346. [DOI] [PMC free article] [PubMed] [Google Scholar]
- 18.Bhattacharyya A. On a measure of divergence between two multinomial populations. Sankhyā. 1946;7(4):401–406. [Google Scholar]
- 19.Husain SA, Chiles MC, Lee S, et al. Characteristics and performance of unilateral kidney transplants from deceased donors. Clin J Am Soc Nephrol. 2018;13(1):118–127. [DOI] [PMC free article] [PubMed] [Google Scholar]
- 20.Office of the Assistant Secretary for Planning and Evaluation, U.S. Department of Health and Human Services. Advancing American Kidney Health. https://aspe.hhs.gov/system/files/pdf/262046/AdvancingAmericanKidneyHealth.pdf.2019. Accessed July 20, 2019.
- 21.Aubert O, Reese PP, Raynaud M, et al. Exploring the viability of kidneys discarded in the US: a comparison of kidney utilization patterns and outcomes in the US and France. Transplantation. 2018;102:S173. [Google Scholar]
- 22.Stallone G, Grandaliano G. To discard or not to discard: transplantation and the art of scoring. Clin Kidney J. 2019;12(4):564–568. [DOI] [PMC free article] [PubMed] [Google Scholar]
- 23.Underwood PW, Sheetz KH, Cron DC, Terjimanian MN, Englesbe MJ, Waits SA. Cigarette smoking in living kidney donors: donor and recipient outcomes. Clin Transplant. 2014;28(4):419–422. [DOI] [PubMed] [Google Scholar]
- 24.Duan KI, Englesbe MJ, Volk ML. Centers for disease control ‘high-risk’ donors and kidney utilization. Am J Transplant. 2010;10(2):416–420. [DOI] [PubMed] [Google Scholar]
- 25.Reese PP, Abt PL, Blumberg EA, et al. Twelve-month outcomes after transplant of hepatitis C-infected kidneys into uninfected recipients: a single-group trialtransplant of hepatitis C–infected kidneys into uninfected recipients. Ann Intern Med. 2018;169(5):273–281. [DOI] [PubMed] [Google Scholar]
- 26.La Hoz RM, Sandıkçı B, Ariyamuthu VK, Tanriover B Short-term outcomes of deceased donor renal transplants of HCV uninfected recipients from HCV seropositive nonviremic donors and viremic donors in the era of direct-acting antivirals. Am J Transplant. 2019;19(11):3058–3070. [DOI] [PMC free article] [PubMed] [Google Scholar]
- 27.Potluri VS, Goldberg DS, Mohan S, et al. National trends in utilization and 1-year outcomes with transplantation of HCV-viremic kidneys. J Am Soc Nephrol. 2019;30(10):1939–1951. [DOI] [PMC free article] [PubMed] [Google Scholar]
- 28.Aubert O, Reese PP, Audry B, et al. Disparities in acceptance of deceased donor kidneys between the United States and France and estimated effects of increased US acceptance. JAMA Intern Med. 2019;179(10):1365. [DOI] [PMC free article] [PubMed] [Google Scholar]
- 29.Stewart DE, Garcia VC, Rosendale JD, Klassen DK, Carrico BJ. Diagnosing the decades-long rise in the deceased donor kidney discard rate in the United States. Transplantation. 2017;101(3):575–587. [DOI] [PubMed] [Google Scholar]
- 30.Cooper M, Formica R, Friedewald J, et al. Report of National Kidney Foundation Consensus Conference to decrease kidney discards. Clin Transplant. 2019;33(1):e13419. [DOI] [PubMed] [Google Scholar]
- 31.Mohan S, Tanriover B, Ali N, et al. Availability, utilization and outcomes of deceased diabetic donor kidneys; analysis based on the UNOS registry. Am J Transplant. 2012;12(8):2098–2105. [DOI] [PMC free article] [PubMed] [Google Scholar]
- 32.Centers for Medicare & Medicaid Services (CMS), HHS. Medicare and Medicaid programs; conditions for coverage for organ procurement organizations (OPOs); final rule (CMS-3064-F). Codified at 42 CFR §§486.301-348, et al. Fed Regist. 2006;72:30982–31054. [PubMed] [Google Scholar]
- 33.Huml AM, Albert JM, Thornton JD, Sehgal AR. Outcomes of deceased donor kidney offers to patients at the top of the waiting list. Clin J Am Soc Nephrol. 2017;12(8):1311–1320. [DOI] [PMC free article] [PubMed] [Google Scholar]
- 34.Wolfe RA, LaPorte FB, Rodgers AM, Roys EC, Fant G, Leichtman AB. Developing organ offer and acceptance measures: when 'good' organs are turned down. Am J Transplant. 2007;7(5 Pt 2):1404–1411. [DOI] [PubMed] [Google Scholar]
- 35.Mohan S, Chiles MC. Achieving equity through reducing variability in accepting deceased donor kidney offers. Clin J Am Soc Nephrol. 2017;12(8):1212–1214. [DOI] [PMC free article] [PubMed] [Google Scholar]
- 36.U.S. Department of Health and Human Services Press Office. Trump Administration Proposes New Rules to Increase Accountability and Availability of the Organ Supply. https://www.hhs.gov/about/news/2019/12/17/trump-administration-proposes-new-rules-increase-accountability-availability-organ-supply.html#. 2019. Accessed December 18, 2019.
- 37.Kayler LK, Garzon P, Magliocca J, et al. Outcomes and utilization of kidneys from deceased donors with acute kidney injury. Am J Transplant. 2009;9(2):367–373. [DOI] [PubMed] [Google Scholar]
- 38.Marrero WJ, Naik AS, Friedewald JJ, et al. Predictors of deceased donor kidney discard in the United States. Transplantation. 2017;101(7):1690–1697. [DOI] [PubMed] [Google Scholar]
- 39.Hall IE, Schröppel B, Doshi MD, et al. Associations of deceased donor kidney injury with kidney discard and function after transplantation. Am J Transplant. 2015;15(6):1623–1631. [DOI] [PMC free article] [PubMed] [Google Scholar]
- 40.Dube GK, Brennan C, Husain SA, et al. Outcomes of kidney transplant from deceased donors with acute kidney injury and prolonged cold ischemia time - a retrospective cohort study. Transpl Int. 2019;32(6):646–657. [DOI] [PubMed] [Google Scholar]
- 41.Hall IE, Akalin E, Bromberg JS, et al. Deceased-donor acute kidney injury is not associated with kidney allograft failure. Kidney Int. 2019;95(1):199–209. [DOI] [PMC free article] [PubMed] [Google Scholar]
- 42.Boffa C, van de Leemkolk F, Curnow E, et al. Transplantation of kidneys from donors with acute kidney injury: friend or foe? Am J Transplant. 2017;17(2):411–419. [DOI] [PubMed] [Google Scholar]
- 43.Heilman RL, Smith ML, Kurian SM, et al. Transplanting kidneys from deceased donors with severe acute kidney injury. Am J Transplant. 2015;15(8):2143–2151. [DOI] [PubMed] [Google Scholar]
- 44.Klein R, Galante NZ, de Sandes-Freitas TV, de Franco MF, Tedesco-Silva H, Medina-Pestana JO. Transplantation with kidneys retrieved from deceased donors with acute renal failure. Transplantation. 2013;95(4):611–616. [DOI] [PubMed] [Google Scholar]
- 45.Ugarte R, Kraus E, Montgomery RA, et al. Excellent outcomes after transplantation of deceased donor kidneys with high terminal creatinine and mild pathologic lesions. Transplantation. 2005;80(6):794–800. [DOI] [PubMed] [Google Scholar]
- 46.Farney AC, Rogers J, Orlando G, et al. Evolving experience using kidneys from deceased donors with terminal acute kidney injury. J Am Coll Surg. 2013;216(4):645–655;discussion 655-646. [DOI] [PubMed] [Google Scholar]
- 47.Liu C, Hall IE, Mansour S, Thiessen Philbrook HR, Jia Y, Parikh CR. Association of deceased donor acute kidney injury with recipient graft survival. JAMA Netw Open. 2020;3(1):e1918634. [DOI] [PMC free article] [PubMed] [Google Scholar]
- 48.Cohen JB, Shults J, Goldberg DS, Abt PL, Sawinski DL, Reese PP. Kidney allograft offers: predictors of turndown and the impact of late organ acceptance on allograft survival. Am J Transplant. 2018;18(2):391–401. [DOI] [PMC free article] [PubMed] [Google Scholar]
- 49.Choubey AP, Mitro G, Siskind EJ, et al. Variations in DCD procurement procedures across Opos and their effects on liver transplant outcomes. Am J Transplant. 2019;19(Suppl 3). [Google Scholar]
- 50.Anil Kumar MS, Khan SM, Jaglan S, et al. Successful transplantation of kidneys from deceased donors with acute renal failure: three-year results. Transplantation. 2006;82(12):1640–1645. [DOI] [PubMed] [Google Scholar]
Associated Data
This section collects any data citations, data availability statements, or supplementary materials included in this article.
Supplementary Materials
Data Availability Statement
The data that support the findings of this study are available via request to the Organ Procurement and Transplantation Network (OPTN).