

Abstract
Background:
Mechanical hyperalgesia and allodynia incidence varies considerably among neuropathic pain patients. This study explored whether sensory or psychological factors associate with mechanical hyperalgesia and brush allodynia in a human experimental model.
Methods:
Sixty-six healthy volunteers (29 male) completed psychological questionnaires and participated in two quantitative sensory testing (QST) sessions. Warmth detection threshold (WDT), heat pain threshold (HPT) and suprathreshold mechanical pain (STMP) ratings were measured before exposure to a capsaicin-heat pain model (C-HP). After C-HP exposure, brush allodynia and STMP were measured in one session, while mechanical hyperalgesia was measured in another session.
Results:
WDT and HPT measured in sessions separated by one month demonstrated significant, but moderate levels of reliability (WDT: ICC=0.5, 95%CI[0.28,0.77]; HPT: ICC=0.62, 95%CI[0.40,0.77]). Brush allodynia associated with lower WDT (z=−3.06, p=0.002; ϕ=0.27). Those with allodynia showed greater hyperalgesia intensity (F=7.044, p=0.010, ηp2=0.107) and area (F=9.319, p=0.004, ηp2=0.163) than those without allodynia. No psychological self-report measures were significantly different between allodynic and non-allodynic groups. Intensity of hyperalgesia in response to lighter mechanical stimuli was associated with lower HPT, higher STMP ratings, and higher Pain Sensitivity Questionnaire scores at baseline. Hyperalgesia to heavier probe stimuli associated with state anxiety and to a lesser extent somatic awareness. Hyperalgesic area associated with lower baseline HPT and higher STMP ratings. Hyperalgesic area was not correlated with allodynic area across individuals.
Conclusions:
These findings support research in neuropathic pain patients and human experimental models that peripheral sensory input and individual sensibility are related to development of mechanical allodynia and hyperalgesia during central sensitization, while psychological factors play a lesser role.
Keywords: quantitative sensory testing, mechanical allodynia, sensory sensitivity, hyperalgesia, state anxiety, capsaicin
Introduction
Neuropathic pain, a major health-care problem worldwide, is characterized by spontaneous pain, hyperalgesia, and allodynia (Jensen and Finnerup 2014). Hyperalgesia is an increased response to normally painful stimulation, while allodynia refers to the phenomenon in which a normally innocuous stimulus evokes a painful sensation. However, there is great inter-individual variability in the expression of hyperalgesia and allodynia in both experimental and clinical settings (Liu et al., 1998; Lotsch et al., 2015; Maier et al., 2010). Identifying predictors and associated factors for the development and severity of hyperalgesia and allodynia would help to pinpoint neuropathic pain mechanisms and provide guidance for the individual treatment of neuropathic pain.
The experience of pain is complex, with physiological, psychological, social and cultural elements as influencing factors (Diatchenko et al., 2006). Individual differences in acute pain sensitivity are large and can be related to clinical pain expression. For instance, some measures of acute pain sensitivity pre-operatively have been shown to be related to the degree of post-operative pain (Werner et al., 2010). Few studies have examined the extent to which premorbid pain sensitivity is related specifically to mechanical hyperalgesia and allodynia. Heat pain sensitivity has been found to correlate with experimentally induced mechanical allodynia area (Hansen et al., 2017; Martucci et al., 2012). Additionally, some studies have shown that Pain Sensitivity Questionnaire (PSQ) scores can predict postoperative pain (Rehberg et al., 2017; Ruscheweyh et al., 2017; Valeberg et al., 2016). To our knowledge, no studies have examined the relationship between PSQ scores and mechanical hyperalgesia or allodynia susceptibility. Furthermore, psychological factors are associated with the pain experience, particularly in clinical pain. Some studies have reported that pain catastrophizing predicts persistent postoperative pain (Guimaraes-Pereira et al., 2016; Hirakawa et al., 2014; Jarrell et al., 2014; Papaioannou et al., 2009), but other studies failed to find that relationship (Finnerup et al., 2016; Hovik et al., 2016). Similarly, anxiety and depression have been found to predict postoperative pain (Daly et al., 2017; Thomazeau et al., 2016a; b). One study has shown that herpes zoster patients with more severe anxiety and depression were more likely to develop neuropathic pain, while being independent of the presence of allodynia (Volpi et al., 2008).
To investigate the contribution of baseline sensory sensitivity and psychological factors to the development of hyperalgesia and allodynia secondary to central sensitization, we employed an optimized topical capsaicin-heat pain (C-HP) model (Anderson et al., 2002; Meeker et al., 2019). Models involving capsaicin co-application with heat have been applied to healthy subjects to mimic the clinical manifestation of neuropathic pain by inducing spontaneous burning pain, mechanical hyperalgesia, and brush allodynia (Cavallone et al., 2013; Dirks et al., 2003). Both capsaicin and heat activate the transient receptor potential cation channel subfamily vanilloid member 1 (TRPV1) receptor potentiating peripheral and central sensitization leading to hyperalgesia and allodynia (Caterina et al., 1997; Tominaga et al., 1998). Previous experimental evidence in humans and other primates has demonstrated robust evidence supporting that capsaicin application can induce sensitization of spinal dorsal horn neurons in naïve healthy subjects (Simone et al., 1991b; Torebjork et al., 1992).
In the present study, we assessed several sensory and psychological factors prior to the application of the C-HP model. Our aim was to identify what factors would be associated with the development of post-C-HP mechanical hyperalgesia and brush allodynia. Consistent with previous findings, we predicted sensory sensitivity and state anxiety would be related to intensity and extent of hyperalgesia (Benedetti et al., 2006; Janssen et al., 1998; Sharma et al., 2010; Volpi et al., 2008). In contrast, we predicted allodynia development would only be related to thermal sensitivity. We expected, given the differentiation of these underlying factors that there would be no or only a limited relationship between mechanical hyperalgesia and allodynia. Finally, we used the multi-session design of our experiment to test the reproducibility and reliability of thermal detection thresholds (Andersen et al., 2015; Felix and Widerstrom-Noga 2009; Knutti et al., 2014).
Methods
Subjects
Study subjects were recruited by advertisement in and around the University of Maryland Baltimore community. Ninety-one healthy, pain-free individuals (50 females, 41 males, range: 18–43 years) were screened according to inclusion and exclusion criteria listed in Table 1. This research was approved by University of Maryland Baltimore, Institutional Review Board for the Protection of Human Subjects.
Table 1.
Inclusion and exclusion criteria
| Inclusion criteria | Exclusion criteria |
|---|---|
| 18-44 years of age | Major medical, neurological, or chronic pain disorders. |
| Any psychiatric condition requiring medication (e.g. depression, anxiety disorder, ADHD, borderline personality disorder) or hospitalization within the last 5 years (e.g. suicide attempts). | |
| Any centrally acting medication (e.g. anti-depressants, medication for ADHD, etc.). | |
| Any illegal drug use; marijuana use within the last month. | |
| Non-removable piercings or tattoos not done by a professional tattoo artist (e.g. prison tattoos), tattoos above ankle and below knee (left leg). | |
| Pregnancy. | |
| Any surgery planned within the next 6 months. | |
| Any major incisional surgery during the last 6 months requiring hospitalization. | |
| Allergy to capsaicin or chili peppers. | |
| Previous exposure to capsaicin according to these specifications: 1) within last 6 months for more than one study-related capsaicin use, or 2) within last 3 months for 1 study related capsaicin use, or 3) within last 2 months for OTC capsaicin use. |
Study Design
Overview
After providing informed consent, subjects completed four questionnaires: Pain Catastrophizing Scale (PCS), State-Trait Anxiety Inventory (STAI), Center for Epidemiological Studies-Depression Scale (CES-D) and PSQ. Subsequently, subjects took part in two consecutive sessions (sessions A and B) approximately one month apart (Fig. 1a). Half of the subjects were assigned to session A first, while the rest experienced session B first, determined by random allocation. Subjects completed the state version of the STAI during both session A and B just before capsaicin application.
Fig. 1.
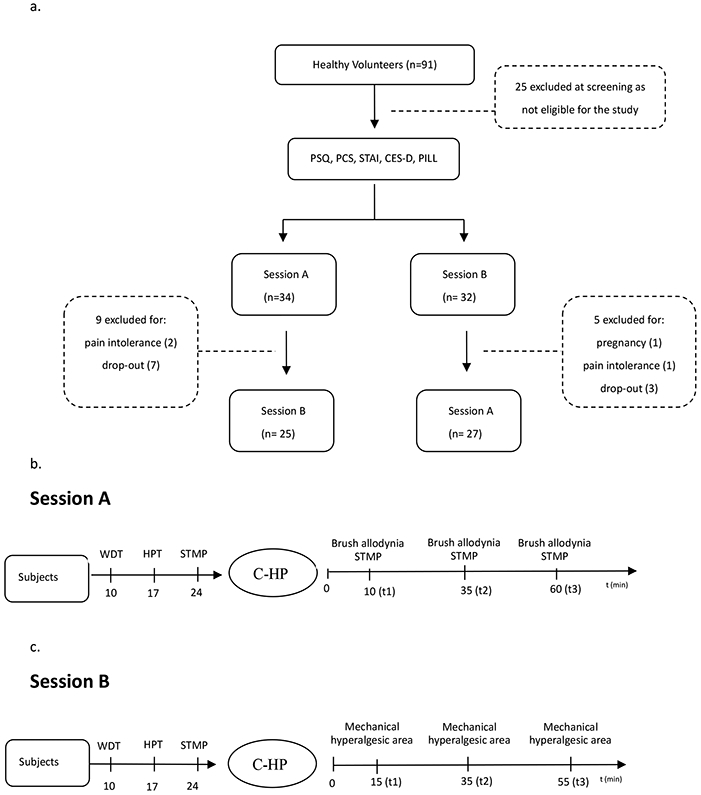
a: Flow-chart of subjects through the study. b: Procedure of session A. c: Procedure of session B. C-HP: topical capsaicin-heat pain model. PCS: Pain Catastrophizing Scale. STAI: State-Trait Anxiety Inventory. CES-D: Center for Epidemiological Studies-Depression Scale. PSQ: Pain Sensitivity Questionnaire. WDT: Warmth detection threshold. HPT: Heat pain threshold. STMP: Suprathreshold mechanical pain.
Session A:
Prior to C-HP exposure, a grid was drawn on the subject's left leg for Quantitative Sensory Testing (QST) with reference to the location of later capsaicin exposure. Then, warmth detection threshold (WDT), heat pain threshold (HPT) and suprathreshold mechanical pain (STMP) ratings were collected. Following this, the C-HP model was applied for 35 minutes, during which pain intensity ratings were collected every minute. After capsaicin removal, presence and area of brush allodynia and STMP ratings were measured starting at three post-capsaicin time points (t): 10 min (t1), 35 min (t2) and 60 min (t3; Fig. 1b).
Session B:
The same grid was drawn on the subject's left leg. Then, WDT, HPT and STMP were performed on the same areas as session A. After capsaicin removal, the area of mechanical hyperalgesia was determined at three post-capsaicin time points: 15 min (t1), 35 min (t2) and 55 min (t3) (Fig. 1c).
Drawing the grid
An acetate template sheet, which contained 8 grid lines with multiple evenly spaced dots, was placed on the subject's left leg over the thickest part of the tibialis anterior muscle (within 5 cm of the front most part of the shin). The dots of the grid were transposed to the leg using a Sharpie marker. Then, the sheet was removed and blue boxes, indicating testing sites, were drawn as on the leg (Fig. 2).
Fig. 2.

Grid was drawn on the subject's left leg. There are 8 radial grid lines, with dots at 1cm intervals (X- and Y-axes) or 1.4cm intervals (diagonal directions). The blue boxes are stimulation sites for suprathreshold mechanical pain testing (STMP). The numbers are the order of probing sites for STMP, which are at least 1 cm outside of the capsaicin exposure zone.
Capsaicin application
A Tegaderm bandage with a 2.5 cm x 2.5 cm aperture was placed on a subject’s left leg to prescribe the capsaicin exposure site. Then, approximately one gram of a 10% capsaicin cream was applied to the opening of the bandage. This capsaicin cream was compounded as 10% capsaicin by weight in a hydrophilic base vehicle at Professional Arts Pharmacy, Baltimore, MD, USA (Anderson et al., 2002). Another Tegaderm was placed on top of the cream to prevent evaporation, and to allow the heating thermode to be placed over the exposure site safely. Then, a thermode (3×3 cm2 thermo-conducting surface (Pathway, MEDOC Inc., Israel) was placed over the exposure site. For the first 15 min the thermode was held at a baseline temperature (32°C) and then it ramped up to a predetermined target temperature (between 37°C and 42°C), so as to be below the individual’s heat pain threshold. Then at five-minute intervals, the temperature increased by 0.5°C and held at that newer level, until completing 35 minutes of heat exposure. After that, the thermode and bandage were removed, and the cream was thoroughly removed with isopropanol pads.
Quantitative Sensory Testing
Warmth detection threshold (WDT)
The WDT was measured using a Pathway (MEDOC Inc., Israel) thermal sensory testing device with a thermode of Peltier elements (3×3 cm2 thermo-conducting surface; ramp up maximum temperature of 50°C). The thermode was placed on the subject's left leg over the thickest part of the tibialis anterior muscle (center of the grid). The thermode held a 32°C baseline temperature, and then gradually increases temperature at 0.5°C/s. Subjects were instructed to click a computer mouse when they first detected a change in temperature. This sequence was repeated for a total of four times. The mean threshold temperature of these four consecutive measurements was calculated as the WDT.
Heat pain threshold (HPT)
Following the WDT determination, the HPT was measured in a similar manner. One difference was that the baseline temperature was 30°C, to allow for a suitably low baseline temperature for post-capsaicin HPT measures. Subjects were instructed to click the computer mouse when they first felt a painful sensation. This sequence was repeated for a total of four times. The mean threshold temperature of these four consecutive measurements was calculated.
Suprathreshold mechanical pain (STMP) ratings
A set of four weighted probes (exerting 64, 128, 256 and 512mN force with a flat circular tip of 0.2 mm diameter) was used to apply sharp, non-penetrating mechanical stimuli. Stimuli were applied on the 8 points indicated in the blue boxes placed approximately 1 cm outside the area of capsaicin exposure (Fig. 2). Each probe force was applied in a random order, three times each, moving clockwise around the 8 boxes for each stimulus. Each probe was placed for 1 second, then the subject provided a rating of pain intensity on a 0-100 scale, with “0” indicating no pain at all, and “100” indicating the most intense pain imaginable). A 15-second interval separated each trial. A baseline assessment was conducted prior to C-HT exposure, and three subsequent assessments were conducted, as described above. Hyperalgesia intensity was calculated as STMP (post C-HP) – STMP (pre C-HP) separately for each probe force and each post C-HP time point.
Hyperalgesic area
Hyperalgesic area testing was carried out 15 min after the capsaicin removal in session B. The 128mN probe was used to apply stimuli along each grid line from the periphery towards the center of the grid. On each dot, the probe was applied for 2 second on and 5 second off. The point was marked on the grid line where the subject reported a distinct increase in pain compared to the previous stimulation. A line was marked at the edge of the capsaicin exposure site if there was no change until the probe reached the center grid point. This procedure was repeated for all eight grid lines. Then, the pattern was transferred to an acetate sheet. The endpoints of the eight marked lines were connected with each other to form a polygon. A paper copy of the acetate sheet was made, the polygon was cut out of the paper and this piece of paper was weighed. The weight of a standard area of the same type of paper served to convert the weight of the cut-out piece of paper to an area (Bohannon and Pfaller 1983; Dimbat et al., 1956; Gaul 1966; Wolf and Gollob 1980). This paper standard was cut from 147 different pieces of paper by the same person (TJM) and the coefficient of variation over these 147 measurements was 3.78%.
Brush allodynia testing
Brush allodynia testing was initially carried out 10 minutes after capsaicin removal during Session A. A standardized brush exerting 200 to 400 mN force (Somedic SenseLab, Sweden) was used to trace each grid line from the periphery toward the center at a rate of about 2 cm per second (Rolke et al., 2006). Prior results have demonstrated this is an effective and simple method for reproducible measurement of brush allodynia that produces peak activity in tactile C-fiber afferents (Liu et al., 1998; Löken et al., 2009). The point where the subject reported sharp or pain was marked on the grid line. This procedure was repeated for all 8 grid lines. The subject was considered to have brush allodynia if at least one marked point was located outside the capsaicin exposure area. The subject was considered to have no allodynia if no pain or sharpness was reported, or all marked points were located within the capsaicin exposure area. If a subject demonstrated allodynia, the area of allodynia was determined by the same method as the area of hyperalgesia, as described above. By this method, we categorized subjects as allodynic or non-allodynic.
Pain Sensitivity Questionnaire (PSQ)
The PSQ assesses an individual’s understanding of his/her pain sensitivity by rating how painful specific experiences are (Ruscheweyh et al., 2009). The 17-item survey can be separated into two subscales – minor and moderate – reflecting the general level of expected pain for each item, along with three normally non-painful items. Test-retest reliability for the PSQ has been reported as adequate with intraclass correlations of 0.83 over intervals of 1 to 3 weeks. Internal consistency for the PSQ is high, with Cronbach’s alphas of greater than .90 for PSQ-total and PSQ-moderate.
Psychological Measures
Pain Catastrophizing Scale (PCS)
The PCS comprises 13 self-reported items to describe the thoughts and feelings of an individual when experiencing pain (Sullivan et al., 1995). It uses a 5-point scale for each item, from 0 (not at all) to 4 (most severely). The PCS contains three subscales: rumination, magnification and helplessness. The PCS has adequate to very good internal consistency with Cronbach’s alphas ranging from .66 to .87 across subscales. Previously reported test-retest reliability for the PCS has indicated a high degree of stability across 6 weeks with an r=0.75.
State-Trait Anxiety Inventory (STAI)
The STAI comprises 40 self-reported items (Spielberger 1983). Items 1-20 evaluate state anxiety (STAI-S), while items 21-40 assess trait anxiety (STAI-T). It uses a 4-point scale for each item, from 1 (not at all) to 4 (very much so). Test-retest reliability for the Trait Anxiety Scale has been reported as adequate, ranging from 0.73 to0 .86 over intervals of 20 to 104 days . Internal consistencies for both the state and trait parts of the STAI are high, with Cronbach’s alphas of greater than 0.90.
Center for Epidemiological Studies-Depression Scale (CES-D)
The CES-D comprises 20 self-reported items to measure the level of depressive symptomatology during the past week (Radloff 1977). It includes six subscales: depressed mood; feelings of guilt and worthlessness; feelings of helplessness and hopelessness; psychomotor retardation; loss of appetite; and sleep disturbance. It uses a 4-point scale for each item, from 0 (rarely) to 3 (most). The CES-D has high internal consistency (Cronbach’s alpha = 0.90) and adequate test-retest reliability (0.67 over 4 weeks).
Pennebaker Inventory of Limbic Languidness (PILL)
The PILL is considered an indicator of somatic awareness (Pennebaker 1982). It comprises 54 self-reported items, which assesses the frequency of reporting common physical symptoms and sensations, such as racing heart, headaches and coughing. It uses a 5-point scale for each item, from 0 (have never or almost never experienced the symptom) to 4 (more than once every week). The PILL has high internal consistency (Cronbach’s alpha = .88) and adequate test-retest reliability (0.70 over 2 months).
Statistical Analysis
Baseline differences between the allodynia and no-allodynia groups were evaluated with independent t-tests (for normally distributed data) or the Mann-Whitney U test for non-normally distributed data. For these analyses, baseline data were used from the same session that allodynia was measured (Session A). Tests for changes in measures over time employed repeated-measures or mixed effects ANOVA, as appropriate. Effect size measures are reported as Cohen’s d (d) for normally distributed data, the Mann-Whitney parameter (ϕ) for non-normally distributed data and partial eta2 (ηp2) for results from ANOVAs. Following rules of thumb provided as general guidelines by Cohen 1988 and Newcombe 2006, a small effect corresponds to d=0.2, ϕ≤0.45 or ≥0.55, and ηp2=0.01; whereas a medium effect corresponds to d=0.5, ϕ≤0.36 or ≥0.64, and ηp2=0.09; and a large effect corresponds to d=0.8, ϕ≤0.29 or ≥0.71, and ηp2=0.25. It must be noted these guidelines, like the guidelines for p-values, are arbitrary and subject to test assumptions, sample size, context and practical effect interpretation (Fisher 1948; Wasserstein and Lazar 2016).
For WDT and HPT data, we removed outliers that were 3 standard deviations from the mean for each set of HPTs and WDTs from session A or B. Of the warmth detection thresholds, one subject’s WDT value was excluded because their average WDT was 47.1 °C. Of the heat pain thresholds 10 of 119 values, across 8 different subjects, were deemed outliers and additional 2 of 119 values were completely discarded because of testing or recording failure. The range of these outliers was 31.8 to 34.3 °C, which is within one standard deviation of average skin at room temperature (Deltombe et al., 1998; Haeger and Bergman 1963).
After the exclusion of outliers, reliability of HPT and WDT values across sessions were examined using a two-way random effects intraclass correlation (ICC) with absolute agreement and Bland-Altman plots. The ICC and Bland-Altman plots were generated using R version 3.6.3 software. Data for both analyses ICC and Bland-Altman plots consisted only of subjects who attended both data from both A and B sessions.
Linear mixed models (LMMs) were used to investigate the role of QST measures (collected during the same session, Session A) as a predictor of mechanical hyperalgesia intensity (STMP ratings post-pre C-HP exposure). Finally, LMMs were used to investigate the role of PSQ self-report, STAI-S/T, CES-D, PCS and PILL scores as predictors of mechanical hyperalgesia intensity. A separate LMM was used for each probe force and treated subject as a random factor and each individual predictor (e.g., baseline WDT, STAI-S), time as a fixed effect. Time was modeled as a fixed directional effect (i.e., time was specifically modeled as with t1 as a ‘baseline’ and only posthoc comparisons in correct order would be tested such as t1-t2, t2-t3 and t1-t3) (Galecki and Burzykowski 2013). Effect size estimations for LMMs are still in their developmental infancy, therefore we do not directly report effect for results from the LMMs. Mechanical hyperalgesic area was tested for significant correlations with baseline values collected during the same session (Session B). If the data were normally distributed for a given analysis, Pearson correlation was calculated. If the data were not normally distributed for either variable, Spearman correlation was calculated. Data are displayed both in terms of unadjusted significance levels at p<0.05, and indicating significance after adjustment for multiple statistical tests using an omnibus Adaptive False Discovery Rate (FDR) approach (Benjamini and Hochberg 2000). Specifically, the AFDR adjustment took into account every statistical test reported in this paper, unless otherwise stated.
Associations between measures of hyperalgesia and allodynia were evaluated using ANOVAs, which assessed 1) hyperalgesic magnitude as a function of allodynic group, stimulus intensity, and time post C-HP, 2) hyperalgesic area as a function of allodynic group and time, and 3) allodynic area as a function of time. Statistical tests were performed using SPSS Statistics 24.0 software (IBM, USA) and R version 3.6.3 software.
Results
Ninety-one individuals were screened, of which 66 were found eligible. During the study, 14 subjects withdrew or became ineligible, leaving 52 subjects completing the entire protocol, 9 subjects completed only session A, while 5 completed only session B (Fig. 1a).
For the subjects completing both sessions A and B, the intraclass correlation results for WDT (n=51) and HPT (n=47) revealed significant, though moderate levels of reliability across sessions (WDT: ICC=0.53, p=2.64x10⁻⁵, 95%CI [0.30,0.77]; HPT: ICC=0.62, p=2.84×10⁻⁶, 95%CI [0.40,0.77]).
Bland Altman-plots show 90% of WDT values (mean (M) diff = 0.22, 95%CI [−0.55,0.97]) and 94% of the HPT values (M diff=0.48, 95%CI [−0.38,1.35]) lie within 1.96 times the standard deviation of the mean difference between the sessions (Fig 3).
Fig. 3.

Bland-Altman plot of (a) WDT (n=51) and (b) HPT (n=47).
Finally, subjects that completed both sessions demonstrated higher STAI state anxiety scores (Wilcoxon signed-rank test: V=271.5; p=0.024) at baseline during their second session (n=52, median=27, IQR=12.5) when compared to their first session (n=52, median=24, IQR=7).
1. Baseline factors associated with brush allodynia
Of the 61 subjects completing session A, 30 developed brush allodynia after capsaicin treatment. There was no group difference in the sex (χ2=0.013, p=0.909), age (t=0.334, p=0.740 and race (Fisher Exact Test, p=0.943) between the allodynic (A) and non-allodynic (NA) groups (Table 2).
Table 2.
Demographic characteristics
| Non-Allodynic group | Allodynic group | |
|---|---|---|
| Sample size | 31 | 30 |
| Gender | ||
| Male | 13 (41.9%) | 14 (46.7%) |
| Female | 18 (58.1%) | 16 (53.3%) |
| Age (year) | 27.4±5.9 | 26.9±6.3 |
| Race | ||
| Asian | 6 (19.4%) | 7 (23.3%) |
| Black | 7 (22.6%) | 8 (26.7%) |
| White | 15 (48.4%) | 13 (43.3%) |
| Other | 3 (9.7%) | 2 (6.7%) |
There was no group difference in the sex, age and race between the allodynic and non-allodynic groups.
Chi-Square, independent t-test, and Fisher Exact Test. p>0.05.
(a). Baseline QST parameters
WDT (Mann-Whitney, z=−3.06, p=0.002; ϕ=0.27) was significantly lower for the A group (median (Mdn)=35.80, interquartile range (IQR)=3.70) than the NA group (Mdn=38.80, IQR=4.65) (Fig. 4a, b). HPT was not different between A group (mean (M)=41.57, standard deviation (SD)=2.97) and NA group (M=43.24, SD=3.12), after AFDR correction (t=−2.05, p=0.045; d=−0.55). There was no group difference in pre-exposure STMP ratings between NA and A groups (Mann-Whitney U tests: 64mN probe [NA: Mdn=0.00, IQR=1.20; A: Mdn=2.85, IQR=4.35], z=2.48, p=0.013, ϕ=0.67; 128mN probe [NA: Mdn=1.30, IQR=8.15; A: Mdn=5.15, IQR=9.17], z=1.94, p=0.053, ϕ=0.64; 256mN probe [NA: Mdn=4.00, IQR=14.15; A: Mdn=7.35, IQR=17.23], z=1.02, p=0.31,ϕ=0.58; 512mN probe [NA: Mdn=7.00, IQR=14.85; A: Mdn=11.85, IQR=27.10], z=1.67, p=0.095, ϕ=0.62, Fig. 4c, d). Also, there was no significant group difference in PSQ scores, for either subscale or the total score (Total [NA: M=3.97, SD=1.60; A: M=3.84, SD=1.29], t=−0.35, p=0.73, d=−0.09; Moderate [NA: Mdn=4.57, IQR=2.57; A: Mdn=4.43, IQR=1.89], z=−0.32, p=0.75, ϕ=0.48; Minor [NA: Mdn=2.86, IQR=1.79; A: Mdn=2.64, IQR=1.93], z=0.07, p=0.95, ϕ=0.50) (Fig. 4e).
Fig. 4.

Comparison of baseline (a) WDT (uncorrected p=0.002, significant after AFDR-correction), (b) HPT (uncorrected p=0.045), (c, d) STMP (not significant differences between A and NA groups), (e) PSQ scores (p=0.73) between non-allodynic and allodynic groups in session A (all n’s =61). WDT: Warmth detection threshold. HPT: Heat pain threshold. STMP: Suprathreshold mechanical pain. PSQ: Pain Sensitivity Questionnaire. NA = Non-Allodynic, A = Allodynic.
(b). Psychological parameters
There was no statistically significant difference observed between A and NA groups for any of the psychological measures (Mann-Whitney U tests): PCS [NA: Mdn=7, IQR=10; A: Mdn=9, IQR=10.75], z=−0.09, p=0.93,ϕ=0.49; CES-D [NA: Mdn=3.00, IQR=4.00; A: Mdn=4.00, IQR=5.75], z=1.01, p=0.31, ϕ=0.57; STAI state anxiety [NA: Mdn = 24.5, IQR=10.50; A: Mdn = 26, IQR=6.75], z=−0.23, p=0.82, ϕ=0.48; STAI trait anxiety [NA: Mdn=27, IQR=11.50; A: Mdn=29, IQR=11.00], z=0.48, p=0.63, ϕ=0.54; PILL [NA: Mdn=23, IQR=17.00; A: Mdn=32.5, IQR=24.25] z=1.70, p=0.089, ϕ=0.63) (Fig. 5a-d).
Fig. 5.

Comparison of (a) PCS (p=0.93), (b) CES-D (p=0.31), (c) STAI (State p=0.82; Trait p=0.63), (d) PILL (p=0.089) between allodynic and non-allodynic groups in session A (all n’s =61). PCS: Pain Catastrophizing Scale. CES-D: Center for Epidemiological Studies-Depression Scale. STAI: State-Trait Anxiety Inventory. PILL: Pennebaker Inventory of Limbic Languidness NA = Non-Allodynic, A = Allodynic.
2. Baseline factors associated with mechanical hyperalgesia
(a). Baseline QST parameters
Intensity of mechanical hyperalgesia (pain intensity rating increases from pre- to post-C-HP exposure) for each probe force was modeled in a set of linear mixed models including the prospective QST or PSQ predictor and time as fixed effects with subject as a random effect. Neither the main effects of WDT (F<2.63, p>0.11) nor the WDT by time interactions (F<1.48, p>0.24) were statistically significant (Table 3). Therefore, there was no evidence of baseline WDT associating with intensity of mechanical hyperalgesia for any probe force. The main effect of HPT for the 64mN probe mechanical hyperalgesia intensity passed AFDR correction (F=10.43, p=0.002), while HPT effects for the 128mN, 256mN and 512mN probe mechanical hyperalgesia intensities were not significant (F<1.69, p>0.20) (Table 3). HPT by time interactions were not significant for any probe force (F<1.80, p>0.17) (Table 3). Therefore, baseline HPT was associated with the magnitude of mechanical hyperalgesia intensity for the lowest force probe. There was no evidence of association with greater probe forces.
Table 3.
QST measures associated with hyperalgesia intensity
| Dependent Measure | Factor | F_value | p | Factor | F_value | p | |
|---|---|---|---|---|---|---|---|
| STMP 64 mN △ | WDT | 2.618 | 0.111 | WDT:time | 1.465 | 0.235 | |
| STMP 128 mN △ | WDT | 1.248 | 0.269 | WDT:time | 0.054 | 0.947 | |
| STMP 256 mN △ | WDT | 1.598 | 0.211 | WDT:time | 0.331 | 0.719 | |
| STMP 512 mN △ | WDT | 0.116 | 0.734 | WDT:time | 0.714 | 0.492 | |
| STMP 64 mN △ | HPT | 10.434 | 0.002 ** | HPT:time | 1.782 | 0.173 | |
| STMP 128 mN △ | HPT | 1.677 | 0.201 | HPT:time | 0.937 | 0.395 | |
| STMP 256 mN △ | HPT | 1.040 | 0.312 | HPT:time | 0.482 | 0.619 | |
| STMP 512 mN △ | HPT | 0.000 | 0.998 | HPT:time | 0.195 | 0.823 | |
| STMP 64 mN △ | STMP64 | 7.435 | 0.008 ** | STMP64:time | 1.369 | 0.258 | |
| STMP 64 mN △ | STMP128 | 23.734 | <0.001 ** | STMP128:time | 4.867 | 0.009 ** | |
| interaction | estimate | t | p | ||||
| STMP128*time_t1-t2 | −0.242 | −2.338 | 0.021* | ||||
| STMP128*time_t1-t3 | −0.307 | −2.958 | 0.004 ** | ||||
| STMP128*time_t2-t3 | −0.064 | −0.620 | 0.536 | ||||
| STMP 64 mN △ | STMP256 | 10.187 | 0.002 ** | STMP256:time | 7.175 | 0.001 ** | |
| interaction | estimate | t | P | ||||
| STMP256*time_t1-t2 | −0.115 | −1.767 | 0.08 | ||||
| STMP256*time_t1-t3 | −0.247 | −3.785 | <0.001 ** | ||||
| STMP256*time_t2-t3 | −0.132 | −2.018 | 0.046* | ||||
| STMP 64 mN △ | STMP512 | 23.927 | <0.001 ** | STMP512:time | 6.947 | 0.001 ** | |
| interaction | estimate | t | P | ||||
| STMP512*time_t1-t2 | −0.069 | −1.405 | 0.163 | ||||
| STMP512*time_t1-t3 | −0.182 | −3.692 | <0.001 ** | ||||
| STMP512*time_t2-t3 | −0.113 | −2.287 | 0.024* | ||||
| STMP 128 mN △ | STMP64 | 5.993 | 0.017* | STMP64:time | 4.333 | 0.015* | |
| interaction | estimate | t | p | ||||
| STMP64*time_t1-t2 | −0.730 | −2.178 | 0.031* | ||||
| STMP64*time_t1-t3 | 0.210 | 0.626 | 0.532 | ||||
| STMP64*time_t2-t3 | 0.939 | 2.804 | 0.006 ** | ||||
| STMP 128 mN △ | STMP128 | 0.025 | 0.874 | STMP128:time | 1.096 | 0.338 | |
| STMP 128 mN △ | STMP256 | 0.454 | 0.503 | STMP256:time | 0.879 | 0.418 | |
| STMP 128 mN △ | STMP512 | 1.848 | 0.179 | STMP512:time | 0.862 | 0.425 | |
| STMP 256 mN △ | STMP64 | 0.431 | 0.514 | STMP64:time | 1.986 | 0.142 | |
| STMP 256 mN △ | STMP128 | 0.088 | 0.768 | STMP128:time | 0.203 | 0.817 | |
| STMP 256 mN △ | STMP256 | 1.219 | 0.274 | STMP256:time | 0.443 | 0.643 | |
| STMP 256 mN △ | STMP512 | 0.089 | 0.767 | STMP512:time | 0.181 | 0.834 | |
| STMP 512 mN △ | STMP64 | 0.343 | 0.56 | STMP64:time | 4.915 | 0.009 ** | |
| interaction | estimate | t | p | ||||
| STMP64*time_t1-t2 | −0.496 | −1.560 | 0.122 | ||||
| STMP64*time_t1-t3 | 0.501 | 1.576 | 0.118 | ||||
| STMP64*time_t2-t3 | 0.997 | 3.135 | 0.002 ** | ||||
| STMP 512 mN △ | STMP128 | 0.320 | 0.574 | STMP128:time | 0.913 | 0.404 | |
| STMP 512 mN △ | STMP256 | 0.635 | 0.429 | STMP256:time | 2.517 | 0.085 | |
| STMP 512 mN △ | STMP512 | 0.906 | 0.345 | STMP512:time | 0.469 | 0.627 |
STMP: Suprathreshold mechanical pain. STMP△ [(post-capsaicin)-t0] = STMP t(post-capsaicin)-STMP t0. Post-capsaicin values calculated for 3 time points: t1-t0, t2-t0, and t3-t0. WDT: Warmth detection threshold. HPT: Heat pain threshold.
Significant at p<0.05.
Significant at q<0.05. Values highlighted in bold are significant after AFDR correction.
The main effect of 64mN probe STMP for the 64mN probe mechanical hyperalgesia intensity passed AFDR correction (F=7.44, p=0.008), while effects for the 128mN, 256mN and 512mN probe mechanical hyperalgesia intensities were not significant (128mN: F=5.99, p=0.017; 256/512mN F<0.44; p>0.50) after AFDR correction (Table 3). The baseline 64mN probe STMP by time interaction was significant after AFDR correction for the 512mN probe force (F=4.91, p=0.009), while time interaction effects with the 64mN probe STMP for 128mN, 256mN and 512mN mechanical hyperalgesia intensities were not significant (128mN: F=4.33, p=0.015; 64/256mN F<2.00; p>0.13) after AFDR correction (Table 3). Therefore, baseline 64mN probe STMP was associated with the magnitude of mechanical hyperalgesia intensity for the lowest force probe and the time by probe force interaction for the 512mN probe. There was no evidence of any association with the 128/256mN probe forces.
The main effect of 128mN probe STMP for the 64mN probe mechanical hyperalgesia intensity passed AFDR correction (F=23.73, p<0.001), while effects for the 128mN, 256mN and 512mN probe mechanical hyperalgesia intensities were not significant (F<0.33, p>0.56) (Table 3). The baseline 128mN probe STMP by time interaction was significant after AFDR correction for the 64mN probe force (F=4.87, p=0.009), while time interaction effects with the 128mN, 256mN and 512mN probe mechanical hyperalgesia intensities were not significant (F<1.11, p>0.33) (Table 3). Therefore, baseline 128mN probe STMP was positively associated with the magnitude of mechanical hyperalgesia intensity and the time by probe force interaction for the 64mN force probe. There was no evidence of any association with greater probe forces.
The main effect of 256mN probe STMP for the 64mN probe mechanical hyperalgesia intensity passed AFDR correction (F=10.19, p=0.002), while effects for the 128mN, 256mN and 512mN probe mechanical hyperalgesia intensities were not significant (F<1.23, p>0.26) (Table 3). The baseline 256mN probe STMP by time interaction was significant after AFDR correction for the 64mN probe force (F=7.18, p=0.001), while time interaction effects with the 128mN, 256mN and 512mN probe mechanical hyperalgesia intensities were not significant (F<2.53, p>0.084) (Table 3). Therefore, baseline 256mN probe STMP was associated with the magnitude of mechanical hyperalgesia intensity and the time by probe force interaction for the 64mN force probe. There was no evidence of any association with greater probe forces.
The main effect of 512mN probe STMP for the 64mN probe mechanical hyperalgesia intensity passed AFDR correction (F=23.93, p<0.001), while effects for the 128mN, 256mN and 512mN probe mechanical hyperalgesia intensities were not significant (F<1.86, p>0.17) (Table 3). The baseline 512mN probe STMP by time interaction was significant after AFDR correction for the 64mN probe (F=6.95, p<0.001), while time interaction effects with the 128mN, 256mN and 512mN probe mechanical hyperalgesia intensities were not significant (F<0.87, p>0.42) (Table 3). Therefore, baseline 512mN probe STMP was associated with the magnitude of mechanical hyperalgesia intensity and the time by probe force interaction for the 64mN force probe. There was no evidence of any association on greater probe forces.
The main effect of PSQ moderate subscale scores on all probe forces for mechanical hyperalgesia intensities were not significant (F<2.63, p>0.10) (Table 4). The effect of PSQ moderate subscale score by time interaction was not significant after AFDR correction for the 512mN probe force (F=3.46, p=0.035), and not significant for the 64mN, 128mN and 256mN probe mechanical hyperalgesia intensities (F<2.37, p>0.09) (Table 4). Therefore, there was no evidence of any association of PSQ moderate subscale scores with hyperalgesia from any probe force.
Table 4.
PSQ measures associated with hyperalgesic magnitude
| Dependent Measure | Factor | F_value | p | Factor | F_value | p | |
|---|---|---|---|---|---|---|---|
| STMP 64 mN △ | PSQ.Moderate | 2.561 | 0.115 | PSQ.Moderate:time | 1.730 | 0.182 | |
| STMP 64 mN △ | PSQ.Minor | 3.034 | 0.087 | PSQ.Minor:time | 1.554 | 0.216 | |
| STMP 64 mN △ | PSQ.Total | 3.166 | 0.08 | PSQ.Total:time | 1.867 | 0.159 | |
| STMP 128 mN △ | PSQ.Moderate | 2.620 | 0.111 | PSQ.Moderate:time | 2.356 | 0.099 | |
| STMP 128 mN △ | PSQ.Minor | 9.558 | 0.003 ** | PSQ.Minor:time | 2.001 | 0.140 | |
| STMP 128 mN △ | PSQ.Total | 6.015 | 0.017* | PSQ.Total:time | 2.388 | 0.096 | |
| STMP 256 mN △ | PSQ.Moderate | 0.037 | 0.848 | PSQ.Moderate:time | 0.888 | 0.414 | |
| STMP 256 mN △ | PSQ.Minor | 1.753 | 0.191 | PSQ.Minor:time | 2.094 | 0.128 | |
| STMP 256 mN △ | PSQ.Total | 0.598 | 0.443 | PSQ.Total:time | 1.576 | 0.211 | |
| STMP 512 mN △ | PSQ.Moderate | 0.117 | 0.734 | PSQ.Moderate:time | 3.463 | 0.035* | |
| interaction | estimate | t | P | ||||
| PSQ.Moderate*time_t1-t2 | −1.306 | −2.056 | 0.042* | ||||
| PSQ.Moderate*time_t1-t3 | −1.558 | −2.451 | 0.016* | ||||
| PSQ.Moderate*time_t2-t3 | −0.251 | −0.396 | 0.693 | ||||
| STMP 512 mN △ | PSQ.Minor | 6.750 | 0.012* | PSQ.Minor:time | 8.503 | <0.001 ** | |
| interaction | estimate | t | p | ||||
| PSQ.Minor*time_t1-t2 | −1.882 | −2.809 | 0.006 ** | ||||
| PSQ.Minor*time_t1-t3 | −2.693 | −4.019 | <0.001 ** | ||||
| PSQ.Minor*time_t2-t3 | −0.811 | −1.210 | 0.229 | ||||
| STMP 512 mN △ | PSQ.Total | 2.145 | 0.148 | PSQ.Total:time | 6.285 | 0.003 ** | |
| interaction | estimate | t | p | ||||
| PSQ.Total*time_t1-t2 | −1.778 | −2.571 | 0.011* | ||||
| PSQ.Total*time_t1-t3 | −2.351 | −3.400 | 0.001 ** | ||||
| PSQ.Total*time_t2-t3 | −0.573 | −0.829 | 0.409 |
STMP: Suprathreshold mechanical pain. STMP△ [t(post-capsaicin)-t0] = STMP t(post-capsaicin)-STMP t0. Post-capsaicin values calculated for 3 time points: t1-t0, t2-t0, and t3-t0. PSQ: Pain Sensitivity Questionnaire.
Significant at p<0.05.
Significant at q<0.05. Values highlighted in bold are significant after AFDR correction.
The main effect of PSQ minor subscale scores for the 128mN probe mechanical hyperalgesia intensity passed AFDR correction (F=9.56, p<0.003), while effects for the 64mN, 256mN and 512mN probe mechanical hyperalgesia intensities were not significant (512mN: F=6.75, p=0.012; 64/256mN F<3.04; p>0.086) after the AFDR correction (Table 4). The baseline PSQ minor subscale score by time interaction was significant after AFDR correction for the 512mN probe force (F=8.50, p<0.001), while time interaction effects with the 128mN, 256mN and 512mN probe mechanical hyperalgesia intensities were not significant (F<2.10, p>0.12) (Table 4). Therefore, PSQ minor was associated with the magnitude of mechanical hyperalgesia intensity for hyperalgesia evoked by the 128mN probe and the time by PSQ minor interaction for the hyperalgesia evoked 512mN force probe. There was no evidence of any association of the PSQ minor subscale score on the 64mN or 256mN probe forces.
When summed as the total PSQ score, the main effect of PSQ scores on evoked mechanical hyperalgesia by the 64mN, 128mN, 256mN and 512mN probe were not significant (128mN: F=6.02, p=0.017; 64/256/512mN F<3.18; p>0.079) after AFDR correction (Table 4). The effect of PSQ score by time interaction was significant after AFDR correction for the 512mN probe force (F=6.29, p=0.003), but not significant for the 64mN, 128mN and 256mN probe mechanical hyperalgesia intensities (F<2.40, p>0.09) (Table 4). Therefore, there was no evidence of a main effect of PSQ total score association with mechanical hyperalgesia evoked by any probe force used. However, the interaction of PSQ total score by time was associated with mechanical hyperalgesia evoked by the 512mN probe.
Mechanical hyperalgesic area was positively correlated with baseline STMP for all probes at all time points, significant after AFDR adjustment in 10 of 12 instances. There was insufficient evidence that hyperalgesic area was correlated with HPT, WDT or any PSQ measure (Tables 5, 6).
Table 5.
Correlations between hyperalgesic area and QST.
| WDT | HPT | STMP_64mN | STMP_128mN | STMP_256mN | STMP_512mN | |||||||
|---|---|---|---|---|---|---|---|---|---|---|---|---|
| coefficient | p-value | coefficient | p-value | coefficient | p-value | coefficient | p-value | coefficient | p-value | coefficient | p-value | |
| Hyperalgesic area t1 | −0.023 | 0.870 | −0.211 | 0.160 | 0.440 | 0.001 ** | 0.474 | <0.001 ** | 0.403 | 0.003 ** | 0.461 | 0.001 ** |
| Hyperalgesic area t2 | −0.014 | 0.922 | −0.212 | 0.157 | 0.459 | 0.001 ** | 0.500 | <0.001 ** | 0.432 | 0.001 ** | 0.495 | <0.001 ** |
| Hyperalgesic area t3 | −0.031 | 0.826 | −0.184 | 0.221 | 0.325 | 0.018* | 0.362 | 0.008 ** | 0.299 | 0.030* | 0.370 | 0.006 ** |
WDT: Warmth detection threshold. HPT: Heat pain threshold. STMP: Suprathreshold mechanical pain.
Significant at p<0.05.
Significant at q<0.05. Values highlighted in bold are significant after AFDR correction.
Table 6.
Correlations between hyperalgesic area and PSQ measures.
| PSQ total | PSQ moderate | PSQ minor | ||||
|---|---|---|---|---|---|---|
| coefficient | p-value | coefficient | p-value | coefficient | p-value | |
| Hyperalgesic area t1 | 0.189 | 0.174 | 0.223 | 0.109 | 0.172 | 0.218 |
| Hyperalgesic area t2 | 0.234 | 0.092 | 0.256 | 0.064 | 0.217 | 0.119 |
| Hyperalgesic area t3 | 0.226 | 0.103 | 0.244 | 0.079 | 0.217 | 0.119 |
PSQ: Pain Sensitivity Questionnaire.
Of the 66 subjects included in the analysis 8 subjects did not develop measurable hyperalgesia with the 128mN probe. Seven of 8 of these subjects also did not develop measurable mechanical allodynia. However, when tested with the 256mN and 512mN probes during the suprathreshold mechanical pain testing; of this group of 8 subjects, six ultimately developed evidence of mechanical hyperalgesia (increased pain ratings compared to baseline), where only two of 66 subjects did not have increased pain ratings in response to the C-HP model.
(b). Psychological parameters
Intensity of mechanical hyperalgesia for each probe force was modeled in a set of linear mixed models including the prospective psychological predictor and time as fixed effects with subject as a random effect. The main effect of PCS scores on mechanical hyperalgesia evoked by any probe force was not significant (512mN: F=5.19, p=0.026; 64/128/256mN F<3.42; p>0.069) after AFDR correction (Table 7). The PCS score by time interaction for mechanical hyperalgesia evoked by the 512mN probe (F=6.05, p=0.003) was significant after AFDR correction, while the interactions for mechanical hyperalgesia evoked by lower probe forces was not significant (F<1.22, p>0.29) (Table 7). Therefore, there was no evidence of a main effect of PCS score on mechanical hyperalgesia evoked by any probe force used. However, the interaction of PCS score by time was associated with mechanical hyperalgesia evoked by the 512mN probe.
Table 7.
Psychological factors associated with hyperalgesic magnitude
| Dependent Measure |
Factor | F_value | p | Factor | F_value | p | |
|---|---|---|---|---|---|---|---|
| STMP 64 mN △ | PCS | 0.201 | 0.656 | PCS:time | 0.379 | 0.686 | |
| STMP 128 mN △ | PCS | 3.411 | 0.07 | PCS:time | 0.428 | 0.653 | |
| STMP 256 mN △ | PCS | 2.185 | 0.145 | PCS:time | 1.210 | 0.302 | |
| STMP 512 mN △ | PCS | 5.185 | 0.026* | PCS:time | 6.052 | 0.003 ** | |
| interaction | estimate | t | p | ||||
| PCS*time_t1-t2 | −0.267 | −2.115 | 0.037* | ||||
| PCS*time_t1-t3 | −0.436 | −3.450 | 0.001 ** | ||||
| PCS*time_t2-t3 | −0.169 | −1.335 | 0.184 | ||||
| STMP 64 mN △ | CES.D | 3.330 | 0.073 | CES.D:time | 1.957 | 0.146 | |
| STMP 128 mN △ | CES.D | 3.684 | 0.06 | CES.D:time | 0.883 | 0.416 | |
| STMP 256 mN △ | CES.D | 3.697 | 0.059 | CES.D:time | 0.554 | 0.576 | |
| STMP 512 mN △ | CES.D | 5.376 | 0.024* | CES.D:time | 1.389 | 0.253 | |
| STMP 64 mN △ | STAI.S | 6.739 | 0.012* | STAI.S:time | 1.934 | 0.149 | |
| STMP 128 mN △ | STAI.S | 10.075 | 0.002 ** | STAI.S:time | 2.246 | 0.110 | |
| STMP 256 mN △ | STAI.S | 8.160 | 0.006 ** | STAI.S:time | 0.143 | 0.867 | |
| STMP 512 mN △ | STAI.S | 16.613 | <0.001 ** | STAI.S:time | 6.972 | 0.001 ** | |
| interaction | estimate | T | p | ||||
| STAI.S*time_t1-t2 | −0.331 | −2.228 | 0.028* | ||||
| STAI.S*time_t1-t3 | −0.551 | −3.709 | <0.001 ** | ||||
| STAI.S*time_t2-t3 | −0.220 | −1.481 | 0.141 | ||||
| STMP 64 mN △ | STAI.T | 1.937 | 0.169 | STAI.T:time | 2.616 | 0.077 | |
| STMP 128 mN △ | STAI.T | 1.968 | 0.166 | STAI.T:time | 0.432 | 0.650 | |
| STMP 256 mN △ | STAI.T | 4.013 | 0.050* | STAI.T:time | 0.363 | 0.696 | |
| STMP 512 mN △ | STAI.T | 5.743 | 0.020* | STAI.T:time | 0.849 | 0.430 | |
| STMP 64 mN △ | PILL | 0.585 | 0.447 | PILL:time | 2.657 | 0.074 | |
| STMP 128 mN △ | PILL | 0.361 | 0.55 | PILL:time | 0.370 | 0.692 | |
| STMP 256 mN △ | PILL | 3.083 | 0.084 | PILL:time | 5.448 | 0.005 ** | |
| interaction | estimate | t | p | ||||
| PILL*time_t1-t2 | 0.157 | 2.827 | 0.006 ** | ||||
| PILL*time_t1-t3 | 0.161 | 2.890 | 0.005 ** | ||||
| PILL*time_t2-t3 | 0.003 | 0.063 | 0.95 | ||||
| STMP 512 mN △ | PILL | 0.874 | 0.354 | PILL:time | 1.188 | 0.308 |
STMP: Suprathreshold mechanical pain. STMP△ [t(post-capsaicin)-t0] = STMP t(post-capsaicin)-STMP t0. Post-capsaicin values calculated for 3 time points: t1-t0, t2-t0, and t3-t0. PCS: Pain Catastrophizing Scale.CES-D: Center for Epidemiological Studies-Depression Scale. STAI: State-Trait Anxiety Inventory. PILL: Pennebaker Inventory of Limbic Languidness.
Significant at p<0.05.
Significant at q<0.05. Values highlighted in bold are significant after AFDR correction.
The main effect of CESD scores on mechanical hyperalgesia evoked by any probe force was not significant (512mN: F=5.38, p=0.024; 64/128/256mN F<3.71; p>0.059) after AFDR correction (Table 7). The CESD score by time interactions for mechanical hyperalgesia evoked by any probe force was not significant (F<1.97, p>0.15) (Table 7). Therefore, there was insufficient evidence for an association of CESD scores on mechanical hyperalgesia evoked by any probe force.
The main effect of STAI State scores on mechanical hyperalgesia evoked by the 128mN, 256mN and 512mN probes (128mN: F=10.08, p=0.002; 256mN: F=8.16, p=0.006; 512mN: F=16.61, p<0.001) were significant after AFDR correction, while the effect on the hyperalgesia evoked by 64mN (F=6.74, p=0.012) did not surpass AFDR correction (Table 7). The STAI State score by time interaction for mechanical hyperalgesia evoked by the 512mN probe (F=6.97, p<0.001) was significant after AFDR correction, while the interactions for mechanical hyperalgesia evoked by lower probe forces was not significant (F<2.26, p>0.10) (Table 7). Therefore, there was evidence of a main effect of PCS score on mechanical hyperalgesia evoked by the 128mN, 256mN and 512mN probes. Furthermore, the interaction of STAI State score by time was associated mechanical hyperalgesia evoked by the 512mN probe.
The main effect of STAI Trait scores for mechanical hyperalgesia evoked by any probe force were not significant (256mN: F=4.01, p=0.05; 512mN: F=5.74, p=0.02; 64/128mN F<1.98; p>0.169) after AFDR correction (Table 7). The STAI Trait score by time interaction for mechanical hyperalgesia evoked by any probe force was not significant (F<2.63, p>0.076) (Table 7). Therefore, there was no evidence of association of STAI Trait score with mechanical hyperalgesia evoked by any probe force used.
The main effect of PILL scores on mechanical hyperalgesia evoked by any probe force was not significant (F<3.09; p>0.083) (Table 7). The PILL score by time interaction for mechanical hyperalgesia evoked by the 256mN probe (F=5.45, p=0.005) was significant after AFDR correction, while the interactions for mechanical hyperalgesia evoked by other probe forces was not significant (F<2.67, p>0.073) (Table 7). Therefore, there was no evidence of a main effect of PILL score on mechanical hyperalgesia evoked by any probe force used. However, the interaction of PILL score by time was associated with mechanical hyperalgesia evoked by the 256mN probe.
Hyperalgesic area was correlated with two of the psychological measures (specifically, PILL and CES-D) at select time points but these correlations did not survive the AFDR correction (Table 8).
Table 8.
Correlations between hyperalgesic area and psychological factors.
| PCS | STAI S | STAI T | CES D | PILL | ||||||
|---|---|---|---|---|---|---|---|---|---|---|
| coefficient | p-value | coefficient | p-value | coefficient | p-value | coefficient | p-value | coefficient | p-value | |
| Hyperalgesic area t1 | 0.172 | 0.218 | 0.018 | 0.899 | 0.216 | 0.120 | 0.285 | 0.038* | 0.260 | 0.061 |
| Hyperalgesic area t2 | 0.079 | 0.572 | −0.104 | 0.464 | 0.168 | 0.229 | 0.188 | 0.177 | 0.270 | 0.051 |
| Hyperalgesic area t3 | 0.119 | 0.396 | −0.047 | 0.740 | 0.261 | 0.059 | 0.245 | 0.077 | 0.272 | 0.049* |
PCS: Pain Catastrophizing Scale. CES-D: Center for Epidemiological Studies-Depression Scale. STAI: State-Trait Anxiety Inventory.
PILL: Pennebaker Inventory of Limbic Languidness.
Significant at p<0.05.
3. Associations between mechanical hyperalgesia and allodynia
A 3-way ANOVA (group, probe size, time) on mechanical hyperalgesia intensity found a significant group difference (F=7.044, p=0.010, ηp2=0.107) with subjects in the A group (n= [estimated M=9.62, (SD)=9.05] showing significantly greater mechanical hyperalgesia intensity than those in the NA group (n= [estimated M=3.47, SD=9.05] (Fig. 6a-c).
Fig. 6.

Mechanical hyperalgesic magnitude for allodynic and non-allodynic groups after capsaicin removal at (a) t1, (b) t2 and (c) t3 in session A (n=61). STMP: Suprathreshold mechanical pain. NA = Non-Allodynic, A = Allodynic.
No significant effect of probe size [64mN: estimated M=5.62, SD=7.38; 128mN: estimated M=6.41, SD=10.18; 256mN: estimated M=7.03, SD=10.98; or 512mN: estimated M=7.12, SD=11.50;], time [t1: estimated M=6.36, SD=9.03; t2: estimated M=6.68, SD=8.80; or t3 estimated M=6.59, SD=10.72], or any interactions were found (Table 9).
Table 9.
Results of 3-way mixed ANOVA of hyperalgesic magnitude.
| Comparison | F-stat | p-value | Effect size* |
|---|---|---|---|
| Group | 7.044 | 0.010 | 0.107 |
| Probe | 1.042 | 0.375 | 0.017 |
| Time | 0.124 | 0.884 | 0.002 |
| Group x Probe | 1.715 | 0.166 | 0.028 |
| Group x Time | 1.887 | 0.156 | 0.031 |
| Probe x Time | 0.591 | 0.738 | 0.010 |
| Group x Probe x Time | 1.217 | 0.297 | 0.020 |
Partial eta squared for ANOVA.
A 2-way ANOVA (group, time) on mechanical hyperalgesic area found a significant effect of group (F=9.319, p=0.004, ηp2=0.163) and time (F=6.611, p=0.002, ηp2=0.121), but no group-time interaction (n=50). Mechanical hyperalgesic area was significantly larger for A group [estimated M=75.67 cm2, SD=50.59] than the NA group [estimated M=31.95 cm2, SD=50.59] and there was a significant reduction in area between t1 [estimated M=62.94 cm2, SD=56.35] and t2 [estimated M=48.67 cm2, SD=50.06], (t=3.09, p=0.003, Cohen’s d=0.44; Fig. 7a, Table 10). In a separate 1-way ANOVA, allodynic area was shown to significantly decrease over time (n=61) [t1: estimated M=3.80 cm2, SD=7.74; t2: estimated M=2.94 cm2, SD=10.13; t3: estimated M=0.69 cm2, SD=2.08] (F-value=3.45, p=0.035, ηp2=0.054; Fig. 7b, Table 11).
Fig. 7.

a. Hyperalgesic area for allodynic and non-allodynic groups over time (n=50). b. Allodynic area over time (n=61). NA = Non-Allodynic, A = Allodynic.
Table 10.
Results of 2-way mixed ANOVA of hyperalgesic area.
| Comparison | Test | Stat | p-value | Effect size* |
|---|---|---|---|---|
| Group | ANOVA | 9.319 | 0.004 ** | 0.163 |
| Time | ANOVA | 6.611 | 0.002 ** | 0.121 |
| Group x Time | ANOVA | 1.092 | 0.340 | 0.022 |
| t1 vs t2 | paired t-test | 3.09 | 0.003 ** | 0.437 |
| t1 vs t3 | paired t-test | 2.66 | 0.011 | 0.376 |
| t2 vs t3 | paired t-test | −0.36 | 0.722 | 0.051 |
Partial eta squared for ANOVA; Cohen's d for post-hoc paired t-test.
Significant after AFDR correction.
Table 11.
Results of ANOVA of allodynic area for the allodynic group over time
| Comparison | Test | Stat | p-value | Effect size* |
|---|---|---|---|---|
| Time | ANOVA | 3.45 | 0.035 | 0.054 |
| t1 vs t2 | paired t-test | 0.61 | 0.544 | 0.078 |
| t1 vs t3 | paired t-test | 3.23 | 0.002 ** | 0.414 |
| t2 vs t3 | paired t-test | 1.78 | 0.080 | 0.228 |
Partial eta squared for ANOVA; Cohen's d for post-hoc paired t-test.
Significant after AFDR correction.
Mechanical hyperalgesic area did not correlate with allodynic area (among those in A group) at the first post-exposure time point (R=−0.14, p=0.511). The area of brush allodynia decreased over the time after C-HP treatment (Fig. 7b), resulting in many zero values at the last two post-exposure time points. Hence, no additional analyses were conducted for these two time points.
4. Relationship between hyperalgesic magnitude and area
After AFDR correction, there was insufficient evidence that mechanical hyperalgesic magnitude was correlated with mechanical hyperalgesic area at any post-exposure time points (t1: R=0.29, p=0.041; t2: R=0.35, p=0.013; t3: R=0.23, p=0.103).
Discussion
This study evaluated the association of baseline sensory sensitivity and psychological factors upon the incidence and magnitude of brush allodynia and mechanical hyperalgesia, induced using an experimental pain model in healthy subjects. Application of the topical C-HP model produced brush allodynia in 30 of the 61 subjects. Allodynia susceptibility was associated with greater baseline warmth sensitivity as measured by WDTs. While the association with HPTs failed to surpass AFDR correction, the positive association between allodynia and HPTs is consistent with prior reports (Fig. 4a, b) (Hansen et al., 2017; Martucci et al., 2012). Those subjects developing allodynia also developed significantly greater mechanical hyperalgesic magnitude and area than those who were non-allodynic. However, there was no statistically significant correlation between hyperalgesic and allodynic areas. Allodynia susceptibility was not related to any of the psychological factors measured in this study, nor self-assessed pain sensitivity. This is consistent with our predictions, prior reports of psychological factors failing to exacerbate allodynia and failure of inhibition of cortical regions associated with pain processing and directed attention (e.g., posterior parietal cortex) to alleviate allodynia (Seifert et al., 2010; Volpi et al., 2008).
Those developing greater mechanical hyperalgesia intensity and area showed greater baseline pain sensitivity to heat and mechanical stimuli (lower intensity mechanical stimuli only). Mechanical hyperalgesic magnitude and area showed significant associations with measures of state anxiety, but not with self-assessed pain sensitivity.
1. Intraclass Correlation of Thermal Sensory Thresholds
The ICC results of our reliability analysis of the two QST sessions separated by 4 weeks was 0.53 95%CI [0.30,0.77] for the WDT (n=51) and 0.62 95%CI [0.40,0.77] for HPT (n=47), indicating moderate reliability for both WDT and HPT. This is the largest study reporting ICCs for WDTs and HPTs on the leg. Past studies of WDT measurement on the leg reported a range of ICC means from 0.36 to 0.91 in sample sizes ranging from 14 to 32 subjects indicating a wide range of reliability for WDT from poor to excellent (Andersen et al., 2015; Jakovljević and Mekjavić 2012; Knutti et al., 2014; Krassioukov et al., 1999). Past studies of HPT measurement on the leg reported a range of ICC means of 0.54 to 0.83 in samples sizes ranging from 20 to 32 subjects indicating reliability of HPT from moderate to good (Andersen et al., 2015; Knutti et al., 2014; Middlebrook et al., 2020; Vaegter et al., 2017). In comparison with previous studies, some of which reported reliability across 48 hours, the 4-week reliability of our study is consistent with previous reports.
2. Factors influencing development of mechanical allodynia
a. Baseline sensory factors
Mechanical allodynia susceptibility was significantly related to greater baseline sensitivity to near-threshold stimuli: lower WDT and HPT. Yet, there was no positive evidence that allodynia susceptibility was related to baseline STMP.
The HPT and WDT relevance to allodynic expression could reflect the innervation density of TRPV1 receptors. Capsaicin is an allosteric modulator of the TRPV1 receptor stabilizing the open gate conformation (Cao et al., 2013). In turn open gate stabilization lowers the temperature whereby the receptor opens its nonselective cation gate(Chung and Wang 2011; Neelands et al., 2008). In terms of receptor population dynamics this change increases the proportion of open channels at any given increase in temperature. A threshold of cation flux through this channel must be reached for each TRPV1-bearing afferent to reach membrane depolarization. Since the entire afferent depolarization mechanism relies on population dynamics, individuals who express higher concentrations of TRPV1 in their primary afferents would experience greater pain from capsaicin exposure. Alternatively, non-synonymous mutations of TRPV1 in the receptor gate, capsaicin binding or modulatory sites may modulate the temperature threshold for gate opening either at rest or after capsaicin binds (Wang et al., 2016). Finally, serine phosphorylation of TRPV1 in mice leads to hypersensitivity to the effects of capsaicin in mice (Joseph et al., 2019). Therefore, differential propensity of primary afferents to experience TRPV1 phosphorylation or activation of upstream protein kinases may lead to differential sensitivity to both heat and capsaicin. In cases of enhanced expression levels of TRPV1, a fixed area of capsaicin exposure would generate greater input to the CNS, generating increased central sensitization (Baron et al., 2013). Greater primary afferent drive to the spinal doral horn would theoretically increase the likelihood of producing brush allodynia and greater mechanical hyperalgesia.
The specific neurophysiological mechanisms underlying allodynia development remain incompletely understood. Evidence exists for two mechanisms driving capsaicin-induced brush allodynia in primates. The first is unmasking of C mechanoinsensitive primary afferents (aka: silent nociceptors), which are activated by capsaicin and become responsive to mechanical stimuli after capsaicin sensitization (Schmelz et al., 1994; Schmidt et al., 1995). These primary afferents also have large receptive fileds which may be mistaken for evidence of capsaicin induced sensitization crossing nerve boundaries implicating central sensitization (Sang et al., 1996; Schmidt et al., 2002). The second likely neurophysiological mechanism driving brush allodynia is amplification of neuronal excitability at the level of the spinal and trigeminal dorsal horns, commonly called central sensitization (Latremoliere and Woolf 2009; Mainero et al., 2007; Simone et al., 1991a; Torebjork et al., 1992; Woolf 1983). In this mechanism non-nociceptive mechanical afferents that synapse on wide dynamic range spinal dorsal horn (SDH) neurons produce pain in response to brush stimuli after these SDH neurons are sensitized (LaMotte et al., 1992; LaMotte et al., 1991; Simone et al., 1991a; Torebjork et al., 1992). One possible differentiating psychophysical test between these two neurophysiological mechanisms would be identificantion of segmental bilateral spinal amplification resulting in mechanical allodynia in the contralateral mirror body site. Patients with complex regional pain syndrome and healthy subjects exposed to capsaicin have been reported to demonstrate segmental mirror pain (Shenker et al., 2008; Veldman and Goris 1996). However, the limited evidence for and relative rarity of this phenomenon argued against this method of testing for central sensitization.
b. Pain sensitivity questionnaire (PSQ)
PSQ scores were not associated with brush allodynia susceptibility. PSQ consists of self-reports of pain sensitivity, which are moderately, but not strongly related to QST measures of pain sensitivity (Meiselles et al., 2017; Ruscheweyh et al., 2009). Given that significant QST associations were only found for near threshold stimuli, one might expect to see this paralleled as a difference in the “Minor” subscale of the PSQ. However, this was not observed. Thus, the PSQ did not mirror the heat QST results. Together with prior reports, QST associations with near threshold stimuli supports the contention that allodynia development is dependent on the magnitude of primary afferent drive especially in healthy subjects (Baron et al., 2013; Gracely et al., 1992; Kleggetveit et al., 2012; Orstavik and Jorum 2010; Orstavik et al., 2006).
c. Psychological factors
No group difference was found for any psychological factor. With regard to pain catastrophizing, our results are consistent with a previous report, where no significant correlation was found between PCS scores and brush allodynia in neuropathic pain patients (Sullivan et al., 2005). Anxiety and depression were not associated with capsaicin-induced brush allodynia susceptibility in our analysis. Yet, a previous study reported anxiety and depressive symptoms were more common in chronic pain patients with allodynia than in those without allodynia (Mendonca et al., 2016). In our study, subjects were free of clinical pain, and did not show clinically relevant levels of anxiety, depression, or somatic symptoms commonly found in chronic pain patients. Thus, the impact of allodynia presence on psychological factors such as anxiety and depression may be more clinically significant and possibly form a self-reinforcing relationship in chronic pain patients.
3. Factors influencing development of mechanical hyperalgesia
a. Baseline sensory factors
Baseline pain sensitivity measures of HPT and 64 mN probe STMP, but not WDT, were significantly associated with mechanical hyperalgesic magnitude. Baseline pain sensibility for all four probe forces were related to subsequently developing area of mechanical hyperalgesia measured with the 128 mN probe up to 35 minutes after C-HP removal. . Previous studies reported that HPT predicted secondary mechanical hyperalgesic area following brief thermal sensitization (Hansen et al., 2017; Hansen et al., 2016). We did not replicate these findings, however this study examined the effect of hyperalgesia after mild burn and only in male subjects. In our model, although robust hyperalgesia was found with stronger stimulus probes, hyperalgesia intensity correlations with baseline mechanical pain sensitivity were progressively less strong and less frequent as probe force increased. This would be consistent with the preferential unmasking of low-threshold C-mechano-insensitive primary afferents after part of their extensive receptive fields are exposed to the C-HP provocation (Sauerstein et al., 2018; Schmidt et al., 1995; Schmidt et al., 2002). The results of baseline STMP association with area of mechanical hyperalgesia produced by C-HP model are most consistent with a leftward shift of painful mechanical sensitivity and sensibility due to central sensitzation which decreases from the site of injury through contact of fewer receptive fields of sensitizaed primary afferent territories and is further dependent on the pool of SDH neurons sensitized (LaMotte et al., 1991; Schmidt et al., 1995; Schmidt et al., 2002; Simone et al., 1991a; Torebjork et al., 1992).
b. PSQ
PSQ scores were significantly associated with mechanical hyperalgesia magnitude, with the 128 mN probe and the PSQ scores interaction with time for the 512 mN probe. In contrast to the QST results, no associations between PSQ and mechanical hyperalgesic area were observed. The PSQ likely measures not only intrinsic pain sensitivity and sensibility, but life experiences with pain which are manifest as bottom-up and top-down mechanisms of attention to pain.
c. Psychological factors
In the present study, state anxiety and, to a lesser extent somatic awareness were correlated with hyperalgesic magnitude. . State anxiety scores were significantly associated with mechanical hyperalgesic magnitude evoked by the 128mN, 256mN and 512mN probes, while only the PILL by time interaction was associated with the 256mN probe mechanical hyperalgesia (Table 7). There is past evidence that both attention mechanisms to painful stimuli which are augmented by state anxiety, control of attention through direction to painful stimuli and inhibition of cortical structures involved in top-down attention play important roles in the generation of secondary mechanical hyperalgesia magnitude and area (Meeker et al., 2021; Salomons et al., 2014; Seifert et al., 2010). Specifically, state anxiety enhances attentional capture of painful stimuli and brief cognitive behavioral interventions have been shown to decrease the area of secondary hyperalgesia after capsaicin exposure. Furthermore, noninvasive brain stimulation of the cortex in healthy subjects ameliorates capsaicin-driven secondary hyperalgesia (Gregoret et al., 2021; Hughes et al., 2020; Meeker et al., 2019; Seifert et al., 2010). Also of note, there was no correlation between PCS and mechanical hyperalgesic magnitude. Subjects may not have considered pinprick probing as threatening, thereby obviating any negative impact of pain catastrophizing.
4. The relationship between mechanical hyperalgesia and brush allodynia
Outside the region of primary sensitization, both mechanical hyperalgesia and allodynia are considered to be consequences of short-term CNS nociceptive processing plasticity (Sandkuhler 2009). They are often, but not always found together in neuropathic pain cases, suggesting commonalities and differences in their mechanisms. In this study, subjects who developed brush allodynia had significantly greater mechanical hyperalgesic magnitude and area than those that did not (Figs 5,6; Tables 9,10). Finally, there was no correlation of area of hyperalgesia and area of allodynia within individual after 15 minutes of capsaicin removal. The development of mechanical hyperalgesia in 63 of the 66 subjects tested and allodynia in 30 of 61 subjects tested corresponds with the previously reported smaller proportion of subjects developing allodynia in experimental pain models (for a comprehensive review see:(Quesada et al., 2021)). However, information on proportion of healthy subjects developing mechanical hyperalgesia and allodynia in response to human surrogate models of neuropathic pain or capsaicin-based tonic pain models is limited due to reporting inconsistencies and the variety of models used.
The pioneering work of LaMotte et al. (LaMotte et al., 1991) demonstrated that the time course of recovery from post-capsaicin brush allodynia is distinctly faster than that for mechanical hyperalgesia. During our one hour post C-HP observation period, we found significant reduction in allodynic and hyperalgesic area, but no reduction in hyperalgesic magnitude. The differentaition of factors influencing hyperalgesia and allodynia evoked by C-HP exposure is clear from our prior results. Absence of a relationship between mechanical hyperalgesia and allodynia has been previously reported in neuropathic pain patients (Gottrup et al., 1998). Furthermore, pharmacological studies of ketamine and lidocaine demonstrate that systemic treatment with either ketamine or lidocaine reduce the area of secondary hyperalgesia, whereas allodynia is only reduced by ketamine (Gottrup et al., 2000). Therefore, since peripheral sensitization is necessary for development of allodynia, whereas hyperalgesia seems strongly influenced by peripheral and central sensitivity and sensibility as well as top-down attention mechanisms, it is not unexpected that the area of allodynia and hyperalgesia are unrelated.
Conclusion
Both shared and unique factors were associated with susceptibility to brush allodynia vs. mechanical hyperalgesia in our C-HP model. Greater baseline sensitivity to painful stimuli predicted greater mechanical hyperalgesia for lower, but not higher intensity stimuli. Psychological factors showed a modest impact upon mechanical hyperalgesia evoked by stronger levels of stimulation, but no association with allodynia. While those who developed brush allodynia had greater hyperalgesia, both in terms of magnitude and area hyperalgesic and allodynic area were only modestly related. Our results suggest teasing apart the common and different underlying neural mechanisms of capsaicin-heat pain model induced mechanical hyperalgesia and brush allodynia in humans is possible. However, this will likely require larger sample sizes, genetic analysis and a closer inspection of receptor mechanisms at the site of capsaicin exposure. Potential implications for treatment include that treatments for allodynia likely need to target peripheral or spinal mechanisms, whereas secondary hyperalgesia is susceptible to cortical stimulation and cognitive behavioral treatments targeting anxiety (Hughes et al., 2020; Meeker et al., 2019; Salomons et al., 2014).
Significance.
We evaluated differential relationships of psychological and perceptual sensitivity to the development of capsaicin-induced mechanical allodynia and hyperalgesia. Fifty percent of healthy volunteers failed to develop mechanical allodynia. Baseline pain sensitivity was greater in those developing allodynia and was related to the magnitude and area of hyperalgesia. State Psychological factors, while unrelated to allodynia, were related to mechanical hyperalgesia. This supports that the intensity of peripheral sensory input and individual sensibility are related to development of mechanical allodynia and hyperalgesia during central sensitization, while psychological factors play a lesser role.
ACKNOWLEDGMENTS
We gratefully acknowledge the technical assistance of Hee Jun Kim, Brooks DuBose, and Sean M. Cooper.
FUNDING SOURCES
This work was supported by NIH grant P30-NR014019 (SGD, JDG), and the University of Maryland Center to Advance Chronic Pain Research.
Footnotes
CONFLICTS OF INTEREST All authors declare no conflicts of interest.
Reference List
- Andersen KG, Kehlet H, Aasvang EK. Test-retest agreement and reliability of quantitative sensory testing 1 year after breast cancer surgery. Clinical Journal of Pain 2015;31: 393–403. [DOI] [PubMed] [Google Scholar]
- Anderson WS, Sheth RN, Bencherif B, Frost JJ, Campbell JN. Naloxone increases pain induced by topical capsaicin in healthy human volunteers. Pain 2002;99: 207–216. [DOI] [PubMed] [Google Scholar]
- Baron R, Hans G, Dickenson AH. Peripheral input and its importance for central sensitization. Ann Neurol 2013;74: 630–636. [DOI] [PubMed] [Google Scholar]
- Benedetti F, Amanzio M, Vighetti S, Asteggiano G. The biochemical and neuroendocrine bases of the hyperalgesic nocebo effect. J Neurosci 2006;26: 12014–12022. [DOI] [PMC free article] [PubMed] [Google Scholar]
- Benjamini Y and Hochberg Y. On the Adaptive Control of the False Discovery Rate in Multiple Testing With Independent Statistics. Journal of Educational and Behavioral Statistics 2000;25: 60–83. [Google Scholar]
- Bohannon RW and Pfaller BA. Documentation of wound surface area from tracings of wound perimeters. Clinical report on three techniques. Phys Ther 1983;63: 1622–1624. [DOI] [PubMed] [Google Scholar]
- Cao E, Liao M, Cheng Y, Julius D. TRPV1 structures in distinct conformations reveal activation mechanisms. Nature 2013;504: 113–118. [DOI] [PMC free article] [PubMed] [Google Scholar]
- Caterina MJ, Schumacher MA, Tominaga M, Rosen TA, Levine JD, Julius D. The capsaicin receptor: a heat-activated ion channel in the pain pathway. Nature 1997;389: 816–824. [DOI] [PubMed] [Google Scholar]
- Cavallone LF, Frey K, Montana MC, Joyal J, Regina KJ, Petersen KL, Gereau RWt. Reproducibility of the heat/capsaicin skin sensitization model in healthy volunteers. J Pain Res 2013;6: 771–784. [DOI] [PMC free article] [PubMed] [Google Scholar]
- Chung MK and Wang S. Cold suppresses agonist-induced activation of TRPV1. J Dent Res 2011;90: 1098–1102. [DOI] [PMC free article] [PubMed] [Google Scholar]
- Daly B, Young S, Marla R, Riddell L, Junkin R, Weidenhammer N, Dolan J, Kinsella J, Zhang R. Persistent pain after caesarean section and its association with maternal anxiety and socioeconomic background. Int J Obstet Anesth 2017;29: 57–63. [DOI] [PubMed] [Google Scholar]
- Deltombe T, Hanson P, Jamart J, Clérin M. The influence of skin temperature on latency and amplitude of the sympathetic skin response in normal subjects. Muscle Nerve 1998;21: 34–39. [DOI] [PubMed] [Google Scholar]
- Diatchenko L, Nackley AG, Slade GD, Fillingim RB, Maixner W. Idiopathic pain disorders--pathways of vulnerability. Pain 2006;123: 226–230. [DOI] [PubMed] [Google Scholar]
- Dimbat M, Porter PE, Stross FH. Apparatus Requirements for Quantitative Applications. Analytical Chemistry 1956;28: 290–297. [Google Scholar]
- Dirks J, Petersen KL, Dahl JB. The heat/capsaicin sensitization model: a methodologic study. J Pain 2003;4: 122–128. [DOI] [PubMed] [Google Scholar]
- Felix ER and Widerstrom-Noga EG. Reliability and validity of quantitative sensory testing in persons with spinal cord injury and neuropathic pain. Journal of Rehabilitation Research and Development 2009;46: 69–83. [PubMed] [Google Scholar]
- Finnerup NB, Jensen MP, Norrbrink C, Trok K, Johannesen IL, Jensen TS, Werhagen L. A prospective study of pain and psychological functioning following traumatic spinal cord injury. Spinal Cord 2016;54: 816–821. [DOI] [PubMed] [Google Scholar]
- Fisher RA.Statistical methods for research workers. 10th ed., rev. and enl Edinburgh: [etc.]: Oliver and Boyd; 1948. [Google Scholar]
- Galecki A and Burzykowski T. Linear Mixed-Effects Models Using R: A Step-by-Step Approach. New York: Springer. 2013. [Google Scholar]
- Gaul JA. Quantitative Calculation of Gas Chromatographic Peaks in Pesticide Residue Analyses. Journal of Association of Official Analytical Chemists 1966;49: 389–399. [Google Scholar]
- Gottrup H, Hansen PO, Arendt-Nielsen L, Jensen TS. Differential effects of systemically administered ketamine and lidocaine on dynamic and static hyperalgesia induced by intradermal capsaicin in humans. Br J Anaesth 2000;84: 155–162. [DOI] [PubMed] [Google Scholar]
- Gottrup H, Nielsen J, Arendt-Nielsen L, Jensen TS. The relationship between sensory thresholds and mechanical hyperalgesia in nerve injury. Pain 1998;75: 321–329. [DOI] [PubMed] [Google Scholar]
- Gracely RH, Lynch SA, Bennett GJ. Painful neuropathy: altered central processing maintained dynamically by peripheral input. Pain 1992;51: 175–194. [DOI] [PubMed] [Google Scholar]
- Gregoret L, Zamorano AM, Graven-Nielsen T. Effects of multifocal transcranial direct current stimulation targeting the motor network during prolonged experimental pain. Eur J Pain 2021. [DOI] [PubMed] [Google Scholar]
- Guimaraes-Pereira L, Farinha F, Azevedo L, Abelha F, Castro-Lopes J. Persistent Postoperative Pain after Cardiac Surgery: Incidence, Characterization, Associated Factors and its impact in Quality of Life. Eur J Pain 2016;20: 1433–1442. [DOI] [PubMed] [Google Scholar]
- Haeger KH and Bergman L. SKIN TEMPERATURE OF NORMAL AND VARICOSE LEGS AND SOME REFLECTIONS ON THE ETIOLOGY OF VARICOSE VEINS. Angiology 1963;14: 473–479. [DOI] [PubMed] [Google Scholar]
- Hansen MS, Wetterslev J, Pipper CB, Asghar MS, Dahl JB. Heat pain detection threshold is associated with the area of secondary hyperalgesia following brief thermal sensitization: a study of healthy male volunteers. J Pain Res 2017;10: 265–274. [DOI] [PMC free article] [PubMed] [Google Scholar]
- Hansen MS, Wetterslev J, Pipper CB, Ostervig R, Asghar MS, Dahl JB. The Area of Secondary Hyperalgesia following Heat Stimulation in Healthy Male Volunteers: Inter- and Intra-Individual Variance and Reproducibility. PLoS One 2016;11: e0155284. [DOI] [PMC free article] [PubMed] [Google Scholar]
- Hirakawa Y, Hara M, Fujiwara A, Hanada H, Morioka S. The relationship among psychological factors, neglect-like symptoms and postoperative pain after total knee arthroplasty. Pain Res Manag 2014;19: 251–256. [DOI] [PMC free article] [PubMed] [Google Scholar]
- Hovik LH, Winther SB, Foss OA, Gjeilo KH. Preoperative pain catastrophizing and postoperative pain after total knee arthroplasty: a prospective cohort study with one year follow-up. BMC Musculoskelet Disord 2016;17: 214. [DOI] [PMC free article] [PubMed] [Google Scholar]
- Hughes SW, Ward G, Strutton PH. Anodal transcranial direct current stimulation over the primary motor cortex attenuates capsaicin-induced dynamic mechanical allodynia and mechanical pain sensitivity in humans. European Journal of Pain 2020;24: 1130–1137. [DOI] [PubMed] [Google Scholar]
- Jakovljević M and Mekjavić IB. Reliability of the method of levels for determining cutaneous temperature sensitivity. Int J Biometeorol 2012;56: 811–821. [DOI] [PubMed] [Google Scholar]
- Janssen SA, Arntz A, Bouts S. Anxiety and pain: Epinephrine-induced hyperalgesia and attentional influences. Pain 1998;76: 309–316. [DOI] [PubMed] [Google Scholar]
- Jarrell J, Ross S, Robert M, Wood S, Tang S, Stephanson K, Giamberardino MA. Prediction of postoperative pain after gynecologic laparoscopy for nonacute pelvic pain. Am J Obstet Gynecol 2014;211: 360.e361–368. [DOI] [PubMed] [Google Scholar]
- Jensen TS and Finnerup NB. Allodynia and hyperalgesia in neuropathic pain: clinical manifestations and mechanisms. Lancet Neurol 2014;13: 924–935. [DOI] [PubMed] [Google Scholar]
- Joseph J, Qu L, Wang S, Kim M, Bennett D, Ro J, Caterina MJ, Chung MK. Phosphorylation of TRPV1 S801 Contributes to Modality-Specific Hyperalgesia in Mice. J Neurosci 2019;39: 9954–9966. [DOI] [PMC free article] [PubMed] [Google Scholar]
- Kleggetveit IP, Namer B, Schmidt R, Helas T, Ruckel M, Orstavik K, Schmelz M, Jorum E. High spontaneous activity of C-nociceptors in painful polyneuropathy. Pain 2012;153: 2040–2047. [DOI] [PubMed] [Google Scholar]
- Knutti IA, Suter MR, Opsommer E. Test-retest reliability of thermal quantitative sensory testing on two sites within the L5 dermatome of the lumbar spine and lower extremity. Neuroscience Letters 2014;579: 157–162. [DOI] [PubMed] [Google Scholar]
- Krassioukov A, Wolfe DL, Hsieh JT, Hayes KC, Durham CE. Quantitative sensory testing in patients with incomplete spinal cord injury. Arch Phys Med Rehabil 1999;80: 1258–1263. [DOI] [PubMed] [Google Scholar]
- LaMotte RH, Lundberg LE, Torebjork HE. Pain, hyperalgesia and activity in nociceptive C units in humans after intradermal injection of capsaicin. J Physiol 1992;448: 749–764. [DOI] [PMC free article] [PubMed] [Google Scholar]
- LaMotte RH, Shain CN, Simone DA, Tsai EF. Neurogenic hyperalgesia: psychophysical studies of underlying mechanisms. J Neurophysiol 1991;66: 190–211. [DOI] [PubMed] [Google Scholar]
- Latremoliere A and Woolf CJ. Central sensitization: a generator of pain hypersensitivity by central neural plasticity. J Pain 2009;10: 895–926. [DOI] [PMC free article] [PubMed] [Google Scholar]
- Liu M, Max MB, Robinovitz E, Gracely RH, Bennett GJ. The human capsaicin model of allodynia and hyperalgesia: sources of variability and methods for reduction. J Pain Symptom Manage 1998;16: 10–20. [DOI] [PubMed] [Google Scholar]
- Löken LS, Wessberg J, Morrison I, McGlone F, Olausson H. Coding of pleasant touch by unmyelinated afferents in humans. Nature Neuroscience 2009;12: 547–548. [DOI] [PubMed] [Google Scholar]
- Lotsch J, Dimova V, Hermens H, Zimmermann M, Geisslinger G, Oertel BG, Ultsch A. Pattern of neuropathic pain induced by topical capsaicin application in healthy subjects. Pain 2015;156: 405–414. [DOI] [PubMed] [Google Scholar]
- Maier C, Baron R, Tolle TR, Binder A, Birbaumer N, Birklein F, Gierthmuhlen J, Flor H, Geber C, Huge V, Krumova EK, Landwehrmeyer GB, Magerl W, Maihofner C, Richter H, Rolke R, Scherens A, Schwarz A, Sommer C, Tronnier V, Uceyler N, Valet M, Wasner G, Treede RD. Quantitative sensory testing in the German Research Network on Neuropathic Pain (DFNS): somatosensory abnormalities in 1236 patients with different neuropathic pain syndromes. Pain 2010;150: 439–450. [DOI] [PubMed] [Google Scholar]
- Mainero C, Zhang WT, Kumar A, Rosen BR, Sorensen AG. Mapping the spinal and supraspinal pathways of dynamic mechanical allodynia in the human trigeminal system using cardiac-gated fMRI. Neuroimage 2007;35: 1201–1210. [DOI] [PMC free article] [PubMed] [Google Scholar]
- Martucci KT, Yelle MD, Coghill RC. Differential effects of experimental central sensitization on the time-course and magnitude of offset analgesia. Pain 2012;153: 463–472. [DOI] [PMC free article] [PubMed] [Google Scholar]
- Meeker TJ, Emerson NM, Chien JH, Saffer MI, Bienvenu OJ, Korzeniewska A, Greenspan JD, Lenz FA. During vigilance to painful stimuli: slower response rate is related to high trait anxiety, whereas faster response rate is related to high state anxiety. Journal of neurophysiology 2021;125: 305–319. [DOI] [PMC free article] [PubMed] [Google Scholar]
- Meeker TJ, Keaser ML, Khan SA, Gullapalli RP, Seminowicz DA, Greenspan JD. Non-invasive Motor Cortex Neuromodulation Reduces Secondary Hyperalgesia and Enhances Activation of the Descending Pain Modulatory Network. Frontiers in Neuroscience 2019;13: 467. [DOI] [PMC free article] [PubMed] [Google Scholar]
- Meiselles D, Aviram J, Suzan E, Pud D, Eisenberg E. Does self-perception of sensitivity to pain correlate with actual sensitivity to experimental pain? J Pain Res 2017;10: 2657–2663. [DOI] [PMC free article] [PubMed] [Google Scholar]
- Mendonca MD, Caetano A, Viana-Baptista M. Association of depressive symptoms with allodynia in patients with migraine: A cross-sectional study. Cephalalgia 2016;36: 1077–1081. [DOI] [PubMed] [Google Scholar]
- Middlebrook N, Heneghan NR, Evans DW, Rushton A, Falla D. Reliability of temporal summation, thermal and pressure pain thresholds in a healthy cohort and musculoskeletal trauma population. PLoS ONE 2020;15. [DOI] [PMC free article] [PubMed] [Google Scholar]
- Neelands TR, Jarvis MF, Faltynek CR, Surowy CS. Elevated temperatures alter TRPV1 agonist-evoked excitability of dorsal root ganglion neurons. Inflamm Res 2008;57: 404–409. [DOI] [PubMed] [Google Scholar]
- Orstavik K and Jorum E. Microneurographic findings of relevance to pain in patients with erythromelalgia and patients with diabetic neuropathy. Neurosci Lett 2010;470: 180–184. [DOI] [PubMed] [Google Scholar]
- Orstavik K, Namer B, Schmidt R, Schmelz M, Hilliges M, Weidner C, Carr RW, Handwerker H, Jorum E, Torebjork HE. Abnormal function of C-fibers in patients with diabetic neuropathy. J Neurosci 2006;26: 11287–11294. [DOI] [PMC free article] [PubMed] [Google Scholar]
- Papaioannou M, Skapinakis P, Damigos D, Mavreas V, Broumas G, Palgimesi A. The role of catastrophizing in the prediction of postoperative pain. Pain Med 2009;10: 1452–1459. [DOI] [PubMed] [Google Scholar]
- Pennebaker JW. The psychology of physical symptoms. New York, NY, US: Springer-Verlag Publishing. 1982. [Google Scholar]
- Quesada C, Kostenko A, Ho I, Leone C, Nochi Z, Stouffs A, Wittayer M, Caspani O, Brix Finnerup N, Mouraux A, Pickering G, Tracey I, Truini A, Treede RD, Garcia-Larrea L. Human surrogate models of central sensitization: A critical review and practical guide. Eur J Pain 2021. [DOI] [PMC free article] [PubMed] [Google Scholar]
- Radloff LS. The CES-D Scale:A Self-Report Depression Scale for Research in the General Population. Applied Psychological Measurement 1977;1: 385–401. [Google Scholar]
- Rehberg B, Mathivon S, Combescure C, Mercier Y, Savoldelli GL. Prediction of Acute Postoperative Pain Following Breast Cancer Surgery Using the Pain Sensitivity Questionnaire: A Cohort Study. Clin J Pain 2017;33: 57–66. [DOI] [PubMed] [Google Scholar]
- Rolke R, Magerl W, Campbell KA, Schalber C, Caspari S, Birklein F, Treede RD. Quantitative sensory testing: A comprehensive protocol for clinical trials. European Journal of Pain 2006;10: 77. [DOI] [PubMed] [Google Scholar]
- Ruscheweyh R, Marziniak M, Stumpenhorst F, Reinholz J, Knecht S. Pain sensitivity can be assessed by self-rating: Development and validation of the Pain Sensitivity Questionnaire. Pain 2009;146: 65–74. [DOI] [PubMed] [Google Scholar]
- Ruscheweyh R, Viehoff A, Tio J, Pogatzki-Zahn EM. Psychophysical and psychological predictors of acute pain after breast surgery differ in patients with and without pre-existing chronic pain. Pain 2017;158: 1030–1038. [DOI] [PubMed] [Google Scholar]
- Salomons TV, Moayedi M, Erpelding N, Davis KD. A brief cognitive-behavioural intervention for pain reduces secondary hyperalgesia. Pain 2014;155: 1446–1452. [DOI] [PubMed] [Google Scholar]
- Sandkuhler J. Models and mechanisms of hyperalgesia and allodynia. Physiol Rev 2009;89: 707–758. [DOI] [PubMed] [Google Scholar]
- Sang CN, Gracely RH, Max MB, Bennett GJ. Capsaicin-evoked mechanical allodynia and hyperalgesia cross nerve territories. Evidence for a central mechanism. Anesthesiology 1996;85: 491–496. [DOI] [PubMed] [Google Scholar]
- Sauerstein K, Liebelt J, Namer B, Schmidt R, Rukwied R, Schmelz M. Low-Frequency Stimulation of Silent Nociceptors Induces Secondary Mechanical Hyperalgesia in Human Skin. Neuroscience 2018;387: 4–12. [DOI] [PubMed] [Google Scholar]
- Schmelz M, Schmidt R, Ringkamp M, Handwerker HO, Torebjörk HE. Sensitization of insensitive branches of C nociceptors in human skin. J Physiol 1994;480 ( Pt 2): 389–394. [DOI] [PMC free article] [PubMed] [Google Scholar]
- Schmidt R, Schmelz M, Forster C, Ringkamp M, Torebjörk E, Handwerker H. Novel classes of responsive and unresponsive C nociceptors in human skin. J Neurosci 1995;15: 333–341. [DOI] [PMC free article] [PubMed] [Google Scholar]
- Schmidt R, Schmelz M, Weidner C, Handwerker HO, Torebjörk HE. Innervation territories of mechano-insensitive C nociceptors in human skin. J Neurophysiol 2002;88: 1859–1866. [DOI] [PubMed] [Google Scholar]
- Seifert F, Fuchs O, Nickel FT, Garcia M, Dorfler A, Schaller G, Kornhuber J, Sperling W, Maihofner C. A functional magnetic resonance imaging navigated repetitive transcranial magnetic stimulation study of the posterior parietal cortex in normal pain and hyperalgesia. Neuroscience 2010;170: 670–677. [DOI] [PubMed] [Google Scholar]
- Sharma A, Van Oudenhove L, Paine P, Gregory L, Aziz Q. Anxiety increases acid-induced esophageal hyperalgesia. Psychosom Med 2010;72: 802–809. [DOI] [PubMed] [Google Scholar]
- Shenker NG, Haigh RC, Mapp PI, Harris N, Blake DR. Contralateral hyperalgesia and allodynia following intradermal capsaicin injection in man. Rheumatology (Oxford) 2008;47: 1417–1421. [DOI] [PMC free article] [PubMed] [Google Scholar]
- Simone DA, Sorkin LS, Oh U, Chung JM, Owens C, LaMotte RH, Willis WD. Neurogenic hyperalgesia: central neural correlates in responses of spinothalamic tract neurons. J Neurophysiol 1991a;66: 228–246. [DOI] [PubMed] [Google Scholar]
- Simone DA, Sorkin LS, Oh U, Chung JM, Owens C, LaMotte RH, Willis WD. Neurogenic hyperalgesia: Central neural correlates in responses of spinothalamic tract neurons. Journal of Neurophysiology 1991b;66: 228–246. [DOI] [PubMed] [Google Scholar]
- Spielberger CD. Manual for the State-Trait Anxiety Inventory for Adults (Forms Y1 and Y2) Mind Garden Inc. 1983. [Google Scholar]
- Sullivan MJ, Lynch ME, Clark AJ. Dimensions of catastrophic thinking associated with pain experience and disability in patients with neuropathic pain conditions. Pain 2005;113: 310–315. [DOI] [PubMed] [Google Scholar]
- Sullivan MJL, Bishop SR, Pivik J. The Pain Catastrophizing Scale: Development and validation. Psychological Assessment 1995;7: 524–532. [Google Scholar]
- Thomazeau J, Rouquette A, Martinez V, Rabuel C, Prince N, Laplanche JL, Nizard R, Bergmann JF, Perrot S, Lloret-Linares C. Acute pain Factors predictive of post-operative pain and opioid requirement in multimodal analgesia following knee replacement. Eur J Pain 2016a;20: 822–832. [DOI] [PubMed] [Google Scholar]
- Thomazeau J, Rouquette A, Martinez V, Rabuel C, Prince N, Laplanche JL, Nizard R, Bergmann JF, Perrot S, Lloret-Linares C. Predictive Factors of Chronic Post-Surgical Pain at 6 Months Following Knee Replacement: Influence of Postoperative Pain Trajectory and Genetics. Pain Physician 2016b;19: E729–741. [PubMed] [Google Scholar]
- Tominaga M, Caterina MJ, Malmberg AB, Rosen TA, Gilbert H, Skinner K, Raumann BE, Basbaum AI, Julius D. The cloned capsaicin receptor integrates multiple pain-producing stimuli. Neuron 1998;21: 531–543. [DOI] [PubMed] [Google Scholar]
- Torebjork HE, Lundberg LE, LaMotte RH. Central changes in processing of mechanoreceptive input in capsaicin-induced secondary hyperalgesia in humans. J Physiol 1992;448: 765–780. [DOI] [PMC free article] [PubMed] [Google Scholar]
- Vaegter HB, Bement MH, Madsen AB, Fridriksson J, Dasa M, Graven-Nielsen T. Exercise increases pressure pain tolerance but not pressure and heat pain thresholds in healthy young men. European Journal of Pain 2017;21: 73–81. [DOI] [PubMed] [Google Scholar]
- Valeberg BT, Hovik LH, Gjeilo KH. Relationship between self-reported pain sensitivity and pain after total knee arthroplasty: a prospective study of 71 patients 8 weeks after a standardized fast-track program. J Pain Res 2016;9: 625–629. [DOI] [PMC free article] [PubMed] [Google Scholar]
- Veldman P and Goris JAR. Multiple reflex sympathetic dystrophy. Which patients are at risk for developing a recurrence of reflex sympathetic dystrophy in the same or another limb. Pain 1996;64: 463–466. [DOI] [PubMed] [Google Scholar]
- Volpi A, Gatti A, Pica F, Bellino S, Marsella LT, Sabato AF. Clinical and psychosocial correlates of post-herpetic neuralgia. J Med Virol 2008;80: 1646–1652. [DOI] [PubMed] [Google Scholar]
- Wang S, Joseph J, Diatchenko L, Ro JY, Chung MK. Agonist-dependence of functional properties for common nonsynonymous variants of human transient receptor potential vanilloid 1. Pain 2016;157: 1515–1524. [DOI] [PMC free article] [PubMed] [Google Scholar]
- Wasserstein RL and Lazar NA. The ASA Statement on p-Values: Context, Process, and Purpose. The American Statistician 2016;70: 129–133. [Google Scholar]
- Werner MU, Mjobo HN, Nielsen PR, Rudin A. Prediction of postoperative pain: a systematic review of predictive experimental pain studies. Anesthesiology 2010;112: 1494–1502. [DOI] [PubMed] [Google Scholar]
- Wolf G and Gollob HF. Quantitative assessment of brain lesions. Physiol Behav 1980;24: 1195–1199. [DOI] [PubMed] [Google Scholar]
- Woolf CJ. Evidence for a central component of post-injury pain hypersensitivity. Nature 1983;306: 686–688. [DOI] [PubMed] [Google Scholar]