

Summary
Selfish centromere DNA sequences bias their transmission to the egg in female meiosis. Evolutionary theory suggests that centromere proteins evolve to suppress costs of this “centromere drive”. In hybrid mouse models with genetically different maternal and paternal centromeres, selfish centromere DNA exploits a kinetochore pathway to recruit microtubule-destabilizing proteins that act as drive effectors. We show that such functional differences are suppressed by a parallel pathway for effector recruitment by heterochromatin, which is similar between centromeres in this system. Disrupting the kinetochore pathway with a divergent allele of CENP-C reduces functional differences between centromeres, whereas disrupting heterochromatin by CENP-B deletion amplifies the differences. Molecular evolution analyses using Murinae genomes identify adaptive evolution in proteins in both pathways. We propose that centromere proteins have recurrently evolved to minimize the kinetochore pathway, which is exploited by selfish DNA, relative to the heterochromatin pathway that equalizes centromeres, while maintaining essential functions.
Keywords: Meiotic Drive, Selfish Genetic Elements, Evolutionary Arms Race, Centromere, Kinetochore, Heterochromatin
Graphical Abstract
In brief
Recurrent evolution of centromere proteins minimizes functional differences between genetically different centromeres by balancing the pathways that promote and suppress drive by selfish sequences.
Introduction
Centromere evolution is paradoxical in that both repetitive centromere DNA and centromere-binding proteins evolve rapidly despite the conserved requirement of centromeres for faithful chromosome segregation (Henikoff et al., 2001; Lampson and Black, 2017; Malik and Henikoff, 2001; Melters et al., 2013; Schueler et al., 2010). Centromere DNA repeat monomer sequence and repeat copy number diverge between even closely related species. Repeat copy number also varies within species, for example, between human individuals or between mouse strains (Iwata-Otsubo et al., 2017; Langley et al., 2019). To explain this rapid evolution, the centromere drive hypothesis proposes that selfish centromere DNA sequences (either monomer sequence variants or repeat number expansions) drive in female meiosis by increasing their transmission rate to the egg. Potential deleterious consequences of driving centromeres, such as meiotic segregation errors, would select for centromere-binding protein variants that suppress these fitness costs (Finseth et al., 2021; Fishman and Saunders, 2008; Henikoff et al., 2001). New selfish DNA variants subsequently arise to start another cycle of drive and suppression in a continual evolutionary arms race.
Our previous work leveraged natural variation in mouse centromere DNA to study the molecular mechanisms of centromere drive (Akera et al., 2017, 2019; Chmátal et al., 2014; Iwata-Otsubo et al., 2017). Selfish centromeres in these model systems recruit more effector proteins that preferentially destabilize interactions with tyrosinated microtubules on the cortical side of an asymmetric meiosis I spindle, allowing them to detach from microtubules that would otherwise direct them to the polar body. Microtubule detachment and reattachment reorients the selfish centromeres toward the egg side of the spindle (Akera et al., 2017, 2019) (Figure 1A). This reorientation depends on BUB1 kinase at kinetochores, which phosphorylates pericentromeric histone H2A. Phosphorylated H2A recruits Shugoshin-2 (SGO2), which recruits microtubule destabilizing proteins such as MCAK and the chromosome passenger complex (CPC) (Akera et al., 2019) (Figure 1B, kinetochore pathway). In one intra-species Mus musculus domesticus hybrid, selfish centromeres with expanded minor satellite DNA repeats assemble more centromere chromatin containing the histone H3 variant CENP-A (Iwata-Otsubo et al., 2017). These expanded centromeres also form larger kinetochores with more BUB1 kinase, leading to more effectors (inner centromere proteins such as SGO2, CPC, and MCAK) (Akera et al., 2019). In this hybrid, the larger centromeres are from a standard laboratory strain (either CF-1 or C57BL/6J), which is crossed to a wild-derived strain (CHPO) with smaller centromeres. Thus, the centromeres of paired homologous chromosomes within a meiotic bivalent are both genetically and functionally different in the hybrid (Figure 1C). These findings show how selfish centromeres can drive by recruiting more effectors. How centromere-binding proteins can evolve to suppress the costs of drive remains an open question despite being a crucial component of the centromere drive model. Details of the fitness costs are unclear, but they likely depend on functional differences between paired centromeres in meiosis and would therefore be suppressed by reducing these differences.
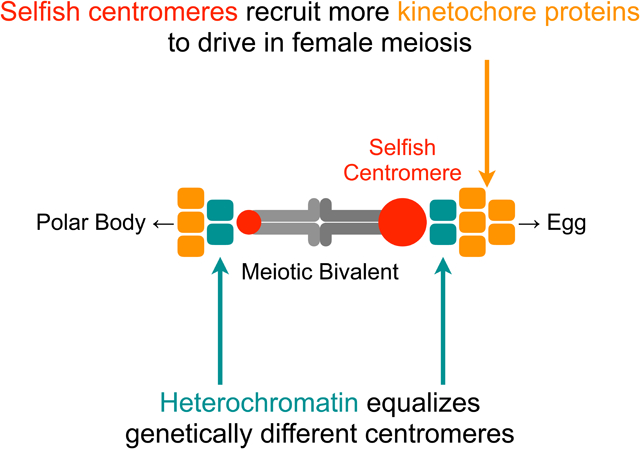
Figure 1: Parallel pathway model for centromere drive and suppression.
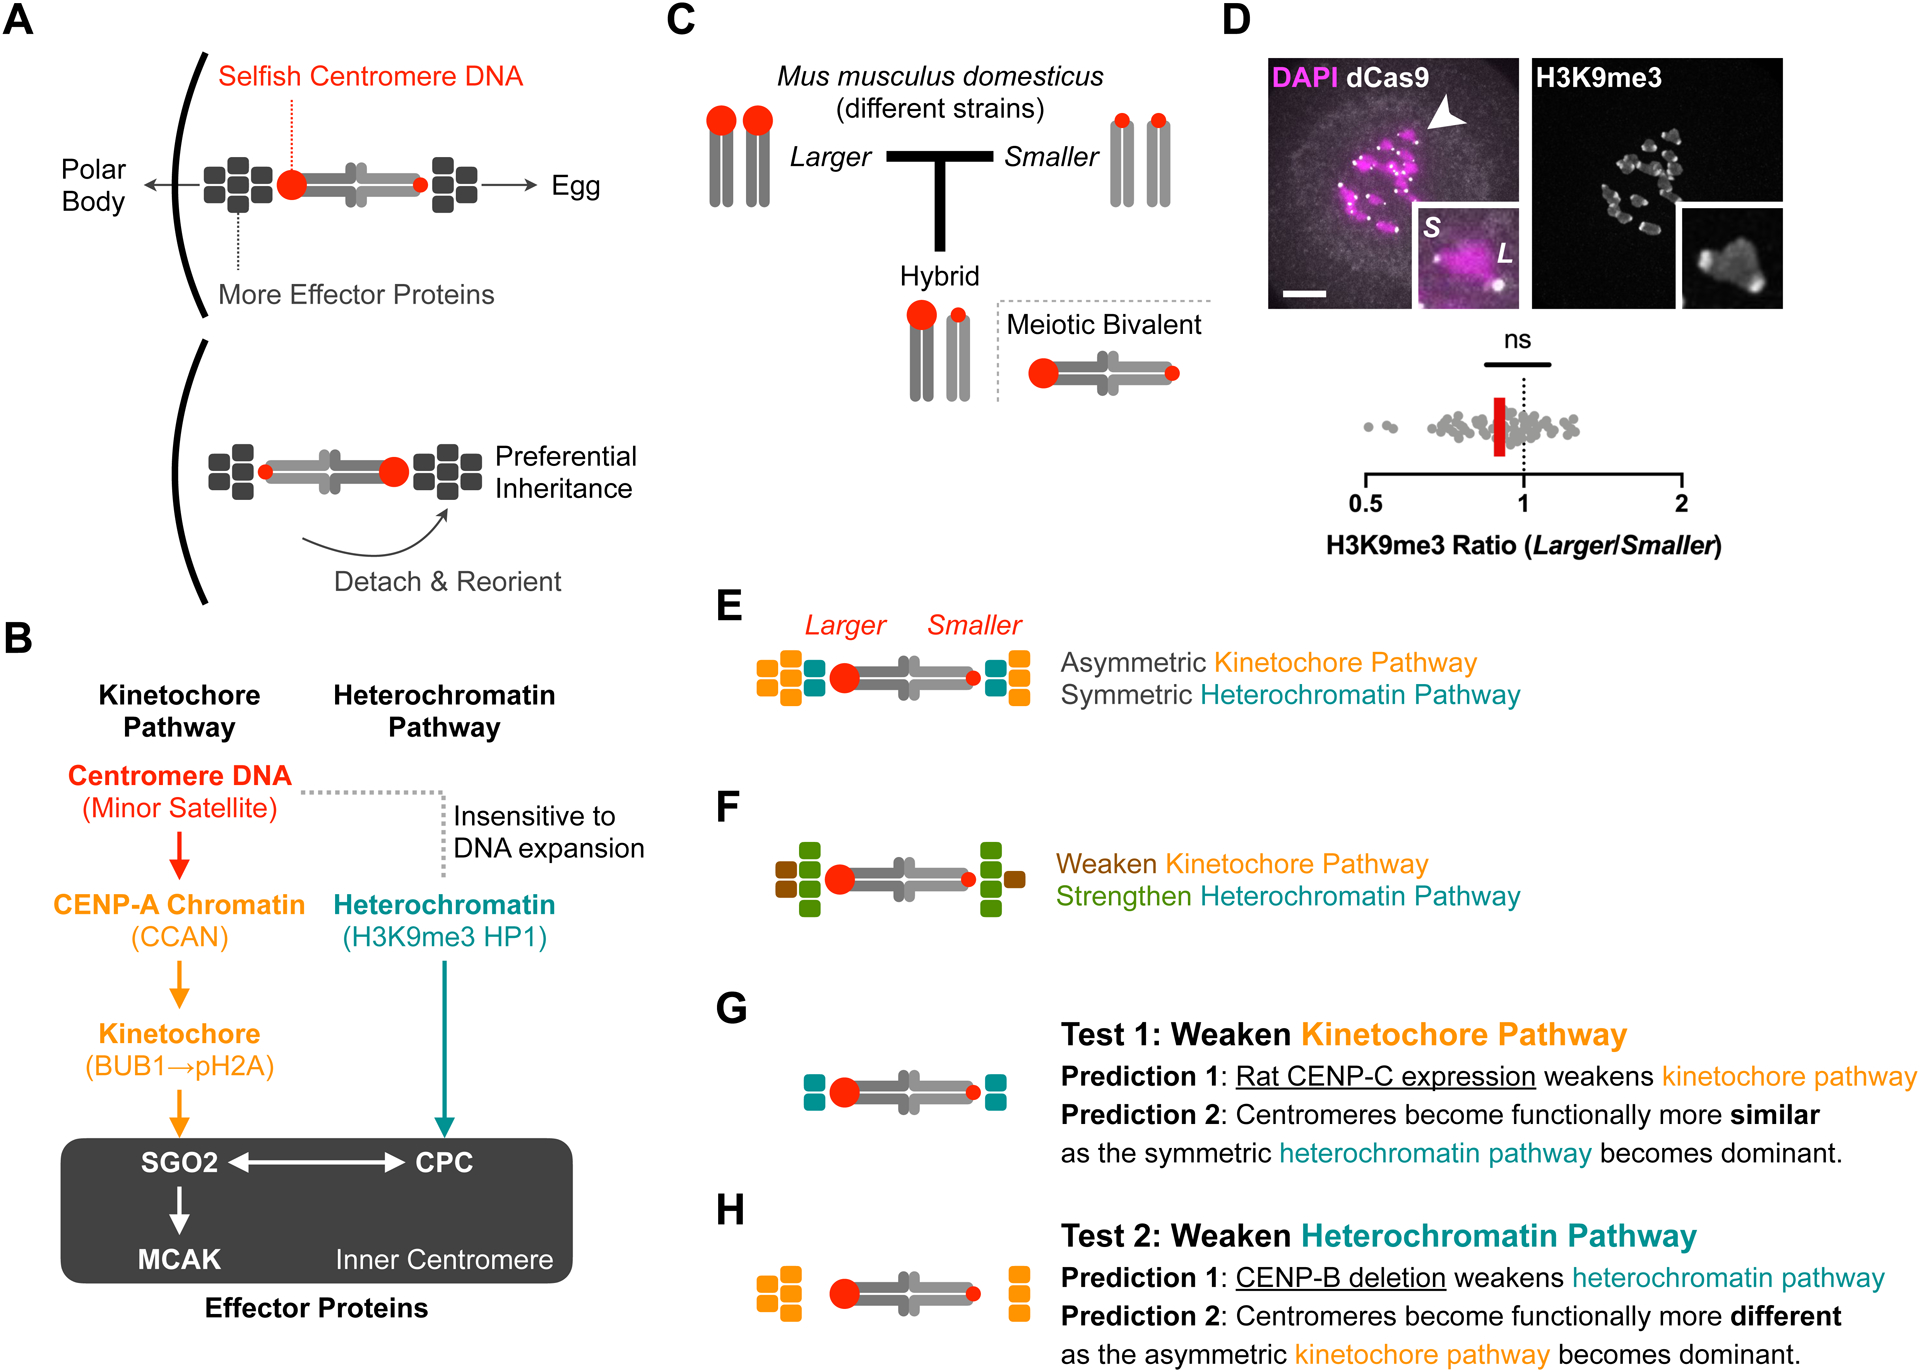
(A) Centromere drive by recruiting effector proteins that destabilize interactions with spindle microtubules. Selfish centromeres recruit more inner centromere effector proteins, preferentially detach from microtubules when facing the cortical side of the spindle, and reorient to bias their segregation to the egg. The cortical side of a meitoic bivalent will segregate to the polar body, whereas the other side will segregate to the egg.
(B) Two pathways for effector recruitment. CENP-A and the CCAN (constitutive centromere-associated network) connect centromere DNA to the kinetochore, which assembles during meiosis or mitosis. Kinetochore-localized BUB1 kinase phosphorylates pericentromeric histone H2A to recruit SGO2. In parallel, pericentromeric heterochromatin also recruits SGO2 via the CPC (chromosome passenger complex) at the inner centromere. The two pathways are not completely independent, as the CPC is also recruited by SGO2 via the kinetochore pathway. Heterochromatin appears insensitive to selfish centromere DNA expansion (see panel D).
(C) CHPO hybrid model system. Crossing strains with larger (CF-1) and smaller (CHPO) centromeres generates a hybrid in which genetically different centromeres are paired in meiotic bivalents. Larger red circles indicate more minor satellite centromere DNA repeats.
(D) CHPO hybrid oocytes were microinjected with cRNA for dCas9-EGFP and gRNA targeting minor satellite centromere DNA to distinguish larger (L) and smaller (S) centromeres, fixed at meiosis I, and stained for H3K9me3; 10μm scale bar, 7.4μm square inset. The H3K9me3 ratio for each pair of larger and smaller centromeres within a bivalent is plotted (n=67 bivalents); red line, geometric mean; ns: no significant deviation from 1.
(E) Asymmetric kinetochore pathway and symmetric heterochromatin pathway in our hybrid model system. Colored boxes represent effector proteins recruited by the kinetochore pathway (orange) or the heterochromatin pathway (green).
(F) Suppression of functional differences between centromeres by recruiting similar amounts of effector proteins on genetically different centromeres. Colored boxes represent changes relative to panel E. Proteins in the kinetochore pathway can adapt by reducing affinity for DNA or for other proteins leading to effector recruitment. Inner centromere proteins can adapt by increasing affinity for heterochromatin or by decreasing their recruitment by the kinetochore pathway.
(G) Introducing a divergent allele of CENP-C (blue boxes) disrupts interactions for effector recruitment and therefore weakens the kinetochore pathway (prediction 1) and makes centromeres functionally more similar (prediction 2).
(H) As CENP-B recruits heterochromatin proteins, deleting CENP-B weakens the heterochromatin pathway (prediction 1), making the asymmetric kinetochore pathway dominant and centromeres functionally more asymmetric (prediction 2).
Results
The parallel pathway model for drive and suppression provides three testable predictions.
Based on our finding that selfish centromeres drive by recruiting more effectors, we propose that functional differences between centromeres can be suppressed by equalizing effector recruitment via a second pathway. This equalization would render genetically different centromeres functionally equivalent. This model incorporates previous findings that in addition to the kinetochore pathway, which acts through BUB1 kinase, effectors are also recruited through a heterochromatin pathway. Pericentromeric heterochromatin recruits the CPC, which recruits SGO2 and MCAK (Figure 1B, heterochromatin pathway) (Abe et al., 2016; Ainsztein et al., 1998; Higgins and Prendergast, 2016; Kang et al., 2011; Marston 2015). In our CHPO hybrid model system (Figure 1C), the kinetochore pathway is asymmetric: we observe higher levels of the kinetochore proteins HEC1/NDC80 and CENP-C on larger vs smaller centromeres (Chmátal et al., 2014; Iwata-Otsubo et al., 2017). In contrast, the heterochromatin pathway is symmetric: the heterochromatin mark, H3K9me3, is equal on the two sides of each bivalent (Figure 1D and 1E) (Iwata-Otsubo et al., 2017). These observations suggest that, in this system, selfish centromere DNA exploits the kinetochore pathway to make genetically different centromeres also functionally different, with larger centromeres recruiting more effectors. In contrast, the heterochromatin pathway appears insensitive to selfish DNA, recruiting effectors equally. We propose that centromere protein evolution suppresses functional differences by minimizing the contribution of the asymmetric kinetochore pathway to effector recruitment, relative to the symmetric heterochromatin pathway.
Evolution of the kinetochore pathway is constrained by its indispensable role in mitotic and meiotic chromosome segregation. Nevertheless, proteins may evolve to weaken the pathway by reducing interactions between centromere-binding proteins and DNA or between proteins leading to effector recruitment (Figure 1F). Similarly, evolution of heterochromatin proteins is constrained by numerous vital heterochromatin-dependent cellular functions (Allshire and Madhani, 2017). Inner centromere proteins (such as the CPC) that interact with heterochromatin may evolve, however, to increase effector recruitment. Finally, overall effector levels are also constrained because microtubule destabilizing activity is necessary to correct kinetochore-microtubule attachment errors, but excessive destabilizing activity weakens attachments necessary for anaphase segregation and activates the spindle assembly checkpoint (Godek et al., 2014). According to our parallel pathway model, a new centromere DNA variant can exploit the kinetochore pathway to recruit more effectors by strengthening interactions with any centromere-binding protein that contacts the DNA: CENP-A, the CENP-A chromatin assembly machinery, or other proteins that link centromere chromatin to the kinetochore (e.g., CENP-C or CENP-T). To suppress functional differences between centromeres, the centromere protein network recurrently evolves to minimize the kinetochore pathway relative to the heterochromatin pathway while maintaining essential functions.
Here we test three predictions from the parallel pathway model. First, when the asymmetric kinetochore pathway is weakened, we predict that centromeres become functionally more similar due to the symmetric heterochromatin pathway. We selected CENP-C as a key scaffold protein in the kinetochore pathway that is known to evolve rapidly under positive selection (Klare et al., 2015; Schueler et al., 2010; Talbert et al., 2004). Under the parallel pathway model, CENP-C interfaces have co-evolved with interacting partners to modulate effector recruitment. Thus, introducing a divergent allele of CENP-C in mouse cells (e.g., rat CENP-C, in which 32% of the amino acid sequence is different) is predicted to disrupt such interactions and weaken the kinetochore pathway (Figure 1G). Second, when the symmetric heterochromatin pathway is weakened, we predict that the asymmetric kinetochore pathway makes a relatively larger contribution to effector recruitment. Genetically different centromeres in our hybrid model system should therefore become functionally more different. To target pericentromeric heterochromatin, we deleted CENP-B, which is the only centromeric chromatin component that is dispensable for core centromere function. CENP-B is recently acquired in mammals and fission yeast from a pogo-like transposase (Casola et al., 2007; Kipling and Warburton, 1997), and several domesticated transposases regulate heterochromatin (Gao et al., 2020; Jangam et al., 2017; Nozawa et al., 2010; Yang et al., 2017). In mouse and human cultured cells and fission yeast, CENP-B contributes to pericentromeric heterochromatin formation via heterochromatin protein recruitment (Nakagawa et al., 2002; Okada et al., 2007; Otake et al., 2020), so deleting CENP-B should weaken the heterochromatin pathway (Figure 1H). Mammalian CENP-B can also contribute to the kinetochore pathway via CENP-C recruitment (Fachinetti et al., 2015), so the functional consequences of CENP-B deletion in our model need to be tested. Third, if proteins in the kinetochore and heterochromatin pathways have evolved to modulate effector recruitment, we predict signatures of positive selection in multiple protein domains involved in effector recruitment. In contrast, the previous model of an arms race limited to interactions between centromere DNA and DNA-binding proteins only predicts rapid evolution of protein domains involved in DNA binding (Henikoff et al., 2001; Malik and Henikoff, 2001). Our observations are consistent with all three predictions, supporting our parallel pathway model for drive and suppression.
Introducing a divergent CENP-C allele weakens the kinetochore pathway and makes centromeres functionally more symmetric.
To weaken the kinetochore pathway, we targeted CENP-C because it serves as a hub for recruiting kinetochore proteins. Our model predicts that CENP-C has co-evolved with interacting partners to modulate effector recruitment, so that an allele from another species will disrupt these interactions and weaken the kinetochore pathway (Figure 1G, Prediction 1). To test this prediction, we selected divergent alleles from rat and from the African striped mouse Rhabdomys pumilio as model organisms close to mouse with divergent centromere DNA and proteins (Figure 2A) (Cazaux et al., 2013; Gibbs et al., 2004; Mallarino et al., 2018; Takeiri et al., 2013). Because protein interfaces change by genetic drift as well as by selection, alleles from closely related species minimize incompatibilities coming from stochastic changes. We introduced GFP-tagged divergent alleles (or the mouse allele as a control) into mouse oocytes in the presence of endogenous CENP-C (Supplementary Figure 1A–1B). We find that rat CENP-C expression reduces effector recruitment, as represented by SGO2 staining, compared to mouse CENP-C expression (Figure 2B). This result is consistent with our model prediction and could reflect differences between mouse and rat CENP-C in their recruitment to centromeres or in their interactions with other kinetochore proteins. For example, evolution at an interface with CENP-A nucleosomes or with CENP-B may disrupt rat CENP-C recruitment to centromeres. Alternatively, CENP-C evolution might impact the domains that mediate interactions with other kinetochore proteins involved in SGO2 recruitment. We find that mouse and rat CENP-C are equally recruited and incorporated into mouse centromeres (Figure 2C and Supplementary Figure 1C–1E), indicating functional changes at an interface with other kinetochore proteins.
Figure 2: Introducing rat CENP-C in mouse oocytes weakens the kinetochore pathway and makes centromeres functionally more symmetric.
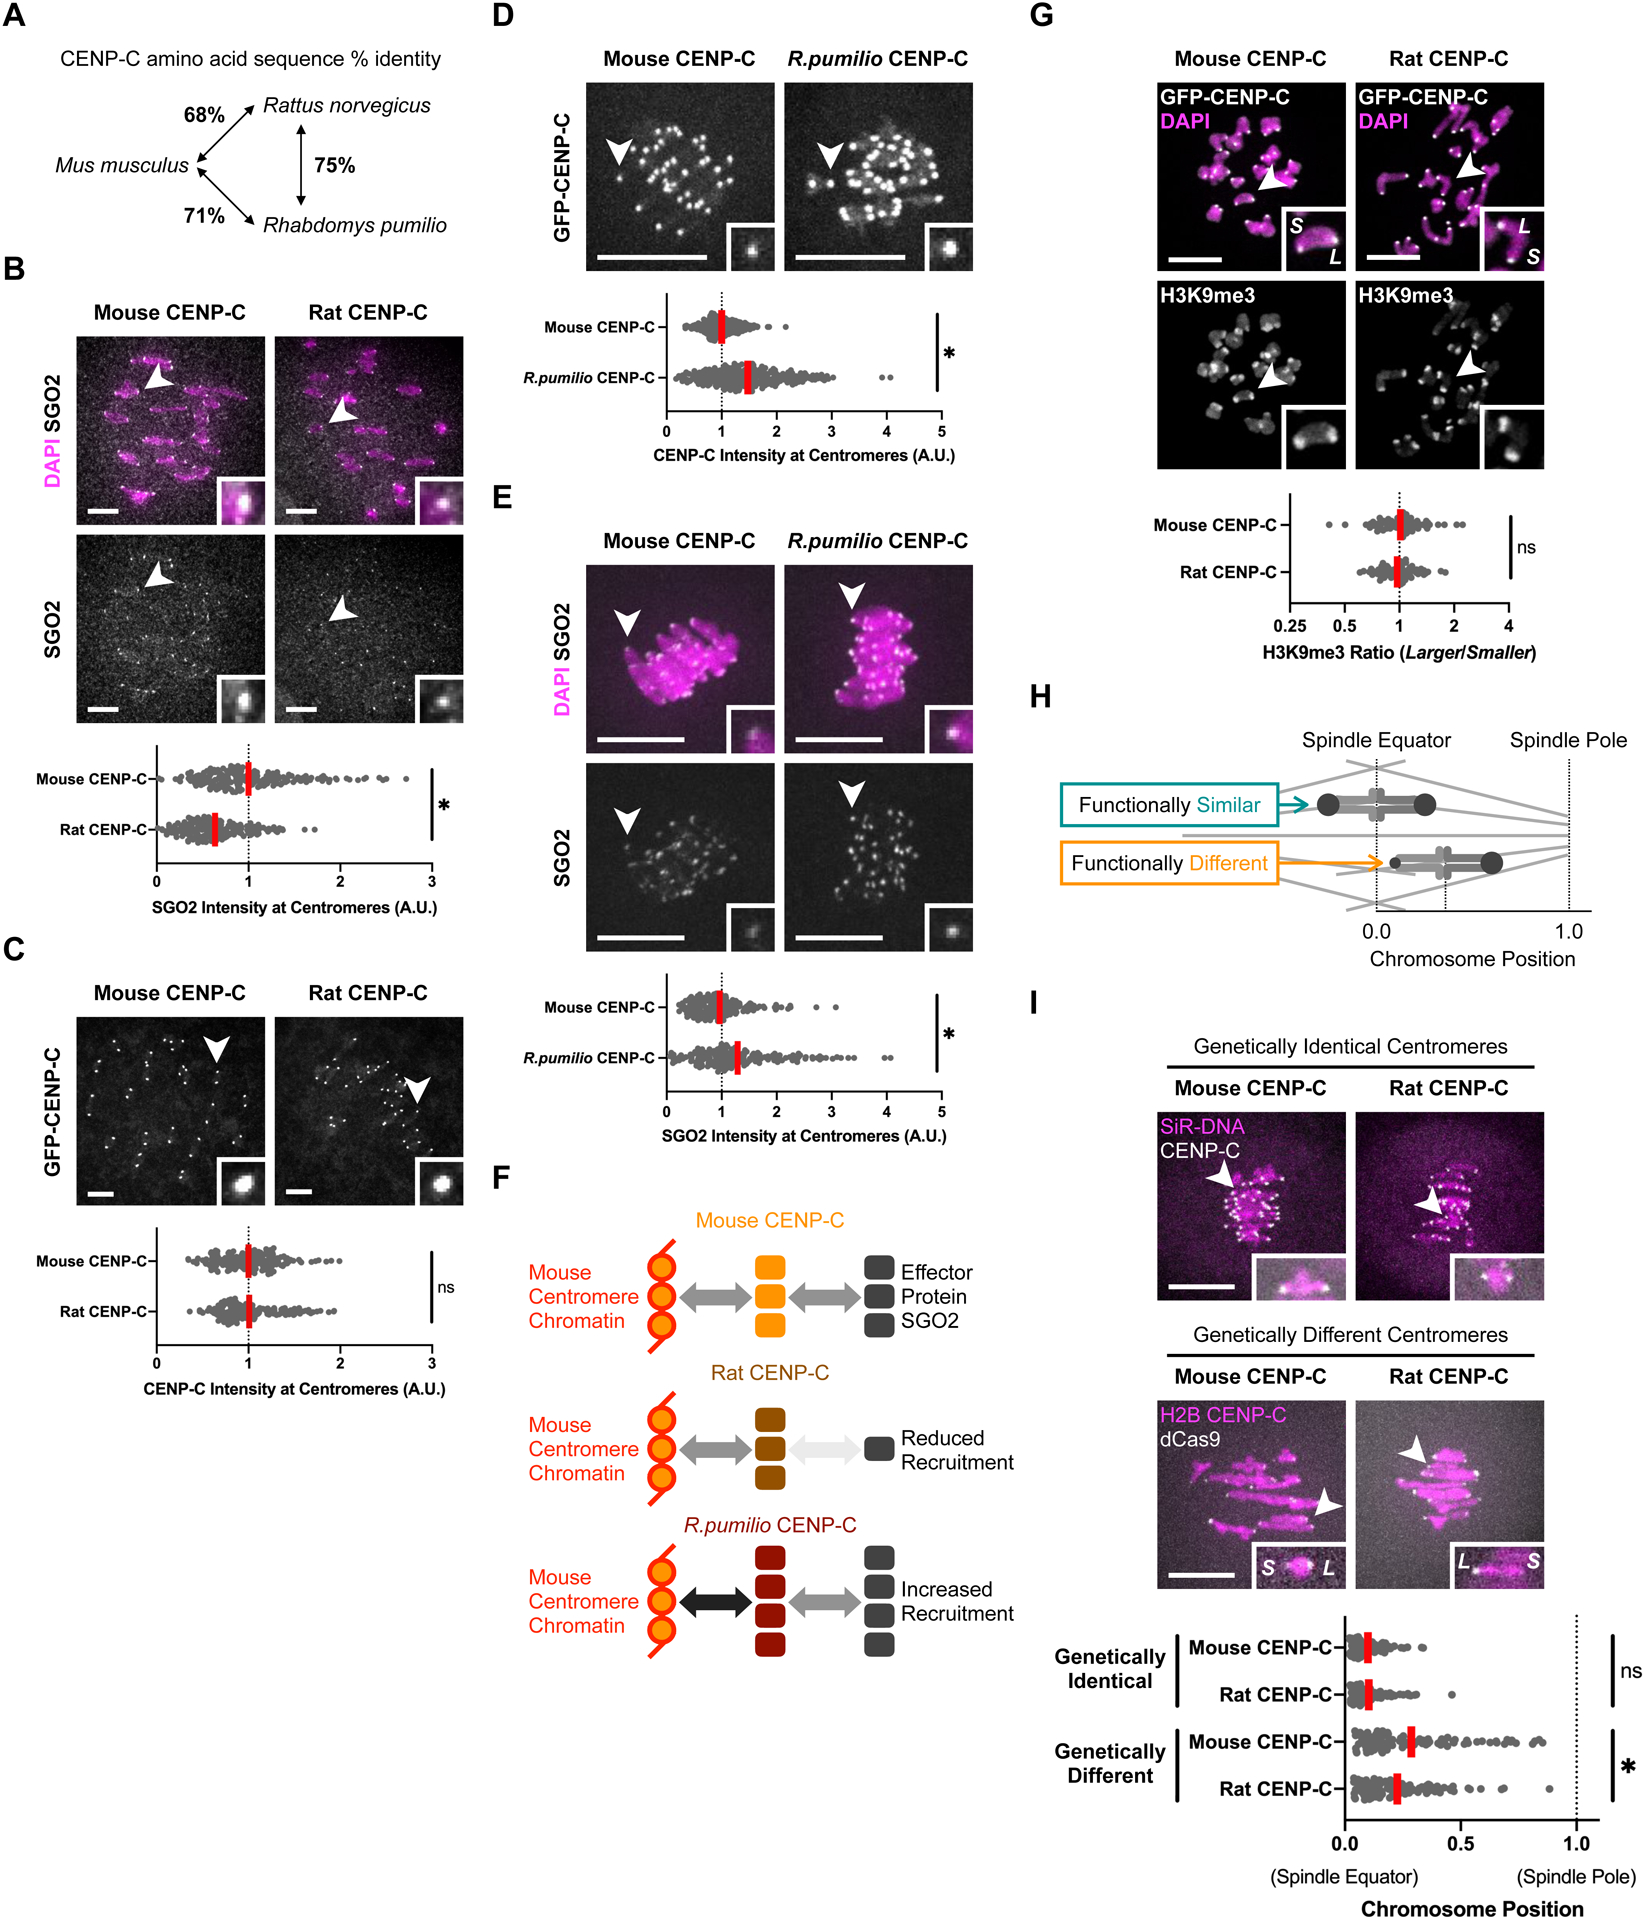
(A) CENP-C divergence between Mus musculus (mouse), Rattus norvegicus (rat), and Rhabdomys pumilio (a model organism closely related to Rhabdomys dilectus, Figure 4B).
(B and C) CF-1 oocytes were microinjected with cRNA for GFP-tagged mouse or rat CENP-C and fixed in prometaphase/metaphase I. Cells were stained for SGO2 (A) or analyzed for GFP fluorescence (B). 10μm scale bars, 2.2μm square insets. Plots show centromere signal intensities. Each dot represents a single centromere (n=200 centromeres from 20 oocytes for each construct); red line, mean; *p<0.05; ns: not significant.
(D and E) CF-1 oocytes were microinjected with cRNA for GFP-tagged mouse or R. pumilio CENP-C and fixed in prometaphase/metaphase I. Cells were analyzed for GFP fluorescence (D) or stained for SGO2 (E). 10μm scale bars, 2.2μm square insets. Plots show centromere signal intensities. Each dot represents a single centromere (n≥170 centromeres from ≥22 oocytes for each construct); red line, mean.
(F) Different CENP-C interfaces have changed to modulate effector recruitment. Schematics summarize the results of panels B to E. Compared to mouse CENP-C, rat CENP-C is similarly recruited to mouse centromere chromatin, but downstream effector recruitment is reduced. In contrast, R. pumilio CENP-C is recruited at higher levels to mouse centromere chromatin, leading to increased effector recruitment.
(G) CHPO hybrid oocytes (see Figure 1C) were microinjected with cRNA for GFP-tagged mouse or rat CENP-C, fixed in prometaphase/metaphase I, and stained for H3K9me3; 10μm scale bar, 5.9μm square inset. The H3K9me3 ratio for each pair of larger (L) and smaller (S) centromeres on a bivalent is plotted (n≥72 bivalents for each genotype); red line, geometric mean; ns: not significant.
(H) Schematic of chromosome position assay to measure functional differences between paired centromeres. Distance from the spindle pole to the equator is defined as 1 for each cell to normalize for variation in spindle size.
(I) For genetically identical centromeres, CF-1 oocytes were microinjected with cRNA for GFP-tagged mouse or rat CENP-C, and DNA was visualized with SiR-DNA. For genetically different centromeres, CHPO hybrid oocytes were microinjected with cRNA for GFP-tagged mouse or rat CENP-C, together with cRNAs for GFP-tagged H2B and mCherry-tagged dCas9 and gRNA targeting minor satellite centromere DNA. Cells were imaged live to preserve chromosome positions, measured at late metaphase I. In the plot, each dot represents a single bivalent (n=100 bivalents from 10 CF-1 oocytes and ≥20 CHPO hybrid oocytes for each construct); red line, mean.
In contrast to our results with rat CENP-C, R. pumilio CENP-C is recruited at higher levels to mouse centromeres compared to mouse CENP-C (Figure 2D), with similar expression levels as measured by cytoplasmic GFP (Supplementary Figure 1F). Consistent with this result, effector recruitment is also increased in cells expressing R. pumilio CENP-C (Figure 2E). Together, these findings show that different CENP-C interfaces, with centromere chromatin or with other kinetochore proteins, have changed through rodent evolution to modulate effector recruitment (Figure 2F). Furthermore, differences between R. pumilio and mouse CENP-C localization to mouse centromeres suggest that mouse CENP-C has evolved to weaken its interactions with centromere chromatin.
Rat CENP-C expression provides an experimental tool to specifically weaken the kinetochore pathway, without affecting heterochromatin (Figure 2G, Supplementary Figure 1G), allowing us to test our prediction that genetically different centromeres become functionally more similar in our hybrid model system (Figure 1G, Prediction 2). As a functional readout of centromere asymmetry, we analyzed chromosome position on the spindle at metaphase I (Figure 2H, Supplementary Figure 2A–2B). Chromosome position is sensitive to differences in interactions with spindle microtubules between centromeres of homologous chromosomes, which are paired in a meiotic bivalent. If the paired centromeres are genetically and functionally similar, then chromosomes align at the spindle equator in a typical metaphase configuration. In our CHPO hybrid model systems, paired centromeres are genetically and functionally different, and bivalents are positioned off-center on the spindle, with the larger centromere closer to its attached pole (Akera et al., 2019; Chmátal et al., 2014). Manipulations that make these genetically different centromeres functionally more similar will lead to positioning closer to the spindle equator, as previously shown by manipulating BUB1 kinase to equalize MCAK levels on larger and smaller centromeres (Akera et al., 2019). Conversely, manipulations that make the centromeres functionally more different will position bivalents closer to the poles. We find that expression of rat CENP-C in CHPO hybrid oocytes (Figure 1C) leads to bivalents positioned closer to the spindle equator (Figure 2I), without affecting meiotic progression (Supplementary Figure 2C). This result indicates that the paired larger and smaller centromeres are functionally more similar, consistent with the prediction that the symmetric heterochromatin pathway becomes relatively more dominant when the asymmetric kinetochore pathway is weakened (Figure 1G, Prediction 2). We also tested R. pumilio CENP-C expression but did not find changes in chromosome position (Supplementary Figure 1H), suggesting that the modest increase in effector recruitment (Figure 2E) does not impact microtubule destabilizing activity enough to be detected in our assay.
Deleting CENP-B weakens the heterochromatin pathway and makes centromeres functionally more asymmetric.
To determine the contribution of CENP-B to effector recruitment, we created Cenpb null mice using CRISPR genome editing (Supplementary Figure 3A–3C). We find that loss of CENP-B weakens both the kinetochore and heterochromatin pathways, as shown by reduced CENP-C and H3K9me3 staining, respectively (Figure 3A). These results are consistent with previous findings that CENP-B contributes to CENP-C recruitment and to formation of pericentromeric heterochromatin (Fachinetti et al., 2015; Okada et al., 2007; Otake et al., 2020). We also find reduced effector recruitment, as represented by SGO2 staining (Figure 3A), consistent with the idea that CENP-B recruits effectors through the kinetochore and heterochromatin pathways.
Figure 3: Deleting CENP-B weakens the heterochromatin pathway and makes centromeres functionally more asymmetric.
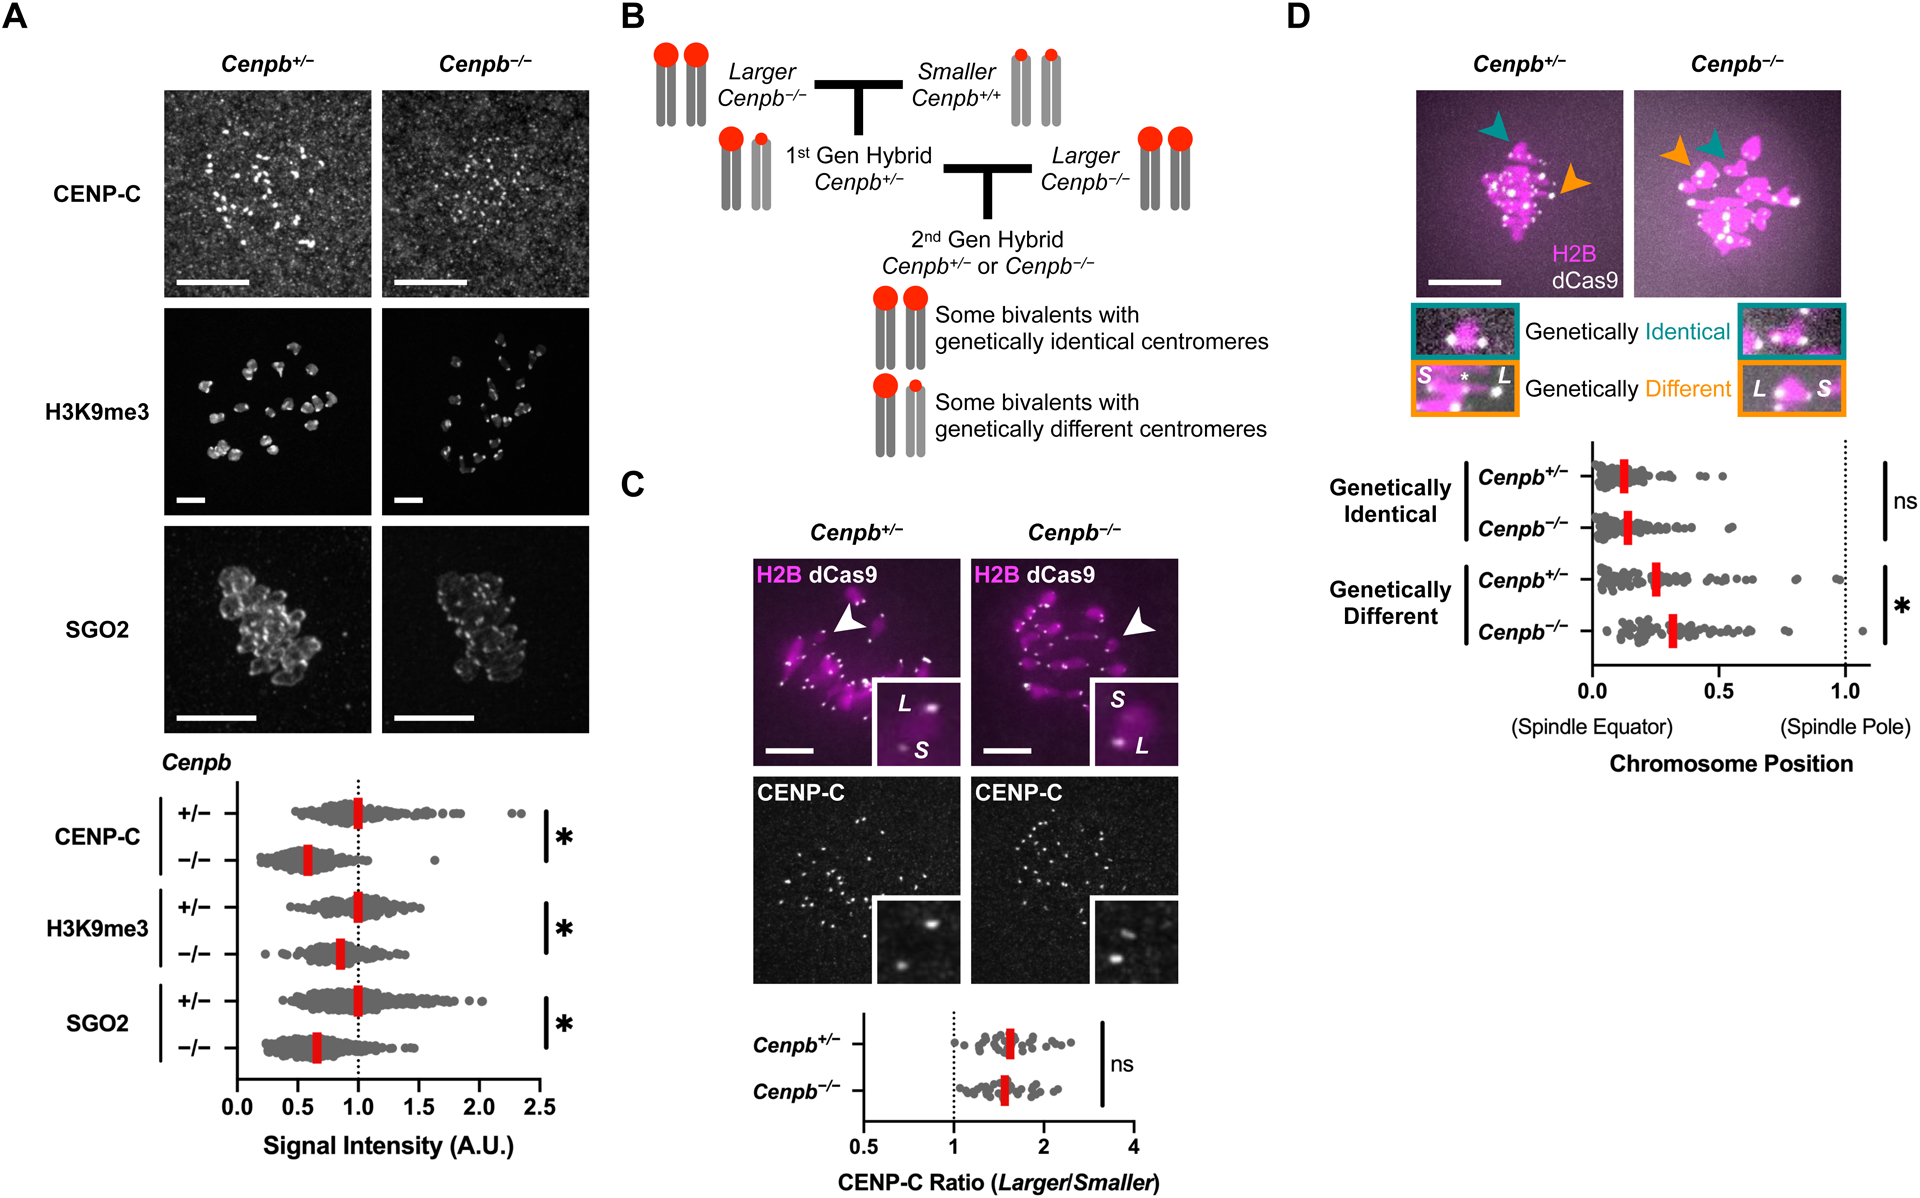
(A) Cenpb+/− or Cenpb−/− oocytes were fixed in prometaphase/metaphase of meiosis I and stained for CENP-C, H3K9me3, or SGO2; 10μm scale bar. Plot shows centromere signal intensities, normalized by mean intensity of Cenpb+/− control for each protein. Each dot represents a single centromere (n≥154 centromeres for each condition); red line, mean; *p<0.05.
(B) Crossing scheme to produce second-generation hybrid Cenpb−/− mice. Oocytes from these mice have bivalents with genetically identical centromeres as well as bivalents with genetically different centromeres.
(C) Second-generation hybrid oocytes were microinjected with cRNA for dCas9-EGFP and gRNA targeting minor satellite centromere DNA, fixed in prometaphase/metaphase I, and stained for CENP-C; 10μm scale bar, 5.9μm square inset. The CENP-C ratio is plotted for each pair of larger (L) and smaller (S) centromeres on bivalents with genetically different centromeres, determined from dCas9-EGFP signals (n=34 bivalents for each genotype); red line, geometric mean; ns: not significant.
(D) Second-generation hybrid oocytes were microinjected with cRNAs for dCas9-EGFP and H2B and gRNA targeting minor satellite centromere DNA. Cells were imaged live to preserve chromosome positions, measured at late metaphase I. In the plot, each dot represents a single bivalent (n≥74 bivalents for each genotype) with either genetically identical or genetically different centromeres, determined from dCas9-EGFP signals; red line, mean.
The known functions of CENP-B suggest two hypotheses for how it might affect centromeres in our CHPO hybrid model system. First, as the only centromere protein known to recognize a specific DNA sequence (the CENP-B box in repetitive centromere DNA) (Masumoto et al., 1989), CENP-B could be exploited by selfish larger centromeres with more CENP-B boxes to increase asymmetry via the kinetochore pathway. Second, CENP-B may suppress functional differences between centromeres by increasing the symmetric heterochromatin pathway. To test these hypotheses, we generated Cenpb null mice with paired larger and smaller centromeres through two generations of crosses (Figure 3B), and analyzed kinetochore pathway asymmetry and functional differences between centromeres. Due to technical limitations (Supplementary Figure 3D), we were unable to measure transmission bias in these animals. To determine the impact of CENP-B on the kinetochore pathway, we analyzed CENP-C in meiotic bivalents with paired larger and smaller centromeres in second-generation hybrid Cenpb−/− oocytes. CENP-C was reduced to a similar extent on both larger and smaller centromeres (Supplementary Figure 3E) and consistent with this equivalent reduction, the kinetochore asymmetry remained intact (Figure 3C). Therefore, CENP-B does not contribute to asymmetry in the kinetochore pathway, arguing against the first hypothesis that selfish centromere DNA exploits the kinetochore pathway via CENP-B.
To test the second hypothesis, that CENP-B acts as a suppressor through the symmetric heterochromatin pathway (Figure 1H), we examined functional differences between centromeres in second-generation hybrid oocytes, using the chromosome position assay (Figure 2H). We find that asymmetric bivalents with genetically different centromeres are positioned more off-center, closer to the spindle poles, in Cenpb−/− compared to control Cenpb+/− oocytes (Figure 3D). In contrast, we find no effect on positioning of symmetric bivalents with genetically identical centromeres in the same cells, and meiotic progression is similar in control and Cenpb−/− oocytes (Supplementary Figure 2D). Together these findings indicate that positioning of asymmetric bivalents closer to spindle poles in Cenpb−/− oocytes is due to increased functional differences between paired centromeres. This result is opposite to the result for rat CENP-C expression, which specifically weakens the kinetochore pathway (Figure 2B and 2G) and reduces functional asymmetry (Figure 2I). Therefore, although CENP-B deletion also weakens the kinetochore pathway, the dominant effect is to weaken a different pathway that equalizes centromeres, leading to increased functional asymmetry. Several lines of evidence indicate that this equalization pathway acts through heterochromatin: CENP-B is an established regulator of heterochromatin (Nakagawa et al., 2002; Okada et al., 2007; Otake et al., 2020), heterechromatin is similar on larger and smaller centromeres in our hybrid (Figure 1D) and reduced in Cenpb−/− oocytes (Figure 3A), and heterochromatin is an established pathway to recruit effector proteins (Abe et al., 2016; Ainsztein et al., 1998; Higgins and Prendergast, 2016; Kang et al., 2011; Marston 2015). We conclude that CENP-B suppresses functional differences between centromeres through the heterochromatin pathway. It is also possible, however, that CENP-B equalizes centromeres through an uncharacterized pathway independent of kinetochore assembly and heterochromatin.
Proteins in the kinetochore and heterochromatin pathways have signatures of recurrent adaptive evolution.
The original model of centromere drive and suppression posits an arms race between selfish centromere DNA and DNA-binding proteins such as CENP-A (Henikoff et al., 2001; Malik and Henikoff, 2001). This model predicts adaptive evolution of centromere protein domains that physically interact with DNA, and conservation of domains and other centromere proteins that do not bind DNA. In contrast, our parallel pathway model predicts signatures of recurrent adaptive evolution in protein domains leading to effector recruitment, including those that do not directly contact centromere DNA (Figure 4A). These changes could either weaken the kinetochore pathway or strengthen the heterochromatin pathway to make genetically different centromeres functionally more similar (Figure 1F). Rapid evolution of centromere proteins has been reported in several eukaryotic lineages, but there are no mechanistic studies of drive in these lineages (Finseth et al., 2015; Malik and Henikoff, 2001; Schueler et al., 2010; van der Lee et al., 2017). To analyze centromere protein evolution in a system where we have identified drive effectors, we tested for signatures of positive selection in Murinae. Because the sparseness of the phylogenetic tree of currently available Murinae genomes limits our statistical power to detect positive selection, we sequenced six additional genomes (Figure 4B) using linked-read whole genome sequencing (10x Genomics). Each genome was assembled onto the Mus musculus reference genome (mm10) with LongRanger and de novo assembled with Supernova (see STAR Methods and Supplementary Table 1). Sampling evolutionary time more comprehensively increases our opportunities to observe adaptive changes (and minimize false positives from stochastic changes by genetic drift), especially those adaptive changes that are common to multiple independent lineages. Thus, these genomes provide a valuable resource for molecular evolution approaches in mouse as a mammalian model organism, such as our analyses of centromere proteins discussed below.
Figure 4: Proteins in the kinetochore and heterochromatin pathways have signatures of recurrent adaptive evolution.
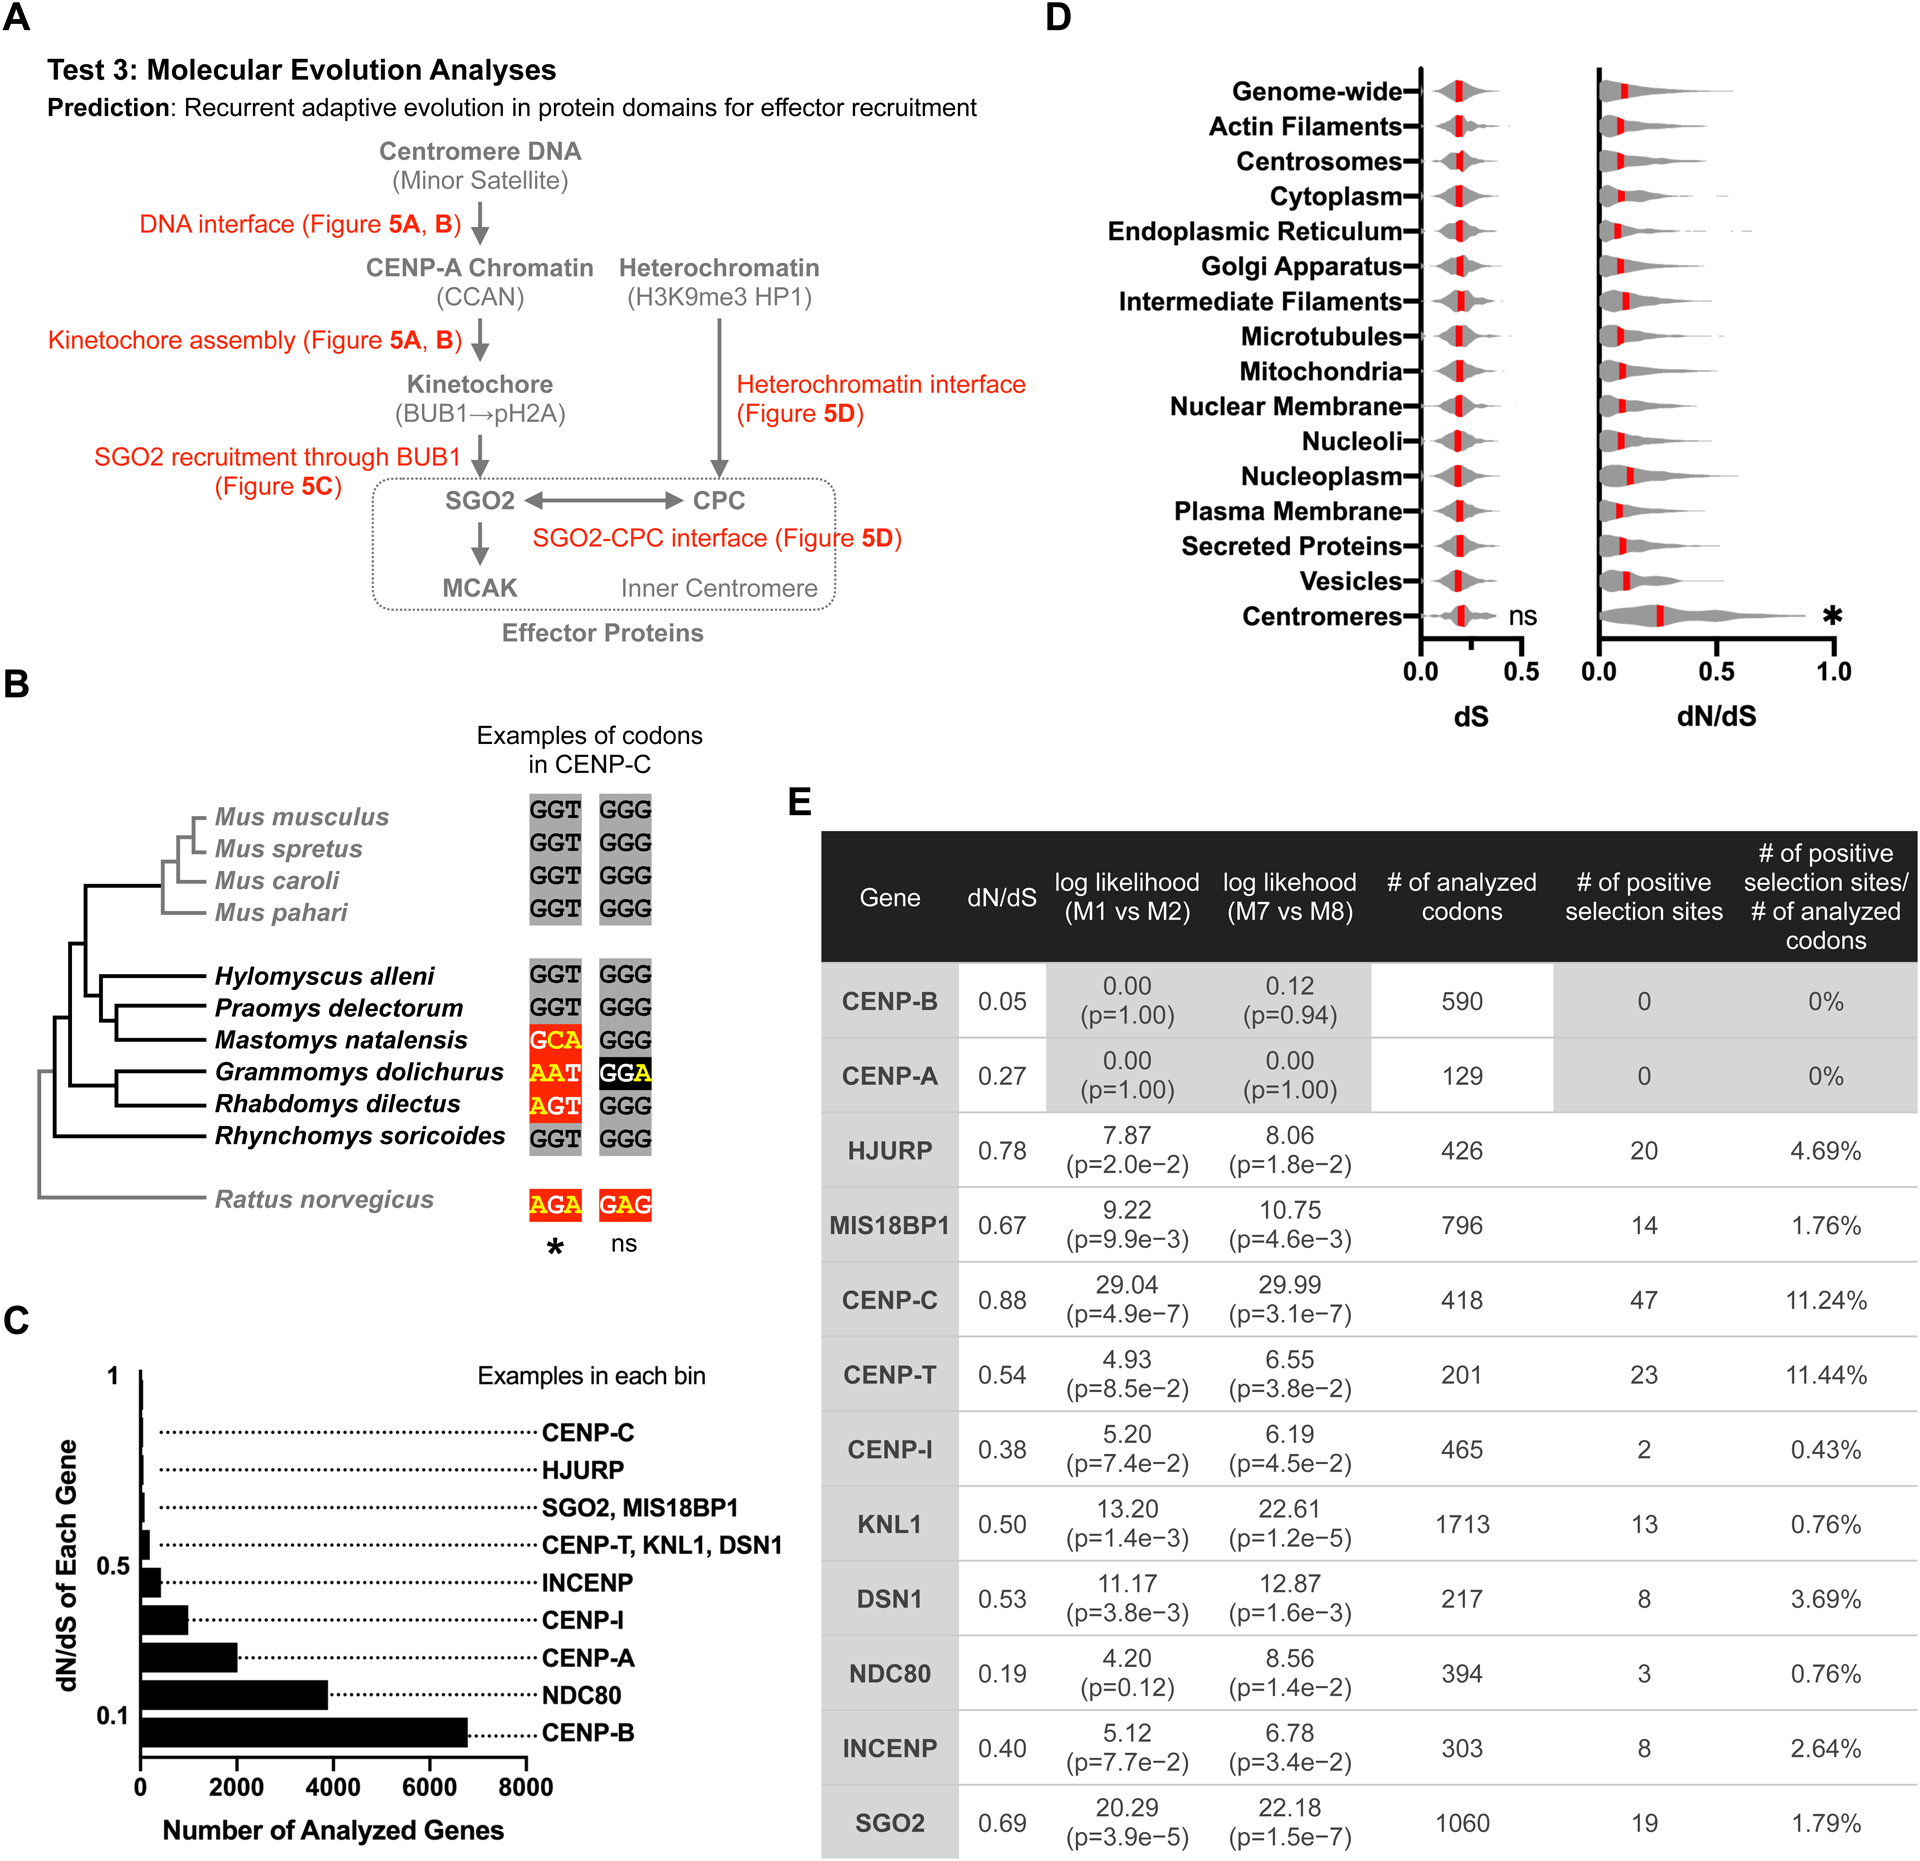
(A) Our parallel pathway model predicts that proteins in both pathways will have signatures of recurrent adaptive evolution at interfaces (shown in red) that lead to effector recruitment.
(B) Phylogenetic tree of Murinae species shows previously available genomes in gray and our sequenced genomes in black. Example codons show positive selection or neutral changes (mouse CENP-C Gly469 and Gly470). Nucleotide substitutions are shown in yellow, with synonymous and nonsynonymous substitutions highlighted in black or red, respectively. Higher numbers of nonsynonymous substitutions are interpreted as adaptive change under positive selection. PAML analysis: *P>0.99 for positive selection or not significant (ns) indicating a neutral change.
(C) Histogram shows the number of genes in each bin of dN/dS values, with examples of genes in each bin.
(D) Average dS and dN/dS across subcellular compartments. Red line, median; *p<0.05 for comparison to all other compartments.
(E) To test for signatures of positive selection in PAML, the likelihood of models of neutral codon evolution (M1 or M7) are compared to models allowing positive selection (M2 or M8). CENP-A and CENP-B are examples of genes without signatures of positive selection. See Supplementary Table 2 for other genes, Supplementary Figure 4 for a schematic of centromere proteins grouped by functional modules, and Supplementary Figure 5 for further analyses of CENP-A and CENP-B. The number of analyzed codons is less than the total protein length as insertions, deletions, and ambiguous alignments are not analyzed. The number of positive selection sites is the number of codons with P>0.90 from Naive Empirical Bayes (NEB) analysis or Bayes Empirical Bayes (BEB) analysis from model 2 or 8.
Low rates of nonsynonymous substitutions, which change the encoded amino acid, relative to synonymous substitutions (dN/dS) indicate purifying selection, as deleterious substitutions are selected against. Higher dN/dS indicates either adaptive evolution or loss of constraint, necessitating further analysis to identify signatures of positive selection (Echave et al., 2016; Sironi et al., 2015). We calculated dN/dS for all annotated mouse-rat orthologous genes. We find that multiple genes encoding centromere proteins have high dN/dS relative to the genome overall (Figure 4C), and the average dN/dS for these genes is significantly higher than for any other subcellular compartment (Figure 4D). We selected 46 genes with well-characterized centromere functions to analyze for signatures of positive selection based on phylogenetic analysis, using PAML (Yang, 2007). Consistent with our prediction, we find such signatures at multiple genes in the kinetochore and heterochromatin pathways (Figure 4E).
Extensive previous studies of centromere organization and function have established functional modules which can recruit drive effectors either directly or indirectly (Figure 4A). To fit our observations into this framework, we assigned genes to these modules (Supplementary Figure 4). One module is CENP-A chromatin. Selfish centromere DNA can increase effector recruitment by expanding CENP-A chromatin through increased deposition of CENP-A nucleosomes. This process depends on a specialized histone chaperone, HJURP, which is targeted to centromeres by the MIS18 complex though interactions with CENP-C or CENP-I (Dunleavy et al., 2009; Foltz et al., 2009; Fujita et al., 2007; Moree et al., 2011; Shono et al., 2015). We find rapid evolution of HJURP, MIS18BP1, CENP-I, and the domain of CENP-C that interacts with the MIS18 complex (Figure 4E and 5A). In contrast, heterochromatin proteins such as HP1 paralogs and SUV39H1, which are not specific to centromeres/pericentromeres, are highly conserved (Supplementary Table 2), consistent with the idea that heterochromatin broadly suppresses selfish genetic elements regardless of the underlying DNA sequence (Allshire and Madhani, 2017). These findings suggest that selection acts on the CENP-A chromatin assembly pathway to prevent expansion, but selfish centromere DNA does not exploit the heterochromatin pathway, consistent with our observation that genetically different centromeres have symmetric heterochromatin in our intra-species and inter-species hybrids (Figure 1D and our unpublished data).
Figure 5: Protein domains that lead to microtubule destabilizer recruitment are recurrently evolved.
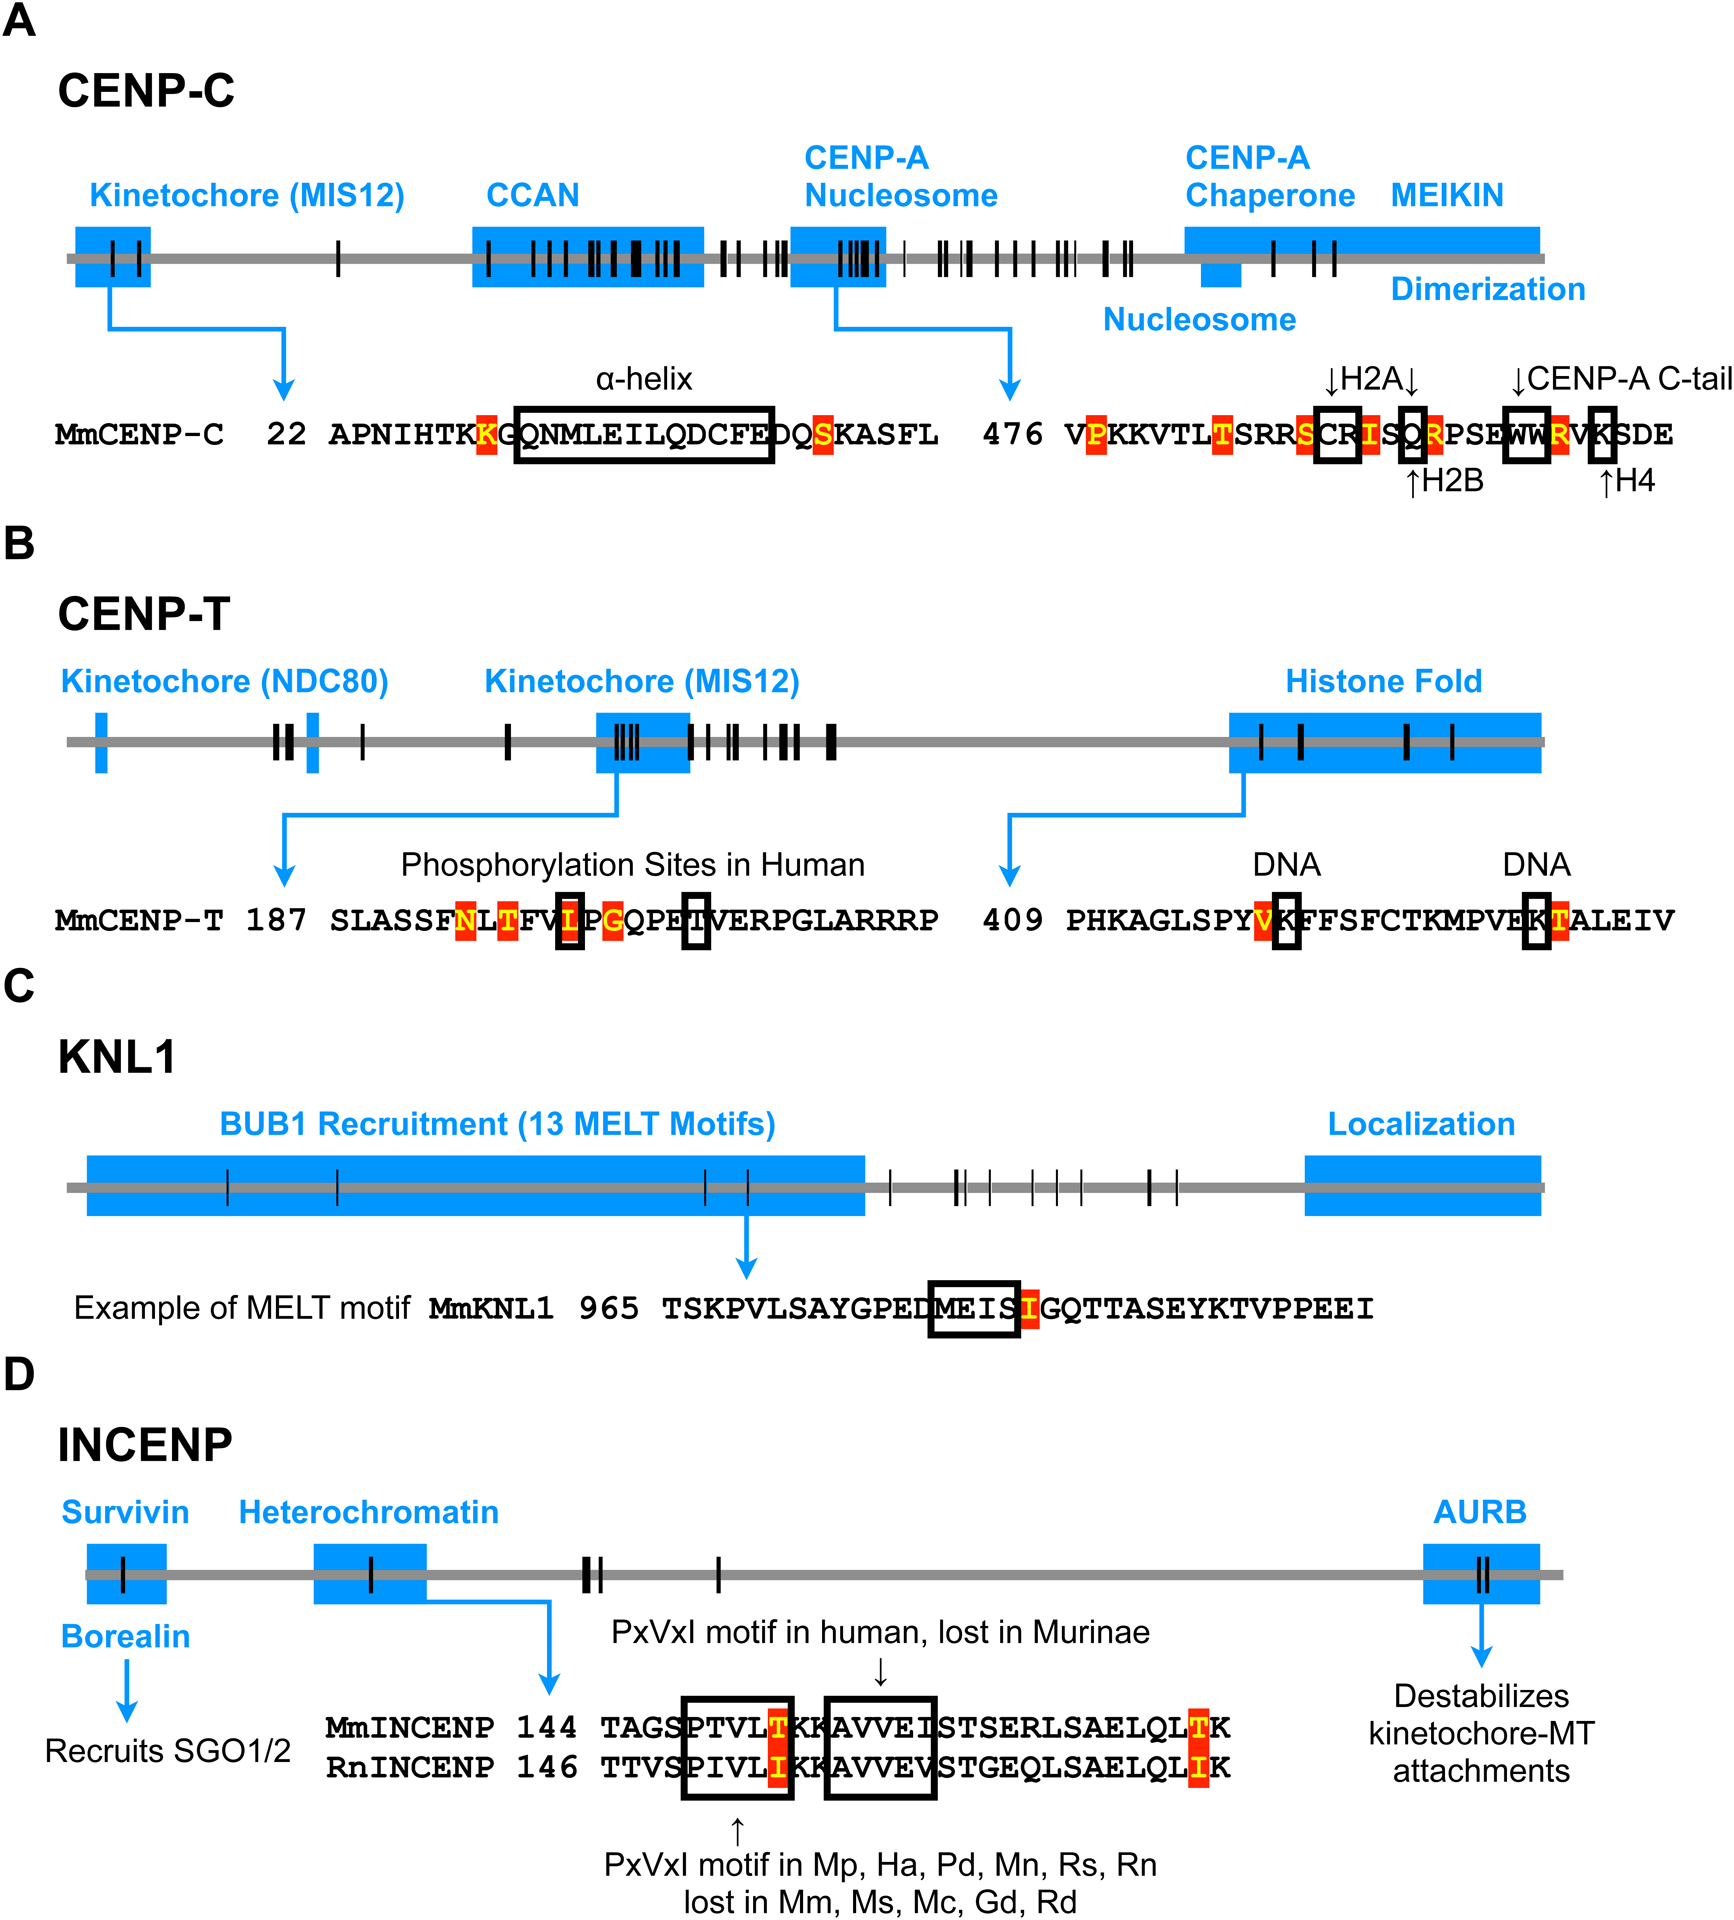
Each horizontal line represents the entire protein for each gene, and vertical lines represent positions of positively selected amino acids. Blue boxes show known functional domains from previous studies. Amino acid sequences within domains of interest are shown, with positively selected residues highlighted in red and known functional residues outlined in black.
(A) Signatures of positive selection are found throughout CENP-C. In the kinetochore domain, the a-helix interacts with MIS12 (Petrovic et al., 2016). The CCAN domain (also known as PEST domain) interacts with CENP-HIKM (Klare et al., 2015) and CENP-LN (Pentakota et al., 2017), and together forms the CENP-ACHIKMLN complex (Weir et al., 2016). In the domain interacting with CENP-A nucleosomes (also known as central region), residues interacting with H2A, H2B, H4 and the CENP-A C-terminal tail are indicated. This domain binds CENP-A nucleosomes more specifically than the more C-terminal nucleosome binding domain (also known as CENP-C motif), which also interacts with H3 nucleosomes (Allu et al., 2019; Kato et al., 2013). The CENP-C C-terminus has multiple functions, including M18BP1 recruitment (Dambacher et al., 2012), MEIKIN recruitment (Kim et al., 2015), and dimerization (Sugimoto et al., 1997).
(B) Signatures of positive selection are found in the kinetochore interaction domain and histone fold domain of CENP-T. CDK1-dependent phosphorylation at Thr195 and Ser201 in human CENP-T (substituted with Leu and Thr, respectively, in mice) regulates MIS12 recruitment (Rago et al., 2015; Veld et al., 2016). Signatures of positive selection are detected around these regulatory residues for MIS12 recruitment. Some DNA interacting residues within the histone fold domain are shown (Nishino et al., 2012).
(C) Signatures of positive selection are found in the domain of KNL1 that recruits BUB1 via repeated MELT motifs (Krenn et al., 2013). One MELT motif is shown as an example.
(D) Signatures of positive selection are found in domains of INCENP that interact with Borealin/Survivin, with heterochromatin, and with Aurora B kinase. Heterochromatin recruits INCENP (Abe et al., 2016; Ainsztein et al., 1998; Kang et al., 2011), and Borealin mediates the interaction with SGO1/2 (Tsukahara et al., 2010). Survivin binds cohesin and pH3T3 at pericentromeres (Kelly et al., 2010; Wang et al., 2010; Yamagishi et al., 2010), providing another mechanism to localize the CPC. A PxVxI motif, which interacts with the HP1 chromoshadow domain, is present in some Murinae species and lost in others, shown with Mus musculus (Mm) and Rattus norvegicus (Rn) as examples. Other species from the phylogenetic tree in Figure 4B: Mus spretus (Ms), Mus caroli (Mc), Mus pahari (Mp), Hylomyscus alleni (Ha), Praomys delectorum (Pd), Mastomys natalensis (Mn), Grammomys dolichurus (Gd), Rhabdomys dilectus (Rd), and Rhynchomys soricoides (Rs).
Under our model (Figure 1B), selfish centromere DNA can also recruit more effectors through the kinetochore pathway by strengthening direct interactions with CENP-A or with the constitutive centromere-associated network (CCAN), leading to larger kinetochores and more BUB1 kinase. Proteins can subsequently adapt by weakening interactions either with DNA or with other kinetochore proteins (Figure 4A, DNA interface and kinetochore assembly). Within the CCAN, CENP-C and CENP-T connect CENP-A chromatin to kinetochore proteins. The middle part of CENP-C interacts with CENP-A nucleosomes, while the N-terminus interacts with the MIS12 kinetochore complex (Petrovic et al., 2016; Weir et al., 2016). Similarly, the CENP-TWSX nucleosome-like complex contacts centromere DNA, and the other end of CENP-T interact with MIS12 and NDC80 kinetochore complexes (Cortes-Silva et al., 2020; Nishino et al., 2012; Veld et al., 2016). Consistent with our model, we detect signatures of positive selection in the chromatin-interacting domains and the kinetochore-interacting domains of both CENP-C and CENP-T (Figure 5A and 5B). In contrast, the DNA-interacting domain of CENP-B is conserved, consistent with our finding that selfish centromere DNA does not exploit CENP-B. Unlike in other eukaryotic lineages such as monkeyflower, fly, and primates (Finseth et al., 2015; Malik and Henikoff, 2001; Schueler et al., 2010), we do not detect signatures of positive selection in the part of CENP-A that can be aligned in Murinae species, but the N-terminal tail is duplicated in some species and therefore difficult to analyze by standard methods (Supplementary Figure 5A). Diversification of the CENP-A N-terminal tail is also observed in plants, where crosses between strains expressing different alleles exhibit zygotic segregation errors and genome elimination (Maheshwari et al., 2015).
In the kinetochore module, proteins can adapt to weaken the kinetochore pathway by reducing either kinetochore assembly or BUB1 binding to the kinetochore (Figure 4A). We find rapid evolution of the kinetochore proteins DSN1, KNL1, and NDC80. DSN1 is a component of the MIS12 complex, which assembles onto the CCAN and serves as a platform for binding KNL1 and the NDC80 complex (Petrovic et al., 2014). KNL1 contains multiple protein docking motifs, including repeated MELT motifs that recruit BUB1 kinase (Musacchio and Desai, 2017). Thus, changes in DSN1 and KNL1 can regulate kinetochore assembly and BUB1 recruitment. Consistent with the possibility that these interfaces evolve to modulate effector recruitment, we find signatures of positive selection in the MELT motifs of KNL1 (Figure 5C). NDC80 is the major microtubule binding protein in the kinetochore, but we find signatures of positive selection in the coiled-coil domain and not in the microtubule interacting domain. The coiled-coil domain recruits the SKA complex, which stabilizes kinetochore-microtubule attachment (Veld et al., 2019) and could be involved in counteracting destabilizing activities exploited by selfish centromeres.
Although selfish centromere DNA is likely unable to exploit heterochromatin to drive, inner centromere proteins can adapt to increase effector recruitment through the heterochromatin pathway relative to the kinetochore pathway in our model. In the inner centromere module (Figure 4A), INCENP is a scaffold component of the CPC that interacts directly with heterochromatin and indirectly with SGO1/2 (Abe et al., 2016; Ainsztein et al., 1998; Kang et al., 2011; Tsukahara et al., 2010). Other CPC components, Borealin and Survivin, regulate SGO1/2 recruitment and pericentromeric localization (Kelly et al., 2010; Tsukahara et al., 2010; Wang et al., 2010; Yamagishi et al., 2010). The catalytic component of the CPC is Aurora B kinase, which phosphorylates kinetochore substrates to destabilize microtubule interactions and is thus a potential drive effector. We find that positive selection shapes the domains of INCENP that interact with Borealin/Survivin, with HP1, and with Aurora B (Figure 5D), suggesting that INCENP can adapt to selfish centromere DNA by modulating its localization to pericentromeric heterochromatin and ultimately the recruitment of SGO1/2 and Aurora B. Furthermore, we find rapid evolution of SGO2, suggesting that it can also tune the relative strength of the two pathways through mutations that modulate its recruitment by either pathway. In comparison, SGO1 is a paralog of SGO2 that does not recruit MCAK (Yao and Dai, 2012) and does not have signatures of positive selection, suggesting that evolutionary pressure to regulate MCAK recruitment shapes SGO2 evolution. Overall, our molecular evolution analyses show signatures of positive selection in both the kinetochore and heterochromatin pathways. We find these changes both in domains that interact directly with DNA and in protein-protein interaction domains leading to recruitment of drive effectors. These results are consistent with our parallel pathway model for drive and suppression, but not with a simpler model of an arms race limited to centromere DNA and DNA binding proteins.
Discussion
Here we propose a parallel pathway model for drive and suppression of selfish centromeres: centromere DNA can exploit the kinetochore pathway to increase effector recruitment, and centromere protein evolution can make centromeres functionally equivalent by minimizing the contribution of the kinetochore pathway relative to the heterochromatin pathway (Figure 6A). This model predicts that disruption of either pathway will reduce effector (e.g., SGO2) recruitment, but the functional consequences will depend on which pathway is affected. Centromeres become either functionally more similar if the asymmetric kinetochore pathway is weakened, or more different if the symmetric heterochromatin pathway is weakened. In our experiments, either introduction of a divergent allele of CENP-C or deletion of CENP-B leads to SGO2 reduction to a similar extent (Figure 2B and 3A). However, genetically different centromeres in CHPO hybrid oocytes become functionally more similar when rat CENP-C is expressed (Figure 2I), whereas they become functionally more different when CENP-B is deleted (Figure 3D). The CENP-C results are consistent with our model prediction that natural selection has acted on CENP-C interfaces involved in effector recruitment, so a divergent rat CENP-C interacts less well with mouse binding partners in the kinetochore pathway. Therefore, expression of rat CENP-C weakens the asymmetric kinetochore pathway, making the symmetric heterochromatin pathway relatively more dominant. In contrast, CENP-B deletion weakens the symmetric heterochromatin pathway, as shown by reduced H3K9me3, making the asymmetric kinetochore pathway more dominant. Loss of CENP-B also reduces CENP-C recruitment but does not affect the asymmetry between larger and smaller centromeres (Figure 3C).
Figure 6: Summary of parallel pathway model and dual functions of CENP-B in heterochromatin and CENP-A chromatin.
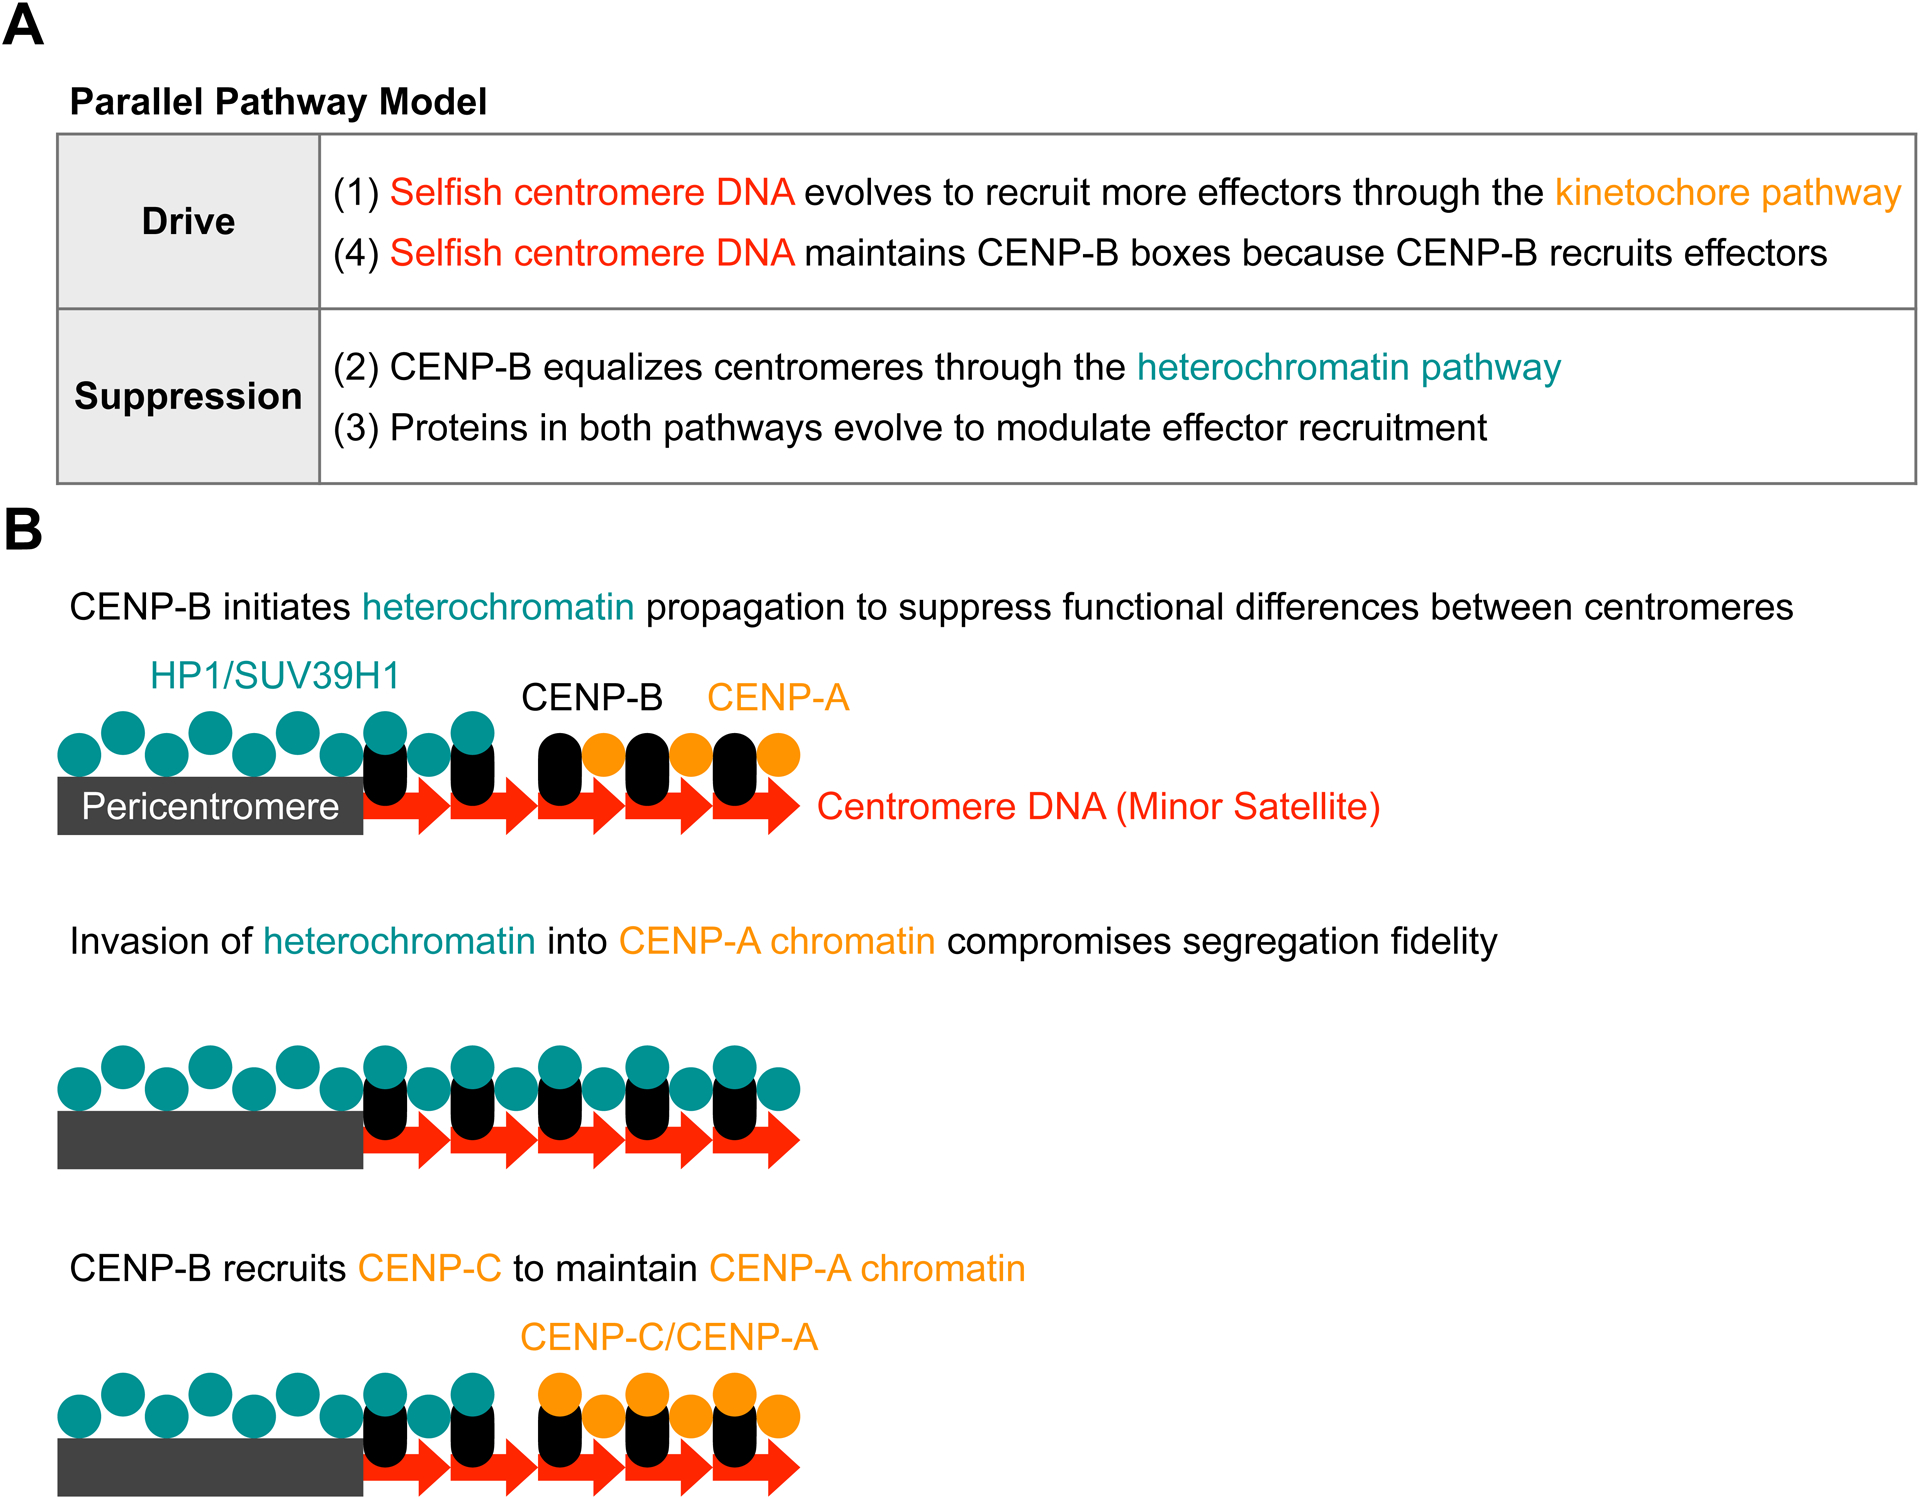
(A) Selfish centromere DNA recruits more effector proteins through the kinetochore pathway to drive (1). CENP-B equalizes centromeres through the symmetric heterochromatin pathway (2), but the asymmetric kinetochore pathway is dominant in our hybrid model system. Proteins in both pathways evolve to functionally equalize genetically different centromeres by modulating effector recruitment (3). Selfish centromere DNA can evolve again to recruit more effector proteins. However, CENP-B boxes will be maintained because CENP-B recruits effector proteins (4).
(B) CENP-B initiates heterochromatin formation to equalize centromeres (top). Despite the difference in CENP-B binding sites, larger and smaller centromeres have similar amounts of H3K9me3 (Figure 1D), indicating that heterochromatin formation is insensitive to CENP-B abundance, likely due to self-propagation of heterochromatin. Invasion of heterochromatin into CENP-A compromises centromere function (middle). To prevent this disruption, we propose that CENP-B has acquired an additional function in CENP-A chromatin (bottom): CENP-B recruits CENP-C but does not contribute to CENP-C asymmetry between larger and smaller centromeres (Figure 3C), suggesting that only CENP-B within CENP-A chromatin recruits CENP-C. Thus, CENP-B functions in heterochromatin and CENP-A chromatin are insensitive to repeat expansion.
Our molecular evolution analyses show adaptive evolution in multiple centromere proteins and in specific domains that interact with CENP-A chromatin or with other proteins leading to effector recruitment (Figure 4 and 5). The previous model of a molecular arms race limited to interactions between centromere DNA and DNA-interacting proteins (such as CENP-A) (Henikoff et al., 2001) does not explain the more widespread recurrent evolution of centromere proteins. An alternative explanation, independent of centromere drive, is that the selective pressure may be related to non-centromere functions. For example, kinetochore proteins are repurposed for neural development in fly and worm (Cheerambathur et al., 2019; Zhao et al., 2019), and KNL1 (also known as CASC5) is implicated in human brain size regulation (Javed et al., 2018; Shi et al., 2016). However, such non-centromere functions have not been identified more broadly in eukaryotes. In contrast, our parallel pathway model predicts recurrent evolution of proteins in both pathways to equalize centromeres by weakening the kinetochore pathway or strengthening the heterochromatin pathway. In our model, selfish centromere DNA evolves to exploit the kinetochore pathway by recruiting more of a protein that ultimately recruits effectors. To suppress functional differences between centromeres, proteins in the kinetochore pathway can adapt to minimize the impact of selfish centromere DNA on kinetochore formation or effector recruitment. Indeed, our findings with R. pumilio CENP-C indicate that mouse CENP-C is not optimized for maximum binding to mouse centromeres, effectively weakening the kinetochore pathway (Figure 2D). Furthermore, proteins in the heterochromatin pathway such as CENP-B can adapt to increase effector recruitment equally at all centromeres, or INCENP and SGO2 can adapt by modulating their recruitment by either pathway (Figure 6A). The acidic domain of CENP-B is implicated in recruiting heterochromatin proteins (Otake et al., 2020), and the number of negatively charged amino acids in this domain is recurrently changed in mammals (Supplementary Figure 5B and 5C). Although these changes are not analyzed in PAML, they suggest that CENP-B may have evolved to regulate pericentromeric heterochromatin. Overall, a protein network for effector recruitment can adapt to minimize asymmetric recruitment by selfish centromere DNA, while maintaining essential functions of the kinetochore and of microtubule destabilizing factors for accurate chromosome segregation.
Our results suggest an explanation for the conservation of CENP-B in mammals, as well as the presence of its binding sequence, the CENP-B box, at most mammalian centromeres with the notable exception of the Y chromosome. Although CENP-B is the only centromere protein known to bind a specific DNA sequence in mammals, neither the protein nor the binding sequence is essential for centromere function (Amor et al., 2004; Hudson et al., 1998; Kapoor et al., 1998; Logsdon et al., 2019; Perez-Castro et al., 1998). We propose that CENP-B is conserved because it suppresses functional differences between centromeres by strengthening the heterochromatin pathway (Figure 6B), consistent with a more general function of heterochromatin in suppressing many selfish genetic elements (Allshire and Madhani, 2017). This CENP-B function is important only when centromeres of homologous chromosomes are different, which would frequently occur in outbred populations. Loss of CENP-B therefore increases functional difference between larger and smaller centromeres in our hybrid model, but does not significantly impair fertility or viability in inbred laboratory strains (Hudson et al., 1998; Kapoor et al., 1998; Perez-Castro et al., 1998). A potential cost of increasing heterochromatin, however, is that its invasion into CENP-A chromatin disrupts centromere function (Ohzeki et al., 2016). We therefore propose that mammalian CENP-B has acquired an additional function to maintain CENP-A chromatin, by recruiting CENP-C and CENP-A chromatin regulators (Fachinetti et al., 2015; Otake et al., 2020) (Figure 6B). Consistent with this idea, CENP-A chromatin is reduced in Cenpb null oocytes (Supplementary Figure 3F). By regulating both CENP-A chromatin and heterochromatin, alternative functions of CENP-B in different chromatin environments may suppress functional differences between centromeres through heterochromatin while maintaining centromere function. CENP-B can suppress differences between centromeres only if its functions are insensitive to expansion of the number of CENP-B binding sites; otherwise it would contribute to higher levels of effector recruitment by DNA repeat expansions. Indeed, we find that CENP-B does not contribute to asymmetry in CENP-C recruitment between larger and smaller centromeres (Figure 3C), despite 6- to 10-fold differences in minor satellite sequences containing CENP-B boxes (Iwata-Otsubo et al., 2017). This result suggests that CENP-B recruits CENP-C only within the CENP-A chromatin domain, so that CENP-B binding outside of this domain does not strengthen the kinetochore pathway. Furthermore, the heterochromatin symmetry between larger and smaller centromeres (Figure 1D) suggests that although CENP-B contributes to initiating heterochromatin formation, for example by recruiting an H3K9 methyltransferase, heterochromatin spreading does not depend on the number of CENP-B boxes. Initiation of heterochromatin propagation is a common mechanism to regulate heterochromatin formation, as in the example of X inactivation where XIST initiates heterochromatinization of the entire chromosome (Allshire and Madhani, 2017). Thus, CENP-B functions in CENP-A chromatin and heterochromatin are insensitive to repeat expansion. A centromere variant completely lacking CENP-B boxes, however, will lose to an existing centromere in female meiosis because it will recruit less effectors by both the kinetochore and heterochromatin pathways. Therefore, CENP-B boxes are maintained at most centromeres (Figure 6A), but this selective pressure does not affect the Y chromosome, which never experiences female meiosis and does not bind CENP-B (Gamba and Fachinetti, 2020).
Genetic conflict between selfish centromere DNA and centromere-binding proteins potentially explains the complexity of eukaryotic centromeres. Opportunities for selfish genetic elements to exploit the chromosome segregation machinery are not limited to female meiosis, as selfish plasmids (e.g., 2-micron plasmids in budding yeast) benefit by maximizing their transmission to daughter cells in mitosis (Malik and Henikoff, 2009; Rizvi et al., 2017). These opportunities are limited by the strong epigenetic component of most eukaryotic centromeres, which are not defined by specific DNA sequences. Centromeres cannot be completely independent of the underlying DNA sequence, however, because some protein must interact with DNA, so different sequences can have different binding affinities or impact the structure of the centromeric nucleosome complex (Allu et al., 2019). The presence of multiple pathways to form a kinetochore (e.g., via CENP-ACLN and CENP-TWSX connected by CENP-HIKM, or via CENP-OPQUR) (Cortes-Silva et al., 2020; Hamilton et al., 2020; Nishino et al., 2012; Pesenti et al., 2018; Veld et al., 2016; Weir et al., 2016; Yan et al., 2019) allows proteins to adapt by minimizing a pathway that is exploited by a selfish element, while maintaining kinetochore function via other pathways. Consistent with this idea of independent modules for kinetochore formation, CENP-A depletion leads to proportional reduction of centromeric CENP-C, whereas CENP-T and CENP-I persist longer (Fachinetti et al., 2013). In addition, recurrent changes in kinetochore modules are observed throughout eukaryotic evolution, such as changes in the number of MELT motifs in KNL1 and replacement of the SKA complex by the DAM complex (Hooff et al., 2017; Tromer et al., 2015). Regulation of kinetochore-microtubule attachment stability may be another way to suppress selfish genetic elements, as MELT motifs recruit BUB1 and SKA and DAM complexes stabilize attachments. Thus, internal conflicts between selfish genetic elements and the chromosome segregation machinery may have shaped complexity in eukaryotic centromeres.
Limitations of the Study
Although we are able to experimentally weaken the kinetochore pathway specifically by rat CENP-C expression, we are unable to reduce heterochromatin without also perturbing the kinetochore pathway. Functional changes in heterochromatin likely require manipulations on longer timescales than the typical microinjection experiment, so testing possible experimental strategies will require transgenic or genome-edited animals. Given this limitation, our results imply that the dominant effect of CENP-B deletion is to weaken the heterochromatin pathway, as explained in the Results section. Alternatively, CENP-B may equalize centromeres through an uncharacterized pathway independent of kinetochore assembly and heterochromatin, to explain our finding that CENP-B deletion increases functional asymmetry.
STAR Methods
RESOURCE AVAILABILITY
Lead Contact
Further information and requests for resources and reagents should be directed to and will be fulfilled by the Lead Contact, Michael A. Lampson (lampson@sas.upenn.edu).
Materials Availability
Plasmids generated in this study will be available from Addgene (Michael Lampson Lab Plasmids).
Data and Code Availability
The draft genomes and raw sequencing reads have been submitted to the NCBI BioProject database (https://www.ncbi.nlm.nih.gov/bioproject) under accession number PRJNA669840. Raw imaging data is available from the authors upon request.
In-house scripts and pipelines are deposited to GitHub (https://github.com/TomoKumon/Kumon_Cell_2021) with DOI 10.5281/zenodo.5129774.
Any additional information required to reanalyze the data reported in this work paper is available from the Lead Contact upon request.
EXPERIMENTAL MODEL AND SUBJECT DETAILS
Mice
Mouse strains were purchased from the Jackson Laboratory (ZALENDE/EiJ, stock #001392 corresponds to CHPO; C57BL/6J, stock# 000664) and from Envigo (NSA, stock# 033 corresponds to CF-1). CHPO males were crossed to CF-1 females to generate hybrids shown in Figure 1C and Supplementary Figure 1B. The CHPO strain contains seven Robertsonian fusions (Rb(1.3), Rb(4.6), Rb(5.15), Rb(11.13), Rb(8.12), Rb(9.14), and Rb(16.17)), each of which pairs with two CF-1 chromosomes in CHPO hybrid meiosis I to form a trivalent (Chmátal et al., 2014). We included only bivalents (chromosome 2, 7, 10, 18, 19, X) in our analyses to avoid complications of trivalents.
In order to generate CENP-B null mice, 1-cell embryos (from female CF-1 and male DBA/2J × C57BL/6J hybrid) were collected and microinjected with Cas9 mRNA (TriLink, CleanCap Cas9 mRNA, L-7606) and gRNA (GAAGAACAAGCGCGCCA) (Thermo Fisher scientific, GeneArt Precision gRNA Synthesis Kit, A29377). Embryos were cultured in vitro until blastocyst stage and transferred to pseudopregnant females to produce a founder mouse carrying 37bp deletion (TGAGCACCATCCTGAAGAACAAGCGCGCCATCCTGGC) that produces a premature stop codon at Leu100 in the DNA binding domain. The founder was crossed with C57BL/6J for multiple generations to remove possible off-target mutations. Mice were genotyped by extracting genomic DNA from tail clip (QIAGEN, DNeasy Blood & Tissue Kit, 69504) and amplifying a Cenpb fragment (Agilent, Herculase II Fusion DNA Polymerase). To generate Cenpb null mice with larger and smaller centromeres, CHPO females were crossed to C57BL/6J Cenpb null males to generate first generation hybrid females, which were then crossed to C57BL/6J Cenpb null males to generate second-generation hybrid females as shown in Figure 3B and Supplementary Figure 3D. All animal experiments were approved by the Institutional Animal Care and Use Committee and were consistent with the National Institutes of Health guidelines. The age of the mice used in the study was 8–14 weeks.
METHOD DETAILS
Oocyte Collection and Culture
Female mice (8–14 weeks of age) were hormonally primed with 5U of Pregnant Mare Serum Gonadotropin (PMSG, Calbiochem, cat# 367222) or 0.1mL of CARD HyperOva (Cosmo Bio, KYD-010-EX) 44–48 h prior to oocyte collection. Germinal vesicle (GV)-intact oocytes were collected in M2 medium (Sigma, M7167), denuded from cumulus cells, and cultured in Chatot-Ziomek-Bavister (CZB) medium (Thermo Fisher, MR019D) in a humidified atmosphere of 5% CO2 in air at 37.8C°. During collection, meiotic resumption was inhibited by addition of 2.5 mM milrinone. Milrinone was subsequently washed out to allow meiotic resumption. Oocytes were checked for GVBD (germinal vesicle breakdown), and those that did not enter GVBD stage were removed from the culture.
Oocyte Microinjection
GV oocytes were microinjected with ~5 pl of cRNAs in M2 medium (with 2.5 mM milrinone and 3mg/mL BSA) at room temperature (RT) with a micromanipulator TransferMan NK 2 (Eppendorf) and picoinjector (Medical Systems Corp.). After the injection, oocytes were kept in milrinone for 16 h to allow protein expression. cRNAs used for microinjections were dCas9-EGFP (dead Cas9 with EGFP at the N terminus) at 1000ng/μL, dCas9-mCherry (dead Cas9 with mCherry at the N terminus) at 1000ng/μL, gRNA that targets minor satellite repeat (ACACTGAAAAACACATTCGT) at 200ng/μL, H2B-EGFP (human histone H2B with EGFP at the C terminus) at 150ng/μL, H2B-mCherry (human histone H2B with mCherry at the C terminus) at 150ng/μL, EGFP-MmCENP-C (mouse CENP-C with EGFP at the N terminus) at 100ng/μL, EGFP-RnCENP-C (rat CENP-C with EGFP at the N terminus) at 100ng/μL, and EGFP-RpCENP-C (R. pumilio CENP-C with EGFP at the N terminus) at 100ng/μL. Mouse, rat and R. pumilio CENP-C sequences were cloned from cDNA libraries from liver. Mouse and rat CENP-C sequences were verified by mm10 Mus musculus and rn6 Rattus norvegicus reference genomes. R. pumilio CENP-C sequence was verified by the genome sequence (personal communication with Ricardo Mallarino). cRNAs were synthesized using the T7 mScriptTM Standard mRNA Production System (CELL SCRIPT) or mMESSAGE mMACHINE SP6 Transcription Kit (Thermo Fisher scientific). gRNAs were synthesized using GeneArt Precision gRNA Synthesis Kit (Thermo Fisher scientific A29377).
Live Imaging and Chromosome Position Assay
For the chromosome position assay, oocytes were collected and microinjected with the constructs indicated in the figure legends. After inducing meiotic resumption by washing out milrinone, oocytes were placed into 2μL drops of CZB media covered with mineral oil in a glass-bottom tissue culture dish (FluoroDish FD35–100) in a heated environmental chamber with a stage top incubator (Incubator BL and Heating Insert P; PeCon GmBH) to maintain 37C°. Confocal images were collected with a microscope (DMI4000 B; Leica) equipped with a 63× 1.3 NA glycerol-immersion objective lens, an xy piezo Z stage (Applied Scientific Instrumentation), a spinning disk confocal scanner (Yokogawa Corporation of America), and an electron multiplier charge-coupled device camera (ImageEM C9100–13; Hamamatsu Photonics), controlled by MetaMorph software (Molecular Devices). Excitation was with an LMM5 laser merge module with 488- and 593-nm lasers (Spectral Applied Research) or a Vortran Stradus VersaLase 4 laser module with 405 nm, 488 nm, 561 nm, and 639 nm lasers (Vortran Laser Technology). Confocal images were collected as z stacks at 0.5 μm intervals to visualize the entire meiotic spindle. The position of the spindle near the cortex was confirmed by differential interference contrast images. The spindle equator was determined as a middle of the spindle. The chromosome position of each bivalent was determined as a crossover site and normalized by the distance between spindle equator and spindle poles.
Oocyte Immunocytochemistry
After inducing meiotic resumption by washing out milrinone (4.5 hours for prometaphase staining and 7.5 hours for metaphase staining), MI oocytes were fixed in freshly prepared 2% paraformaldehyde in PBS with 0.1% Triton X-100, pH 7.4, for 20 min at RT, permeabilized in PBS with 0.1% Triton X-100 for 15 min at RT, placed in blocking solution (PBS containing 0.3% BSA and 0.01% Tween-20) 15 min RT or overnight at 4C, incubated 1–2 h with primary antibodies in blocking solution, washed 3 times for 15 min each, incubated 1 h with secondary antibodies, washed 3 times for 15 min each, and mounted in Vectashield with DAPI (Vector, H-1200) to visualize chromosomes. Primary antibodies used for this study were rabbit anti-human H3K9me3 (1:500; Abcam, ab8898), mouse anti-mouse SGO2 (1:500, a gift from Yoshinori Watanabe), and rabbit anti-mouse CENP-C (1:2500, a gift from Yoshinori Watanabe). Secondary antibodies were Alexa Fluor 488–conjugated donkey anti-rabbit or donkey anti-mouse, Alexa Fluor 594–conjugated donkey anti-rabbit or donkey anti-mouse, or Alexa Fluor 647–conjugated donkey anti-rabbit or donkey anti-mouse (1:500, Invitrogen). Confocal images were collected as z stacks at 0.5 μm intervals to visualize the entire meiotic spindle, using the spinning disc confocal microscope described above. To quantify centromere signal ratios, optical slices containing centromeres from the same bivalent were added to produce a sum projection using Fiji/ImageJ. Ellipses were drawn around the centromeres, and signal intensity was integrated over each ellipse after subtracting cytoplasmic background. Ratios were obtained for each bivalent by dividing the intensity of the larger centromere by that of the smaller centromere, as determined by dCas9 signal intensity.
Whole Genome Sequencing of Six Murinae Species
Frozen tissue samples from male individuals were obtained from the Museum of Vertebrate Zoology, Berkeley, CA (MZV) and the Field Museum of Natural History, Chicago, IL (FMNH). Hylomyscus alleni (MVZ Mamm 196246) was captured in Cameroon in 2000, Praomys delectorum (MVZ Mamm 221157) was captured in Malawi in 2007, Mastomys natalensis (MVZ Mamm 221054) was captured in Malawi in 2007, Grammomys dolichurus (MVZ Mamm 221001) was captured in Malawi in 2007, Rhabdomys dilectus (FMNH 192475) was captured in Malawi in 2006, and Rhynchomys soricoides (FMNH 198792) was captured in The Philippines in 2008. All genomes were sequenced in the Center for Applied Genomics at Children’s Hospital of Philadelphia. High molecular weight DNA was extracted following the protocol provided by 10xGenomics (CG000072 Rev B Sample Preparation Demonstrated Protocol, DNA Extraction from Fresh Frozen Tissue). Extracted DNA was quality controlled (CG00019 Rev B Sample Preparation Demonstrated Protocol, High Molecular Weight DNA QC), and all of the samples had a mean length greater than 50kb, and high enough concentration to dilute to 1ng/μL for library preparation. Chromium Genome Reagent Kits v2 from 10xGenomics was used to prepare libraries of 2×150 base reads, with read 1 constituting 10xBarcode (16bp) + nmer (6bp) + genome sequence (128bp) and read 2 constituting genome sequence (150bp). i7 index used 8bp sample index, and i5 index was not used. Sequencing depth was calculated based on putative genome size 3Gb and coverage 56x, following 10xGenomics R&D recommendation, and the libraries were sequenced with Illumina HiSeq. Demultiplexed FASTQ files were analyzed using the LongRanger wgs -basic pipeline. This pipeline gave general QC statistics related to the 10x barcoding and number of read pairs present in the FASTQ files. All sample FASTQs contained more than 688M read pairs and have acceptable barcode diversity/% on whitelist. LongRanger was used to assemble genomes, using the Mus musculus (mm10) as reference. In parallel, Supernova was used to assemble de novo genomes. See Supplementary Table 1 for assembly statistics. In order to obtain protein coding sequences, mm10 annotation was used to annotate reference-guided assemblies, and translated BLAST (tblastn) was used to pull homologous sequences from de novo assemblies using Mus musculus protein sequences as query sequences.
Phylogenetic Tree Construction
The species tree shown in Figure 4B was obtained from maximum likelihood (RAxML) and Bayesian inference (MrBayes). The phylogeny within Mus was previously studied (Keane et al., 2011; Thybert et al., 2018). In order to resolve phylogeny in Murinae, the same set of genes that were used to construct a primate phylogenetic tree (Perelman et al., 2011) was aligned by MAFFT (Katoh and Standley, 2013; Katoh et al., 2002). The initial alignment was imported in Geneious Prime, and manually inspected for sequence alignment ambiguity. Ambiguous regions were removed from subsequent analyses. Maximum likelihood tree was constructed with RAxML (Stamatakis, 2014), and Bayesian inference tree was constructed with MrBayes (Huelsenbeck and Ronquist, 2001), with Peromyscus maniculatus as outgroup. Both inferences supported the tree topology shown in Figure 4B.
Molecular Evolution Analyses
In order to create a histogram in Figure 4C, alignments of mouse-rat orthologs were filtered for dS below 0.5, as higher dS values indicate misalignment. A list of genes for each subcellular compartment was obtained from Human Protein Atlas. Mouse-human orthologs were used to calculate average dN/dS for each subcellular compartment in Figure 4D. The analysis to identify signatures of positive selection (PAML) is highly sensitive to alignment errors, so automated genome-wide analysis is prone to false positives (van der Lee et al., 2017). To prevent these errors, alignments for selected genes were manually inspected. Coding sequences for each gene were aligned by Geneious Alignment (translation align) implemented in Geneious Prime, and manually inspected for sequence alignment ambiguity. Insertions or deletions as well as their flanking codons were removed from analyses. To test signatures of positive selection, we compared the likelihood of models of neutral codon evolution to models of codon evolution allowing positive selection, implemented in PAML version 4 (Yang, 2007). The neutral model M1 (fixed dN/dS values between 0 to 1) and M2 (M1 parameters plus dN/dS > 1) were compared in the first test, and the neutral model M7 (dN/dS values fit a beta distribution from 0 to 1) and M8 (M7 parameters plus dN/dS > 1) were compared in the second test, assuming the F3×4 model of codon frequencies. Degree of freedom for each test was 2, and the log likelihood test was significant above 5.99 (p < 0.05). We first used the species tree, and signatures of positive selection were confirmed using a gene tree for each gene, created by RAxML.
QUANTIFICATION AND STATISTICAL ANALYSIS
Data points are pooled from at least two independent experiments. The following statistical methods were used: unpaired t test in Figures 2B, 2C, 2D, 2E, 2G, 2I, 3A, 3C, 3D, S1D, S1G, S1H, S3E, and S3F; Mann-Whitney U test in Figure 4D; ordinary one-way ANOVA in Figure S1D; chi square test for goodness of fit for deviations from 1 in Figure 1D and for statistical models (likelihood-ratio test) in Figure 4E and Supplementary Table 2; Naïve Emprical Bayes (NEB) analysis and Bayes Empirical Bayes (BEB) analysis in Figures 4B and 4E; F test to compare variance in Figure S5C. The exact value of n, what n represents, and definition of center can be found in the figure legends for each experiment. Unpaired t test, Mann-Whitney U test, ordinary one-way ANOVA, and F test were performed using GraphPad Prism; chi square tests were performed using Excel; NEB and BEB analyses were performed using PAML model 2 and 8. P value of less than 0.05 was judged as statistically significant.
Supplementary Material
Supplementary Figure 1: Incorporation of Ectopically Expressed CENP-C, Related to Figure 2
(A) Schematic of CENP-C expression experiments. GFP-tagged ectopic CENP-C was expressed by cRNA microinjection into mouse oocytes, in the presence of endogenous mouse CENP-C. Different mouse strains were used (see panel B).
(B) Detailed crossing scheme to produce CHPO hybrid mice (related to Figure 1C). Crossing Mus musculus domesticus strains with larger (CF-1) and smaller (CHPO) centromeres generates a hybrid. The minor satellite monomer is the same in the two strains, but the abundance differs. Due to the metacentric Robertsonian fusion chromosomes in CHPO, hybrid oocytes have 7 trivalents, which are not analyzed in our experiments (see also Supplementary Figure 3D). CHPO hybrid oocytes were used to analyze genetically different bivalents in Figures 2G and 2I. CF-1 oocytes were used to analyze genetically identical bivalents in Figures 2B–2E and 2I.
(C) CENP-C exchange at centromeres. CF-1 oocytes were microinjected with cRNA for GFP-tagged mouse or rat CENP-C, and several centromeres (yellow rectangles) were photobleached in meiosis I. Representative centromeres are marked with arrowheads and shown in insets (yellow: bleached, white: unbleached). 10μm scale bar, 4.4μm square insets. Fluorescence recovery after photobleaching (FRAP) was monitored every three minutes. Each data point represents GFP intensity as a fraction of intensity before bleaching, averaged over multiple centromeres (n=10 centromeres from 5 oocytes for each condition). Partially bleached centromeres were not analyzed. Rapid recovery within 15 min is consistent with previous observations for CENP-C in mitosis (Hemmerich et al., 2008). Given that oocytes are cultured overnight after microinjection of CENP-C cRNA, ectopic CENP-C likely replaces most of endogenous CENP-C.
(D) CENP-C position at centromeres relative to CENP-A and HEC1. Protein-protein distances were measured as previously described (Wan et al., 2009). Briefly, line scans of each centromere were taken parallel to the chromosomal axis at a width of ten pixels (yellow lines in insets). Each dot represents signal intensity of one pixel. The data were fit with Gaussian normal distributions to estimate intensity peaks with subpixel resolution, and the distance between the two peaks was calculated. Chromatic aberration was corrected by staining endogenous CENP-C with two secondary antibodies labeled with different colors (AF488 and AF647), and the distance in this condition shows the error range in our analysis. Bar graph shows mean distances and standard error of the mean (n≥90 centromeres for each construct). CF-1 oocytes were microinjected with cRNA for GFP-tagged mouse or rat CENP-C and fixed in meiosis I. Cells were stained for CENP-C, CENP-A, or HEC1 with AF647-labeled secondary antibody. Images of oocytes expressing mouse CENP-C are shown as examples; 10μm scale bar, 3.5μm square inset. Distances between CENP-C antibody staining and GFP-CENP-C are close to our error range. Distances from CENP-C to CENP-A and CENP-C to HEC1 were consistent with a previous report (11±11nm and 79±10nm, respectively, Suzuki et al., 2014), within our error. We find no significant differences in distance measurements for mouse and rat CENP-C, suggesting that both are incorporated into centromeres similarly.
(E and F) Expression levels are similar between mouse and rat and between mouse and R.pumilio CENP-C. CF-1 oocytes were microinjected with cRNA for the indicated GFP-tagged CENP-C alleles and analyzed for cytoplasmic GFP fluorescence to measure expression levels. Each dot represents one oocyte (n=20 for mouse and rat CENP-C, n≥41 for mouse and R.pumilio CENP-C).
(G) H3K9me3 levels are not affected by kinetochore pathway disruption. CF-1 oocytes were microinjected with cRNA for GFP-tagged mouse or rat CENP-C, fixed in meiosis I, and stained for H3K9me3. Each dot in the plot represents a single centromere (n≥240 centromeres for each construct); red line, mean; ns: not significant. 10μm scale bar.
(H) CHPO hybrid oocytes were microinjected with cRNAs for GFP-tagged R.pumilio CENP-C and mCherry-tagged H2B. Cells were imaged live to preserve chromosome positions, measured at late metaphase I. In the plot, each dot represents a single bivalent (n=85 bivalents for R.pumilio CENP-C, mouse CENP-C data is from Figure 2I); red line, mean; ns: not significant.
Supplementary Figure 2: Analyses of Chromosome Oscillations and Meiotic Progression, Related to Figure 2H, 2I and 3D
(A and B) Positions of genetically different bivalents (from CHPO hybrid oocytes) and genetically identical bivalents (from CF-1 oocytes) were measured every 5 min by live imaging of SiR-DNA. Each line in the graph (A) represents movement of a single bivalent, with thicker lines shown as examples in kymographs. In both cases, bivalents stay in a relatively fixed position, as represented by the small average displacement (B, each data point represents displacement of a bivalent between two consecutive time points). Average displacement is similar for genetically identical and genetically different bivalents, suggesting that the differences in chromosome positions are not due to differences in oscillations.
(C and D) Oocytes were collected, matured in vitro, and imaged live at different time points to analyze meiotic progression. CF-1 oocytes were microinjected with cRNA for GFP-tagged mouse or rat CENP-C, and DNA was visualized with SiR-DNA (C). DNA was visualized with SiR-DNA in Cenpb+/− or Cenpb−/− oocytes (D). Examples of “not aligned”, “aligned”, and “segregated” are shown (10μm scale bar). The numbers of oocytes at each stage were counted at each time point. We find no obvious differences in meiotic progression between oocytes expressing mouse or rat CENP-C, or between Cenpb+/− and Cenpb−/− oocytes. Furthermore, genetically identical bivalents are positioned similarly in all cases (Figures 2I and 3D), suggesting that differences in chromosome positions for genetically different bivalents are due to functional differences in centromeres rather than differences in meiotic progression.
Supplementary Figure 3: CRISPR Genome Editing Creates CENP-B Null Mice, Related to Figure 3
(A) Summary of CRISPR genome editing, using a gRNA designed to target the DNA binding domain of CENP-B.
(B) Cenpb genotyping. As the Cenpb mutation is a 37bp deletion, a PCR reaction amplifying the flanking regions can distinguish three Cenpb genotypes.
(C) Absence of CENP-B protein in Cenpb−/− mice. Protein extract from ovary was used to detect CENP-B using two different antibodies. Bands that disappear in Cenpb−/− likely correspond to CENP-B with and without post-translational modifications such as SUMOylation (Morozov et al., 2017). Faint bands that also appear in Cenpb−/− are non-specific.
(D) Detailed crossing scheme to produce second-generation hybrid Cenpb−/− mice with larger and smaller paired centromeres (related to Figure 3B). The first cross produces first-generation hybrid Cenpb+/− animals with smaller centromeres inherited from CHPO. Because CHPO has six telocentric chromosomes and seven metacentrics formed by Robertsonian chromosome fusions, the first-generation hybrids contain six bivalents in meiosis and seven trivalents, in which a Robertsonian fusion from CHPO pairs with two homologous telocentric chromosomes (Chmátal et al., 2014). Trivalents are associated with meiotic errors (Bint et al., 2011; Daniel, 2002; Pacchierotti et al., 1995), and the first-generation hybrids exhibit low fertility, but some progeny can be obtained in a second cross to Cenpb−/−. These second-generation hybrids inherit some smaller centromeres from the first-generation hybrid parent, and 25% are Cenpb−/− females that can be used to collect oocytes for our analyses. Oocytes from the second-generation hybrids do not arrest at metaphase I, likely because they have fewer trivalents that activate the spindle assembly checkpoint (Chmátal et al., 2015). Therefore, we are unable to measure biased orientation of larger centromeres towards the egg side of the spindle, as previously reported in first-generation hybrids (Iwata-Otsubo et al., 2017), because this bias depends on delayed progression through meiosis I (Akera et al., 2019). Due to the limited number of second-generation hybrids and low fertility of these animals, we were also unable to measure transmission bias.
(E) CENP-C reduction in the second-generation hybrid (related to Figure 3C). Oocytes from the second-generation hybrid were microinjected with cRNA for GFP-tagged dCas9 and gRNA targeting minor satellite centromere DNA, fixed at metaphase I, and stained for CENP-C. Each dot represents a single centromere (n=34 centromeres for each construct); red line, mean; *p<0.01.
(F) Cenpb+/− or Cenpb−/− oocytes were fixed in meiosis I and stained for CENP-A; 10μm scale bar. Plot shows centromere signal intensities, normalized by mean intensity of Cenpb+/− control. Each dot represents a single centromere (n≥210 centromeres); red line, mean; *p<0.05. As CENP-B deletion reduces both CENP-A chromatin and heterochromatin, many other proteins are likely affected as well.
Supplementary Figure 4: Map of Rapidly Evolving Proteins at Centromeres, Related to Figure 4E
Proteins are grouped by functional modules corresponding to Figure 4A: CENP-A chromatin, heterochromatin, kinetochore, and inner centromere proteins (effector proteins). CENP-B has dual functions in CENP-A chromatin and heterochromatin (Figure 6B). Within each module, proteins are further grouped by functions: CENP-A chaperone maintains CENP-A chromatin, CCAN connects CENP-A chromatin to the kinetochore, KMN network binds spindle microtubules, spindle assembly checkpoint proteins delays anaphase in response to unattached kinetochores, and meiotic co-orientation creates the meiosis I kinetochore geometry. Proteins are color-coded by dN/dS values (see Supplementary Table 2). Pink highlighted genes have signatures of positive selection in PAML (see Figure 4E).
Supplementary Figure 5: Changes in CENP-A and CENP-B are not Analyzed by Standard Methods to Detect Adaptive Evolution, Related to Figure 4E
(A) Changes in CENP-A N-terminal tails. CENP-A amino acid sequences of four mammalian species are aligned. Known domains of CENP-A are shown in blue boxes, deviation from the consensus sequence of all four species is shown in black, and deletions are shown as thin horizontal lines. Signatures of positive selection were previously found in primate CENP-A (Schueler et al., 2010), shown in red boxes in the human sequence. We used bovine genomes (Chen et al., 2019) to detect signatures of positive selection in CENP-A, and the result is shown in the goat sequence. Such signatures are mostly found in the N-terminal tail. The N-terminal tail of Murinae CENP-A is either short (as in mouse) or long with two tandem duplicates (as in rat) (green boxes). Thus, alignment of the Murinae CENP-A N-terminal tail is difficult and removed from our PAML analysis.
(B) CENP-B negatively charged domain. Mouse, human, and goat are shown as examples of genomes with CENP-B and paralogous pogo-like transposases. The ratio of negatively charged to positively charged amino acids is plotted. As pogo-like transposases have fewer negatively charged amino acids than CENP-B, the negatively charged domain is likely unique to CENP-B.
(C) Changes in the CENP-B negatively charged domain. Although most of CENP-B is highly conserved, the number of negatively charged amino acids is variable in mammals. For comparison, the number of positively charged amino acids does not change in this domain. The number of species for each number of positively charged or negatively charged amino acids in this domain is plotted. CENP-B sequences of 41 bovine, primate and rodent species were obtained from the Ensembl genome browser.
Highlights.
Parallel pathways recruit drive effector proteins in a hybrid mouse model.
Disrupting the kinetochore pathway makes centromeres functionally more similar.
Disrupting the heterochromatin pathway makes centromeres functionally more different.
Molecular evolution analyses show recurrent changes in both pathways.
Acknowledgements
We thank B.E. Black for comments on the manuscript, Y. Watanabe for the CENP-C and SGO2 antibodies, R. Mallarino for Rhabdomys pumilio animals, J.B. Searle, C. Conroy (Museum of Vertebrate Zoology), and A. Ferguson (Field Museum of Natural History) for collecting Murinae tissue samples, K.G. Boese for assistance with the image analyses, and G. Thomas and J. Good for assistance with the genomic analyses. The research was supported by the NIH (R35GM122475 to M.A.L.; R35GM124684 to M.T.L.; RM1HG010023 to J.K.) and a predoctoral fellowship from the Funai Foundation for Information Technology (T.K.).
Footnotes
Publisher's Disclaimer: This is a PDF file of an unedited manuscript that has been accepted for publication. As a service to our customers we are providing this early version of the manuscript. The manuscript will undergo copyediting, typesetting, and review of the resulting proof before it is published in its final form. Please note that during the production process errors may be discovered which could affect the content, and all legal disclaimers that apply to the journal pertain.
Declaration of Interests
The authors declare no competing interests.
References
- Abe Y, Sako K, Takagaki K, Hirayama Y, Uchida KSK, Herman JA, DeLuca JG, and Hirota T (2016). HP1-assisted Aurora B kinase activity prevents chromosome segregation errors. Developmental Cell 36, 487–497. [DOI] [PMC free article] [PubMed] [Google Scholar]
- Ainsztein AM, Kandels-Lewis SE, Mackay AM, and Earnshaw WC (1998). INCENP centromere and spindle targeting: identification of essential conserved motifs and involvement of heterochromatin protein HP1. Journal of Cell Biology 143, 1763–1774. [DOI] [PMC free article] [PubMed] [Google Scholar]
- Akera T, Chmátal L, Trimm E, Yang K, Aonbangkhen C, Chenoweth DM, Janke C, Schultz RM, and Lampson MA (2017). Spindle asymmetry drives non-Mendelian chromosome segregation. Science 358, 668–672. [DOI] [PMC free article] [PubMed] [Google Scholar]
- Akera T, Trimm E, and Lampson MA (2019). Molecular strategies of meiotic cheating by selfish centromeres. Cell 178, 1132–1144. [DOI] [PMC free article] [PubMed] [Google Scholar]
- Allshire RC, and Madhani HD (2017). Ten principles of heterochromatin formation and function. Nature Reviews Molecular Cell Biology 19, 229–244. [DOI] [PMC free article] [PubMed] [Google Scholar]
- Allu PK, Dawicki-McKenna JM, Eeuwen TV, Slavin M, Braitbard M, Xu C, Kalisman N, Murakami K, and Black BE (2019). Structure of the human core centromeric nucleosome complex. Current Biology 29, 2625–2639. [DOI] [PMC free article] [PubMed] [Google Scholar]
- Amor DJ, Bentley K, Ryan J, Perry J, Wong L, Slater H, and Choo KHA (2004). Human centromere repositioning “in progress.” Proceedings of the National Academy of Sciences 101, 6542–6547. [DOI] [PMC free article] [PubMed] [Google Scholar]
- Bint SM, Ogilvie CM, Flinter FA, Khalaf Y, and Scriven PN (2011). Meiotic segregation of Robertsonian translocations ascertained in cleavage-stage embryos—implications for preimplantation genetic diagnosis. Human Reproduction 26, 1575–1584. [DOI] [PubMed] [Google Scholar]
- Casola C, Hucks D, and Feschotte C (2007). Convergent domestication of pogo-like transposases into centromere-binding proteins in fission yeast and mammals. Molecular Biology and Evolution 25, 29–41. [DOI] [PMC free article] [PubMed] [Google Scholar]
- Cazaux B, Catalan J, Justy F, Escudé C, Desmarais E, and Britton-Davidian J (2013). Evolution of the structure and composition of house mouse satellite DNA sequences in the subgenus Mus (Rodentia: Muridea): a cytogenomic approach. Chromosoma 122, 209–220. [DOI] [PubMed] [Google Scholar]
- Cheerambathur DK, Prevo B, Chow T-L, Hattersley N, Wang S, Zhao Z, Kim T, Gerson-Gurwitz A, Oegema K, Green R, et al. (2019). The kinetochore-microtubule coupling machinery is repurposed in sensory nervous system morphogenesis. Developmental Cell 48, 864–872. [DOI] [PMC free article] [PubMed] [Google Scholar]
- Chen L, Qiu Q, Jiang Y, Wang K, Lin Z, Li Z, Bibi F, Yang Y, Wang J, Nie W, et al. (2019). Large-scale ruminant genome sequencing provides insights into their evolution and distinct traits. Science 364, eaav6202. [DOI] [PubMed] [Google Scholar]
- Chmátal L, Gabriel SI, Mitsainas GP, Martínez-Vargas J, Ventura J, Searle JB, Schultz RM, and Lampson MA (2014). Centromere strength provides the cell biological basis for meiotic drive and karyotype evolution in mice. Current Biology 24, 2295–2300. [DOI] [PMC free article] [PubMed] [Google Scholar]
- Chmátal L, Yang K, Schultz RM, and Lampson MA (2015). Spatial regulation of kinetochore microtubule attachments by destabilization at spindle poles in meiosis I. Current Biology 25, 1835–1841. [DOI] [PMC free article] [PubMed] [Google Scholar]
- Cortes-Silva N, Ulmer J, Kiuchi T, Hsieh E, Cornilleau G, Ladid I, Dingli F, Loew D, Katsuma S, and Drinnenberg IA (2020). CenH3-independent kinetochore assembly in Lepidoptera requires CCAN, including CENP-T. Current Biology 30, 561–572. [DOI] [PubMed] [Google Scholar]
- Dambacher S, Deng W, Hahn M, Sadic D, Fröhlich J, Nuber A, Hoischen C, Diekmann S, Leonhardt H, and Schotta G (2012). CENP-C facilitates the recruitment of M18BP1 to centromeric chromatin. Nucleus 3, 101–110. [DOI] [PMC free article] [PubMed] [Google Scholar]
- Daniel A (2002). Distortion of female meiotic segregation and reduced male fertility in human Robertsonian translocations: Consistent with the centromere model of co-evolving centromere DNA/centromeric histone (CENP-A). American Journal of Medical Genetics 111, 450–452. [DOI] [PubMed] [Google Scholar]
- Diaz-Rodriguez E, Sotillo R, Schvartzman J-M, and Benezra R (2008). Hec1 overexpression hyperactivates the mitotic checkpoint and induces tumor formation in vivo. Proceedings of the National Academy of Sciences 105, 16719–16724. [DOI] [PMC free article] [PubMed] [Google Scholar]
- Dunleavy EM, Roche D, Tagami H, Lacoste N, Ray-Gallet D, Nakamura Y, Daigo Y, Nakatani Y, and Almouzni-Pettinotti G (2009). HJURP is a cell-cycle-dependent maintenance and deposition factor of CENP-A at centromeres. Cell 137, 485–497. [DOI] [PubMed] [Google Scholar]
- Echave J, Spielman SJ, and Wilke CO (2016). Causes of evolutionary rate variation among protein sites. Nature Reviews Genetics 17, 109–121. [DOI] [PMC free article] [PubMed] [Google Scholar]
- Fachinetti D, Folco HD, Nechemia-Arbely Y, Valente LP, Nguyen K, Wong AJ, Zhu Q, Holland AJ, Desai A, Jansen LET, et al. (2013). A two-step mechanism for epigenetic specification of centromere identity and function. Nature Cell Biology 15, 1056–1066. [DOI] [PMC free article] [PubMed] [Google Scholar]
- Fachinetti D, Han JS, McMahon MA, Ly P, Abdullah A, Wong AJ, and Cleveland DW (2015). DNA sequence-specific binding of CENP-B enhances the fidelity of human centromere function. Developmental Cell 33, 314–327. [DOI] [PMC free article] [PubMed] [Google Scholar]
- Finseth FR, Dong Y, Saunders A, and Fishman L (2015). Duplication and adaptive evolution of a key centromeric protein in Mimulus, a genus with female meiotic drive. Molecular Biology and Evolution 32, 2694–2706. [DOI] [PubMed] [Google Scholar]
- Finseth FR, Nelson TC, and Fishman L (2021). Selfish chromosomal drive shapes recent centromeric histone evolution in monkeyflowers. PLOS Genetics 17, e1009418. [DOI] [PMC free article] [PubMed] [Google Scholar]
- Fishman L, and Saunders A (2008). Centromere-associated female meiotic drive entails male fitness costs in monkeyflowers. Science 322, 1559–1562. [DOI] [PubMed] [Google Scholar]
- Foltz DR, Jansen LET, Bailey AO, Yates JR, Bassett EA, Wood S, Black BE, and Cleveland DW (2009). Centromere-specific assembly of CENP-A nucleosomes is mediated by HJURP. Cell 137, 472–484. [DOI] [PMC free article] [PubMed] [Google Scholar]
- Fujita Y, Hayashi T, Kiyomitsu T, Toyoda Y, Kokubu A, Obuse C, and Yanagida M (2007). Priming of centromere for CENP-A recruitment by human hMis18α, hMis18β, and M18BP1. Developmemtal Cell 12, 17–30. [DOI] [PubMed] [Google Scholar]
- Gamba R, and Fachinetti D (2020). From evolution to function: Two sides of the same CENP-B coin? Experimental Cell Research 390, 111959. [DOI] [PubMed] [Google Scholar]
- Gao B, Wang Y, Diaby M, Zong W, Shen D, Wang S, Chen C, Wang X, and Song C (2020). Evolution of pogo, a separate superfamily of IS630-Tc1-mariner transposons, revealing recurrent domestication events in vertebrates. Mobile DNA 11, 25. [DOI] [PMC free article] [PubMed] [Google Scholar]
- Gibbs RA, Weinstock GM, Metzker ML, Muzny DM, Sodergren EJ, Scherer S, Scott G, Steffen D, Worley KC, Burch PE, et al. (2004). Genome sequence of the Brown Norway rat yields insights into mammalian evolution. Nature 428, 493–521. [DOI] [PubMed] [Google Scholar]
- Godek KM, Kabeche L, and Compton DA (2014). Regulation of kinetochore-microtubule attachments through homeostatic control during mitosis. Nature Reviews Molecular Cell Biology 16, 57–64. [DOI] [PMC free article] [PubMed] [Google Scholar]
- Hamilton GE, Helgeson LA, Noland CL, Asbury CL, Dimitrova YN, and Davis TN (2020). Reconstitution reveals two paths of force transmission through the kinetochore. eLife 9, e56582. [DOI] [PMC free article] [PubMed] [Google Scholar]
- Hemmerich P, Weidtkamp-Peters S, Hoischen C, Schmiedeberg L, Erliandri I, and Diekmann S (2008). Dynamics of inner kinetochore assembly and maintenance in living cells. Journal of Cell Biology 180, 1101–1114. [DOI] [PMC free article] [PubMed] [Google Scholar]
- Henikoff S, Ahmad K, and Malik HS (2001). The centromere paradox: stable inheritance with rapidly evolving DNA. Science 293, 1098–1102. [DOI] [PubMed] [Google Scholar]
- Higgins JMG, and Prendergast L (2016). Mitotic mysteries: the case of HP1. Developmental Cell 36, 477–478. [DOI] [PubMed] [Google Scholar]
- Hooff J.J. van, Snel B, and Kops GJ (2017). Unique phylogenetic distributions of the Ska and Dam1 complexes support functional analogy and suggest multiple parallel displacements of Ska by Dam1. Genome Biology and Evolution 9, 1295–1303. [DOI] [PMC free article] [PubMed] [Google Scholar]
- Hudson DF, Fowler KJ, Earle E, Saffery R, Kalitsis P, Trowell H, Hill J, Wreford NG, Kretser D.M. de, Cancilla MR, et al. (1998). Centromere protein B null mice are mitotically and meiotically normal but have lower body and testis weights. Journal of Cell Biology 141, 309–319. [DOI] [PMC free article] [PubMed] [Google Scholar]
- Huelsenbeck JP, and Ronquist F (2001). MRBAYES: Bayesian inference of phylogenetic trees. Bioinformatics 17, 754–755. [DOI] [PubMed] [Google Scholar]
- Iwata-Otsubo A, Dawicki-McKenna JM, Akera T, Falk SJ, Chmátal L, Yang K, Sullivan BA, Schultz RM, Lampson MA, and Black BE (2017). Expanded satellite repeats amplify a discrete CENP-A nucleosome assembly site on chromosomes that drive in female meiosis. Current Biology 27, 2365–2373. [DOI] [PMC free article] [PubMed] [Google Scholar]
- Jangam D, Feschotte C, and Betrán E (2017). Transposable element domestication as an adaptation to evolutionary conflicts. Trends in Genetics 33, 817–831. [DOI] [PMC free article] [PubMed] [Google Scholar]
- Javed AO, Li Y, Muffat J, Su K-C, Cohen MA, Lungjangwa T, Aubourg P, Cheeseman IM, and Jaenisch R (2018). Microcephaly modeling of kinetochore mutation reveals a brain-specific phenotype. Cell Reports 25, 368–382. [DOI] [PMC free article] [PubMed] [Google Scholar]
- Kang J, Chaudhary J, Dong H, Kim S, Brautigam CA, and Yu H (2011). Mitotic centromeric targeting of HP1 and its binding to Sgo1 are dispensable for sister-chromatid cohesion in human cells. Molecular Biology of the Cell 22, 1181–1190. [DOI] [PMC free article] [PubMed] [Google Scholar]
- Kapoor M, Luna R.M. de O., Liu G, Lozano G, Cummings C, Mancini M, Ouspenski I, Brinkley BR, and May GS (1998). The cenpB gene is not essential in mice. Chromosoma 107, 570–576. [DOI] [PubMed] [Google Scholar]
- Kato H, Jiang J, Zhou B-R, Rozendaal M, Feng H, Ghirlando R, Xiao TS, Straight AF, and Bai Y (2013). A conserved mechanism for centromeric nucleosome recognition by centromere protein CENP-C. Science 340, 1110–1113. [DOI] [PMC free article] [PubMed] [Google Scholar]
- Katoh K, and Standley DM (2013). MAFFT multiple sequence alignment software version 7: improvements in performance and usability. Molecular Biology and Evolution 30, 772–780. [DOI] [PMC free article] [PubMed] [Google Scholar]
- Katoh K, Misawa K, Kuma K, and Miyata T (2002). MAFFT: a novel method for rapid multiple sequence alignment based on fast Fourier transform. Nucleic Acids Research 30, 3059–3066. [DOI] [PMC free article] [PubMed] [Google Scholar]
- Kawashima SA, Yamagishi Y, Honda T, Ishiguro K, and Watanabe Y (2009). Phosphorylation of H2A by Bub1 prevents chromosomal instability through localizing Shugoshin. Science 327, 172–177. [DOI] [PubMed] [Google Scholar]
- Keane TM, Goodstadt L, Danecek P, White MA, Wong K, Yalcin B, Heger A, Agam A, Slater G, Goodson M, et al. (2011). Mouse genomic variation and its effect on phenotypes and gene regulation. Nature 477, 289–294. [DOI] [PMC free article] [PubMed] [Google Scholar]
- Kelly AE, Ghenoiu C, Xue JZ, Zierhut C, Kimura H, and Funabiki H (2010). Survivin reads phosphorylated histone H3 threonine 3 to activate the mitotic kinase Aurora B. Science 330, 235–239. [DOI] [PMC free article] [PubMed] [Google Scholar]
- Kim J, Ishiguro K, Nambu A, Akiyoshi B, Yokobayashi S, Kagami A, Ishiguro T, Pendas AM, Takeda N, Sakakibara Y, et al. (2015). Meikin is a conserved regulator of meiosis-I-specific kinetochore function. Nature 517, 466–471. [DOI] [PubMed] [Google Scholar]
- Kipling D, and Warburton PE (1997). Centromeres, CENP-B and Tigger too. Trends in Genetics 13, 141–145. [DOI] [PubMed] [Google Scholar]
- Klare K, Weir JR, Basilico F, Zimniak T, Massimiliano L, Ludwigs N, Herzog F, and Musacchio A (2015). CENP-C is a blueprint for constitutive centromere-associated network assembly within human kinetochores. Journal of Cell Biology 210, 11–22. [DOI] [PMC free article] [PubMed] [Google Scholar]
- Krenn V, Overlack K, Primorac I, Gerwen S. van, and Musacchio A (2013). KI motifs of human Knl1 enhance assembly of comprehensive spindle checkpoint complexes around MELT repeats. Current Biology 24, 29–39. [DOI] [PubMed] [Google Scholar]
- Lampson MA, and Black BE (2017). Cellular and molecular mechanisms of centromere drive. Cold Spring Harbor Symposia on Quantitative Biology 82, 249–257. [DOI] [PMC free article] [PubMed] [Google Scholar]
- Langley SA, Miga KH, Karpen GH, and Langley CH (2019). Haplotypes spanning centromeric regions reveal persistence of large blocks of archaic DNA. eLife 8, e42989. [DOI] [PMC free article] [PubMed] [Google Scholar]
- Logsdon GA, Gambogi CW, Liskovykh MA, Barrey EJ, Larionov V, Miga KH, Heun P, and Black BE (2019). Human artificial chromosomes that bypass centromeric DNA. Cell 178, 624–639. [DOI] [PMC free article] [PubMed] [Google Scholar]
- Maheshwari S, Tan EH, West A, Franklin FCH, Comai L, and Chan SWL (2015). Naturally occurring differences in CENH3 affect chromosome segregation in zygotic mitosis of hybrids. PLOS Genetics 11, e1004970. [DOI] [PMC free article] [PubMed] [Google Scholar]
- Malik HS, and Henikoff S (2001). Adaptive evolution of Cid, a centromere-specific histone in Drosophila. Genetics 157, 1293–1298. [DOI] [PMC free article] [PubMed] [Google Scholar]
- Malik HS, and Henikoff S (2009). Major evolutionary transitions in centromere complexity. Cell 138, 1067–1082. [DOI] [PubMed] [Google Scholar]
- Mallarino R, Pillay N, Hoekstra HE, and Schradin C (2018). African striped mice. Current Biology 28, R299–R301. [DOI] [PubMed] [Google Scholar]
- Marston AL (2015). Shugoshins: tension-sensitive pericentromeric adaptors safeguarding chromosome segregation. Molecular and Cellular Biology 35, 634–648. [DOI] [PMC free article] [PubMed] [Google Scholar]
- Masumoto H, Masukata H, Muro Y, Nozaki N, and Okazaki T (1989). A human centromere antigen (CENP-B) interacts with a short specific sequence in alphoid DNA, a human centromeric satellite. Journal of Cell Biology 109, 1963–1973. [DOI] [PMC free article] [PubMed] [Google Scholar]
- Melters DP, Bradnam KR, Young HA, Telis N, May MR, Ruby JG, Sebra R, Peluso P, Eid J, Rank D, et al. (2013). Comparative analysis of tandem repeats from hundreds of species reveals unique insights into centromere evolution. Genome Biology 14, R10. [DOI] [PMC free article] [PubMed] [Google Scholar]
- Moree B, Meyer CB, Fuller CJ, and Straight AF (2011). CENP-C recruits M18BP1 to centromeres to promote CENP-A chromatin assembly. Journal of Cell Biology 194, 855–871. [DOI] [PMC free article] [PubMed] [Google Scholar]
- Morozov VM, Giovinazzi S, and Ishov AM (2017). CENP-B protects centromere chromatin integrity by facilitating histone deposition via the H3.3-specific chaperone Daxx. Epigenetics Chromatin 10, 63. [DOI] [PMC free article] [PubMed] [Google Scholar]
- Musacchio A, and Desai A (2017). A molecular view of kinetochore assembly and function. Biology 6, 5. [DOI] [PMC free article] [PubMed] [Google Scholar]
- Nakagawa H, Lee J-K, Hurwitz J, Allshire RC, Nakayama J, Grewal SIS, Tanaka K, and Murakami Y (2002). Fission yeast CENP-B homologs nucleate centromeric heterochromatin by promoting heterochromatin-specific histone tail modifications. Genes Development 16, 1766–1778. [DOI] [PMC free article] [PubMed] [Google Scholar]
- Nishino T, Takeuchi K, Gascoigne KE, Suzuki A, Hori T, Oyama T, Morikawa K, Cheeseman IM, and Fukagawa T (2012). CENP-T-W-S-X forms a unique centromeric chromatin structure with a histone-like fold. Cell 148, 487–501. [DOI] [PMC free article] [PubMed] [Google Scholar]
- Nozawa R-S, Nagao K, Masuda H-T, Iwasaki O, Hirota T, Nozaki N, Kimura H, and Obuse C (2010). Human POGZ modulates dissociation of HP1alpha from mitotic chromosome arms through Aurora B activation. Nature Cell Biology 12, 719–727. [DOI] [PubMed] [Google Scholar]
- Ohzeki J-I, Shono N, Otake K, Martins NMC, Kugou K, Kimura H, Nagase T, Larionov V, Earnshaw WC, and Masumoto H (2016). KAT7/HBO1/MYST2 regulates CENP-A chromatin assembly by antagonizing Suv39h1-mediated centromere inactivation. Developmental Cell 37, 413–427. [DOI] [PMC free article] [PubMed] [Google Scholar]
- Okada T, Ohzeki J, Nakano M, Yoda K, Brinkley WR, Larionov V, and Masumoto H (2007). CENP-B controls centromere formation depending on the chromatin context. Cell 131, 1287–1300. [DOI] [PubMed] [Google Scholar]
- Otake K, Ohzeki J-I, Shono N, Kugou K, Okazaki K, Nagase T, Yamakawa H, Kouprina N, Larionov V, Kimura H, et al. (2020). CENP-B creates alternative epigenetic chromatin states permissive for CENP-A or heterochromatin assembly. Journal of Cell Science 133, jcs243303. [DOI] [PMC free article] [PubMed] [Google Scholar]
- Pacchierotti F, Tiveron C, Mailhes JB, and Davisson MT (1995). Susceptibility to vinblastine-induced aneuploidy and preferential chromosome segregation during meiosis I in Robertsonian heterozygous mice. Teratogenesis Carcinogenesis Mutagenesis 15, 217–230. [DOI] [PubMed] [Google Scholar]
- Pentakota S, Zhou K, Smith C, Maffini S, Petrovic A, Morgan GP, Weir JR, Vetter IR, Musacchio A, and Luger K (2017). Decoding the centromeric nucleosome through CENP-N. eLife 6, e33442. [DOI] [PMC free article] [PubMed] [Google Scholar]
- Perelman P, Johnson WE, Roos C, Seuánez HN, Horvath JE, Moreira MAM, Kessing B, Pontius J, Roelke M, Rumpler Y, et al. (2011). A molecular phylogeny of living primates. PLOS Genetics 7, e1001342. [DOI] [PMC free article] [PubMed] [Google Scholar]
- Perez-Castro AV, Shamanski FL, Meneses JJ, Lovato TL, Vogel KG, Moyzis RK, and Pedersen R (1998). Centromeric protein B null mice are viable with no apparent abnormalities. Developmental Biology 201, 135–143. [DOI] [PubMed] [Google Scholar]
- Pesenti ME, Prumbaum D, Auckland P, Smith CM, Faesen AC, Petrovic A, Erent M, Maffini S, Pentakota S, Weir JR, et al. (2018). Reconstitution of a 26-subunit human kinetochore reveals cooperative microtubule binding by CENP-OPQUR and NDC80. Molecular Cell 71, 923–939. [DOI] [PMC free article] [PubMed] [Google Scholar]
- Petrovic A, Mosalaganti S, Keller J, Mattiuzzo M, Overlack K, Krenn V, Antoni AD, Wohlgemuth S, Cecatiello V, Pasqualato S, et al. (2014). Modular assembly of RWD domains on the Mis12 complex underlies outer kinetochore organization. Molecular Cell 53, 591–605. [DOI] [PubMed] [Google Scholar]
- Petrovic A, Keller J, Liu Y, Overlack K, John J, Dimitrova YN, Jenni S, Gerwen S. van, Stege P, Wohlgemuth S, et al. (2016). Structure of the MIS12 complex and molecular basis of its interaction with CENP-C at human kinetochores. Cell 167, 1028–1040. [DOI] [PMC free article] [PubMed] [Google Scholar]
- Rago F, Gascoigne KE, and Cheeseman IM (2015). Distinct organization and regulation of the outer kinetochore KMN network downstream of CENP-C and CENP-T. Current Biology 25, 671–677. [DOI] [PMC free article] [PubMed] [Google Scholar]
- Rizvi SMA, Prajapati HK, and Ghosh SK (2017). The 2 micron plasmid: a selfish genetic element with an optimized survival strategy within Saccharomyces cerevisiae. Current Genetics 64, 25–42. [DOI] [PubMed] [Google Scholar]
- Schindelin J, Arganda-Carreras I, Frise E, Kaynig V, Longair M, Pietzsch T, Preibisch S, Rueden C, Saalfeld S, Schmid B, et al. (2012). Fiji: an open-source platform for biological-image analysis. Nature Methods 9, 676–682. [DOI] [PMC free article] [PubMed] [Google Scholar]
- Schneider CA, Rasband WS, and Eliceiri KW (2012). NIH Image to ImageJ: 25 years of image analysis. Nature Methods 9, 671–675. [DOI] [PMC free article] [PubMed] [Google Scholar]
- Schueler MG, Swanson W, Thomas PJ, Program NCS, and Green ED (2010). Adaptive evolution of foundation kinetochore proteins in primates. Molecular Biology and Evolution 27, 1585–1597. [DOI] [PMC free article] [PubMed] [Google Scholar]
- Shi L, Hu E, Wang Z, Liu J, Li J, Li M, Chen H, Yu C, Jiang T, and Su B (2016). Regional selection of the brain size regulating gene CASC5 provides new insight into human brain evolution. Human Genetics 136, 193–204. [DOI] [PubMed] [Google Scholar]
- Shono N, Ohzeki J, Otake K, Martins NMC, Nagase T, Kimura H, Larionov V, Earnshaw WC, and Masumoto H (2015). CENP-C and CENP-I are key connecting factors for kinetochore and CENP-A assembly. Journal of Cell Science 128, 4572–4587. [DOI] [PMC free article] [PubMed] [Google Scholar]
- Sironi M, Cagliani R, Forni D, and Clerici M (2015). Evolutionary insights into host-pathogen interactions from mammalian sequence data. Nature Reviews Genetics 16, 224–236. [DOI] [PMC free article] [PubMed] [Google Scholar]
- Stamatakis A (2014). RAxML version 8: a tool for phylogenetic analysis and post-analysis of large phylogenies. Bioinformatics 30, 1312–1313. [DOI] [PMC free article] [PubMed] [Google Scholar]
- Sugimoto K, Kuriyama K, Shibata A, and Himeno M (1997). Characterization of internal DNA-binding and C-terminal dimerization domains of human centromere/kinetochore autoantigen CENP-C in vitro: role of DNA-binding and self-associating activities in kinetochore organization. Chromosome Research 5, 132–141. [DOI] [PubMed] [Google Scholar]
- Suzuki A, Badger BL, Wan X, DeLuca JG, and Salmon ED (2014). The architecture of CCAN proteins creates a structural integrity to resist spindle forces and achieve proper intrakinetochore stretch. Developmental Cell 30, 717–730. [DOI] [PMC free article] [PubMed] [Google Scholar]
- Takeiri A, Motoyama S, Matsuzaki K, Harada A, Taketo J, Katoh C, Tanaka K, and Mishima M (2013). New DNA probes to detect aneugenicity in rat bone marrow micronucleated cells by a pan-centromeric FISH analysis. Mutation Research 755, 73–80. [DOI] [PubMed] [Google Scholar]
- Talbert PB, Bryson TD, and Henikoff S (2004). Adaptive evolution of centromere proteins in plants and animals. Journal of Biology 3, 18. [DOI] [PMC free article] [PubMed] [Google Scholar]
- Thybert D, Roller M, Navarro FCP, Fiddes I, Streeter I, Feig C, Martin-Galvez D, Kolmogorov M, Janoušek V, Akanni W, et al. (2018). Repeat associated mechanisms of genome evolution and function revealed by the Mus caroli and Mus pahari genomes. Genome Research 28, 448–459. [DOI] [PMC free article] [PubMed] [Google Scholar]
- Tromer E, Snel B, and Kops GJPL (2015). Widespread recurrent patterns of rapid repeat evolution in the kinetochore scaffold KNL1. Genome Biology and Evolution 7, 2383–2393. [DOI] [PMC free article] [PubMed] [Google Scholar]
- Tsukahara T, Tanno Y, and Watanabe Y (2010). Phosphorylation of the CPC by Cdk1 promotes chromosome bi-orientation. Nature 467, 719–723. [DOI] [PubMed] [Google Scholar]
- van der Lee R, Wiel L, van Dam TJP, and Huynen MA (2017). Genome-scale detection of positive selection in nine primates predicts human-virus evolutionary conflicts. Nucleic Acids Research 45, 10634–10648. [DOI] [PMC free article] [PubMed] [Google Scholar]
- Veld P.J.H.I. ‘t, Jeganathan S, Petrovic A, Singh P, John J, Krenn V, Weissmann F, Bange T, and Musacchio A (2016). Molecular basis of outer kinetochore assembly on CENP-T. eLife 5, e21007. [DOI] [PMC free article] [PubMed] [Google Scholar]
- Veld P.J.H.I. ‘t, Volkov VA, Stender ID, Musacchio A, and Dogterom M (2019). Molecular determinants of the Ska-Ndc80 interaction and their influence on microtubule tracking and force-coupling. eLife 8, e49539. [DOI] [PMC free article] [PubMed] [Google Scholar]
- Wan X, O’Quinn RP, Pierce HL, Joglekar AP, Gall WE, DeLuca JG, Carroll CW, Liu S-T, Yen TJ, McEwen BF, et al. (2009). Protein architecture of the human kinetochore microtubule attachment site. Cell 137, 672–684. [DOI] [PMC free article] [PubMed] [Google Scholar]
- Wang F, Dai J, Daum JR, Niedzialkowska E, Banerjee B, Stukenberg PT, Gorbsky GJ, and Higgins JMG (2010). Histone H3 Thr-3 phosphorylation by Haspin positions Aurora B at centromeres in mitosis. Science 330, 231–235. [DOI] [PMC free article] [PubMed] [Google Scholar]
- Weir JR, Faesen AC, Klare K, Petrovic A, Basilico F, Fischböck J, Pentakota S, Keller J, Pesenti ME, Pan D, et al. (2016). Insights from biochemical reconstitution into the architecture of human kinetochores. Nature 537, 249–253. [DOI] [PubMed] [Google Scholar]
- Yamagishi Y, Honda T, Tanno Y, and Watanabe Y (2010). Two histone marks establish the inner centromere and chromosome bi-orientation. Science 330, 239–243. [DOI] [PubMed] [Google Scholar]
- Yan K, Yang J, Zhang Z, McLaughlin SH, Chang L, Fasci D, Ehrenhofer-Murray AE, Heck AJR, and Barford D (2019). Structure of the inner kinetochore CCAN complex assembled onto a centromeric nucleosome. Nature 574, 278–282. [DOI] [PMC free article] [PubMed] [Google Scholar]
- Yang Z (2007). PAML 4: phylogenetic analysis by maximum likelihood. Molecular Biology and Evolution 24, 1586–1591. [DOI] [PubMed] [Google Scholar]
- Yang P, Wang Y, and Macfarlan TS (2017). The role of KRAB-ZFPs in transposable element repression and mammalian evolution. Trends in Genetics 33, 871–881. [DOI] [PMC free article] [PubMed] [Google Scholar]
- Yao Y, and Dai W (2012). Shugoshins function as a guardian for chromosomal stability in nuclear division. Cell Cycle 11, 2631–2642. [DOI] [PMC free article] [PubMed] [Google Scholar]
- Zhao G, Oztan A, Ye Y, and Schwarz TL (2019). Kinetochore proteins have a post-mitotic function in neurodevelopment. Developmental Cell 48, 873–882. [DOI] [PMC free article] [PubMed] [Google Scholar]
Associated Data
This section collects any data citations, data availability statements, or supplementary materials included in this article.
Supplementary Materials
Supplementary Figure 1: Incorporation of Ectopically Expressed CENP-C, Related to Figure 2
(A) Schematic of CENP-C expression experiments. GFP-tagged ectopic CENP-C was expressed by cRNA microinjection into mouse oocytes, in the presence of endogenous mouse CENP-C. Different mouse strains were used (see panel B).
(B) Detailed crossing scheme to produce CHPO hybrid mice (related to Figure 1C). Crossing Mus musculus domesticus strains with larger (CF-1) and smaller (CHPO) centromeres generates a hybrid. The minor satellite monomer is the same in the two strains, but the abundance differs. Due to the metacentric Robertsonian fusion chromosomes in CHPO, hybrid oocytes have 7 trivalents, which are not analyzed in our experiments (see also Supplementary Figure 3D). CHPO hybrid oocytes were used to analyze genetically different bivalents in Figures 2G and 2I. CF-1 oocytes were used to analyze genetically identical bivalents in Figures 2B–2E and 2I.
(C) CENP-C exchange at centromeres. CF-1 oocytes were microinjected with cRNA for GFP-tagged mouse or rat CENP-C, and several centromeres (yellow rectangles) were photobleached in meiosis I. Representative centromeres are marked with arrowheads and shown in insets (yellow: bleached, white: unbleached). 10μm scale bar, 4.4μm square insets. Fluorescence recovery after photobleaching (FRAP) was monitored every three minutes. Each data point represents GFP intensity as a fraction of intensity before bleaching, averaged over multiple centromeres (n=10 centromeres from 5 oocytes for each condition). Partially bleached centromeres were not analyzed. Rapid recovery within 15 min is consistent with previous observations for CENP-C in mitosis (Hemmerich et al., 2008). Given that oocytes are cultured overnight after microinjection of CENP-C cRNA, ectopic CENP-C likely replaces most of endogenous CENP-C.
(D) CENP-C position at centromeres relative to CENP-A and HEC1. Protein-protein distances were measured as previously described (Wan et al., 2009). Briefly, line scans of each centromere were taken parallel to the chromosomal axis at a width of ten pixels (yellow lines in insets). Each dot represents signal intensity of one pixel. The data were fit with Gaussian normal distributions to estimate intensity peaks with subpixel resolution, and the distance between the two peaks was calculated. Chromatic aberration was corrected by staining endogenous CENP-C with two secondary antibodies labeled with different colors (AF488 and AF647), and the distance in this condition shows the error range in our analysis. Bar graph shows mean distances and standard error of the mean (n≥90 centromeres for each construct). CF-1 oocytes were microinjected with cRNA for GFP-tagged mouse or rat CENP-C and fixed in meiosis I. Cells were stained for CENP-C, CENP-A, or HEC1 with AF647-labeled secondary antibody. Images of oocytes expressing mouse CENP-C are shown as examples; 10μm scale bar, 3.5μm square inset. Distances between CENP-C antibody staining and GFP-CENP-C are close to our error range. Distances from CENP-C to CENP-A and CENP-C to HEC1 were consistent with a previous report (11±11nm and 79±10nm, respectively, Suzuki et al., 2014), within our error. We find no significant differences in distance measurements for mouse and rat CENP-C, suggesting that both are incorporated into centromeres similarly.
(E and F) Expression levels are similar between mouse and rat and between mouse and R.pumilio CENP-C. CF-1 oocytes were microinjected with cRNA for the indicated GFP-tagged CENP-C alleles and analyzed for cytoplasmic GFP fluorescence to measure expression levels. Each dot represents one oocyte (n=20 for mouse and rat CENP-C, n≥41 for mouse and R.pumilio CENP-C).
(G) H3K9me3 levels are not affected by kinetochore pathway disruption. CF-1 oocytes were microinjected with cRNA for GFP-tagged mouse or rat CENP-C, fixed in meiosis I, and stained for H3K9me3. Each dot in the plot represents a single centromere (n≥240 centromeres for each construct); red line, mean; ns: not significant. 10μm scale bar.
(H) CHPO hybrid oocytes were microinjected with cRNAs for GFP-tagged R.pumilio CENP-C and mCherry-tagged H2B. Cells were imaged live to preserve chromosome positions, measured at late metaphase I. In the plot, each dot represents a single bivalent (n=85 bivalents for R.pumilio CENP-C, mouse CENP-C data is from Figure 2I); red line, mean; ns: not significant.
Supplementary Figure 2: Analyses of Chromosome Oscillations and Meiotic Progression, Related to Figure 2H, 2I and 3D
(A and B) Positions of genetically different bivalents (from CHPO hybrid oocytes) and genetically identical bivalents (from CF-1 oocytes) were measured every 5 min by live imaging of SiR-DNA. Each line in the graph (A) represents movement of a single bivalent, with thicker lines shown as examples in kymographs. In both cases, bivalents stay in a relatively fixed position, as represented by the small average displacement (B, each data point represents displacement of a bivalent between two consecutive time points). Average displacement is similar for genetically identical and genetically different bivalents, suggesting that the differences in chromosome positions are not due to differences in oscillations.
(C and D) Oocytes were collected, matured in vitro, and imaged live at different time points to analyze meiotic progression. CF-1 oocytes were microinjected with cRNA for GFP-tagged mouse or rat CENP-C, and DNA was visualized with SiR-DNA (C). DNA was visualized with SiR-DNA in Cenpb+/− or Cenpb−/− oocytes (D). Examples of “not aligned”, “aligned”, and “segregated” are shown (10μm scale bar). The numbers of oocytes at each stage were counted at each time point. We find no obvious differences in meiotic progression between oocytes expressing mouse or rat CENP-C, or between Cenpb+/− and Cenpb−/− oocytes. Furthermore, genetically identical bivalents are positioned similarly in all cases (Figures 2I and 3D), suggesting that differences in chromosome positions for genetically different bivalents are due to functional differences in centromeres rather than differences in meiotic progression.
Supplementary Figure 3: CRISPR Genome Editing Creates CENP-B Null Mice, Related to Figure 3
(A) Summary of CRISPR genome editing, using a gRNA designed to target the DNA binding domain of CENP-B.
(B) Cenpb genotyping. As the Cenpb mutation is a 37bp deletion, a PCR reaction amplifying the flanking regions can distinguish three Cenpb genotypes.
(C) Absence of CENP-B protein in Cenpb−/− mice. Protein extract from ovary was used to detect CENP-B using two different antibodies. Bands that disappear in Cenpb−/− likely correspond to CENP-B with and without post-translational modifications such as SUMOylation (Morozov et al., 2017). Faint bands that also appear in Cenpb−/− are non-specific.
(D) Detailed crossing scheme to produce second-generation hybrid Cenpb−/− mice with larger and smaller paired centromeres (related to Figure 3B). The first cross produces first-generation hybrid Cenpb+/− animals with smaller centromeres inherited from CHPO. Because CHPO has six telocentric chromosomes and seven metacentrics formed by Robertsonian chromosome fusions, the first-generation hybrids contain six bivalents in meiosis and seven trivalents, in which a Robertsonian fusion from CHPO pairs with two homologous telocentric chromosomes (Chmátal et al., 2014). Trivalents are associated with meiotic errors (Bint et al., 2011; Daniel, 2002; Pacchierotti et al., 1995), and the first-generation hybrids exhibit low fertility, but some progeny can be obtained in a second cross to Cenpb−/−. These second-generation hybrids inherit some smaller centromeres from the first-generation hybrid parent, and 25% are Cenpb−/− females that can be used to collect oocytes for our analyses. Oocytes from the second-generation hybrids do not arrest at metaphase I, likely because they have fewer trivalents that activate the spindle assembly checkpoint (Chmátal et al., 2015). Therefore, we are unable to measure biased orientation of larger centromeres towards the egg side of the spindle, as previously reported in first-generation hybrids (Iwata-Otsubo et al., 2017), because this bias depends on delayed progression through meiosis I (Akera et al., 2019). Due to the limited number of second-generation hybrids and low fertility of these animals, we were also unable to measure transmission bias.
(E) CENP-C reduction in the second-generation hybrid (related to Figure 3C). Oocytes from the second-generation hybrid were microinjected with cRNA for GFP-tagged dCas9 and gRNA targeting minor satellite centromere DNA, fixed at metaphase I, and stained for CENP-C. Each dot represents a single centromere (n=34 centromeres for each construct); red line, mean; *p<0.01.
(F) Cenpb+/− or Cenpb−/− oocytes were fixed in meiosis I and stained for CENP-A; 10μm scale bar. Plot shows centromere signal intensities, normalized by mean intensity of Cenpb+/− control. Each dot represents a single centromere (n≥210 centromeres); red line, mean; *p<0.05. As CENP-B deletion reduces both CENP-A chromatin and heterochromatin, many other proteins are likely affected as well.
Supplementary Figure 4: Map of Rapidly Evolving Proteins at Centromeres, Related to Figure 4E
Proteins are grouped by functional modules corresponding to Figure 4A: CENP-A chromatin, heterochromatin, kinetochore, and inner centromere proteins (effector proteins). CENP-B has dual functions in CENP-A chromatin and heterochromatin (Figure 6B). Within each module, proteins are further grouped by functions: CENP-A chaperone maintains CENP-A chromatin, CCAN connects CENP-A chromatin to the kinetochore, KMN network binds spindle microtubules, spindle assembly checkpoint proteins delays anaphase in response to unattached kinetochores, and meiotic co-orientation creates the meiosis I kinetochore geometry. Proteins are color-coded by dN/dS values (see Supplementary Table 2). Pink highlighted genes have signatures of positive selection in PAML (see Figure 4E).
Supplementary Figure 5: Changes in CENP-A and CENP-B are not Analyzed by Standard Methods to Detect Adaptive Evolution, Related to Figure 4E
(A) Changes in CENP-A N-terminal tails. CENP-A amino acid sequences of four mammalian species are aligned. Known domains of CENP-A are shown in blue boxes, deviation from the consensus sequence of all four species is shown in black, and deletions are shown as thin horizontal lines. Signatures of positive selection were previously found in primate CENP-A (Schueler et al., 2010), shown in red boxes in the human sequence. We used bovine genomes (Chen et al., 2019) to detect signatures of positive selection in CENP-A, and the result is shown in the goat sequence. Such signatures are mostly found in the N-terminal tail. The N-terminal tail of Murinae CENP-A is either short (as in mouse) or long with two tandem duplicates (as in rat) (green boxes). Thus, alignment of the Murinae CENP-A N-terminal tail is difficult and removed from our PAML analysis.
(B) CENP-B negatively charged domain. Mouse, human, and goat are shown as examples of genomes with CENP-B and paralogous pogo-like transposases. The ratio of negatively charged to positively charged amino acids is plotted. As pogo-like transposases have fewer negatively charged amino acids than CENP-B, the negatively charged domain is likely unique to CENP-B.
(C) Changes in the CENP-B negatively charged domain. Although most of CENP-B is highly conserved, the number of negatively charged amino acids is variable in mammals. For comparison, the number of positively charged amino acids does not change in this domain. The number of species for each number of positively charged or negatively charged amino acids in this domain is plotted. CENP-B sequences of 41 bovine, primate and rodent species were obtained from the Ensembl genome browser.
Data Availability Statement
The draft genomes and raw sequencing reads have been submitted to the NCBI BioProject database (https://www.ncbi.nlm.nih.gov/bioproject) under accession number PRJNA669840. Raw imaging data is available from the authors upon request.
In-house scripts and pipelines are deposited to GitHub (https://github.com/TomoKumon/Kumon_Cell_2021) with DOI 10.5281/zenodo.5129774.
Any additional information required to reanalyze the data reported in this work paper is available from the Lead Contact upon request.