

Summary
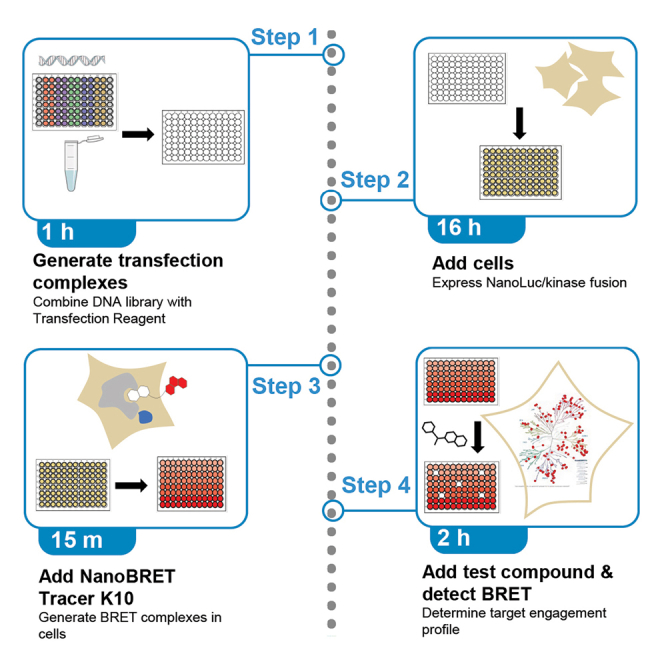
This protocol is used to profile the engagement of kinase inhibitors across nearly 200 kinases in a live-cell context. This protocol utilizes one single kinase tracer (NanoBRET(TM) Tracer K10) that operates quantitatively at four different concentrations. Minimizing the number of tracers offers a significant workflow improvement over the previous protocol that utilized a combination of 6 tracers. Each NanoBRET(TM) kinase assay is built using commercially available plasmids and has been optimized for NanoLuc tagging orientation, diluent DNA, and tracer concentration.
For complete details on the use and execution of this protocol, please refer to Vasta et al. (2018).
Subject areas: cell biology, cell-based assays, high-throughput screening, molecular biology, molecular/chemical probes, biotechnology and bioengineering
Graphical abstract
Highlights
-
•
Target engagement is quantified against 192 full-length kinases in intact cells
-
•
The method uses a single BRET tracer, at 4 different operating concentrations
-
•
This method is simple and can be executed using common lab equipment
-
•
Engagement selectivity differs in live cells vs cell free systems
This protocol is used to profile the engagement of kinase inhibitors across nearly 200 kinases in a live-cell context. This protocol utilizes one single kinase tracer (NanoBRET Tracer K10) that operates quantitatively at four different concentrations. Minimizing the number of tracers offers a significant workflow improvement over the previous protocol that utilized a combination of 6 tracers. Each NanoBRET kinase assay is built using commercially available plasmids and has been optimized for NanoLuc tagging orientation, diluent DNA, and tracer concentration.
Before you begin
Prepare concentrated DNA stock solutions (0.2 mg/mL) and 2× working DNA solutions (20 μg/mL)
Timing:1–10 h
-
1.
Table 1 describes the characteristics of each kinase and its performance in the NanoBRET(TM) assay with Tracer K10. Obtain this library of plasmids encoding NanoLuc/kinase fusions (from Promega individually or en masse as a collection).
Note: Each plasmid has been purified with low endotoxin levels. If this library is being generated de novo, be sure to utilize purification methods that yield low endotoxin.
-
2.
Prepare concentrated DNA stock solutions for long-term storage. Prepare each DNA in this library in a diluent DNA (either Transfection Carrier DNA or cyclin DNA as described in Table 1) to generate 0.18 mg/mL diluent DNA and 0.02 mg/mL kinase/Nluc fusion DNA. The total DNA concentration of each solution should be 0.2 mg/mL
Note: This material at 0.2 mg/mL can be stored long term (at least 6 months) when frozen at – 20°C. For long-term storage, seal each plate with foil tape covers at - 20°C. Ideally, plates stored long-term will be heat-sealed. To further minimize evaporation during storage, enclose each plate in an air-tight plastic bag. When thawing the DNA plate, spin the DNA plates prior to removing the foil cover.
-
3.
From the concentrated stock solutions, prepare 2× working DNA solutions for day-to-day experimentation. Dilute the stock 0.2 mg/mL plasmid DNA solutions 1:10 into nuclease-free TE buffer to achieve a total final concentration of 20 μg/mL DNA in TE buffer.
-
4.
As described above, seal each plate with foil tape covers to avoid evaporation. To further minimize evaporation during storage, enclose each plate in an air-tight plastic bag. Ideally, plates stored long-term will be heat-sealed.
-
5.
Store these 20 μg/mL solutions for up to 4 weeks at −80°C and avoid greater than 5× freeze/thaw cycles. When thawing the DNA plate for transfection, spin the DNA plates prior to removing the foil cover. This will minimize the cross-contamination. Reseal with fresh seals after each use.
Table 1.
Summary of individual NanoBRET(TM) Kinase assay components and expected assay outcomes using control inhibitors CC1 or crizotinib
| Kinase | Product # (promega) | Diluent DNA | Orientation of Nluc | [NanoBRET(TM) tracer K10], nM | BRET S:B (BRETTracer / BRETno tracer) | CC1 % occupancy, 300 nM | St dev | Crizotinib % occupancy, 1 uM | St dev |
|---|---|---|---|---|---|---|---|---|---|
| LRRK2 | NV340A | Transfection Carrier | C | 25 | 3.7 | 98 | 2.0 | −9 | 15.2 |
| MAPK6 | NV169A | Transfection Carrier | N | 25 | 7.4 | 99 | 0.8 | 2 | 2.4 |
| IRAK3 | NV144A | Transfection Carrier | N | 25 | 4.5 | 98 | 0.8 | 42 | 4.4 |
| TEK | NV215A | Transfection Carrier | C | 25 | 3.7 | 90 | 1.0 | 37 | 4.7 |
| TNK1 | NV218A | Transfection Carrier | N | 25 | 10.0 | 94 | 0.8 | −6 | 4.1 |
| GAK | NV142A | Transfection Carrier | N | 25 | 14.9 | 97 | 0.5 | −14 | 1.5 |
| MAPK4 | NV168A | Transfection Carrier | N | 25 | 26.8 | 97 | 1.2 | −12 | 3.4 |
| AAK1 | NV100A | Transfection Carrier | N | 25 | 12.2 | 99 | 0.3 | −14 | 0.9 |
| AURKA | NV104A | Transfection Carrier | C | 25 | 6.8 | 93 | 1.0 | 30 | 7.7 |
| AURKC | NV106A | Transfection Carrier | C | 25 | 10.6 | 92 | 1.8 | 48 | 4.2 |
| AURKB | NV105A | Transfection Carrier | C | 25 | 10.7 | 94 | 1.6 | 46 | 5.9 |
| NUAK1 | NV183A | Transfection Carrier | N | 25 | 3.4 | 98 | 2.4 | 36 | 6.6 |
| LATS2 | NV151A | Transfection Carrier | C | 25 | 5.0 | 79 | 7.1 | −10 | 6.2 |
| RPS6KA3 | NV200A | Transfection Carrier | N | 25 | 3.6 | 97 | 0.9 | −7 | 7.7 |
| SNF1LK2 | NV206A | Transfection Carrier | N | 25 | 16.9 | 99 | 0.5 | 0 | 3.4 |
| MYLK2 | NV177A | Transfection Carrier | C | 25 | 6.2 | 99 | 0.4 | −16 | 8.3 |
| AXL | NV107A | Transfection Carrier | C | 250 | 2.9 | 63 | 3.8 | 68 | 1.5 |
| FGFR3 | NV136A | Transfection Carrier | C | 250 | 3.4 | 84 | 4.1 | 14 | 6.8 |
| FLT3 | NV139A | Transfection Carrier | C | 250 | 3.4 | 79 | 3.7 | −4 | 8.6 |
| IGF1R | NV326A | Transfection Carrier | C | 250 | 2.1 | 78 | 3.8 | 18 | 8.2 |
| INSR | NV327A | Transfection Carrier | C | 250 | 2.9 | 83 | 2.5 | 20 | 2.1 |
| LIMK2 | NV153A | Transfection Carrier | C | 250 | 4.2 | 76 | 3.6 | 32 | 9.8 |
| TEC | NV214A | Transfection Carrier | N | 250 | 4.6 | 78 | 1.4 | −7 | 6.7 |
| TIE1 | NV217A | Transfection Carrier | C | 250 | 9.9 | 67 | 7.2 | 35 | 9.9 |
| CLK1 | NV113A | Transfection Carrier | N | 250 | 7.3 | 98 | 0.7 | 0 | 3.4 |
| SBK3 | NV421A | Transfection Carrier | N | 250 | 4.1 | 90 | 4.4 | 41 | 5.6 |
| NEK9 | NV180A | Transfection Carrier | N | 250 | 7.9 | 65 | 5.2 | 1 | 5.4 |
| NEK3 | NV179A | Transfection Carrier | N | 250 | 16.1 | 44 | 9.6 | −2 | 14.5 |
| NIM1K | NV381A | Transfection Carrier | C | 250 | 4.6 | 82 | 4.9 | −3 | 1.7 |
| STK36 | NV433A | Transfection Carrier | N | 250 | 7.1 | 89 | 3.8 | −6 | 6.5 |
| ULK2 | NV222A | Transfection Carrier | N | 250 | 10.5 | 78 | 8.0 | −1 | 1.9 |
| ULK3 | NV449A | Transfection Carrier | N | 250 | 23.1 | 72 | 5.2 | 2 | 6.5 |
| BRSK1 | NV249A | Transfection Carrier | N | 250 | 8.3 | 78 | 7.1 | −1 | 4.0 |
| MAP3K10 | NV156A | Transfection Carrier | N | 250 | 4.5 | 54 | 3.3 | −1 | 4.4 |
| MAP3K9 | NV160A | Transfection Carrier | N | 250 | 2.9 | 60 | 4.3 | −1 | 6.2 |
| MYLK3 | NV374A | Transfection Carrier | C | 250 | 8.5 | 72 | 9.1 | −8 | 6.4 |
| PHKG1 | NV186A | Transfection Carrier | N | 250 | 5.9 | 86 | 3.1 | −3 | 6.3 |
| STK33 | NV211A | Transfection Carrier | N | 250 | 3.1 | 90 | 3.4 | −3 | 3.9 |
| STK4 | NV435A | Transfection Carrier | N | 250 | 4.8 | 67 | 2.4 | 11 | 7.6 |
| TLK1 | NV443A | Transfection Carrier | C | 250 | 2.8 | 5 | 1.9 | −5 | 3.8 |
| FGFR1 | NV134A | Transfection Carrier | C | 100 | 3.3 | 95 | 1.8 | 0 | 3.8 |
| FGFR2 | NV135A | Transfection Carrier | C | 100 | 3.5 | 94 | 0.7 | 10 | 1.8 |
| MUSK | NV176A | Transfection Carrier | C | 100 | 3.3 | 89 | 4.3 | 80 | 2.8 |
| NTRK1 | NV181A | Transfection Carrier | C | 100 | 4.1 | 68 | 4.5 | 71 | 2.5 |
| RET | NV195A | Transfection Carrier | C | 100 | 6.0 | 90 | 1.5 | 4 | 4.5 |
| NTRK2 | NV182A | Transfection Carrier | C | 100 | 4.6 | 80 | 3.4 | 85 | 2.3 |
| TNK2 | NV445A | Transfection Carrier | C | 100 | 6.8 | 73 | 4.0 | 13 | 6.7 |
| LTK | NV154A | Transfection Carrier | C | 100 | 4.2 | 71 | 4.3 | 87 | 0.9 |
| BRAF(V600E) | NV248A | Transfection Carrier | C | 100 | 3.9 | 39 | 5.8 | −4 | 3.9 |
| IRAK4 | NV145A | Transfection Carrier | C | 100 | 6.5 | 98 | 1.4 | 6 | 7.0 |
| ITK | NV146A | Transfection Carrier | N | 100 | 3.4 | 92 | 1.8 | −1 | 6.2 |
| JAK2 (V617F) | NV330A | Transfection Carrier | C | 100 | 3.3 | 90 | 2.8 | 65 | 8.3 |
| MAP3K11 | NV157A | Transfection Carrier | N | 100 | 4.6 | 71 | 4.9 | 0 | 6.0 |
| PTK2 | NV192A | Transfection Carrier | N | 100 | 3.3 | 88 | 1.2 | 40 | 4.0 |
| PTK6 | NV194A | Transfection Carrier | C | 100 | 3.7 | 100 | 0.6 | −2 | 1.2 |
| PTK2B | NV193A | Transfection Carrier | C | 100 | 2.2 | 91 | 2.2 | 47 | 5.1 |
| BMP2K | NV109A | Transfection Carrier | N | 100 | 8.9 | 94 | 1.6 | 11 | 6.0 |
| NEK5 | NV379A | Transfection Carrier | N | 100 | 16.2 | 85 | 1.2 | −6 | 2.1 |
| STK16 | NV209A | Transfection Carrier | N | 100 | 13.4 | 85 | 1.9 | −13 | 6.2 |
| TBK1 | NV213A | Transfection Carrier | N | 100 | 7.5 | 78 | 4.2 | −7 | 10.8 |
| ULK1 | NV221A | Transfection Carrier | N | 100 | 14.2 | 94 | 1.9 | −1 | 5.5 |
| MAP4K2 | NV162A | Transfection Carrier | N | 100 | 4.5 | 76 | 2.0 | 77 | 10.7 |
| WEE1 | NV223A | Transfection Carrier | C | 100 | 5.3 | 91 | 1.0 | −9 | 2.5 |
| MYLK4 | NV375A | Transfection Carrier | C | 100 | 6.1 | 99 | 0.7 | −8 | 8.4 |
| MARK4 | NV173A | Transfection Carrier | N | 100 | 4.4 | 90 | 2.0 | −15 | 4.5 |
| PRKAA1 | NV410A | Transfection Carrier | N | 100 | 11.3 | 92 | 1.5 | −1 | 4.9 |
| PRKAA2 | NV189A | Transfection Carrier | N | 100 | 12.6 | 97 | 0.3 | −6 | 2.2 |
| RPS6KA1 | NV198A | Transfection Carrier | N | 100 | 7.9 | 89 | 1.9 | −6 | 2.5 |
| RPS6KA2 | NV199A | Transfection Carrier | N | 100 | 4.7 | 79 | 4.2 | −7 | 7.5 |
| RPS6KA4 | NV201A | Transfection Carrier | N | 100 | 6.6 | 85 | 0.7 | −11 | 6.0 |
| RPS6KA6 | NV202A | Transfection Carrier | N | 100 | 3.0 | 89 | 2.3 | −10 | 7.3 |
| SIK1 | NV203A | Transfection Carrier | N | 100 | 10.2 | 93 | 1.6 | −4 | 4.7 |
| CLK4 | NV115A | Transfection Carrier | C | 100 | 2.5 | 101 | 1.4 | −19 | 4.6 |
| MAPK8 | NV170A | Transfection Carrier | N | 100 | 5.8 | 70 | 7.8 | −16 | 4.2 |
| MAPK9 | NV171A | Transfection Carrier | N | 100 | 9.4 | 70 | 6.4 | −11 | 2.1 |
| IKBKE | NV143A | Transfection Carrier | N | 100 | 7.7 | 74 | 5.2 | 21 | 2.8 |
| LATS1 | NV150A | Transfection Carrier | C | 100 | 5.1 | 68 | 5.7 | −10 | 3.9 |
| PRKX | NV191A | Transfection Carrier | C | 100 | 3.6 | 65 | 4.9 | −14 | 7.9 |
| CSNK2A2 | NV119A | Transfection Carrier | C | 100 | 5.5 | 87 | 3.0 | −14 | 5.8 |
| HIPK4 | NV324A | Transfection Carrier | N | 100 | 7.8 | 97 | 0.4 | −9 | 6.1 |
| STK10 | NV426A | Transfection Carrier | C | 1000 | 2.8 | 80 | 3.4 | 35 | 3.0 |
| FGFR4 | NV137A | Transfection Carrier | C | 1000 | 3.5 | 68 | 4.0 | 3 | 1.6 |
| MAP4K1 | NV161A | Transfection Carrier | N | 1000 | 3.9 | 70 | 4.5 | 14 | 4.1 |
| MERTK | NV356A | Transfection Carrier | C | 1000 | 2.2 | 48 | 3.9 | 58 | 3.3 |
| MET | NV175A | Transfection Carrier | C | 1000 | 5.1 | 42 | 8.5 | 95 | 1.1 |
| RON | NV418A | Transfection Carrier | C | 1000 | 3.9 | 32 | 9.9 | 86 | 4.8 |
| TYRO3 | NV448A | Transfection Carrier | C | 1000 | 2.5 | 47 | 0.5 | 49 | 2.2 |
| LCK | NV152A | Transfection Carrier | C | 1000 | 3.8 | 78 | 4.2 | 36 | 5.7 |
| LIMK1 | NV339A | Transfection Carrier | C | 1000 | 5.2 | 69 | 5.6 | 29 | 5.5 |
| EPHA1 | NV122A | Transfection Carrier | C | 1000 | 3.3 | 74 | 3.2 | 75 | 2.2 |
| EPHA4 | NV124A | Transfection Carrier | C | 1000 | 2.8 | 33 | 5.2 | 53 | 4.4 |
| EPHA6 | NV126A | Transfection Carrier | C | 1000 | 3.9 | 38 | 1.7 | 64 | 5.1 |
| EPHA7 | NV127A | Transfection Carrier | C | 1000 | 4.4 | 51 | 4.6 | 38 | 2.4 |
| EPHB1 | NV307A | Transfection Carrier | C | 1000 | 3.4 | 65 | 2.4 | 68 | 2.0 |
| EPHB4 | NV131A | Transfection Carrier | C | 1000 | 3.1 | 53 | 4.9 | 62 | 3.6 |
| FYN | NV141A | Transfection Carrier | C | 1000 | 3.9 | 65 | 7.5 | −2 | 12.3 |
| ABL2 | NV233A | Transfection Carrier | N | 1000 | 2.9 | 72 | 5.5 | 43 | 3.9 |
| BMX | NV110A | Transfection Carrier | C | 1000 | 4.5 | 60 | 6.3 | 7 | 4.3 |
| BTK | N244A | Transfection Carrier | C | 1000 | 6.8 | 75 | 4.4 | 1 | 1.3 |
| FER | NV133A | Transfection Carrier | C | 1000 | 2.8 | 66 | 4.9 | 16 | 7.9 |
| FES | NV309A | Transfection Carrier | C | 1000 | 3.0 | 43 | 7.6 | 1 | 2.5 |
| JAK3 | NV147A | Transfection Carrier | C | 1000 | 4.7 | 45 | 4.8 | 2 | 4.4 |
| SRMS | NV425A | Transfection Carrier | N | 1000 | 2.7 | 18 | 4.3 | 0 | 4.9 |
| TXK | NV220A | Transfection Carrier | C | 1000 | 2.6 | 60 | 13.1 | 18 | 2.8 |
| CLK2 | NV114A | Transfection Carrier | C | 1000 | 4.1 | 89 | 2.2 | 1 | 4.7 |
| DYRK1A | NV303A | Transfection Carrier | N | 1000 | 2.6 | 78 | 4.4 | 0 | 5.3 |
| DYRK1B | NV121A | Transfection Carrier | N | 1000 | 3.3 | 87 | 3.6 | 0 | 2.1 |
| ERN1 | NV132A | Transfection Carrier | C | 1000 | 3.6 | 83 | 1.3 | −3 | 8.1 |
| ERN2 | NV308A | Transfection Carrier | C | 1000 | 5.3 | 61 | 7.4 | −9 | 13.9 |
| HIPK2 | NV322A | Transfection Carrier | N | 1000 | 3.3 | 82 | 2.8 | 5 | 4.4 |
| HIPK3 | NV323A | Transfection Carrier | N | 1000 | 1.9 | 70 | 14.3 | −4 | 14.6 |
| ICK | NV325A | Transfection Carrier | N | 1000 | 2.6 | 47 | 11.0 | 3 | 15.4 |
| CDK1 | NV270A | CycB1 (NV260A) | C | 1000 | 3.0 | 71 | 7.1 | 7 | 2.9 |
| CDK2 | NV278A | CycE1 (NV264A) | C | 1000 | 12.5 | 80 | 4.0 | 3 | 1.6 |
| CDK3 | NV280A | CycE1 (NV264A) | C | 1000 | 6.9 | 85 | 3.5 | 6 | 1.3 |
| CDK4 | NV281A | CycD3 (NV263A) | N | 1000 | 8.2 | 93 | 2.2 | 4 | 4.2 |
| CDK5 | NV112A | CDK5R1 (NV282A | C | 1000 | 13.3 | 85 | 3.6 | 1 | 0.8 |
| CDK6 | NV284A | CycD1 (NV262A) | N | 1000 | 4.1 | 89 | 2.2 | 0 | 3.0 |
| CDK7 | NV285A | Transfection Carrier | N | 1000 | 3.3 | 83 | 4.1 | 32 | 1.3 |
| CDK9 | NV287A | CycK (NV266A) | N | 1000 | 3.8 | 68 | 4.1 | 4 | 5.5 |
| CDK10 | NV271A | CycL2 (NV267A) | C | 1000 | 2.9 | 50 | 3.7 | 8 | 0.5 |
| CDK14 | NV272A | CycY (NV269A) | C | 1000 | 4.3 | 82 | 1.3 | 0 | 2.4 |
| CDK15 | NV273A | CycY (NV269A) | N | 1000 | 3.5 | 78 | 2.1 | 3 | 2.8 |
| CDK16 | NV274A | CycY (NV269A) | C | 1000 | 7.2 | 96 | 0.6 | 2 | 0.4 |
| CDK17 | NV275A | CycY (NV269A) | C | 1000 | 9.6 | 95 | 0.8 | 3 | 3.6 |
| CDK18 | NV276A | CycY (NV269A) | C | 1000 | 11.4 | 86 | 1.4 | 2 | 2.1 |
| CDKL2 | NV289A | Transfection Carrier | N | 1000 | 6.7 | 95 | 1.3 | 21 | 0.7 |
| CDK20 | NV279A | CycH (NV265A) | N | 1000 | 4.3 | 54 | 4.9 | −11 | 5.0 |
| CDKL1 | NV288A | Transfection Carrier | N | 1000 | 5.1 | 64 | 3.2 | 2 | 0.9 |
| CSNK2A1 | NV298A | Transfection Carrier | C | 1000 | 2.8 | 64 | 2.6 | 5 | 6.7 |
| CDKL3 | NV290A | Transfection Carrier | N | 1000 | 2.2 | 83 | 4.5 | 8 | 2.0 |
| CDKL5 | NV291A | Transfection Carrier | N | 1000 | 4.6 | 84 | 1.3 | 4 | 1.8 |
| JNK3 | NV148A | Transfection Carrier | C | 1000 | 3.1 | 36 | 3.9 | −4 | 0.8 |
| MAPK11 | NV165A | Transfection Carrier | N | 1000 | 5.4 | 35 | 2.3 | 0 | 2.6 |
| MAPK14 | NV166A | Transfection Carrier | C | 1000 | 3.7 | 22 | 1.5 | 0 | 1.7 |
| NLK | NV382A | Transfection Carrier | C | 1000 | 3.2 | 30 | 3.4 | −1 | 3.5 |
| NEK11 | NV377A | Transfection Carrier | N | 1000 | 3.9 | 52 | 4.2 | 7 | 3.6 |
| NEK1 | NV376A | Transfection Carrier | N | 1000 | 5.9 | 38 | 1.7 | 3 | 4.1 |
| NEK2 | NV178A | Transfection Carrier | N | 1000 | 3.4 | 46 | 2.7 | 6 | 6.1 |
| NEK4 | NV378A | Transfection Carrier | N | 1000 | 3.8 | 25 | 0.8 | −12 | 5.6 |
| PAK4 | NV184A | Transfection Carrier | C | 1000 | 11.1 | 25 | 5.5 | 1 | 2.4 |
| MAP4K3 | NV163A | Transfection Carrier | N | 1000 | 7.6 | 50 | 1.4 | 8 | 1.5 |
| STK11 | NV208A | Transfection Carrier | N | 1000 | 3.5 | 81 | 2.3 | −1 | 0.9 |
| SLK | NV205A | Transfection Carrier | N | 1000 | 2.5 | 87 | 3.8 | 36 | 2.9 |
| DAPK2 | NV299A | Transfection Carrier | N | 1000 | 2.5 | 53 | 3.4 | 3 | 1.6 |
| MAP3K2 | NV347A | Transfection Carrier | C | 1000 | 3.2 | 47 | 2.9 | 6 | 1.7 |
| PLK2 | NV408A | Transfection Carrier | N | 1000 | 3.0 | 71 | 3.2 | 4 | 8.5 |
| PLK3 | NV409A | Transfection Carrier | N | 1000 | 3.2 | 52 | 0.8 | 4 | 1.9 |
| PLK4 | NV188A | Transfection Carrier | N | 1000 | 8.6 | 52 | 3.9 | 4 | 1.2 |
| STK35 | NV432A | Transfection Carrier | C | 1000 | 3.4 | 60 | 5.9 | 16 | 3.3 |
| STK17B | NV427A | Transfection Carrier | C | 1000 | 1.9 | 56 | 2.5 | 0 | 3.8 |
| TLK2 | NV444A | Transfection Carrier | C | 1000 | 3.7 | 1 | 3.9 | 0 | 3.2 |
| BRSK2 | NV111A | Transfection Carrier | N | 1000 | 15.9 | 79 | 2.5 | 3 | 2.4 |
| MARK2 | NV172A | Transfection Carrier | N | 1000 | 4.2 | 76 | 1.7 | 4 | 2.1 |
| MELK | NV174A | Transfection Carrier | N | 1000 | 5.8 | 43 | 6.8 | −2 | 2.4 |
| CSNK1A1L | NV295A | Transfection Carrier | N | 1000 | 3.6 | 19 | 4.3 | −6 | 2.9 |
| CSNK1D | NV296A | Transfection Carrier | N | 1000 | 3.5 | 30 | 2.3 | −4 | 1.4 |
| CSNK1G2 | NV118A | Transfection Carrier | N | 1000 | 3.4 | 47 | 1.2 | 1 | 2.8 |
| SIK3 | NV204A | Transfection Carrier | N | 1000 | 12.8 | 62 | 0.8 | 0 | 3.3 |
| SNRK | NV424A | Transfection Carrier | N | 1000 | 4.0 | 68 | 3.7 | −4 | 7.7 |
| CAMK1 | NV253A | Transfection Carrier | N | 1000 | 2.4 | 54 | 2.5 | 7 | 2.6 |
| CAMK2A | NV256A | Transfection Carrier | N | 1000 | 5.8 | 64 | 0.7 | 3 | 2.3 |
| CAMK2D | NV257A | Transfection Carrier | N | 1000 | 5.7 | 68 | 1.3 | 3 | 2.2 |
| CHEK2 | NV293A | Transfection Carrier | C | 1000 | 2.4 | 40 | 4.4 | 0 | 5.0 |
| DCLK3 | NV300A | Transfection Carrier | C | 1000 | 2.4 | 61 | 2.7 | 0 | 3.4 |
| MKNK2 | NV371A | Transfection Carrier | N | 1000 | 2.6 | 64 | 3.0 | 1 | 4.6 |
| PHKG2 | NV388A | Transfection Carrier | N | 1000 | 2.7 | 50 | 1.4 | 3 | 2.5 |
| MAP3K3 | NV349A | Transfection Carrier | C | 1000 | 3.1 | 36 | 3.3 | 4 | 1.9 |
| RIOK2 | NV196A | Transfection Carrier | N | 1000 | 7.1 | 31 | 3.4 | 9 | 6.8 |
| MAP4K5 | NV350A | Transfection Carrier | C | 1000 | 3.2 | 26 | 1.2 | 36 | 4.0 |
| MAST3 | NV353A | Transfection Carrier | N | 1000 | 2.5 | 44 | 8.8 | −1 | 6.6 |
| MAST4 | NV354A | Transfection Carrier | N | 1000 | 2.2 | 46 | 6.0 | 6 | 6.4 |
| STK32B | NV210A | Transfection Carrier | N | 1000 | 3.8 | 18 | 4.3 | −1 | 1.9 |
| STK3 | NV430A | Transfection Carrier | N | 1000 | 3.9 | 43 | 3.5 | 1 | 8.8 |
| STK38 | NV212A | Transfection Carrier | C | 1000 | 6.8 | 24 | 0.5 | 1 | 2.2 |
| STK38L | NV434A | Transfection Carrier | C | 1000 | 3.9 | 20 | 2.1 | 5 | 2.8 |
| PAK6 | NV386A | Transfection Carrier | C | 1000 | 3.3 | 24 | 13.4 | −7 | 23.7 |
| AKT2 | NV103A | Transfection Carrier | C | 1000 | 3.5 | 22 | 1.7 | −1 | 4.7 |
| PKMYT1 | NV187A | Transfection Carrier | C | 1000 | 2.6 | 30 | 1.1 | 6 | 1.7 |
| PRKACA | NV190A | Transfection Carrier | C | 1000 | 6.9 | 56 | 3.1 | −1 | 1.4 |
| PRKACB | NV411A | Transfection Carrier | C | 1000 | 3.6 | 26 | 3.5 | 5 | 3.5 |
| PRKCE | NV412A | Transfection Carrier | C | 1000 | 3.3 | 30 | 8.1 | −6 | 6.1 |
| SGK1 | NV422A | Transfection Carrier | C | 1000 | 3.0 | 43 | 4.5 | −1 | 1.1 |
| WEE2 | NV450A | Transfection Carrier | N | 1000 | 2.8 | 69 | 2.7 | −4 | 2.6 |
| RIPK1 | NV417A | Transfection Carrier | N | 1000 | 2.8 | 25 | 1.8 | 23 | 3.9 |
| RIPK2 | NV197A | Transfection Carrier | N | 1000 | 9.1 | 64 | 1.5 | 43 | 0.5 |
| TNNI3K | NV446A | Transfection Carrier | C | 1000 | 4.0 | 65 | 0.9 | 85 | 1.4 |
| MLTK | NV372A | Transfection Carrier | N | 1000 | 4.4 | 62 | 5.4 | −3 | 8.7 |
| MAP3K12 | NV158A | Transfection Carrier | N | 1000 | 3.7 | 39 | 1.0 | 12 | 6.8 |
| MAP3K19 | NV346A | Transfection Carrier | C | 1000 | 3.0 | 8 | 4.4 | 6 | 5.7 |
| MAP3K21 | NV348A | Transfection Carrier | N | 1000 | 3.2 | 33 | 0.6 | 3 | 5.3 |
| MAP3K4 | NV159A | Transfection Carrier | C | 1000 | 4.8 | 90 | 1.7 | −1 | 2.6 |
Key resources table
| REAGENT or RESOURCE | SOURCE | IDENTIFIER |
|---|---|---|
| Experimental models: cell lines | ||
| HEK293 cells | ATCC | CRL-1573 |
| Chemicals, peptides, and recombinant proteins | ||
| OptiMEM | Gibco | 11058–021 |
| DMEM | Gibco | 12430–054 |
| Fetal Bovine Serum (FBS) | VWR | 89510–194 |
| FuGENE HD | Promega | E2312 |
| Trypsin | Gibco | 25300–056 |
| DMSO | Sigma | D2650-5X10ML |
| CC1 pan-Kinase Inhibitor | Promega | N2661 |
| Crizotinib | Selleckchem | S1068 |
| TE Buffer, Sterile, Nuclease-free | Promega | V6231 |
| Critical commercial assays | ||
| NanoBRET(TM) Tracer Dilution Buffer | Promega | N219B |
| NanoBRET-TE Complete Tracer K10 Kit | Promega | N2641 |
| Recombinant DNA | ||
| Kinase/NanoLuc Plasmid Library for Live Cell Profiling with NanoBRET(TM) Tracer K10. (see Table 1 ) | Promega | https://www.promega.com/resources/guides/kinase-target-engagement-assay-selection-table/#sort=%40kinasez32xname%20ascending |
| NanoLuc(R) Control Vector | Promega | N1091 |
| Transfection Control Vector (MET-Nluc) | Promega | NV175A |
| Transfection Carrier DNA | Promega | E4882 |
| Other | ||
| Sterile, white, opaque, TC-treated 96 well plates (assay plates for cell seeding) | Corning | 3917 |
| 96-well polypropylene plate (for transfection complex preparation) | Thermo Scientific Nunc | 12–565-438 |
| 96-well plates (for DNA storage) | Axygen | P-96-450V-C |
| Axygen Aluminum sealing film | Axygen | PCR-AS-600 |
| NanoBRET™-compatible luminometer | n/a | n/a |
Step-by-step method details
Day 1: Cell transfection
This step is designed to deliver each plasmid DNA into HEK293 cells to generate individual cell populations expressing selected kinase/DNA fusion proteins.
-
1.
Passage HEK-293 cells with DMEM + 10% FBS (growth medium) one day prior to the transfection (2 days prior to assay). Avoid use of cells that have exceeded 50 passages.
-
2.
Ensure that cells are 70–90% confluent on the day of transfection
-
3.
Trypsinize the cells and inactivate the trypsin using complete growth medium. Centrifuge the cells at 200 × g / 4°C to generate a cell pellet.
-
4.
Resuspend HEK293 cells for transfection and adjust the cell density to 2 × 10⁵/mL in Opti-MEM + 1% FBS.
-
5.
Add 100 μL/well of HEK293 cells to each well of a TC-treated, 96-well plate.
-
6.Prepare Transfection complexes.
-
a.Estimate the required volume of transfection complex, determine the number of data points needed for each kinase.The following controls or conditions are recommended:
 CRITICAL:Zero BRET Control: NanoLuc® control vector (lacking a kinase fusion) must be used for each experiment to define 100% Fractional Occupancy.Note: NanoLuc® control vector must be diluted in Transfection Carrier DNA prior to use. Dilute 1 part NanoLuc® control vector to 9 parts Transfection Carrier DNA. This DNA solution should then be diluted with TE Buffer to the same final working concentration (20μg/mL) as the kinase plasmids prior to creating transfection complexes.Note: Include this control on each assay plate. If desired, Tracer can be added to these wells to prove that there is no nonspecific BRET observed from the tracer.CRITICAL:100% BRET Control: This is Tracer + DMSO but without test compound. Use this control for each kinase to define 0% Fractional Occupancy.
-
i.Technical replicates (recommended) can be used for each control and test compound sample
-
ii.Transfection Control (recommended): Use this control to determine if the transfection was successful prior to executing the complete NanoBRET assay. Process this sample prior to the assay setup on day 2. Prepare this transfection on a separate plate. Transfect at least 4 wells for this purpose. The MET-NanoLuc plasmid is an ideal DNA for this purpose. Dilute the MET-NanoLuc control plasmid into Carrier DNA to match the conditions used for the experimental sample.
-
i.
-
b.Assemble 2× Kinase DNA solutions and transfer to a sterile 96-well polypropylene plate:Note: For each well of analysis, you will require 3 μL of each 2× Kinase DNA solution at 20μg/mL.Note: If frozen, we recommend thawing the DNA quickly at 37°C and centrifuging the plate or strip briefly to ensure the solution is at the bottom of the vessel.
-
c.Prepare 2× Fugene HD solution:
-
i.Dilute Fugene HD to a final concentration of 60μL/mL in room temperature (22°C–26°C) OptiMEM in a sterile conical tube, directly into the liquid.Note: For each well of analysis, prepare 3 μL of 2× Fugene HD solution.
-
i.
-
d.Add equal parts of the 2× Fugene HD solution to the 2× Kinase DNA solutions.
-
e.Mix on an orbital shaker for 15 s at 400 rpm.
-
f.Allow complexes to form for 30 min at room temperature.Note: For experienced users, the cells can be prepared during this step.
-
a.
-
7.
Transfer 5 μL per well of the Transfection Complex into 100 μL/well of the 96-well plate with the HEK293 cells.
-
8.
Incubate 16–24 h at 37°C and 5% CO2.
Note: Allow a minimum of 16 h for transfection to occur, ideally between 20–24 h.
Day 2: Verify transfection efficiency with the transfection control samples
-
9.
Prepare 3× Complete NanoBRETTM Nano-Glo® Substrate (included in the NanoBRET(TM) K10 Complete Kit) in OptiMEM without serum or phenol red. This solution consists of a 1:166 dilution of NanoBRETTM Nano-Glo® Substrate plus a 1:500 dilution of Extracellular NanoLuc Inhibitor in OptiMEM without serum or phenol red. Mix gently by inverting 5–10 times in a conical tube. (The final concentration of Extracellular NanoLuc inhibitor in the 3× solution is 60 μM, for a working concentration of 20 μM.)
Note: 3× solutions should be used within 1.5 h of preparation.
-
10.
To wells with transfected cells: Add 50μL per well of 3× Complete NanoBRETTM Nano-Glo® Substrate with NanoBRETTM Extracellular Inhibitor for a 96-well plate. Incubate 2–3 min at room temperature (RT).
-
11.
To the empty wells that are on the opposite side of the plate: Add 50μL per well of 3× Complete NanoBRETTM Nano-Glo® Substrate with NanoBRETTM Extracellular Inhibitor for a 96-well plate. Incubate 2–3 min at RT. Note that measuring background wells adjacent to sample wells may result in signal bleed through. Therefore, to accurately quantify background luminescence, use wells of the plate that are not adjacent to wells that contain NanoLuc expression..
-
12.
Following addition of NanoBRETTM Nano-Glo® Substrate, measure donor emission (e.g., 450 nm) and acceptor emission (e.g., 610 nm or 630 nm) using a NanoBRET™-compatible luminometer.
-
13.Determine the signal-to-background (S/B) in the 450 nM channel.
-
a.Calculate S/B.
-
i.450 nm relative light units (RLUs) (transfected cells + NanoGlo reagents) / RLUs (NanoGlo reagents alone)
-
i.
-
b.The S/B should be >1000 to support proceeding with a large scale assay. Ideally, S/B is 1 × 10⁴–1 × 10⁵.
-
a.
Cellular treatment of compounds and NanoBRET(TM) tracer
This step is required for the cellular system to achieve equilibrium. This involves introduction of NanoBRET(TM) Tracer K10 at concentrations appropriate to quantify occupancy of each kinase. NanoBRET(TM) tracers generally equilibrate after short incubation times, however 2 h is recommended as a general incubation time for most kinase inhibitors. Longer incubations may be required for slow-binding inhibitors.
Addition of NanoBRET tracers
-
14.Based on the plate layout, calculate the number of data points needed for each concentration bin.
-
a.Refer to Table 1 for a list of the four tracer conditions recommended (25 nM, 100 nM, 250 nM, 1000 nM). These concentrations are recommended based on kinase affinity measurements.
-
a.
-
15.Prepare Complete 20× NanoBRET(TM) Tracer Reagent.
-
a.First, prepare the 100× solution of the NanoBRET(TM) Tracer in DMSO.
-
i.1 μM concentration bin: Prepare 100 μM tracer (1:4 dilution of master stock)
-
ii.250 nM concentration bin: Prepare 25 μM tracer (1:16 dilution of master stock) into DMSO)
-
iii.100 nM concentration bin: Prepare 10 μM tracer (1:40 dilution of master stock into DMSO)
-
iv.25 nM concentration bin: Prepare 2.5 μM tracer (1:160 dilution of master stock into DMSO)
-
i.
-
b.From the 100× Tracer solutions, add tracer dilution buffer to generate 20× Complete Tracer Dilution Buffer
-
i.Dilute 1 part 100× tracer with 4 parts tracer dilution buffer
-
i.
-
a.
Note: To prepare the Complete 20× NanoBRETTM Tracer Reagent, add the concentrated tracer stock and DMSO into a conical tube first, then mix. Then, to the resultant solution, add the Tracer Dilution Buffer and mix. For dispensing, add 20× tracer into a polypropylene (not polystyrene) trough.
-
16.
Add 5μL of Complete 20× NanoBRET(TM) Tracer Reagent (+ tracer) per well to transfected cells, directly into the liquid.
-
17.
Mix on an orbital shaker for 15 s at 900 RPM at room temperature.
Addition of test compounds
-
18.Prepare 10× test compounds in OptiMEM
-
a.Dilute the test compound to 1000× in DMSO (or the test compound solvent). Example fractional occupancy profiling data is shown below for crizotinib (1 uM final concentration) or CC1 (300 nM concentration).
-
b.Dilute the 1000× test compound to 10× in Opti-MEM.
-
a.
Note: For the DMSO control (100% BRET Control), dilute 10μL DMSO to 1mL with OptiMEM
-
19.
Add 10μL per well of 10× test compound or 10μL of the DMSO control to the 96-well plates containing cells with 1× tracer. Mix on orbital shaker for 15 s at 900 rpm.
-
20.
Incubate the plate at 37°C + 5% CO2 incubator for 2hr. Allow plate to cool to RT for ∼15 min, then proceed to NanoBRETTM Assay section below.
-
21.Immediately before the BRET measurements, prepare 3× Complete NanoBRETTM Nano-Glo® Substrate in OptiMEM without serum or phenol red. This solution consists of a 1:166 dilution of NanoBRETTM Nano-Glo® Substrate plus a 1:500 dilution of Extracellular NanoLuc Inhibitor in OptiMEM without serum or phenol red. Mix gently by inverting 5–10 times in a conical tube. (The final concentration of Extracellular NanoLuc inhibitor in the 3× solution is 60 μM, for a working concentration of 20 μM.)
-
a.Note: 3× solutions should be used within 1.5 h after preparation.
-
a.
-
22.
Add 50μL per well of 3× Complete NanoBRETTM Nano-Glo® Substrate with NanoBRETTM Extracellular Inhibitor for a 96-well plate. Incubate 2–3 min at RT. Following addition of NanoBRETTM Nano-Glo® Substrate, measure donor emission (e.g., 450 nm) and acceptor emission (e.g., 610 nm or 630 nm) using a NanoBRET™-compatible luminometer.
Quantification and statistical analysis
BRET Quantitation
-
1.
To generate raw BRET ratio values, divide the acceptor emission value (e.g., 610 nm) by the donor emission value (e.g., 450 nm) for each sample.
Fractional occupancy Quantitation
-
2.
Determine Fractional Occupancy with the following equation;
% Occupancy = [1 – (X – Z)/( Y – Z)]∗100- Where:
- X = BRET in the presence of the test compound and tracer,
- Y = BRET in the presence of the 100% BRET Control (Tracer + DMSO)
- Z = BRET for the Zero BRET Control, e.g.,
-
a.BRET from the NanoLuc Control Vector
-
b.BRET from Kinase/NanoLuc fusion + saturating dose of control test compound.
-
a.
Generate kinase target engagement dendrogram illustrations
-
3.
Navigate to http://www.kinhub.org/kinmap/
-
4.
Click on the “text” tab.
-
5.
Enter in the kinase names (either in columns or linearly separated by commas) you would like represented on the dendrogram using the required syntax.
Note, entering simple kinase names (protein or gene) will be represented in the default annotation (small red circle). Follow the instructions in the “help” subtab, considering the example code provided in the “examples” subtab to use directives to change the symbol annotation if desired.
-
6.
Click the “plot” button to annotate the dendrogram.
-
7.
Download your dendrogram image by clicking the “download” button.
Expected outcomes
Experimental outcome is impacted by a number of variables, which are intrinsic to both the NanoBRET(TM) system, and the test compound of interest. Consult this section of Observed Outcomes when evaluating assay performance across this panel of 192 kinases. A range of variation in BRET signals should be expected, due to variables in BRET efficiency from target to target. Table 1 summarizes the average BRET signal increase observed for each kinase in the presence of tracer K10 alone (absence of test compound). Fractional occupancies are reported for control compounds crizotinib (at 1 μM; Figure 1) and pan-kinase inhibitor CC1 (at 300 nM; Figure 2). For first time users, it may be valuable to compare assay results to this table to ensure accurate experimental setup and BRET detection.
Figure 1.

Results of live cell kinase profiling using control compound crizotinib at 1000 nM. Each dot represents a kinase occupied > 50% by the control compound
Results are the mean of three independent experiments (n = 3) and summarized in Table 1. Illustrations were reproduced courtesy of Cell Signaling Technologies, Inc.
Figure 2.

Results of live cell kinase profiling using control compound CC1 at 300 nM. Each dot represents a kinase occupied > 50% by the control compound
Results are the mean of three independent experiments (n = 3) and summarized in Table 1. Illustrations were reproduced courtesy of Cell Signaling Technologies, Inc.
Limitations
The NanoBRET(TM) method may not be capable of detecting all modes of target engagement. For example, allosteric inhibitors that bind via a mechanism that is non-competitive with the ATP-site tracer may result in undetectable occupancy, thus representing false negatives. It is critical to recognize therefore, that complementary methods may be required to deconvolute some assay results that fail to correlate with those observed using alternate phenotypic or pathway analysis methods.
Troubleshooting
Problem 1
Weak expression levels (450 nm RLU < 1000 fold above reagent background) (step 14).
Potential solution
Weak expression observed in step 14 may be a result of:
Cell status at time of transfection. Ensure that the cells were passaged one day prior to transfection, and that the cell confluency was appropriate (70–90%).
Inaccurate DNA stock solution preparation. Ensure the integrity and concentration of the DNA using standard fluorometric assays. Ensure that the DNA solution did not evaporate during storage. If evaporation occurred, consider adjusting the [DNA] accordingly.
Inaccurate transfection complex preparation. Rely on the transfection control samples to ensure that each experiment results in appropriate transfection levels prior to executing the full kinome profiling experiment. This can save reagent when aberrant transfections occur.
Problem 2
Noisy BRET S/B, generating coefficient of variations (CV)s > 20% (steps 24 and 25)
Potential solution
Noisy BRET data observed in step 24 or 25 may be a result of:
Weak expression levels. Ensure that the donor (450 nm channel) RLUs for each kinase are > 1e3 above background (reagent only) control wells
Inconsistent dispensing of tracer. Ensure that liquid handlers are accurately delivering the tracer to each well.
Problem 3
Negative % occupancy of test compound (step 25).
Potential solution
Negative fractional occupancy of test compound may be a result of:
Inaccurate dispensing of tracer for DMSO samples (100% BRET, or 0 % fractional occupancy controls). Ensure liquid handling is accurately dispensing the NanoBRET(TM) tracer
Auto-fluorescent or light scattering properties of the test compound. Optical effects may increase the BRET value. This is often determined by using an irrelevant BRET control assay. If the compound has the same effect on an irrelevant BRET assay, this is likely a spurious optical effect.
Although rare, global / nonspecific impacts on kinase activation state may be observed. Non-specific kinase inhibitors may indirectly impact the target of interest, thus increasing the activation state of the kinase. In some cases, increasing the kinase activation state may increase the apparent affinity of the NanoBRET(TM) tracer leading to a non-specific increase in BRET. It may be possible to run specific NanoBRET(TM) kinase assays in digitonin-treated cells to determine if this increase in BRET is due to such non-specific pathway influences as described in earlier studies(Robers et al., 2020; Vasta et al., 2018).
Problem 4
Unexpectedly low % target occupancy of a test compound (step 25).
Potential solution
Unexpectedly low % occupancy may be a result of:
Inaccurate dispensing of test compound. Ensure liquid handling is accurately dispensing the compound
Poor compound solubility. Ensure that the compound is soluble as a 10× solution.
Discordance between a cell-free and live cell target engagement assay. If comparing NanoBRET(TM) to a cell-free assessment of target occupancy, consider the impact of permeability or [ATP], which may interfere with target engagement. The composite effect of these variables may shift the occupancy results in a live cell vs an acellular system. Follow up experiments in digitonin-treated cells may be warranted to address the impact of [ATP] or permeability as described in earlier studies (Robers et al., 2020; Vasta et al., 2018).
Problem 5
Unexpectedly high % target occupancy of a test compound (step 25).
Potential solution
Unexpectedly high % occupancy may be a result of:
Inaccurate dispensing of test compound. Ensure liquid handling is accurately dispensing the compound
Discordance between a cell-free and live cell target engagement assay. If comparing NanoBRET(TM) to a cell-free assessment of target occupancy, consider the impact of target activation state. If the compound preferentially engages an active or inactive kinase state, this may impact intracellular engagement to an unpredictable extent.
Resource availability
Lead contact
Further information and requests for resources and reagents should be directed to and will be fulfilled by the lead contact, Matthew Robers (Matt.robers@promega.com).
Materials availability
The NanoBRET tracer and kinase/Nluc fusion plasmids are each available from Promega. https://www.promega.com/products/cell-signaling/kinase-target-engagement/nanobret-te-intracellular-kinase-assay/?catNum=N2521
Acknowledgments
Authors would like to acknowledge Ngan Lam and Kaitlin Dunn for their ongoing support in validating the assay and providing constructive feedback on its performance.
Author contributions
M.B.R., J.D.V., J.M.W., B.-T.B., and L.M.B. each contributed to the design and validation of the profiling assay. M.B.R. and S.K. supervised the project and developed the critical goals and metrics for the successful outcome.
Declaration of interests
B.-T.B., L.M.B., and S.K. are grateful for support by the Structural Genomics Consortium, a registered charity (no: 1097737) that receives funds from Bayer AG, Boehringer Ingelheim, Bristol Myers Squibb, Genentech, Genome Canada through Ontario Genomics Institute [OGI-196], EU/EFPIA/OICR/McGill/KTH/Diamond Innovative Medicines Initiative 2 Joint Undertaking [EUbOPEN grant 875510], Janssen, Merck KGaA (aka EMD in Canada and US), Pfizer and Takeda. B.-T.B. is grateful for support by the DFG network grant SFB-1399.
M.B.R., J.M.W., and J.D.V. are employees of Promega. Promega owns patents related to NanoLuc(R) and NanoBRET(TM).
Data and code availability
The published article includes all data sets generated or analyzed during this study.
References
- Robers M.B., Friedman-Ohana R., Huber K.V.M., Kilpatrick L., Vasta J.D., Berger B.T., Chaudhry C., Hill S., Muller S., Knapp S. Quantifying target occupancy of small molecules within living cells. Annu. Rev. Biochem. 2020;89:557–581. doi: 10.1146/annurev-biochem-011420-092302. [DOI] [PubMed] [Google Scholar]
- Vasta J.D., Corona C.R., Wilkinson J., Zimprich C.A., Hartnett J.R., Ingold M.R., Zimmerman K., Machleidt T., Kirkland T.A., Huwiler K.G. Quantitative, wide-spectrum kinase profiling in live cells for assessing the effect of cellular ATP on target engagement. Cell Chem. Biol. 2018;25:206–214 e11. doi: 10.1016/j.chembiol.2017.10.010. [DOI] [PMC free article] [PubMed] [Google Scholar]
Associated Data
This section collects any data citations, data availability statements, or supplementary materials included in this article.
Data Availability Statement
The published article includes all data sets generated or analyzed during this study.