MEDICAL SCIENCES Correction for “Stromal-derived interleukin 6 drives epithelial-to-mesenchymal transition and therapy resistance in esophageal adenocarcinoma,” by Eva A. Ebbing, Amber P. van der Zalm, Anne Steins, Aafke Creemers, Simone Hermsen, Rosa Rentenaar, Michelle Klein, Cynthia Waasdorp, Gerrit K. J. Hooijer, Sybren L. Meijer, Kausilia K. Krishnadath, Cornelis J. A. Punt, Mark I. van Berge Henegouwen, Suzanne S. Gisbertz, Otto M. van Delden, Maarten C. C. M. Hulshof, Jan Paul Medema, Hanneke W. M. van Laarhoven, and Maarten F. Bijlsma, which was first published January 22, 2019; 10.1073/pnas.1820459116 (Proc. Natl. Acad. Sci. U.S.A. 116, 2237–2242).
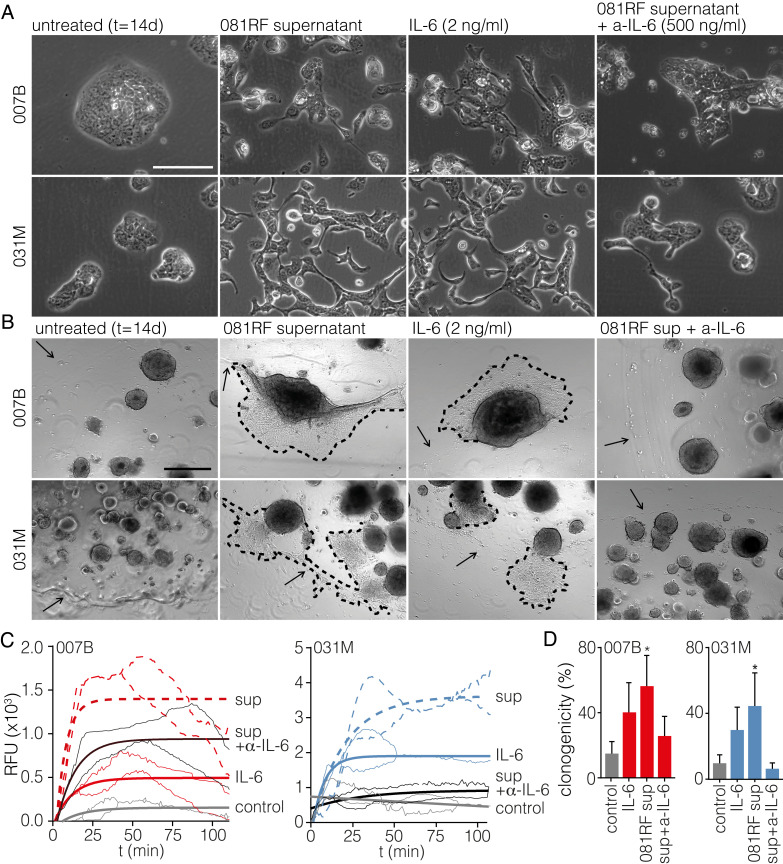
The authors note that Fig. 3 appeared incorrectly. “The authors would like to note that in Fig. 3B, the untreated (control) 031M organoids and those of the 081RF sup + a-IL-6 condition showed duplicate images at different exposures.” The corrected figure and its legend appear below. The online version has been corrected.
Fig. 3.
CAF-secreted IL-6 induces epithelial-to-mesenchymal transition. (A) The 007B and 031M cultures were exposed to the following conditions for 14 d: unconditioned medium (untreated), 081RF supernatant (1 in 4 diluted), recombinant IL-6, and 081RF + IL-6–neutralizing antibody. Morphology was assessed by phase-contrast microscopy. (Scale bar: 200 μm.) (B) As for A using 007B and 031M organoid cultures. Dashed lines indicate the migratory front of cells migrating out of the organoid. Arrows indicate the edge of the Matrigel cushion. (C) Transwell migration assays on 007B and 031M cells cultured for 14 d in the conditions as for A before the assay. In the transwell assays, 1% FCS was used as a chemoattractant. Migration shown is corrected for no-attractant controls (medium without FCS), n = 3. P values were determined by two-way ANOVA and Tukey’s multiple comparisons correction, one-phase exponential curves were fitted, and the lines of matching color indicate the SD. (D) Limiting dilution assays were performed using 007B and 031M cells after incubation for 14 d in the indicated conditions. Cells were sorted into 96-well plates. Bar graphs show means ± SEM, n = 3. *P < 0.05, **P < 0.01, ***P < 0.001, and ****P < 0.0001. Significance was tested by two-sided unpaired t tests compared with the control.


