Graphical abstract
Throughout 2020 and beyond, the entire world has observed a continuous increase in the infectious spread of the novel coronavirus (SARS-CoV-2) otherwise known as COVID-19. The high transmission of this airborne virus has raised countless concerns regarding safety measures employed in the working conditions for medical professionals. Specifically, those who perform treatment procedures on patients which intrinsically create mists of fine airborne droplets, i.e., perfect vectors for this and other viruses to spread. The present study focuses on understanding the splatter produced due to a common dentistry technique to remove plaque buildup on teeth. This technique uses a high-speed dentistry instrument, e.g., a Cavitron ultrasonic scaler, to scrape along the surface of a patient’s teeth. This detailed understanding of the velocity and the trajectory of the droplets generated by the splatter will aid in the development of hygiene mechanisms to guarantee the safety of those performing these procedures and people in clinics or hospitals. Optical flow tracking velocimetry (OFTV) method was employed to obtain droplet velocity and trajectory in a two-dimensional plane. Multiple data collection planes were taken in different orientations around a model of adult mandibular teeth. This technique provided pseudo-three-dimensional velocity information for the droplets within the splatter developed from this high-speed dental instrument. These results indicated that within the three-dimensional splatter produced there were high velocities (1–2 m/s) observed directly below the intersection point between the front teeth and the scaler. The splatter formed a cone-shape structure that propagated 10–15 mm away from the location of the scaler tip. From the droplet trajectories, it was observed that high velocity isolated droplets propagate away from the bulk of the splatter. It is these droplets which are concerning for health safety to those performing the medical procedures. Using a shadowgraphy technique, we further characterize the individual droplets’ size and their individual velocity. We then compare these results to previously published distributions. The obtained data can be used as a first step to further examine flow and transport of droplets in clinics/dental offices.
Introduction
The worldwide emergence of the novel COVID-19 virus has required healthcare professionals to review existing safety protocols and rapidly implement prescriptive adjustments to address numerous concerns in different areas. One of the most high-risk areas of infection is within dental practices. This risk is due to the fact that high-speed dental instruments have the capacity to produce and liberally expel bio-aerosols (Harrel and Molinari 2004). As dentists return to the ‘new’ normal, dental practices are rolling out new protocols to mitigate the risk of COVID-19 transmission. To design appropriate safety tools, it is crucial to understand: (1) the size of the droplets created as a result of dental procedures, and 2) the resident times and the travel distances of these droplets. These are important in order to determine the viral load captures and also to develop cleaning and social distancing measures as μ previous literature has showed that droplets diameters can range between 3–100 μm (Coulthard 2020; Mirbod et al. 2021) .
One of the primary sources of these potentially virally loaded droplets in a dental practice, originates from the use of high-speed dental instruments. As a by-product of the dental scaling procedures: the largest splattered droplets contain particles with diameters in the range of 50–100 μm, occurring up to 15–120 cm from the patient's oral cavity, and the aerosols created are comprised of < 50 μm in diameter (Raghunath et al. 2016). Furthermore, additional studies related to teeth drilling and grinding procedures have been shown to contain ultrafine particles with diameters in the 20–80 nm (Liu et al. 2019). Review studies and guidelines have been issued by the World Health Organization (WHO), Centers for Disease Control and Prevention (CDC), and European Centre for Disease Prevention and Control (ECDC), suggesting droplets can travel more than 2–8 m so that unmasked individuals should stay that far apart for their own safety. Bahl et al. (2020a, b) and Poulain and Bourouiba (2019) have shown the rationale behind the WHO and CDC decision relates to larger droplets evaporate leaving airborne pathogens and smaller droplets that can travel longer distances and spread contaminants further.
Recent physical mitigations suggested by Majidi and Club (2020) and Liu et al. (2019) show that the risk is reduced by protecting dental clinicians via droplet redirection and capture. Rajeev et al. (2020) and Yadav et al. (2015) show the benefits of methods based on ozonization, ionization, and use of air sterilization. Jeswin and Jam (2012) also showed simplistic methods such as disinfecting the patient's mouth, the use of a rubber dam, eye protection, face masks, aspiration, and ventilation can all reduce the risk of transmission. However, to create more effective preventative strategies, we must have a full understanding of the splatter droplet size distributions as well as their potential travel and residence time. Relatable previous studies managed to experimentally determine both the volume and particle size distribution generated from human expulsions such as coughing and speaking (Bahl et al. 2020a,b; Beggs 2020; Gralton et al. 2011; Scharfman et al. 2016). They have shown that particle sizes can range between 0.01 μm and 500 μm. Using both the experimental and theoretical works, these studies have also shown that particles of less than 50 µm diameter can remain suspended in the cloud long enough for the cough to reach heights where ventilation systems can be contaminated (Bourouiba et al. 2014). Other similar studies have focused more on the ejection velocities of these particles using Euclidean-based particle image velocimetry (PIV), the Lagrangian-based particle tracking velocimetry (PTV) or flow visualization techniques such as shadowgraphy (Cao et al. 2014; Chao et al. 2009; Mahajan et al. 1994; Tang et al. 2012, 2013; VanSciver et al. 2011; Xie et al. 2009; Zhu et al. 2006).
To the best of the authors’ knowledge, while we currently have a good understanding of the droplet size distributions created by dental procedures, there is a lack of understanding of their kinematics. In this study, we use the quasi-Euclidean-Lagrangian method of optical flow tracking velocimetry (OFTV) to understand the kinematics of the droplet motion. We further analyze the droplets’ sizes and velocities for and compare these results for two different flow rates at which a Cavitron dental scaler operates using a shadowgraphy technique. The outcomes of the presented research have the potential to refine the flow characteristics of a simulated flow, more accurately model the spray patterns and to propose methods to control the direction of flow to minimize the possible contaminations.
Experimental procedure
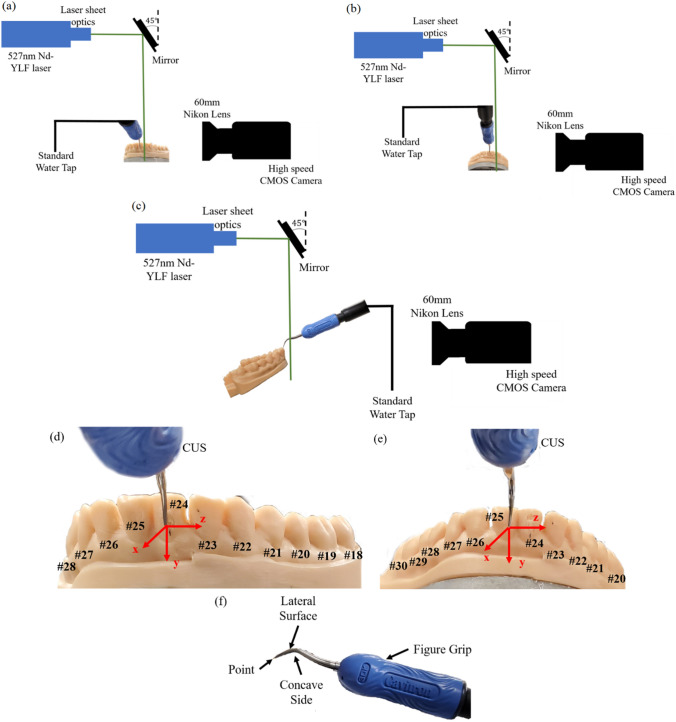
We focus our study on the Cavitron ultrasonic scaler (CUS) and simulate an adult mouth using a resin model of a mandibular set of teeth. To replicate a real-world scenario, we orient the scaler at two different angles in reference to the surface of the teeth. The first orientation analyses the case where the point (tip) of the scaler of the CUS is being flushed against the surface of a tooth while the teeth model was at a 0˚ angle from the x-axis; therefore, the scaler point is 90 ° from the x-axis. This situation would mimic the procedure where the point of the scaler is used to scrape against the surface/gum-line of a tooth. This experimental setup is denoted as “Case 1”, and a schematic of the experiment is shown in Fig. 1(a). The second orientation simulates a more typical situation used in dental practice with a patient sitting in a reclined position. For this purpose, the teeth model was positioned at a 45 ° angle to the x-axis and the point of the scaler was rotated 5 ° from its previous position in reference to the teeth model. This configuration would then mimic when lateral surface of the scaler is used to scrape the front of the tooth. This CUS/teeth orientation is used in the cases denoted as “Case 2” and “Case 3”. A schematic of both experiments is shown in Fig. 1(b, c).
Fig. 1.
The experimental schematics for the three different experimental orientations. a Case 1: The teeth are 0 ° and the point of the CUS is 90 ° from the x-axis, respectively. b, c Case 2 and 3: The teeth are rotated to be 45 ° from the x-axis. The point of the CUS is rotated so that it is 5˚ in reference to the front of the teeth. b The configuration with a P1 data collection plane and c shows the P2 data collection plane. d, e Diagrams of the lower mandible teeth with the appropriate teeth numbers (black) and the coordinate system in reference to the scaler tip and the front of the central incisor teeth (red). The tip of the CUS rests firmly against the d front of tooth #24 in Case 1, and e tooth #25 for Cases 2 and 3. f An image of the scaler tip being used with the CUS for this study experiments. The water jet is located within the concave side of the CUS tip
As per typical patient usage, a specific tip was chosen for the scaler Powerline finger grip (30 K FSI-PWR -1000) (Dentsply Sirona) with a tip diameter of 479.1 μm, which vibrates at a frequency of 25–30 kHz. The scaler is connected to a standard water tap with a pressure in range of 20–40 psi from which the flow rate was measured by a standard flow measuring gauge. The average flow rate for the scaler in all cases examined through OFVT has been measured to be around 31.5 ml/min. The dimensionless parameters for this experiment are reported in Table 1. The Reynolds number, Re, defined as where is the density of the fluid and is the viscosity of the fluid. Here, is the velocity of the fluid as it leaves the point of the scaler. The gaseous Weber number, WeG, describes the interaction between the fluid and the air at the surface of the droplets which predicts the nature of the spray breakup (Lubarsky et al. 2010), can be defined as where is the surface tension of the fluid (Zigan et al. 2012). Herein, the calculated WeG is less than 0.1 meaning that the liquid jet is in the region of column breakup since the transition from column to bag breakup for a Newtonian liquid jet in a crossflow occurs for gaseous WeG of 4 (Scharfman et al. 2016). The corresponding Ohnesorge number also defined as (Scharfman et al. 2016). The working fluid in the experiments was water at room temperature 20 °C; therefore, the fluid constants are , , and .
Table 1.
The experimental parameters for different tests conducted at 20 °C
| Flow rate (ml/min) |
(cm/s) |
|||
|---|---|---|---|---|
| 31.5 | 291.3 | 1390.8 | 0.0670 | 1.86 × 10⁻⁴ |
These dimensionless parameters remained constant throughout all experiments
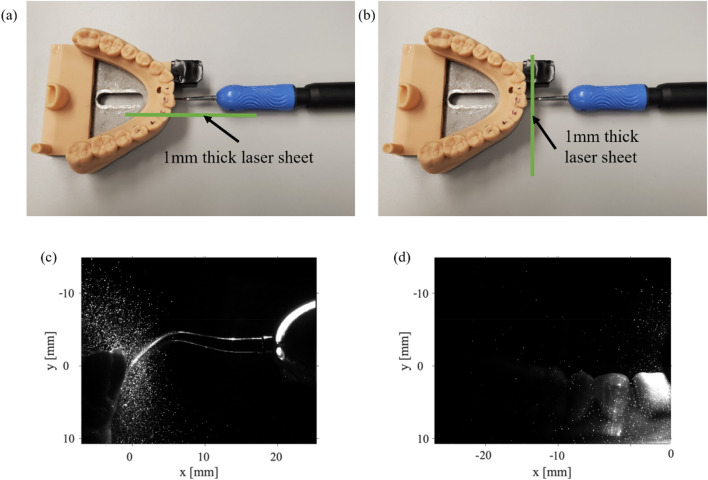
In order to interrogate the kinematic behavior of the spray created by the scaler, we use a thin light sheet (generated by a 527 nm Nd-YLF laser laser) to illuminate a single plane of droplets within the spray and capture images using a CMOS high-speed camera (Phantom) with a 60 mm focal-length lens. Not only does this allows us to take a detailed view of the droplets and splatter propagation, i.e., to investigate the particle size, it also allows us to track individual spray particles. In this study, we use multiple planes to gather an understanding of the measurements in the near and far field away from the scaler. There were three different experimental setups examined, each one has a different plane/teeth orientation with two data collection planes. Cases 1 and 2 shown in Fig. 1(a, b) have the teeth positioned at two different angles but have the same laser plane orientation. For these cases, the laser plane is positioned parallel to the tip of the CUS, and we denote this plane as P1. This creates an x–y 2D plane according to the coordinate axis in Fig. 1(a, b), and for these cases, and components of velocity are measured. We then moved the P1 plane in the + z direction to obtain multiple parallel data collection planes moving away from the location where the CUS tip is placed on the tooth. In the third case, Case 3 shown in Fig. 1(c), the teeth orientation is the same as Case 2, but the laser plane is rotated 90 ° so that the plane is perpendicular to the CUS tip. This provides a y–z 2D plane, denoted as P2, shown by the coordinate axis in Fig. 1(c). For the P2 plane, the and components of velocity are measured. Similar to the P1 plane, multiple P2 planes are taken in the + x direction moving away from the front surface of the teeth model. There are also two different data collection planes depending on how the laser sheet is oriented. We have denoted a P1 plane which has the laser sheet positioned perpendicular to the front of the tooth and the laser sheet is parallel to the CUS tip that provides an x–y 2D plane. This is used in Cases 1 and 2 shown in Fig. 1(a, b). For the last case, Case 3 (Fig. 1(c)), the laser sheet is rotated so that it is parallel to the front of the tooth surface and perpendicular to the CUS tip creating a 2D y–z plane, and this is denoted as the P2 plane. For each experimental case, multiple P1 or P2 planes were taken at varying distances from the tip of scaler or the front of the teeth, respectively.
Figure 1(d, e) represents the diagrams of the front adult mandibular teeth including the tooth numbers and the coordinate system used in this study where Fig. 1(f) shows the scaler used with the CUS. As described, the lateral surface of the CUS rests firmly on the front teeth shown in Fig. 1(d, e). The zero-coordinate system is located at the tip of the CUS. Figure 2(a, b) shows the Cavitron ultrasonic scaler (CUS) and its location in reference to the resin teeth. The lateral surface of the scaler is placed against the surface of either the lower left central incisor tooth (#24) for Case 1 or the lower right central incisor tooth (#25) for Cases 2 and 3 where the point (tip) of the scalar is located in the direction of the gum line. Figure 2(c, d) shows raw images collected from P1 and P2, respectively. To characterize the kinematics of the individual particles, we use the OFTV tracking technique.
Fig. 2.
A top-down view of the Cavitron and the teeth to show the locations of the 1 mm thick laser sheet for the two data collection planes. a The data collection plane, which was parallel to the Cavitron tip, P1 and b the data collection plane that was perpendicular to the Cavitron tip, P2. Raw OFTV images obtained from both of the laser plane locations, c P1 and the d P2 with the CUS and teeth at 0 °
Optical flow tracking velocimetry (OFTV)
To analyze the kinematics of individual droplets within the splatter produced by the scaler, we use OFTV techniques. This specific technique has been commonly used in multiple fluid mechanics applications (Fullmer et al. 2020; Lucas and Kanade 1981, 1985; Mella et al. 2019; Settles 2012). For each case presented here, we use 3000 images, resolving more than 100 integral time scales.
The OFTV analysis method for calculating the droplet tracks is based on solving sets of linear equations (i.e., the optical flow equations). The two main steps in this approach are first identifying the droplets to track and then tracking them across frames. We used the commercially available code known as Flow On The Go software which uses eigen features to determine the “features” in each frame from the image gradients which highlights the locations of the droplets. The eigen features are then determined by constructing a correlation matrix defined as
| 1 |
where is the pixel intensity and and are the intensity gradients in the x- and y-directions, respectively. A smoothing field utilizing a Gaussian kernel of five pixels wide is applied to the raw images. The intensity gradients are then extracted from those pre-processed images. The correlation matrix, is then computed, and a response value, , is calculated from the minimum eigenvalue of that matrix, .
| 2 |
where
| 3 |
Within the Flow On The Go software, values are defined as regions with R > 0.01. An assumption that the physical displacements of the droplets between the frames are sufficiently small such that can be expressed as
| 4 |
Following a Taylor series expansion, the above equation can then be rearranged to give the optical flow equation as
| 5 |
where is the partial derivative of the pixel intensity with respect to time between image pairs and and are the velocities in the x- and y-directions, respectively.
The resulting optical flow equation is left with two unknowns, and . Solving for these unknowns poses various difficulties. We used a solution method known as the Lucas-Kanade solution method (Lucas and Kanade 1981, 1985) to solve the optical flow equations within the FlowOnTheGo software. The Lucas-Kanade approach assumes that the velocity in one area is the same as that in its neighboring regions making the velocity gradients small. This allows the optical flow equations to be considered at each feature as
| 6 |
where i and j define the neighborhood around the feature at pixel x, y. When applied to the droplets within the splatter of the scaler, we used a neighborhood of 11, i.e., i and j ranged from -5 to + 5. This setting allowed us to solve the equation using a least square method and determine and by
| 7 |
From this equation, the and values can be defined, which are then used to create Lagrangian streamlines. A gridded interpolator approach is used to create both a velocity field and a scale within the field based on a calibration plate (Higham and Brevis 2019), any outliers are removed using the PODDEM algorithm (Higham et al. 2016).
Results
Case 1: Plane, P1, cavitron at 0 °
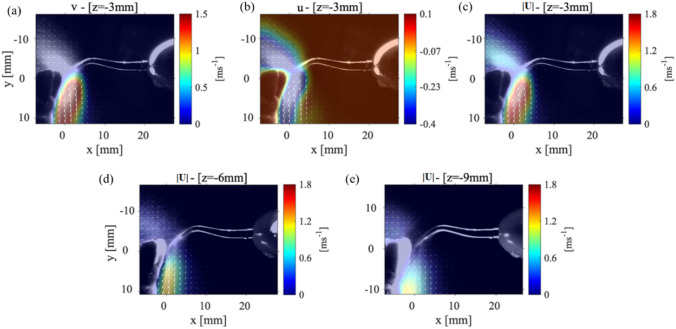
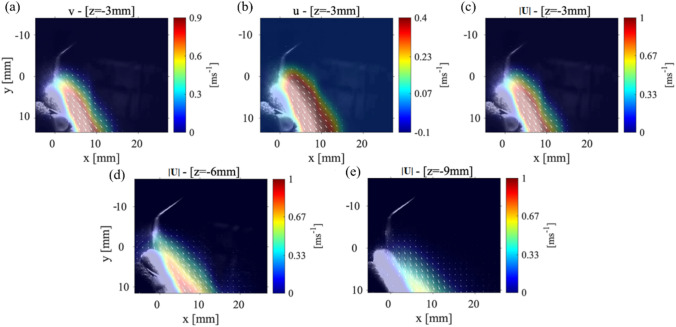
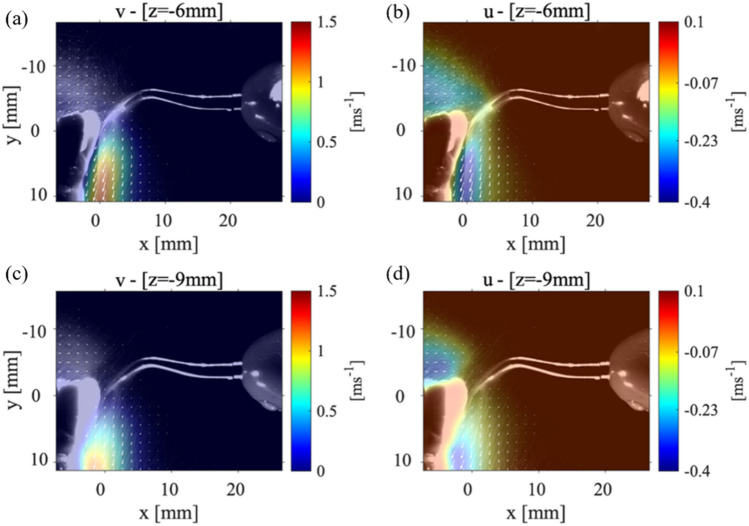
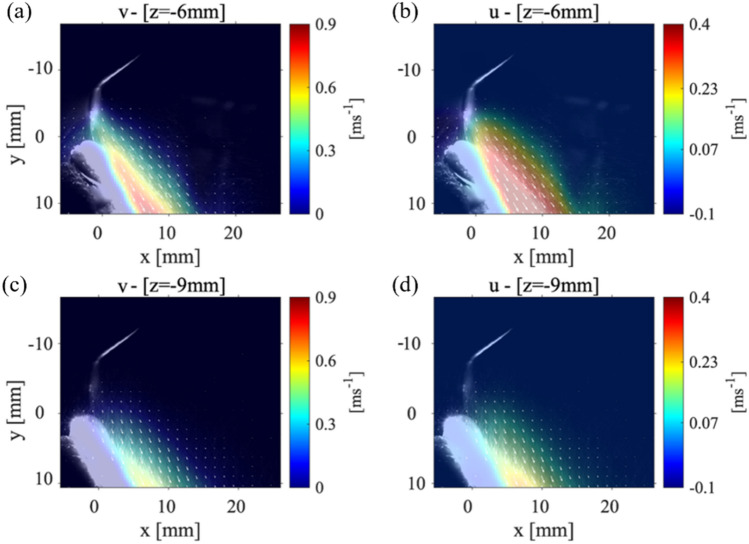
As mentioned before, the first case analyzed the condition where the mandibular teeth placed with an angle to the horizontal axis, and the scaler placed against the lower central tooth (tooth#24). Figure 3(a–c) shows the (y-direction) and the (x-direction) components of the velocity and the velocity magnitude, for the P1 data collection plane positioned 3 mm away from where the CUS is positioned against the front tooth. Figure 3(d, e) shows the magnitude of velocity in the P1 plane located 6 mm and 9 mm from the location of the CUS tip positioned against the front of the tooth. The general shape of the splatter is reminiscent of a cone shape where part of the splatter moves over the teeth and the other part moves down the front of the teeth surface. The component of velocity shows a maximum value of around 1.5 m/s, and the component is almost zero resulting in the velocity vector magnitude of 1.8 m/s. These results show that while the maximum velocity occurs near the scaler’s tip, as the droplets move away, not only their speed reduces, but also they evaporate due the humidity and temperature variations in the environment. At a location 6 mm from the point of the scaler, the velocity magnitude of the droplets then decreases to 1.2 m/s. Moving the data collection plane further away from the scaler (i.e., 9 mm), the magnitude of the velocity of the droplets reduces to 0.6 m/s. We also noticed that at this location, the velocity within the core of the splatter in front of the teeth surface decreases. However, the overall width of the splatter does not change in the 9 mm plane compared to the 3 mm plane. For more clarification, the and components of velocity contours for the P1 planes at 6 mm and 9 mm are shown in Appendix Fig. 10. Note that Ou et al. (2021) studied the splatter produced from an ultrasonic scaler using a similar technique to that presented in this study; however, their data was collected within a P1 parallel plane corresponding to our cases 1 and 2, only. They utilized an approach called laser sheet imaging (LSI) to capture the far field splatter in a 14 cm × 14 cm field of view. They also used an ultrasonic scaler in conjunction with different evacuation methods (Ou et al. 2021) where they found the majority of the splatter produced from a scaling procedure on tooth #25 or #24 was less than 2 m/s (Ou et al. 2021).
Fig. 3.
The velocity measurements for Case 1: P1 plane with the teeth model and scaler point at an 0 ° and 90 ° angle, respectively. a The (y-direction) component of velocity, b the (x-direction) component of velocity, and c the magnitude of the velocity vector with the laser sheet 3 mm away from the point of the CUS. The velocity magnitude for a P1 plane positions d 6 mm and e 9 mm away from the tip of the CUS
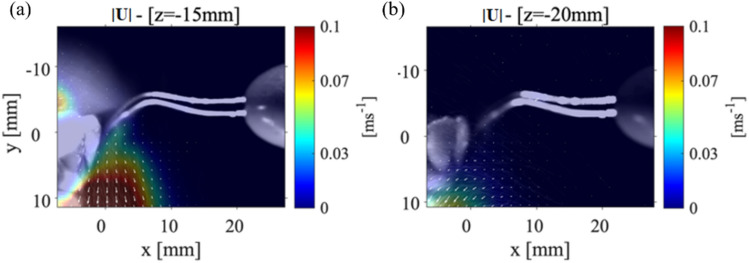
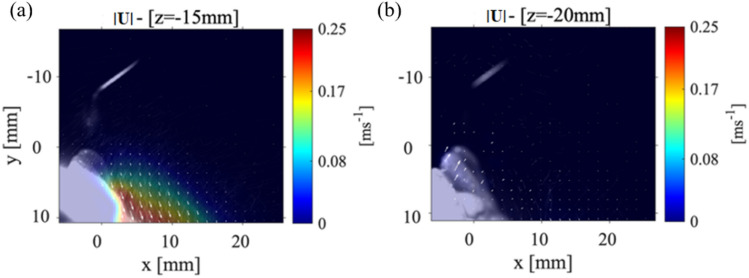
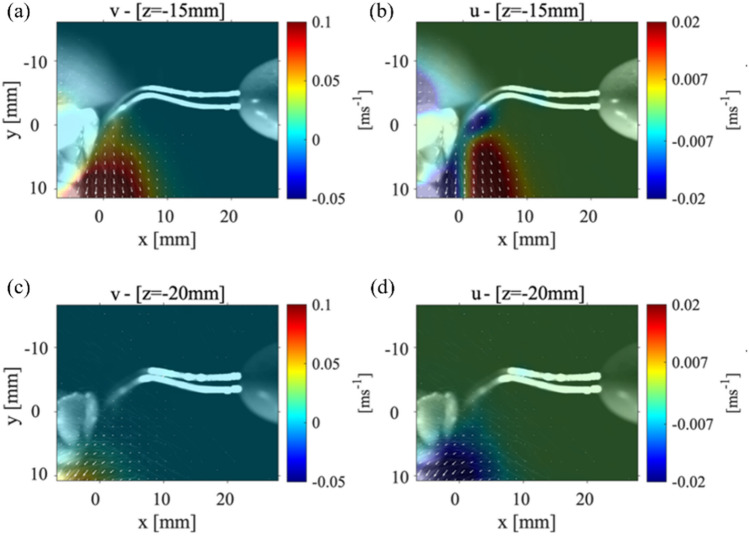
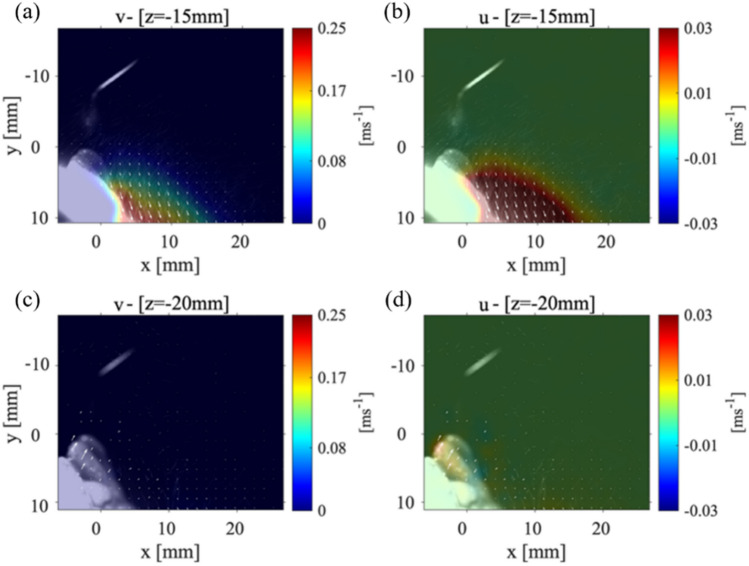
Figure 4 shows the velocity magnitude distribution for the P1 data collection plane taken at 15 mm (Fig. 4(a)) and at 20 mm (Fig. 4(b)) from the scaler tip. The maximum magnitude of velocity for P1 plane that was positioned 15 mm from the scaler point is 0.1 m/s and within the collection plane 20 mm away from the point is 0.05 m/s as shown in Fig. 4(a) and Fig. 4(b), respectively. There is then a 97.2% decrease in the velocity magnitude from the closest P1 plane at 3 mm to the farthest from the P1 plane at 20 mm from the scaler. Even though the velocity is reduced, spray cone increases from around 10 mm to approximately 15 mm meaning that as the droplets move away from the teeth, they spread out, evaporate, and decrease in size. In Fig. 4(a), the velocity vectors (indicated by the white arrows that are over 4 mm away from the surface of the teeth) begin to deflect and point away from the surface of the teeth. This is different from what was observed in the P1 data collection planes positioned closer to the point as shown in Fig. 3. In Fig. 4(b); however, the velocity vectors are rotated to a point perpendicular toward the surface of the teeth. These results lead to the possibility that there are certain regions where the droplets are moving in opposite directions indicating a chaotic motion within the splatter cone. It should be noted that both and components of velocity are reduced compared to Fig. 3 as shown in Appendix Fig. 10(a, b). Recently, Han et al. (2021) used fluorescent dye to color the liquid to illuminate the splatter generated by an ultrasonic scaler, triplex syringe, high-speed handpiece, and low-speed handpiece within a laser sheet. Although they did not plot the velocity propagation unlike our work, they showed the splatter formation at various locations around the procedure location. Also, the splatter formation by ultrasonic scaler used was 40 ml/min slightly higher than what is used in the current study, but it still showed the chaotic droplet splatter at various locations around the procedure site. They illuminated various planes with different orientations to the scaler around the mock patient’s mouth. Very recently, Li et al. (2021) used PIV to examine the flow field surrounding a patient during an ultrasonic scaler procedure within a plane that is parallel to the scaler’s tip similar to our cases 1 and 2. They also used a flow rate that was higher than the one used in this study (i.e., 50 ml/min). They measured splatter velocities between 0.01 m/s up to 6.39 m/s which is substantially higher than what was measured in the current study. It is believed this was due to the higher flow rates they used in their experiments.
Fig. 4.
Case 1: The far field velocity magnitudes for the P1 plane at a location a 15 mm and b 20 mm from the tip of the CUS
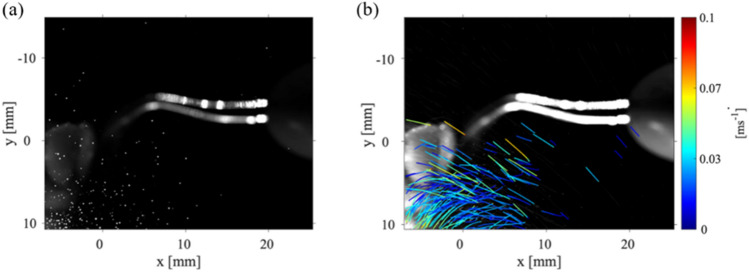
The locations of the droplets within the plane located 20 mm from the point of the scaler can be seen in Fig. 5(a). These droplets are likely candidates for carrying viral loads. Figure 5(b) demonstrates there are multiple droplets within the P1 data collection planes that are not following the average motion of the droplets near the gumline of the teeth model. These droplets near the gumline of the teeth model show very low velocities in comparison to those droplets that are further away from the gumline. The dark blue color corresponds to droplets with very small velocity. There are droplets further away from the teeth with higher velocities which are able to move out and away from the mouth. It should be noted that Fig. 5(b) shows a limited number of droplets with high velocity trajectories since this figure represents the trajectories of only 20% of the detected droplets. This reduction in displayed trajectories was performed to clarify the figure so individual trajectories could be easily tracked and observed. It is then safe to assume there are more high velocity droplets propagating away from the teeth, within a plane that is 20 mm from the CUS point. These droplets will eventually evaporate and seed the atmosphere with viral particles. Clearly, as the droplets move away from the mouth, the particles trajectories are dictated by ambient air flows.
Fig. 5.
a The droplet locations at one instant in time for Case 1, P1 plane with the scaler at 0˚ angle, with the laser sheet 20 mm from the point of the Cavitron. b The particle trajectories for 20% of droplets identified at the same laser sheet location. The color bars correspond to the velocity magnitude of the detected individual droplets
To further characterize the droplets’ sizes and velocities and to gain knowledge of how the droplets propagate into the environment, we applied a shadowgraphy technique combined with a Eigenbased particle characterization method (Higham et al. 2019), with the scaler/teeth setup of the Case 1, P1 plane orientation with the CUS at 0° from the x-axis. We considered the flow rate reported in (Mirbod et al. 2021) (29.5 ml/min), which is close to the flow rate used in this study’s OFTV experiments, and compare these results to a lower flow rate of 16.2 ml/min obtained through the shadowgraphy experiments. There were two different flow control mechanisms on the CUS, and these were manipulated to achieve the different flow rates. This flow rate was closer to what is typically used in dental practice in conjunction with a CUS. The shadowgraphy procedure has been discussed in detail in our previous publications (Haffner and Mirbod 2020; Mirbod et al. 2021; Wu and Mirbod 2018). Using the shadowgraphy technique, we obtained the raw images. We then used an in-house detection code to determine the size and location of each droplet. The code operates by first binarizing the raw image that is based on an adaptive threshold. Using an adaptive Hough transform (Illingworth and Kittler 1987), we then determine circular regions, i.e., droplets and define the velocities of the droplets using OFTV method. However, instead of using the eigenfeatures for droplet detection, we employ the centroids determined by the Hough transform.
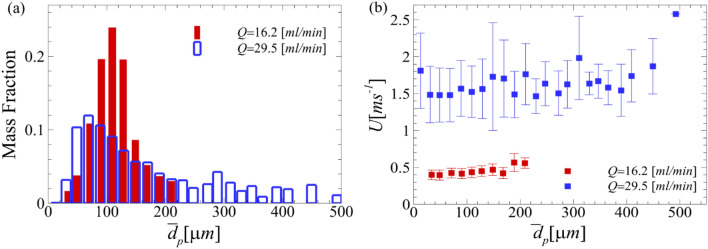
Figure 6(a, b) shows the mass fraction of the detected droplets and the corresponding velocities at the start of the scaler for these two flow rates. The dimensionless parameters for 16.2 ml/min are summarized in Table 2. The equations for the Reynolds, gaseous Weber, and Ohnesorge numbers are reported in Sect. 2. We further calculated relaxation time, with the average droplet diameter, , which was calculated 70 μm for the distribution of particle sizes ranging from 23.4 μm to 254.2 μm. Here, is the density of water, and is the air viscosity. The Stokes number that describes the rate of settling for the droplets is also reported as (van der Voort et al. 2018) with minimum value of 23.4 μm and maximum value of 254.2 μm. Since the calculated Stokes number is greater than 1, the measured droplets are considered inertial, which is where they retain their initial trajectories while falling because of gravity (Fouxon 2012).
Fig. 6.
a The mass fraction distribution of the measured droplets for the 16.2 ml/min case compared to the 29.5 ml/min at the onset of the CUS. b The velocity measurements at the various droplet diameters detected for both flow rates of 16.2 ml/min and 29.5 ml/min. The error bars correspond to the standard deviation of the measured velocity for the 0.15 μs of data gathered
Table 2.
The experimental parameters for the shadowgraphy experiments conducted at 20 °C
| Flow rate (ml/min) | (cm/s) | (s) | ||||
|---|---|---|---|---|---|---|
| 16.2 | 82.3 | 539.5 | 0.0001 | 5.37 × 10⁻³ | 1.49 × 10⁻² | 50 – 543.8 |
Note that the Stokes number largely depends on the particle size, while the particle size depends on both aerosolization and evaporation. For the flow rate of 16.2 ml/min, the range of the droplet diameter detected ranged from 23.4 μm to 254.2 μm. Note that a majority of the droplets measured after the initial large droplet development are measured to be between 70.9 μm and 127.5 μm, while the maximum diameter measured at this flow rate is less than half of the maximum diameter detected for the 29.5 ml/min case, i.e., 596.7 μm. We expect that while large droplets settle along the positive y axis, the aerosols generated during this dental procedure contain significant concentrations of low Stokes number droplets that travel within the clinic/office atmosphere including the viral particles.
The mass fraction, shown in Fig. 6(a), is the ratio of the mass of the droplets detected at a specific size to the total mass of particles detected. In Fig. 6(b), it can be observed that the droplet individual velocities at the lower flow rate are much lower than those at the higher flow rate. For the flow rate of 16.2 ml/min, the smaller droplets have slightly lower velocities between 0.4 m/s and 0.46 m/s. The two largest droplet diameter ranges have an average size of 188.9 μm and 209.2 μm. These droplet diameters have higher velocities of approximately 0.56 m/s. While larger droplets might settle down quickly, moderate and small droplets can evaporate. These smaller droplets might carry infectious viruses and leave those airborne when the droplet evaporates. The resolution used in this experimental approach are the individual pixels of each image the camera is able to take; therefore, the resulting data has sub-pixel accuracy. Because of this accuracy, the relative error within the data set is less than 1%. It is worth noting that the scaler used for the shadowgraphy analysis is slightly different in shape compared to the one used in the OFTV experiments, although our analysis showed that they both produce almost the same size of droplets and operate approximately in the same manner. Very recently, Ou et al. (2021) used digital inline holography (DIH) to measure the droplet size within a splatter produced by an ultrasonic scaler positioned against different teeth. They determined that 99% of the droplets measured were in the range of 12 μm and 200 μm which is similar to our findings (Ou et al. 2021). Han et al. (2021) also positioned filter papers around mock dental procedures using ultrasonic scalers. The fluid used in their experiments contained a fluorescent tracer, so they were able to measure the size of the droplets which collected on the filter papers. These collection filter papers were placed around the procedure location ranging from 29 cm to 120 cm, and the droplets measured from the scaler were on average 1.38 μm (Han et al. 2021). These results reaffirm our observed data through the distribution of velocity moving away from the CUS and also the fact that due to the aerosolization and evaporation of large droplets, a significant concentration of droplets travels into the room atmosphere.
Case 2: Plane, P1, the teeth model located 45° from the horizontal
To better simulate the scenario that appears in dental offices, the teeth model is positioned at a angle from the axis with the incisor teeth pointed upwards and the point of the CUS has been rotated at a angle from the surface of the tooth (central incisor #25). This simulates the situation used in a typical dental office. We then analyze the P1 plane to observe how the new position of the teeth/scaler changes the splatter motion.
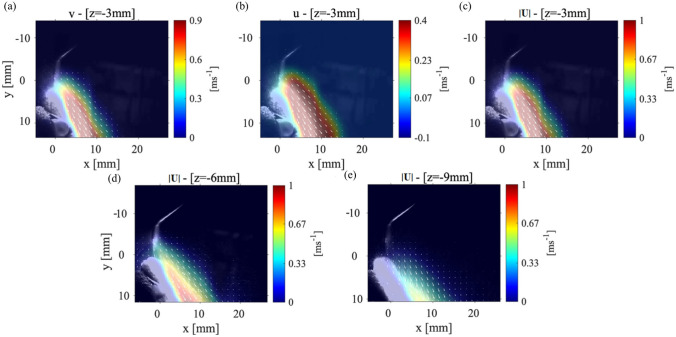
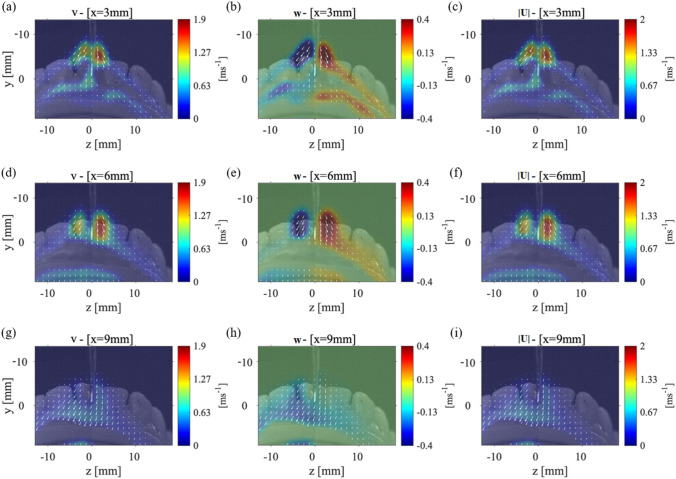
The velocity distribution within the P1 data collection plane is depicted at three different locations: 3 mm, 6 mm, and 9 mm. Figure 7(a–c) shows the average and components of the velocity along with the velocity magnitude for the data collection plane positioned 3 mm for the point of the CUS. The most notable difference in the splatter cone between this case and Case 1 (see Fig. 3) is that there was no detectable splatter over the top of the incisor teeth. This showed that the splatter formed is forced entirely down the front surface of the teeth. Figure 7(c) shows the maximum velocity magnitude was 1 m/s with a splatter spreading length of ~ 10 mm along the direction with an angle of around 45 °, and the maximum velocity is reduced from 1.8 m/s to 1 m/s without any angle. However, the length of the cone-shape formed by the splatter is still observed to be 10 mm. For all these data collection planes, the component of the velocity is always greater than the component of the velocity with a maximum value of 0.9 m/s and 0.4 m/s, respectively. Figure 7(d, e) corresponds to a P1 data plane located at 6 mm and 9 mm from the point of the scaler, respectively. These figures show the maximum velocity in the splatter formed is reduced but still contains 5 mm-long areas of the maximum velocities. Since the teeth model reflects the light from the laser sheet, it washes out part of the splatter data close to the surface of the teeth. For the P1 plane located at 9 mm from the scaler point, the maximum component of velocity is 0.6 m/s and the maximum component is 0.23 m/s, and these figures can be seen in the Appendix Fig 11. In Fig. 7(e), the splatter formed is observed to be expanding in length to 20 mm. The velocity magnitude in Fig. 7(e) is 0.33 m/s with the directions of the velocity vectors oriented parallel to the teeth surface. Also, the splatter in this view spreads out to 20 mm in the direction from the surface of the teeth; however, in this region, the velocity magnitude decays to 0.15 m/s.
Fig. 7.
The velocity measurements for Case 2: P1 plane with the teeth model at a 45 ° angle from the x-axis and the scaler 5˚ from the surface of the tooth. The a component of velocity, b the component of velocity, and c the magnitude of the velocity measured in a P1 plane that is 3 mm from the CUS tip. The velocity magnitude in a P1 plane d 6 mm and e 9 mm away from the CUS tip
To further scrutinize how the splatter moves away from the scaler, we plot the magnitude of velocities in P1 planes which are 15 mm and 20 mm from the scaler point shown in Fig. 8. The magnitude of the velocity splatter formed in Fig. 8(a) appears to be slightly less than that in Fig. 7(e), which was located about 15 mm from the front of the teeth; however, this is still longer than the splatter in Fig. 8. The velocity magnitude for the plane 20 mm away from the scaler is shown in Fig. 8(b). Previously, for all planes closer to the scaler, the velocity vectors (indicated by the white arrows) were pointed toward the teeth which were the main direction of the water droplets leaving the scaler. However, in Fig. 8(b), there is a region very close to the surface of the teeth that shows velocity vectors pointing away from the teeth surface with values of 0.05 m/s. This could be showing droplets which have been reflected from the surface of the teeth. Both and velocities are reduced below 0.25 m/s and 0.03 m/s, respectively, within the P1 plane that is 15 mm away from the scaler point shown in Appendix Fig. 13(a, b).
Fig. 8.
The far field velocity magnitudes for the P1 plane at a location a 15 mm and b 20 mm from the tip of the CUS. These maps are related to the Case 2
Case 3: Plane, P2, the teeth model 45° from the horizontal
To provide more information for the propagation of the droplets within the splatter, the data collection plane was rotated 90° to create a perpendicular plane which has not been studied extensively. The P1 data collection plane only provides information in a 2D plane parallel to the scaler point orientation. To fully visualize the splatter cone-shape, the P2 plane is also examined at an orientation as shown in Fig. 1(c). Previous literature has only shown visualization of a parallel plane or a plane at an angle in reference from the procedure location (Ou et al. 2021 and Han et al. 2021).
Figure 9(a–c) shows the average velocities for the P2 plane which is located at 3 mm from the surface of the teeth. In Fig. 9(a), a high value of the component of velocity can be seen close to the orifice of the scaler. The component of velocity also has a high value near the orifice with a maximum velocity of 0.4 m/s. This likely correlates with the generation of a water spray originated from the ultrasonic scaler, which is not visible in the other cases studied here. Unlike in other cases, we observe an opposing magnitude of the component of velocity on either side of the scaler point. The magnitude of the velocity in this data collection plane, Fig. 9(c), shows a maximum velocity of 2 m/s near the scaler which then decays to 0.67 m/s as it moves out around the teeth model.
Fig. 9.
The velocity measurements for Case 2: P1 plane with the teeth model at a 45˚ angle from the x-axis and the scaler 5˚ from the surface of the tooth. The a component of velocity, b component of velocity, and c the magnitude of the velocity vector with the laser sheet 3 mm away from the front of the teeth. The same average values for d-f the laser sheet 6 mm away from the front of the teeth and for g-i the laser sheet 9 mm away from the teeth’s surface
The velocity components for the P2 plane, located at 6 mm away from the front of the teeth, can be seen in Fig. 9(d–f). The splatter cone-shape and velocity vectors are very similar to those of the data collection plane that is located 3 mm away from the teeth. The component of velocity, shown in Fig. 9(d), has even larger regions of the maximum velocity, 1.9 m/s, than that in the 3 mm data collection plane. The same occurs for the component of velocity; there are larger areas of the maximum velocity of 0.4 m/s. It should be noted that when the data collection plane is moving further away from the surface of the teeth, the plane is getting closer to the physical location of the orifice on the scaler; thus, the water spray originating from that location causes the higher velocity droplets as seen in Fig. 9.
Figure 9(g–i) shows the velocity vectors for a P2 data collection plane located 9 mm from the front of the teeth. Both and components of velocity have decayed significantly to the maximum value of 0.63 m/s. The duality of the component of velocity on either side of the scaler is no longer observed. The width of the splatter formed shown in Fig. 9(i) is still 15 mm on either side of the scaler which is comparable to the closer data collection planes. In short, these figures show how the splatter formed splits and moves around the front of the teeth. Specifically, in this configuration, it can be seen that the majority of velocity vectors within the splatter point out mostly in the negative direction. This helps us to conclude that most of the splatter formed is contained within the mouth. Although for the data collection plane located at 9 mm from the front of the teeth, a wide splatter cone-shape is still observed. As the droplets of the splatter move further from the teeth or the scaler, they have a higher probability of being affected by the ambient airflow.
Conclusions
In this work, we explore the cone-shaped splatter pattern created around a mandibular teeth model produced by a Cavitron ultrasonic scaler in a setting common to dental clinics. We carry out a series of experiments using state-of-the-art techniques, namely OFTV to measure the global velocity of the droplets in different orientations and planes around a model of adult mandibular teeth. We present quasi-velocity measurements specifically surrounding the front of the teeth. Due to experimental limitations, we only examine this field of view which corresponds to the same field of view for the shadowgraphy experiments. The spread of the droplets within the splatter has been seen to move as far as 20 mm away from the teeth. Within these regions, the smaller droplets have relatively low velocity; it is expected that they travel by the ambient air flow within the dental office/clinic. These droplets are most concerning to the safety of those preforming the dental procedure due to their trajectories and the rate of evaporation which could potentially introduce infective bioaerosols into the receiving atmosphere. Proper safety protocols need to be applied in these regions to remove possible bacteria and viruses from the splatter produced from high-speed dental instruments. While the positions of the point of the scaler on the teeth changes the entire splatter formed, this study only considered two positions based on the orientation of the teeth and the scaler. Also, the shape of patients’ mouths and the variability in the physical and chemical characteristics of different mouths could potentially influence the splatter droplets from this instrument in ways which are not considered in these results.
It should be noted that the configurations described in this study are for cases mimicking the exact scenario in a dental office. The lateral side of the CUS and the point of the tool are typically used in scraping the surface of the teeth to remove built up plaque and infected tissue. We have oriented the CUS and the teeth model in such a way that the tool is commonly used in actual practice with the lateral surface of the CUS on the surface of the tooth with the point directed down toward the gumline. Based on the tooth/CUS, the projected splatter outside of the mouth will change. We also selected the front tooth because it could be the more exposed teeth which would provide the highest splatter outside the mouth.
Using a shadowgraphy technique outlined in detail in (Mirbod et al. 2021), individual droplet sizes and velocities are also examined and compared for two different flow rates at which the Cavitron ultrasonic scaler typically operates. The lower flow rate of 16 ml/min, used in this study, is more consistent with conditions typically used in dentistry practice. At this flow rate, a bulk of the droplets are between approximately 71 μm to 128 μm. This corresponded to results obtained by Ou et al. (2021) who used DHI and measured droplets within a range of 12 μm to 200 μm. The velocity of these droplets on average was measured at 0.22 m/s; however, the larger droplets (around 200 μm) had higher velocities of 0.28 m/s. Kun-Szabó et al. (2021) also studied the aerosol generated by an ultrasonic scaler when used in conjunction with an aerosol preventing method (a high-volume evacuator or an aerosol exhauster). However, they measured droplets ranging from 60 μm to 384 μm with no real distinguishing effects between the two aerosol preventing mechanisms.
These findings provide a novel understanding of the spray formation created by a scaler using state-of-the-art fluid mechanics experiments such as OFTV and shadowgraphy techniques. In practice, there are dental tools used to remove the extra fluid produced within the mouth from the procedure, and other tools used externally to reduce the aerosols produced. The use of these tools and their impacts on splatter propagation have been examined by Peng et al. (2020) and recently by Kun-Szabó et al. (2021). The goal of our study, however, was to provide insights into the kinematic and dynamics of the droplets and the splatter to possibly improve the current safety equipment already being used in dental procedures. With the onset of the COVID-19 pandemic, extra safety precautions are necessary to protect dental employees. During this investigation, it was observed that droplets of the splatter can be detected as far as 30 mm from the tip of the CUS, which could evade common dental suction tools. We were unable to analyze the trajectories within this plane due to the sporadic motion of the droplets and the reduction of droplets detected within that data collection plane. Examining the splatter droplets, their velocity, and their trajectories has the potential to develop safety procedures and also can serve as a first step to further characterizing droplets motion and flow transport inside the dental offices/clinics. For instance, the measured average velocity and the average droplet size for 16.2 ml/min flow rate have been already used as initial conditions for the computational analysis of the spread of aerosols discussed in our recent work by (Komperda et al. 2021). The ultrasonic scaler can produce the highest concentration of droplets throughout its use on a patient (Bennett et al. 2000). Holliday et al. (2021) used fluorescent dyed fluid to examine the splatter caused by drilling in conjunction with a suction tool within an open dental clinic. They specifically examined how the droplets were propagated through the dental clinic while applying various suction tools. Additionally, Liu et al. (2019) utilized PIV to study the velocity of the splatter droplets of an ultrasonic scaler without the use of a suction tool. (Plog et al. 2020) investigated the reduction of aerosol propagation using viscoelastic fluids and background illumination to determine droplet sizes for different fluids. These research literatures provide insights to improve safety conditions during dental procedures; however, they do not discuss the droplet′s simultaneous size, their location, and their velocity comprehensively as presented in this study.
Any of these droplets produced could contain harmful pathogens. This study also confirms how droplets propagate leading to harmful aerosols or settle on surfaces around the procedure (Peng et al. 2020). Other research groups are working toward developing new innovative ways to stop this propagation of splatter (Gandolfi et al. 2020), and we believe our research provides insight into the nature of the droplets within the splatter to aid in the construction of these types of safety equipment. The scope of the future experimental work will involve examining various fields of view above and below the view shown in this study.
Acknowledgements
This work was funded by the University of Illinois at Chicago (UIC) – College of Dentistry (Grant No. 200258-323152).
Appendix
Fig. 10.
Case 1: setup (left column) and (right column) components of velocity at a P1 plane (a, b) 6 mm and (c, d) 9 mm away from the tip of the CUS
Fig. 11.
Case 1: setup (left column) and (right column) components of velocity at a P1 plane (a, b) 15 mm and (c, d) 20 mm away from the tip of the CUS
Fig. 12.
Case 2: setup (left column) and (right column) components of velocity at a P1 plane (a, b) 6 mm and (c, d) 9 mm away from the tip of the CUS
Fig. 13.
Case 2: setup (left column) and (right column) components of velocity at a P1 plane (a, b) 15 mm and (c, d) 20 mm away from the tip of the CUS
Author contributions
PM designed the research, EAH, MB, and JEH performed the research, EAH, PM and JEH analyzed the data, and EAH, PM, MB, and JEH wrote the manuscript. FM, LC, SR, and CS provided the Cavitron ultrasonic scaler, contributed resources, insights on the procedure and problem observed.
Data availability
The data that support the findings of this study are available from the corresponding author upon reasonable request.
Code availability
Research papers using custom computer code will also be asked to fill out a code and software submission checklist that will be made available to editors and reviewers during manuscript assessment. The aim is to make studies that use such code more reliable by ensuring that all relevant documentation is available and by facilitating testing of software by the reviewers. Further detailed guidance and required documentation at submission and acceptance of the manuscript can be found here.
Footnotes
Publisher's Note
Springer Nature remains neutral with regard to jurisdictional claims in published maps and institutional affiliations.
References
- Bahl P, de Silva CM, Chughtai AA, MacIntyre CR, Doolan C. An experimental framework to capture the flow dynamics of droplets expelled by a sneeze. Exp Fluids. 2020;61:1–9. doi: 10.1007/s00348-020-03008-3. [DOI] [PMC free article] [PubMed] [Google Scholar]
- Bahl P, Doolan C, de Silva C, Chughtai AA, Bourouiba L, MacIntyre CR. Airborne or droplet precautions for health workers treating COVID-19? J Infect Diseas. 2020 doi: 10.1093/infdis/jiaa189. [DOI] [PMC free article] [PubMed] [Google Scholar]
- Beggs CB (2020) Is there an airborne component to the transmission of COVID-19?: a quantitative analysis study. medRxiv
- Bennett A, Fulford M, Walker J, Bradshaw D, Martin M, Marsh P (2000) Microbial aerosols in general dental practice. Br Dent J 189:664–667 [DOI] [PubMed]
- CDC Best Practices for Environmental Cleaning in Healthcare Facilities in Resource-Limited Settings. Atlanta, GA: US Department of Health and Human Services, ; Cape Town, South Africa: Infection Control Africa Network
- Bourouiba L, Dehandschoewercker E, Bush JW. Violent expiratory events: on coughing and sneezing. J Fluid Mech. 2014;745:537–563. doi: 10.1017/jfm.2014.88. [DOI] [Google Scholar]
- Cao X, Liu J, Jiang N, Chen Q. Particle image velocimetry measurement of indoor airflow field: A review of the technologies and applications. Energy and Buildings. 2014;69:367–380. doi: 10.1016/j.enbuild.2013.11.012. [DOI] [Google Scholar]
- Chao CYH, Wan MP, Morawska L, et al. Characterization of expiration air jets and droplet size distributions immediately at the mouth opening. J Aerosol Sci. 2009;40:122–133. doi: 10.1016/j.jaerosci.2008.10.003. [DOI] [PMC free article] [PubMed] [Google Scholar]
- Coulthard P. Dentistry and coronavirus (COVID-19)-moral decision-making. Br Dent J. 2020;228:503–505. doi: 10.1038/s41415-020-1482-1. [DOI] [PubMed] [Google Scholar]
- Fullmer WD, Higham JE, LaMarche CQ, Issangya A, Cocco R, Hrenya CM. Comparison of velocimetry methods for horizontal air jets in a semicircular fluidized bed of Geldart Group D particles. Powder Technol. 2020;359:323–330. doi: 10.1016/j.powtec.2019.09.073. [DOI] [Google Scholar]
- Gandolfi MG, Zamparini F, Spinelli A, Sambri V, Prati C (2020) Risks of aerosol contamination in dental procedures during the second wave of COVID-19—experience and proposals of innovative IPC in dental practice. Int J Environ Res Public Health 17:8954 [DOI] [PMC free article] [PubMed]
- Gralton J, Tovey E, McLaws M-L, Rawlinson WD. The role of particle size in aerosolised pathogen transmission: a review. J Infect. 2011;62:1–13. doi: 10.1016/j.jinf.2010.11.010. [DOI] [PMC free article] [PubMed] [Google Scholar]
- Haffner EA, Mirbod P. Velocity measurements of dilute particulate suspension over and through a porous medium model. Physics of Fluids. 2020;32:083608. doi: 10.1063/5.0015207. [DOI] [Google Scholar]
- Han P, Li H, Walsh LJ, Ivanovski S (2021) Splatters and aerosols contamination in dental aerosol generating procedures. Appl Sci 11:1914
- Harrel SK, Molinari J. Aerosols and splatter in dentistry: a brief review of the literature and infection control implications. J Am Dent Assoc. 2004;135:429–437. doi: 10.14219/jada.archive.2004.0207. [DOI] [PMC free article] [PubMed] [Google Scholar]
- Higham J, Brevis W. When, what and how image transformation techniques should be used to reduce error in Particle Image Velocimetry data? Flow Meas Instrum. 2019;66:79–85. doi: 10.1016/j.flowmeasinst.2019.02.005. [DOI] [Google Scholar]
- Higham JE, Brevis W, Keylock CJ (2016) A rapid non-iterative proper orthogonal decomposition based outlier detection and correction for PIV data. Meas Sci Technol 27(12):125303–125310. 10.1088/0957-0233/27/12/125303
- Higham JE, Vaidheeswaran A, Benavides K, Shepley P (2019) Eigenparticles: characterizing particles using eigenfaces. Granul Matter 21(3). 10.1007/s10035-019-0900-z
- Holliday R, Allison JR, Currie CC, et al. Evaluating contaminated dental aerosol and splatter in an open plan clinic environment: Implications for the COVID-19 pandemic. J Dentistry. 2021;105:103565. doi: 10.1016/j.jdent.2020.103565. [DOI] [PMC free article] [PubMed] [Google Scholar]
- Illingworth J, Kittler J (1987) The adaptive Hough transform. IEEE Transactions on Pattern Analysis and Machine Intelligence:690–698 [DOI] [PubMed]
- Jeswin J, Jam H. Aerosol: A silent killer in dental practice. Ann Essences Dent. 2012;4:55–59. [Google Scholar]
- Komperda J, Peyvan A, Li D, et al. Computer simulation of the SARS-CoV-2 contamination risk in a large dental clinic. Phy Fluids. 2021;33:033328. doi: 10.1063/5.0043934. [DOI] [PMC free article] [PubMed] [Google Scholar]
- Liu M-H, Chen C-T, Chuang L-C, Lin W-M, Wan G-H. Removal efficiency of central vacuum system and protective masks to suspended particles from dental treatment. PloS one. 2019;14:e0225644. doi: 10.1371/journal.pone.0225644. [DOI] [PMC free article] [PubMed] [Google Scholar]
- Lubarsky E, Reichel JR, Zinn BT, McAmis R. Spray in crossflow: Dependence on Weber number. J Eng Gas Turbines Power. 2010;132(2):021501. doi: 10.1115/1.2904892. [DOI] [Google Scholar]
- Lucas BD, Kanade T (1981) An iterative image registration technique with an application to stereo vision.
- Lucas BD, Kanade T (1985) Optical navigation by the method of differences, IJCAI. Citeseer, pp 981–984
- Mahajan R, Singh P, Murty G, Aitkenhead A. Relationship between expired lung volume, peak flow rate and peak velocity time during a voluntary cough manoeuvre. Br J Anaesth. 1994;72:298–301. doi: 10.1093/bja/72.3.298. [DOI] [PubMed] [Google Scholar]
- Majidi K, Club HD (2020) Dental Clinic Aerosol Management with Aero-Shield.
- Mella D, Brevis W, Higham J, Racic V, Susmel L. Image-based tracking technique assessment and application to a fluid–structure interaction experiment. Proc Inst Mech Eng C J Mech Eng Sci. 2019;233:5724–5734. doi: 10.1177/0954406219853852. [DOI] [Google Scholar]
- Mirbod P, Haffner EA, Bagheri M, Higham JE. Aerosol formation due to a dental procedure: insights leading to the transmission of diseases to the environment. J R Soc Interface. 2021;18:20200967. doi: 10.1098/rsif.2020.0967. [DOI] [PMC free article] [PubMed] [Google Scholar]
- Ou Q, Placucci RG, Danielson J et al (2021) Characterization and mitigation of aerosols and splatters from ultrasonic scalers. medRxiv [DOI] [PMC free article] [PubMed]
- Peng X, Xu X, Li Y, Cheng L, Zhou X, Ren B (2020) Transmission routes of 2019-nCoV and controls in dental practice. Int J Oral Sci 12:1–6 [DOI] [PMC free article] [PubMed]
- Plog J, Wu J, Dias YJ, Mashayek F, Cooper LF, Yarin AL. Reopening dentistry after COVID-19: Complete suppression of aerosolization in dental procedures by viscoelastic Medusa Gorgo. Phy Fluids. 2020;32:083111. doi: 10.1063/5.0021476. [DOI] [PMC free article] [PubMed] [Google Scholar]
- Poulain S, Bourouiba L (2019) Disease transmission via drops and bubbles.
- Raghunath N, Meenakshi S, Sreeshyla H, Priyanka N (2016) Aerosols in dental practice-A neglected infectious vector. Microbiology Research Journal International:1–8
- Rajeev K, Kuthiala P, Ahmad FN, et al. Aerosol Suction Device: Mandatory Armamentarium in Dentistry Post Lock Down. J Adv Med Dental Sci Res. 2020;8(4):81–83. [Google Scholar]
- Scharfman B, Techet A, Bush J, Bourouiba L. Visualization of sneeze ejecta: steps of fluid fragmentation leading to respiratory droplets. Exp Fluids. 2016;57:24. doi: 10.1007/s00348-015-2078-4. [DOI] [PMC free article] [PubMed] [Google Scholar]
- Settles GS. Schlieren and shadowgraph techniques: visualizing phenomena in transparent media. Berlin: Springer; 2012. [Google Scholar]
- Tang JW, Nicolle A, Pantelic J, et al. Airflow dynamics of coughing in healthy human volunteers by shadowgraph imaging: an aid to aerosol infection control. PLoS One. 2012;7:e34818. doi: 10.1371/journal.pone.0034818. [DOI] [PMC free article] [PubMed] [Google Scholar]
- Tang JW, Nicolle AD, Klettner CA, et al. Airflow dynamics of human jets: sneezing and breathing-potential sources of infectious aerosols. PLoS One. 2013;8:e59970. doi: 10.1371/journal.pone.0059970. [DOI] [PMC free article] [PubMed] [Google Scholar]
- VanSciver M, Miller S, Hertzberg J. Particle image velocimetry of human cough. Aerosol Sci Technol. 2011;45:415–422. doi: 10.1080/02786826.2010.542785. [DOI] [Google Scholar]
- WHO Decontamination and Reprocessing of Medical Devices for Health-care Facilities. Geneva,
- Wu Z, Mirbod P. Experimental analysis of the flow near the boundary of random porous media. Physics of Fluids. 2018;30:047103. doi: 10.1063/1.5021903. [DOI] [Google Scholar]
- Xie X, Li Y, Sun H, Liu L. Exhaled droplets due to talking and coughing. J R Soc Interface. 2009;6:S703–S714. doi: 10.1098/rsif.2009.0388.focus. [DOI] [PMC free article] [PubMed] [Google Scholar]
- Yadav N, Agrawal B, Maheshwari C. Role of high-efficiency particulate arrestor filters in control of air borne infections in dental clinics. SRM J Res Dental Sci. 2015;6:240. doi: 10.4103/0976-433X.170250. [DOI] [Google Scholar]
- Zhu S, Kato S, Yang J-H. Study on transport characteristics of saliva droplets produced by coughing in a calm indoor environment. Build Environ. 2006;41:1691–1702. doi: 10.1016/j.buildenv.2005.06.024. [DOI] [Google Scholar]
- Zigan L, Schmitz I, Wensing M, Leipertz A. Reynolds number effects on atomization and cyclic spray fluctuations under gasoline direct injection conditions Fuel Systems for IC Engines. Armsterdam: Elsevier; 2012. [Google Scholar]
Associated Data
This section collects any data citations, data availability statements, or supplementary materials included in this article.
Data Availability Statement
The data that support the findings of this study are available from the corresponding author upon reasonable request.
Research papers using custom computer code will also be asked to fill out a code and software submission checklist that will be made available to editors and reviewers during manuscript assessment. The aim is to make studies that use such code more reliable by ensuring that all relevant documentation is available and by facilitating testing of software by the reviewers. Further detailed guidance and required documentation at submission and acceptance of the manuscript can be found here.


