

Summary:
Objective.
While the vocal fold is in direct contact anteriorly with the thyroid cartilage, posteriorly the vocal fold connects to the thyroid cartilage through a soft tissue layer in the paraglottic space. Currently the paraglottic space is often neglected in computational models of phonation, in which a fixed boundary condition is often imposed on the lateral surface of the vocal fold. The goal of this study was to investigate the effect of the paraglottic space on voice production in an MRI-based vocal fold model, and how this effect may be counteracted by vocal fold stiffening due to laryngeal muscle activation.
Methods.
Parametric simulation study using an MRI-based computational vocal fold model.
Results.
The results showed that the presence of the paraglottic space increased the mean and amplitude of the glottal area waveform, decreased the phonation frequency and closed quotient. For the particular vocal fold geometry used in this study, the presence of the paraglottic space also reduced the occurrence of irregular vocal fold vibration. These effects of the paraglottic space became smaller with increasing paraglottic space stiffness and to a lesser degree with vocal fold stiffening.
Conclusions.
The results suggest that the paraglottic space may be neglected in qualitative evaluations of normal phonation, but needs to be included in simulations of pathological phonation or vocal fold posturing.
Keywords: paraglottic space, lateral boundary condition, MRI-based geometry, computational model
1. Introduction
While the vocal fold, or specifically the thyroarytenoid (TA) muscle, attaches to the thyroid cartilage anteriorly, the vocal fold is not in direct contact with the thyroid cartilage posteriorly and inferiorly, where the vocal fold connects to the thyroid cartilage through soft tissues in the paraglottic space [1]. Although the paraglottic space generally refers to a much larger region between the vocal folds and the thyroid cartilage [2,3], in this study the paraglottic space refers to the soft tissue layer that forms the posterolateral boundary of the vocal folds. This includes superiorly a connective tissue layer that is filled mainly with soft, fatty adipose tissue and blood vessels, and inferiorly and posteriorly the lateral cricoarytenoid (LCA) muscle (Figure 1).
Figure 1.
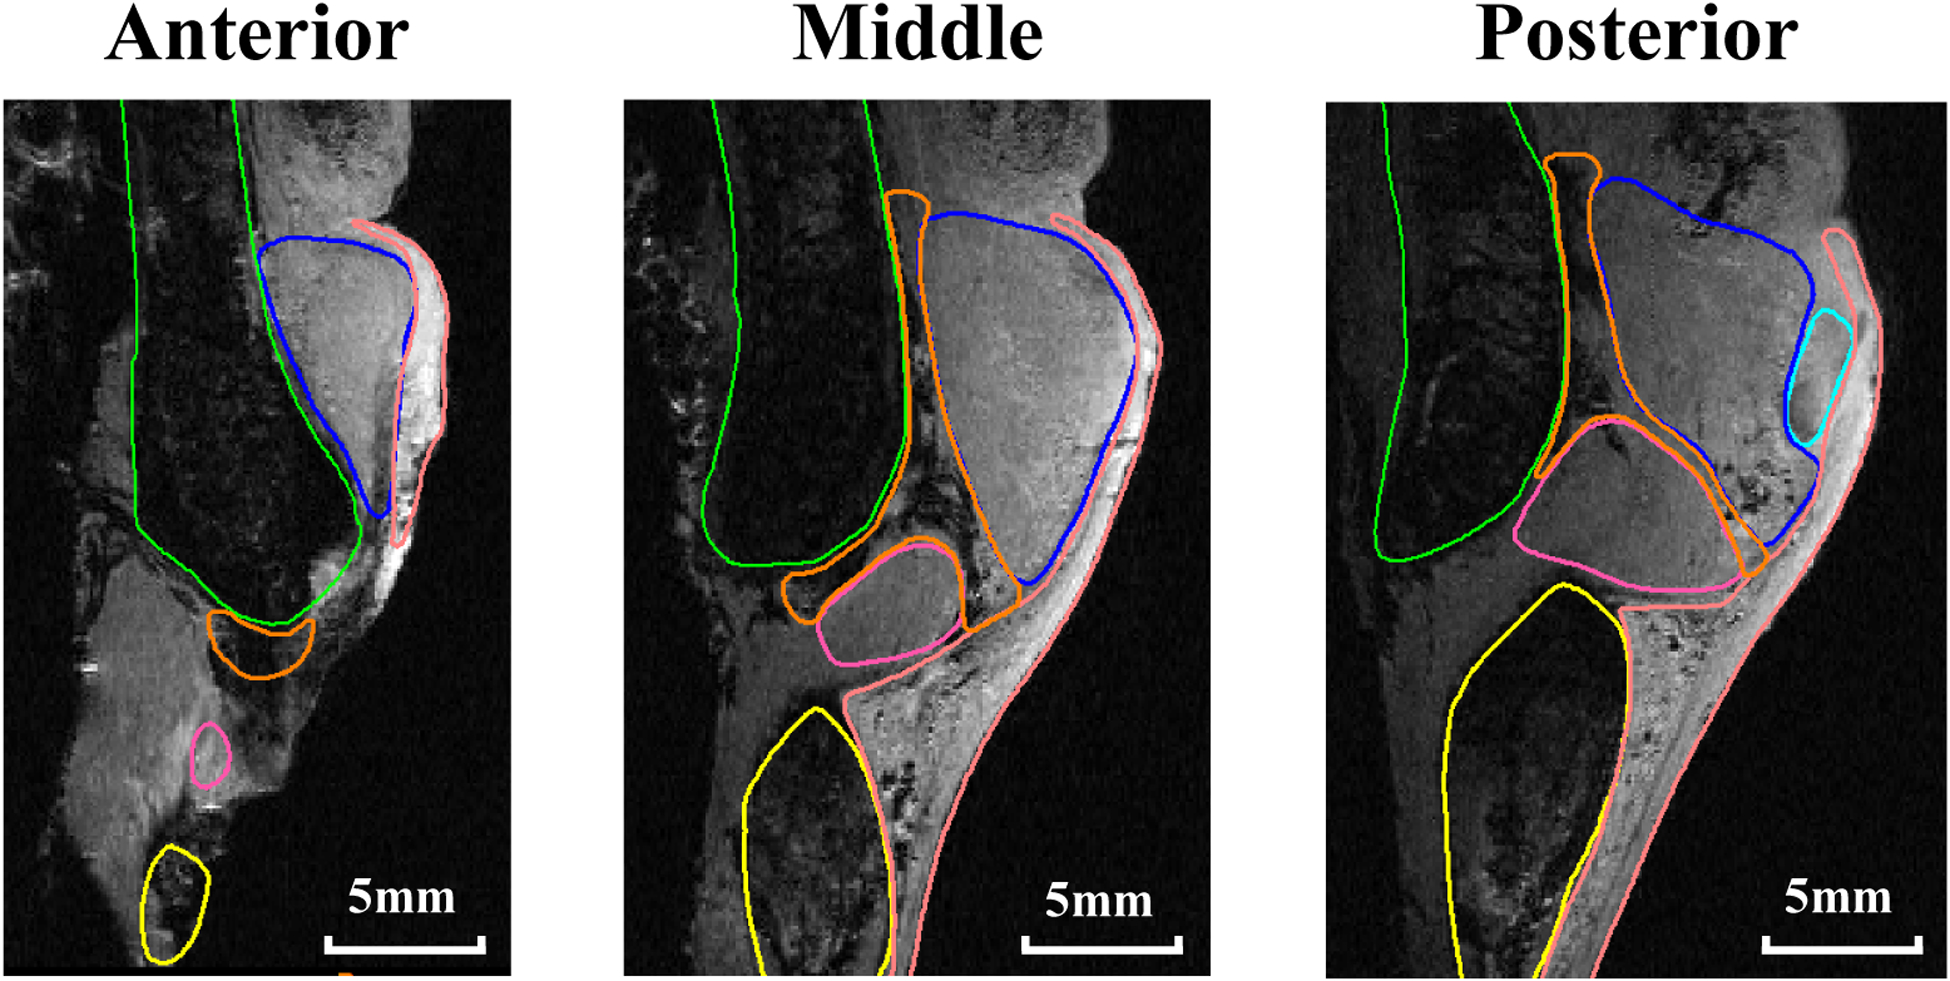
Magnetic resonance images of a human larynx in the coronal plane at anterior, middle, and posterior locations. The vocal fold (TA: blue; cover layer: pink) attaches to the thyroid cartilage (green) anteriorly, but is separated from the thyroid cartilage by the paraglottic space (orange: connective adipose fat tissue; magenta: LCA muscle). The arytenoid and cricoid cartilages are in cyan and yellow, respectively.
Currently, the paraglottic structures are often neglected in computational models of voice production [4–12]. Often, a fixed boundary condition is imposed at the lateral surface of the vocal folds, with the implicit assumption that the lateral surface of the vocal folds is in direct contact with the much stiffer thyroid cartilage. While this assumption is widely used in simulations of fluid-structure interaction during voice production, it has presented difficulties in modeling of vocal fold posturing, a process in which laryngeal muscle activation postures the vocal folds into desired position, geometry, and stiffness conditions. In particular, in order to phonate, the vocal folds need to be medialized to close or reduce the glottis. A fixed lateral boundary condition would prevent the vocal folds from being sufficiently medialized toward glottal midline, which is required for phonation [13,14]. As a result, models of vocal fold posturing often need to consider the paraglottic space or at least its effect in order to allow sufficient vocal fold medialization. For example, Yin and Zhang [15] constrained relative motion along the medial-lateral direction but allowed a relative anterior-posterior sliding motion in order to model vocal fold elongation due to cricothyroid muscle activation. In Yin and Zhang [14,16], the paraglottic space was modeled as a spring foundation attached to the lateral surface of the vocal folds in order to model vocal fold adduction.
Recent studies also showed that the paraglottic space may have an impact on vocal fold vibration. In a vocal fold model with simplified geometry, Cook et al. [17] showed that the stiffness of the paraglottic space had little influence on vocal fold eigenmodes, but observed a relatively larger effect of the depth of the paraglottic space. Jones et al. [18] argued that the stiffness values in Cook et al. [17] may be too high when compared to physiological values. Using stiffness estimations based on data from porcine adipose tissue, they continued to show that including an adipose paraglottic layer can have significant effects on both the frequencies and vibratory patterns of vocal fold eigenmodes [18]. Similar effect of the paraglottic space on the vibration pattern of vocal fold eigenmodes was observed in a three-dimensional vocal fold model based on magnetic resonance imaging (MRI) geometry [1]. However, how the paraglottic space affects the airflow-vocal fold interaction and the produced voice is still unclear.
In addition to changes in phonation frequency and vibratory pattern, the presence of a paraglottic layer that is generally softer than the vocal folds is likely to produce a weaker lateral support than that provided by a fixed lateral boundary condition. This weakened lateral support may lead to increased lateral displacement of the vocal folds when subject to the subglottal pressure and reduce the degree of glottal closure during vocal fold vibration, in which case activation of some restraining mechanisms through laryngeal muscle activation may be required to counteract this increased glottal-opening effect [19, 20]. Quantifying the effect of paraglottic structures on phonation and compensation through laryngeal muscle activation would help us better understand voice production in both normal and pathological conditions.
The goal of this study was to quantify to what extent voice production is affected by the presence of the paraglottic space in an MRI-based computational vocal fold model, and if a large effect is observed, whether these effects can be alleviated by vocal fold stiffening through laryngeal muscle activation. Specifically, we focused on the effects on the phonation threshold pressure, fundamental frequency (F0) of phonation, the glottal area waveform, and closed quotient (CQ, the fraction of an oscillating cycle in which the glottis remains closed). Such understanding would help to better understand the roles of the paraglottic space in both normal and pathological voice production and how to best model it in computer models of phonation.
While there have been little data on the mechanical properties of paraglottic tissues, it is reasonable to assume that the paraglottic connective tissues are nonlinear and viscoelastic in nature, based on previous data on human adipose fat tissue [21]. Modeling the paraglottic space tissue as a nonlinear, viscoelastic material is computationally challenging, particularly when our goal was to evaluate its impact on the already complex fluid-structure interaction between the vocal folds and glottal airflow. Considering the lack of experimental data on the mechanical properties of the paraglottic space tissue, and the need to investigate the phonatory impact of the paraglottic space over a large range of voice conditions, in this study we modeled the paraglottic tissue [10, 20, 22] as a linear elastic material characterized by a paraglottic Young’s modulus. This Young’s modulus should be interpreted as the tangent elastic modulus around a specific deformation condition of the paraglottic space tissue, with different stiffness values representing different deformation conditions due to either vocal fold posturing or direct surgical manipulation of the paraglottic space. Experimentally, this tangent modulus can be directly measured in either uniaxial tensile tests or indentation tests. In the following, the MRI-based vocal fold model and simulation conditions are described in Sec. 2. The results are presented in Sec. 3, and their implications to phonation modeling and clinical intervention of voice disorders are discussed in Sec. 4.
2. Methods
2.1. MRI-based computational model
A vocal fold model was developed based on MRI images of a cadaver hemi-larynx from a 57-year-old male. The three-dimensional laryngeal structures at the resting position, including the TA muscle, cover layer, cartilages and other intrinsic muscles, were segmented and reconstructed from the MRI images, as shown in Fig 2. The vocal fold geometry, including the TA muscle and cover layer was reconstructed as described in Wu and Zhang [1,23]. Unlike Wu and Zhang [1] in which an impedance boundary condition was applied on the lateral surface of the vocal fold, in this study, the thyroid cartilage (TC) and paraglottic space were added to implement a physiologically more realistic lateral boundary condition of the vocal fold. The thyroid cartilage was directly imported from the MRI reconstructed geometry, and the paraglottic space was generated by filling the gap between the vocal fold and the thyroid cartilage, as shown in Fig 2. Because the MRI geometry represented the larynx at a resting position, the vocal fold was rotated in the horizontal plane about its anterior attachment to the thyroid cartilage to achieve a fully-approximated prephonatory position. That is, the superior edge of the vocal fold medial surface was brought to the glottal midline. As expected, this rotation led to an enlarged paraglottic space between the vocal fold and the thyroid cartilage. Note that this rotation in the horizontal plane was not intended to exactly reproduce realistic vocal fold adduction, which in reality involves vocal fold rotation mostly in the coronal plane and other complex deformation of the vocal fold [24]. Instead, this rigid body rotation was to bring the vocal fold close to the glottal midline, a condition that is required to produce phonation at subglottal pressures typical of human phonation.
Figure 2.

Left: MRI-reconstructed geometry of the larynx at rest, including the vocal fold (blue), paraglottic space (orange), thyroid cartilage (green), and arytenoid cartilage (semi-transparent cyan). The vocal fold was then rotated in the axial plane to approximate an adducted prephonatory position (Middle). Right: the larynx model reconstructed from MRI after vocal fold rotation, with the expanded paraglottic space highlighted in light blue, and its medial surface contour at different conditions of superior- and inferior-medial bulging.
An important feature of voice production is that the glottis remains closed for a considerable fraction of one oscillating cycle of vocal fold vibration. Previous studies have shown that the medial surface shape of the vocal folds has an important effect on the glottal closure pattern of vocal fold vibration [10]. In this study, in order to investigate the effect of the paraglottic space across a large range of voice conditions, in particular conditions of different glottal closure patterns, the medial surface shape of the vocal fold was parametrically varied according to the empirical rule developed in Wu and Zhang [23], which has been shown to be able to produce different medial surface shapes observed in excised human larynx experiment [25,26] and in vivo canine experiments [27]. Specifically, a superior-medial bulging and an inferior-medial bulging, simulating the effect of the activation of the LCA and TA muscles, respectively, were superimposed on the adducted medial surface. The degrees of superior and inferior bulging were controlled by two scaling factors, αs and αi, each varied between 0–1, respectively, with 0 corresponding to no medial bulging and 1 for maximum medial bulging. Thus, large values of the scaling factors bring the medial surface closer to the glottal midline. The reader is referred to Wu and Zhang [23] for a detailed mathematical description of the geometric manipulations. Figure 2 also shows the coronal cross-sectional contours of the medial surface due to different combinations of the superior- and inferior- medial bulging, which produce divergent (αs = 0, αi = 1), convergent (αs = 1, αi = 0), and rectangular (αs = 0.6, αi = 0.6) medial surface shape as those observed in the in vivo canine experiment of Vahabzadeh-Hagh et al. [27].
2.2. Voice production simulation conditions
Vocal fold-airflow interaction is simulated as described in Zhang [10,20,28]. The reader is referred to these papers for details of the model formulation. The glottal flow is modeled as a one-dimensional quasi-steady flow taking into consideration viscous loss along the glottal channel [20,28], and the vocal fold is modeled as a transversely isotropic linear elastic material with the plane of isotropy perpendicular to the anterior-posterior (AP) direction, as further described below. These model simplifications are supported by previous experimental observations [29–32]. The model uses an eigenmode-based reduced-order formulation of the system governing equations, which significantly improves the computational efficiency. This model has been shown to be able to predict voice production by unsteady glottal flow [29], phonation threshold pressure and frequency in a two-layer silicone vocal fold model [32], and vocal fold vibration patterns in different vibratory regimes and transitions between regimes [33].
Although the vocal fold includes the TA muscle and a cover layer, for simplification in this study the mechanical properties of the two layers were assumed to be identical, with control parameters including the transverse Young’s modulus Et, AP shear modulus Gap, AP Young’s modulus Eap = 4Gap, AP Poisson’s ratio vap = 0.495, and vocal fold density ρ = 1030 kg/m3. Specifically, three vocal fold stiffness conditions (S1, S2, and S3) were considered in this study, as shown in Table 1. Condition S1 represented a vocal fold condition with minimal stiffening associated with laryngeal muscle activation, whereas S2 and S3 were included to investigate whether vocal fold stiffening along the transverse and AP direction, respectively, counteracts the effect of the paraglottic space on voice production.
Table 1.
Simulation conditions. For all conditions, the vocal fold and paraglottic space had a density of 1030 kg/m3 and a longitudinal Poisson’s ratio of 0.495. NPG refers to conditions with the paraglottic space excluded and a fixed boundary condition imposed on the vocal fold lateral surface.
| S1 | S2 | S3 | ||
|---|---|---|---|---|
| Vocal fold | Transverse Young’s modulus Et (kPa) | 1 | 2 | 1 |
| AP shear modulus Gap (kPa) | 10 | 10 | 40 | |
| Paraglottic space | Young’s modulus Epgs (kPa) | [1, 4, 10, 20, NPG] | [1, NPG] | [1, NPG] |
| Medial surface shapes | ||||
| ai = [0, 0.2, 0.4, 0.6, 0.8, 1.0] | ||||
| Subglottal pressure | Ps = 50 – 2400 Pa (18 conditions) | |||
Although the LCA muscle and the connective tissue may have different stiffness, for simplicity the paraglottic space in this study was modeled as one single isotropic linear elastic material with a Young’s modulus Epgs, similar to that in Jones et al. [18]. As mentioned earlier, the paraglottic Young’s modulus should be interpreted as the tangent elastic modulus around a certain deformation state of the paraglottic space, due to either vocal fold posturing or surgical manipulation. Thus, the paraglottic space stiffness is expected to vary during vocal fold adduction due to the potential stretching of the adipose fat tissue [21] and activation of the LCA muscle. Due to the lack of experimental data on the stiffness of the paraglottic tissue, four values of the Young’s modulus, 1 kPa, 4 kPa, 10 kPa, and 20 kPa, were considered in this study, simulating a range of conditions of the paraglottic space from the resting condition to different medialization/LCA activation conditions. To compare with previous models without a paraglottic space, a baseline condition (NPG) was also considered in which the paraglottic space was excluded from the model and a fixed boundary condition was imposed on the lateral surface of the vocal fold.
Table 1 lists all the simulation conditions performed in this study, including 3 vocal fold stiffness conditions, 5 paraglottic space stiffness conditions (i.e. five lateral boundary conditions of the vocal fold), 36 medial surface shapes, and 18 subglottal pressures. Note that in all conditions the vocal folds were fully-approximated with a zero pre-phonatory glottal opening area, as mentioned earlier. For each condition, a 0.5-s voice production simulation was performed at a sampling rate of 44100 Hz, with the subglottal pressure linearly increased from zero in 30 time steps to the target value and then kept constant.
2.3. Data analysis
Data analysis was performed using the last 0.25 s of each simulation by which time vocal fold vibration had either reached steady-state or damped out. For each vocal fold and paraglottic stiffness condition, the phonation threshold pressure Pth was calculated as the lowest subglottal pressure that produced sustained vocal fold vibration. For each simulation, the mean glottal area Agmean, glottal area amplitude Agamp, closed quotient CQ, and fundamental frequency F0 were extracted. The glottal area amplitude Agamp was calculated as the half of the peak-to-peak value of the glottal area waveform. The CQ was calculated as the ratio between the duration of closed phase and the period of the glottal cycle, with the closed phase defined as the duration during which the glottal flow rate was within the lowest ten percent of the glottal flow waveform. The F0 was estimated using the method developed in Sun [34], implemented in the Matlab-based software VoiceSauce. Since some of the voice conditions exhibited strong subharmonic vibration pattern, the subharmonic-to-harmonic ratio (SHR), which quantifies difference in energy between the subharmonics and the harmonics [34], was also extracted using VoiceSauce.
3. Results
3.1. Effect of the paraglottic space
Figure 3 shows the effect of the paraglottic space stiffness on different output measures of voice production for vocal fold condition S1 with Et = 1 kPa and Gap = 10 kPa. All output measures were impacted by the inclusion of the paraglottic space. The mean glottal area and glottal area amplitude increased significantly with the inclusion of the paraglottic space, particularly for paraglottic space stiffness of 4 kPa and 1 kPa and conditions of low-level inferior medial bulging, in which the vocal fold medial surface was thin and relatively easy to be blown open by the subglottal pressure [10]. This increase in Agmean and Agamp was expected because decreasing the paraglottic space stiffness relaxed the lateral restriction to vocal fold displacement, reducing the vocal fold’s ability to maintain prephonatory position against the subglottal pressure. Similar trends were observed for the mean and amplitude of the glottal flow, which increased with the inclusion of the paraglottic space in the model.
Figure 3.

Selected output measures of voice production under different paraglottic space conditions for the vocal fold stiffness condition S1 (Et = 1 kPa, Gap = 10 kPa). Selected output measures include the mean glottal area (Agmean), glottal area amplitude (Agamp), closed quotient (CQ), sound pressure level (SPL), fundamental frequency (F0), and the subharmonic to harmonic ratio (SHR). Regions without data indicate conditions of no phonation.
Despite significant increase in the mean glottal area and glottal area amplitude, the sound pressure level and maximum flow declination rate stayed relatively the same across the five paraglottic space conditions. This small effect of paraglottic space stiffness condition on vocal intensity was similar to that of vocal fold stiffness [10].
Inclusion of the paraglottic space also reduced the closed quotient of vocal fold vibration, particularly for conditions of thick vocal folds with high-level superior and inferior medial bulging, in which the relaxation effect of the paraglottic space was expected to have the largest impact. As a result, the upper range of the closed quotient was gradually reduced with decreasing paraglottic space stiffness.
Compared to conditions without the paraglottic space, the fundamental frequency F0 did not show noticeable change with the inclusion of a stiff paraglottic space with a Young’s modulus of 20 kPa or 10 kPa, but was significantly higher with a much softer paraglottic space (Young’s modulus of 1 kPa or 4 kPa). This trend was different from what we expected. Considering that the condition without the paraglottic space was equivalent to inclusion of a paraglottic space with a very large stiffness, it should have the highest F0 among the five paraglottic space conditions and F0 should decrease with decreasing paraglottic space stiffness. Examination of the glottal area waveforms showed that voice conditions without the paraglottic space had the tendency to exhibit subharmonic vocal fold vibration, as demonstrated by the high SHR values in Figure 3. In the presence of a strong subharmonic, the frequency of the subharmonic rather than the fundamental harmonic was identified as the fundamental frequency, which may have contributed to the lower than expected F0 values in conditions without the paraglottic space. Manually correcting the F0 to the true fundamental frequency showed that conditions without the paraglottic space indeed had the highest F0 among the five paraglottic space conditions, as we originally expected.
Figure 3 shows that high SHR values occurred at conditions of large superior medial bulging, which resulted in medial compression of the vocal folds, and conditions with balanced superior and inferior medial bulging, which increased the medial surface vertical thickness. Both conditions are known to facilitate irregular vocal fold vibration when the vocal folds are tightly approximated [35]. The geometry of this particular larynx (e.g., large vertical span and small variation along the AP direction of the medial surface) also contributed to the overall tightness of vocal fold vibration, as shown in our previous study [23], which facilitates the occurrence of irregular vibration. Note that voice with subharmonics occurs often in normal, conversational voice [36–38]. The occurrence of subharmonics was high for conditions without the paraglottic space and conditions with a paraglottic space stiffness of 10 and 20 kPa, but decreased almost to zero for other conditions with a smaller paraglottic space stiffness (1 and 4 kPa). In other words, a soft paraglottic layer suppressed irregular vocal fold vibration, due to the relaxed lateral constriction and thus reduced tightness of glottal closure.
An important observation in Figure 3 is that the effect of the paraglottic space decreased with increasing paraglottic space stiffness. For the two stiffest paraglottic stiffness conditions (10 and 20 kPa), the effect of the paraglottic space was almost negligible. Even for the other two paraglottic space conditions with a lower stiffness (1 and 4 kPa), the general trends of variation, i.e., how the output measures varied with medial surface bulging and subglottal pressure, were qualitatively similar to those in the condition without the paraglottic space.
In general, with the inclusion of the paraglottic space, the phonation threshold pressure increased slightly for conditions of balanced superior-inferior medial bulging (lower left and upper right corners in Figure 4), but decreased slightly for some other conditions (e.g., upper left corner in Figure 4). However, the effect was inconsistent across different vocal fold stiffness conditions. This was probably because inclusion of the paraglottic space reduced the overall vocal fold stiffness, which reduces the phonation threshold pressure, but also increased the glottal opening, which increases the phonation threshold pressure. The overall effect on the phonation threshold pressure therefore depended on the specific geometric and stiffness condition of the vocal fold.
Figure 4.

Phonation threshold pressure (Pth) for conditions without the paraglottic space (NPG) and with a 1 kPa paraglottic space under the three vocal fold conditions S1, S2, and S3.
3.2. Effect of vocal fold stiffening
Figure 5 shows the effects of the paraglottic space on the output measures of the voice production for vocal fold stiffness conditions S2 (Et = 2 kPa and Gap = 10 kPa) and S3 (Et = 1 kPa and Gap = 40 kPa). In general, similar effect on the mean glottal area, glottal area amplitude, and closed quotient can be observed.
Figure 5.

Selected output measures without the paraglottic space (NPG) and with a 1 kPa paraglottic space for vocal fold stiffness condition S2 (Et = 2 kPa, Gap = 10 kPa) and S3 (Et = 1 kPa, Gap = 40 kPa). Selected output measures include the mean glottal area (Agmean), glottal area amplitude (Agamp), closed quotient (CQ), sound pressure level (SPL), fundamental frequency (F0), and the subharmonic to harmonic ratio (SHR). Regions without data indicate conditions of no phonation.
One question that we are interested is whether vocal fold stiffening can mitigate the effect of including the paraglottic space in computer models. In general, the effects of the paraglottic space in vocal fold stiffness S2 and S3 were weaker than that for S1. For example, the increases in Agmean and Agamp due to the inclusion of the paraglottic space were smaller in conditions S2 and S3 than those in S1 (note that different scales were used in Figs. 3 and 5), indicating that vocal fold stiffening, particularly along the anterior-posterior direction, was able to counteract to some degree the effect of the lateral boundary condition on the glottal area waveform.
Increasing the transverse stiffness in general had a small effect on the closed quotient (compare Figure 3 and 5), and in some conditions reduced the closed quotient, consistent with the observation in Zhang [28]. Increasing vocal fold longitudinal stiffness noticeably increased the closed quotient (compare Figure 3 and 5), although the amount of increase was still smaller than the negative effect of the paraglottic space.
4. Discussion and conclusions
The paraglottic space is often neglected and replaced with a fixed boundary condition imposed at the lateral surface of the vocal folds in current computational models of voice production. The goal of this study was to evaluate the impact of this simplification on voice production. In this study, using an MRI-based three-dimensional vocal fold model, we showed that inclusion of the paraglottic space can have important impact on vocal fold vibration and voice acoustics. Compared with models that replace the paraglottic space with a fixed boundary condition on the lateral surface of the vocal fold, inclusion of a soft paraglottic space (with stiffness below 10 kPa) considerably weakened the vocal fold’s ability to withstand the subglottal pressure and maintain adductory position. As a result, the vocal fold vibrated with a much larger mean glottal opening area and a reduced closed quotient. The increased mean glottal opening and reduced vocal fold contact likely also reduced the degree of nonlinear coupling during vocal fold contact, which may explain the much-reduced occurrence of irregular vocal fold vibration in the presence of a soft paraglottic space with stiffness below 10 kPa, even in conditions of strong medial surface bulging. Despite the large effect on vocal fold vibration amplitude, the effect of the paraglottic space on vocal intensity was much smaller. The effect of the paraglottic space on the phonation threshold pressure was inconsistent, varying depending on the specific values of vocal fold stiffness and medial surface shape. In general, the effect of the paraglottic space decreased with increasing stiffness of the paraglottic space. For a paraglottic space stiffness of 10 kPa and higher, the effect on voice production was almost negligible. On the other hand, even for a lower paraglottic space stiffness for which voice production was noticeably impacted, the general trends of variation in the output measures remained qualitatively similar to that without a paraglottic space.
These findings are consistent with the observations in Cook et al. [17] and Jones et al. [18]. Although these two previous studies did not investigate the impact of the paraglottic space on voice production, they showed that the impact of the paraglottic space on vocal fold eigenmodes depend on the stiffness of the paraglottic space. Using very high stiffness values (50–1000 kPa) for the paraglottic space, Cook et al. [17] showed little influence of the paraglottic space on vocal fold eigenmodes. With reduced paraglottic space stiffness in the range between 1–8 kPa, Jones et al. [18] observed significant effect of the paraglottic space on vocal fold eigenmodes. Similar finding was also reported by Wu and Zhang [1].
Our results showed that whether the paraglottic space should be included in computer models of phonation depends on the stiffness conditions in the paraglottic space. Note that in our study the paraglottic space consisted of both the connective fat tissue layer superiorly and the LCA muscle inferiorly and posteriorly. We are not aware of any experimental data on the paraglottic space stiffness. Based on porcine adipose tissue data, Jones et al. [18] estimated the stiffness of the connective fat tissue to be in the range of 1–8 kPa. Alkhouli et al. [21] reported human adipose tissue is in the range of 0.8–4.4 kPa without stretching and 5.3–47.6 kPa under 30% strain. In humans, the paraglottic space stiffness is likely to vary depending on the degree of vocal fold adduction. Strong vocal fold adduction is likely to be accompanied by large strain and possibly increased stiffness of the connective tissues in the paraglottic space. Since adduction is achieved primarily through the activation of the LCA muscle, the stiffness of the LCA muscle, which forms a large portion of the inferior and posterior boundary of the vocal fold, is expected to increase significantly with the degree of vocal fold adduction. Our previous numerical studies showed that the muscle stiffness could very well exceed 10 kPa with muscle activation [15,16]. Since normal phonation requires a considerable degree of vocal fold adduction, it is reasonable to assume that the paraglottic space in normal phonation has a stiffness close to 10 kPa or higher, particularly for strongly adducted vocal fold conditions with considerable medial surface bulging, in which the effect of the paraglottic space on the closed quotient was the largest in this study. Therefore, it is reasonable to neglect the paraglottic space in computational models for normal phonation, except for the least adducted conditions (e.g., soft voices).
For pathological conditions such as LCA muscle paresis and paralysis, the paraglottic space stiffness may fall below 10 kPa, in which case the paraglottic space needs to be taken into consideration in computer models. Nevertheless, considering the general trends of variation in the output measures were qualitatively similar even for a soft paraglottic space, models excluding the paraglottic space may still provide a qualitative evaluation of the general trends of variations, with the understanding that the vocal fold vibration amplitude is underestimated and the range of closed quotients overestimated.
Under such conditions (LCA paresis and paralysis), providing additional lateral support in the paraglottic space is essential to achieving complete glottal closure. Our results showed that the negative effect of the paraglottic space (increased vibration amplitude and reduced closed quotient) can be counteracted to some degree by longitudinal vocal fold stiffening or vocal fold thickening. In other words, one may compensate with increased cricothyroid muscle activation, which stiffens the vocal fold longitudinally, or thyroarytenoid muscle activity, which thickens the vocal folds [24]. In the clinic, a weakened function of vocal fold adduction is often addressed by thyroplasty [39]. Our results showed that in addition to medialization, the thyroplasty implant also needs to be stiff enough (e.g., 10 kPa or higher) to provide sufficient lateral support.
In summary, the results of this study showed that neglecting the paraglottic space is a reasonable simplification in computer models of normal phonation. For pathological conditions such as LCA paresis or paralysis, the paraglottic space may have important effect on vocal fold vibration and voice acoustics, and thus needs to be included in computer models. Further experimental data on the paraglottic space stiffness at different voicing conditions are required to confirm these recommendations and better evaluate the extent of impact of the paraglottic space. Finally, it is recommended that the paraglottic space is included in models of vocal fold posturing.
Acknowledgment
This study was supported by research Grant Nos. R01DC009229 and R01DC001797 from the National Institute on Deafness and Other Communication Disorders, the National Institutes of Health.
Footnotes
Publisher's Disclaimer: This is a PDF file of an unedited manuscript that has been accepted for publication. As a service to our customers we are providing this early version of the manuscript. The manuscript will undergo copyediting, typesetting, and review of the resulting proof before it is published in its final form. Please note that during the production process errors may be discovered which could affect the content, and all legal disclaimers that apply to the journal pertain.
References
- 1.Wu L, Zhang Z. A parametric vocal fold model based on magnetic resonance imaging. J. Acoust. Soc. Am 2016;140:EL159–165. [DOI] [PMC free article] [PubMed] [Google Scholar]
- 2.Sato K, Kurita S, Hirona M. Location of the preepiglottic space and its relationship to the paraglottic space. Ann. Otol. Rhinal. Laryngol 1993;102:930–934. [DOI] [PubMed] [Google Scholar]
- 3.Reidenbach MM. The paraglottic space and transglottic cancer: Anatomical considerations. Clin. Anat 1996;9:244–251. [DOI] [PubMed] [Google Scholar]
- 4.Ishizaka K, Flanagan JL. Synthesis of voiced sounds from a two-mass model of the vocal cords. Bell Syst. Tech. J 1972;51:1233–1267. [Google Scholar]
- 5.Titze IR, Strong WJ. Normal modes in vocal cord tissues. J. Acoust. Soc. Am 1975;57:736–744. [DOI] [PubMed] [Google Scholar]
- 6.Story BH, Titze IR. Voice simulation with a body-cover model of the vocal folds. J. Acoust. Soc. Am 1995;97:1249–1260. [DOI] [PubMed] [Google Scholar]
- 7.Thomson SL, Mongeau L, Frankel SH. Aerodynamic transfer of energy to the vocal folds. J. Acoust. Soc. Am 2005;118:1689–1700. [DOI] [PubMed] [Google Scholar]
- 8.Alipour F, Berry DA, Titze IR. A finite-element model of vocal-fold vibration. J. Acoust. Soc. Am 2000;108:3003–3012. [DOI] [PubMed] [Google Scholar]
- 9.Xue Q, Zheng X, Mittal R, Bielamowicz S. Subject-specific computational modeling of human phonation. J. Acoust. Soc. Am 2014;135:1445–1456. [DOI] [PMC free article] [PubMed] [Google Scholar]
- 10.Zhang Z Cause-effect relationship between vocal fold physiology and voice production in a three-dimensional phonation model. J. Acoust. Soc. Am 2016;139:1493–1507. [DOI] [PMC free article] [PubMed] [Google Scholar]
- 11.Vampola T, Horacek J, Klepacek I. Computer simulation of mucosal waves on vibrating human vocal folds. Biocybern Biomed. Eng 2016;36:451–465. [Google Scholar]
- 12.Li Z, Chen Y, Chang S, Luo H. A reduced-order flow model for fluid–structure interaction simulation of vocal fold vibration. J. Biomech. Eng 2020;142:021005. [DOI] [PMC free article] [PubMed] [Google Scholar]
- 13.Hunter EJ, Titze IR, Alipour F. A three-dimensional model of vocal fold abduction/adduction. J. Acoust. Soc. Am 2004;115:1747–1759. [DOI] [PMC free article] [PubMed] [Google Scholar]
- 14.Yin J, Zhang Z. Interaction between the thyroarytenoid and lateral cricoarytenoid muscles in the control of vocal fold adduction and eigenfrequencies. J. Biomech. Eng 2014;136:111006. [DOI] [PMC free article] [PubMed] [Google Scholar]
- 15.Yin J, Zhang Z. The influence of thyroarytenoid and cricothyroid muscle activation on vocal fold stiffness and eigenfrequencies. J. Acoust. Soc. Am 2013;133:2972–2983. [DOI] [PMC free article] [PubMed] [Google Scholar]
- 16.Yin J, Zhang Z. Laryngeal muscular control of vocal fold posturing: Numerical modeling and experimental validation. J. Acoust. Soc. Am 2016;140:EL280–284. [DOI] [PMC free article] [PubMed] [Google Scholar]
- 17.Cook DD, Nauman E, Mongeau L. Ranking vocal fold model parameters by their influence on modal frequencies. J. Acoust. Soc. Am 2009;126:2002–2010. [DOI] [PMC free article] [PubMed] [Google Scholar]
- 18.Jones C, Achuthan A, Erath B. Modal response of a computational vocal fold model with a substrate layer of adipose tissue. J. Acoust. Soc. Am 2015;137:EL158–164. [DOI] [PubMed] [Google Scholar]
- 19.Zhang Z Restraining mechanisms in regulating glottal closure during phonation. J. Acoust. Soc. Am 2011;130:4010–4019. [DOI] [PMC free article] [PubMed] [Google Scholar]
- 20.Zhang Z Regulation of glottal closure and airflow in a three-dimensional phonation model: Implications for vocal intensity control. J. Acoust. Soc. Am 2015;137:898–910. [DOI] [PMC free article] [PubMed] [Google Scholar]
- 21.Alkhouli N, Mansfield J, Green E, Bell J, Knight B, Liversedge N, Tham JC, Welbourn R, Shore A, Kos K, Winlove C. The mechanical properties of human adipose tissues and their relationships to the structure and composition of the extracellular matrix. Am. J. Physiol. Endocrinol. Metab 2013;305:E1427–1435. [DOI] [PubMed] [Google Scholar]
- 22.Titze IR, Talkin DT. A theoretical study of the effects of various laryngeal configurations on the acoustics of phonation. J. Acoust. Soc. Am 1979;66:60–74. [DOI] [PubMed] [Google Scholar]
- 23.Wu L, Zhang Z. Voice production in a MRI-based subject-specific vocal fold model with parametrically controlled medial surface shape. J. Acoust. Soc. Am 2019;146:4190–4198. [DOI] [PMC free article] [PubMed] [Google Scholar]
- 24.Zhang Z Mechanics of human voice production and control. J. Acoust. Soc. Am 2016;140:2614–2635. [DOI] [PMC free article] [PubMed] [Google Scholar]
- 25.Hirano M Vocal mechanisms in singing: laryngological and phoniatric aspects. J. Voice 1988;2:51–69. [Google Scholar]
- 26.Zhang Z, Wu L, Gray R, Chhetri D. Three-dimensional vocal fold structural change due to implant insertion in medialization laryngoplasty. PLoS ONE 2020;15:e0228464. [DOI] [PMC free article] [PubMed] [Google Scholar]
- 27.Vahabzadeh-Hagh AM, Zhang Z, Chhetri DK. Quantitative evaluation of the in vivo vocal fold medial surface shape. J. Voice 2017;31:513. e15–e23. [DOI] [PMC free article] [PubMed] [Google Scholar]
- 28.Zhang Z Effect of vocal fold stiffness on voice production in a three-dimensional body-cover phonation model. J. Acoust. Soc. Am 2017;142:2311–2321. [DOI] [PMC free article] [PubMed] [Google Scholar]
- 29.Zhang Z, Mongeau L, Frankel S. Experimental verification of the quasi-steady approximation for aerodynamic sound generation by pulsating jets in tubes. J. Acoust. Soc. Am 2002;112:1652–1663. [DOI] [PubMed] [Google Scholar]
- 30.Ruty N, Pelorson X, Van Hirtum A, Lopez-Arteaga I, Hirschberg A. An in vitro setup to test the relevance and the accuracy of low-order vocal folds models. J. Acoust. Soc. Am 2007;121:479–490. [DOI] [PubMed] [Google Scholar]
- 31.Zhang Z, Neubauer J. On the acoustical relevance of supraglottal flow structures to low frequency voice production. J. Acoust. Soc. Am 2010;128:EL378–383. [DOI] [PMC free article] [PubMed] [Google Scholar]
- 32.Farahani M, Zhang Z. Experimental validation of a three-dimensional reduced-order continuum model of phonation. J. Acoust. Soc. Am 2016;140:EL172–177. [DOI] [PMC free article] [PubMed] [Google Scholar]
- 33.Zhang Z, Luu T. Asymmetric vibration in a two-layer vocal fold model with left-right stiffness asymmetry: Experiment and simulation. J. Acoust. Soc. Am 2012;132:1626–1635. [DOI] [PMC free article] [PubMed] [Google Scholar]
- 34.Sun X Pitch determination and voice quality analysis using subharmonic-to-harmonic ratio. In 45th International Conference on Acoustics, Speech, and Signal Processing (ICASSP 2002), Orlando; FL, 4–8 May. 2002; I-333–I-336. [Google Scholar]
- 35.Zhang Z Vocal instabilities in a three-dimensional body-cover phonation model. J. Acoust. Soc. Am 2018;144:1216–1230. [DOI] [PMC free article] [PubMed] [Google Scholar]
- 36.Gordon M, Ladefoged P. Phonation types: A cross-lingustic overview. J. Phon 2001;29:383–406. [Google Scholar]
- 37.Keating P, Garellek M, Kreiman J. Acoustic properties of different kinds of creaky voice. In Proceedings of the 18th International Congress of Phonetic Sciences (ICPhS 2015), Glasgow, UK, 10–14 August; 2015;0821.1–5. [Google Scholar]
- 38.Svec JG, Schutte HK, Miller DG. A subharmonic vibratory pattern in normal vocal folds. J. Speech Lang. Hear. Res 1996;39:135–143. [DOI] [PubMed] [Google Scholar]
- 39.Isshiki N Phonosurgery: Theory and Practice Springer-Verlag, Tokyo, 1989. [Google Scholar]