

Abstract
Degeneration of the basal forebrain (BF) is detected early in the course of Alzheimer’s disease (AD). Reduction in the number of BF cholinergic (ChAT) neurons associated with age-related hippocampal cholinergic neuritic dystrophy is described in the 3xTg-AD mouse model; however, no prior diffusion MRI (dMRI) study has explored the presence of BF alterations in this model. Here we investigated the ability of diffusion MRI (dMRI) to detect abnormalities in BF microstructure for the 3xTg-AD mouse model, along with related pathology in the hippocampus (HP) and white matter (WM) tracks comprising the septo-hippocampal pathway. 3xTg-AD and normal control (NC) mice were imaged in vivo using the specific dMRI technique known as diffusional kurtosis imaging (DKI) at 2, 8, and 15 months of age, and 8 dMRI parameters were measured at each time point. Our results revealed significant lower dMRI values in the BF of 2 months-old 3xTg-AD mice compared with NC mice, most likely related to the increased number of ChAT neurons seen in this AD mouse model at this age. They also showed significant age-related dMRI changes in the BF of both groups between 2 and 8 months of age, mainly a decrease in fractional anisotropy and axial diffusivity, and an increase in radial kurtosis. These dMRI changes in the BF may be reflecting the complex aging and pathological microstructural changes described in this region. Group differences and age-related changes were also observed in the HP, fimbria (Fi) and fornix (Fx). In the HP, diffusivity values were significantly higher in the 2 months-old 3xTg-AD mice, and the HP of NC mice showed a significant increase in axial kurtosis after 8 months, reflecting a normal pattern of increased fiber density complexity, which was not seen in the 3xTg-AD mice. In the Fi, mean and radial diffusivity values were significantly higher, and fractional anisotropy, radial kurtosis and kurtosis fractional anisotropy were significantly lower in the 2 months-old 3xTg-AD mice. The age trajectories for both NC and TG mice in the Fi and Fx were similar between 2 and 8 months, but after 8 months there was a significant decrease in diffusivity metrics associated with an increase in kurtosis metrics in the 3xTg-AD mice. These later HP, Fi and Fx dMRI changes probably reflect the growing number of dystrophic neurites and AD pathology progression in the HP, accompanied by WM disruption in the septo-hippocampal pathway. Our results demonstrate that dMRI can detect early cytoarchitectural abnormalities in the BF, as well as related aging and neurodegenerative changes in the HP, Fi and Fx of the 3xTg-AD mice. Since DKI is widely available on clinical scanners, these results also support the potential of the considered dMRI parameters as in vivo biomarkers for AD disease progression.
Keywords: Diffusion MRI, Diffusional Kurtosis Imaging, 3xTg-AD mouse, white matter, cholinergic basal forebrain, Alzheimer’s disease
1. Introduction
The basal forebrain (BF) region comprises of the ventral basal ganglia, nucleus basalis, substantia innominate, the diagonal band of Broca (vertical (VDB) and horizontal (HDB)) and the medial septal nucleus (MS) [1]. This highly complex brain region contains a heterogeneous mixture of neuron types that differ in morphology, neurotransmitter content and projection pattern; they are aggregated and non-aggregated cholinergic, GABAergic, glutamatergic and various calcium binding protein containing neurons [1]. The cholinergic basal forebrain (CBF) provides the major cholinergic innervation to the cerebral cortex and hippocampus, and the cholinergic and GABAergic neurons at the MS/VDB complex projects to the hippocampus and receive projections back through the fimbria-fornix bundles, forming the septo-hippocampal pathway [2,3].
The CBF system is involved in the cognitive processing of memory and attention through inputs to the cortex and hippocampus [4–6], and it is known to undergo neurodegenerative alterations during normal aging and in Alzheimer’s disease (AD) [7,8]. Indeed, degeneration of the CBF with loss of cholinergic innervation to the cortex and hippocampus substantially contribute to cognitive decline in AD, as described in the cholinergic hypothesis for the AD pathogenesis [9,10]. Some studies even demonstrate the presence of BF cholinergic neuron abnormalities very early in aging and in the course of AD [11]. Additionally, several human studies have shown that atrophy of the basal forebrain, as measured by a reduced volume in structural MRI, precedes and predicts clinical decline in mild cognitive impairment and even in individuals who have not yet been diagnosed with cognitive impairment [12–16].
The CBF system has been evaluated in biochemical, morphological and imaging studies of mouse models of AD with inconsistent findings [17–21]. Although most mouse models of AD over-expressing mutant APP and/or PS1 genes display an age-dependent Aβ deposition, cortical and hippocampal cholinergic fiber degeneration and memory deficits, some studies report that these changes are not accompanied by a loss of cholinergic BF neurons [18,19]. Other studies, however, have reported BF structural changes in different transgenic mouse models of AD. In one study using structural MRI, Badea et al. [22] reported in the APPswe/ind mice a significant interaction between age and genotype in a variety of brain regions including the MS. In another study, using both structural and diffusion MRI (dMRI), Badea et al. [23] reported in the CVN-AD mice volume decrease for several brain regions including a brain circuit that comprises of the MS, hippocampus, fimbria and fornix. Recently, it has been reported in the 5xFAD mouse model that the septo-hippocampal pathway begins to degenerate before the onset of cognitive impairment (in 4.5-month-old mice) [24]. Furthermore, in this model, significant cholinergic neuronal loss of the MS has been demonstrated in the 6-month-old mice, a time when these mice present with cognitive dysfunction [25].
The triple transgenic mouse model of AD (3xTg-AD) is one of the most studied mouse models of AD. This model possesses the three mutations of human presenilin-1 M146V, human amyloid precursor protein Swedish mutation, and the P301L mutation of human tau, based on human mutations identified in familial AD [26]. It develops both Aβ and neurofibrillary tangles (NFTs) in a temporal and spatial pattern similar to human AD pathology [27–29]. These mice exhibit synaptic plasticity dysfunction, including long-term potentiation (LTP) deficits that occur prior to extracellular Aβ deposition, having cognitive impairment around 3–4 months of age. These observations in 3xTg-AD mice show that physiological and behavioral changes are present at an early age, even before amyloid and tau-related pathologies are observed. In this transgenic model, Perez et al. [30] reported an age-related hippocampal and cortical cholinergic neuritic dystrophy in parallel with the progression of AD pathology. They also reported an age-related reduction in the number of cholinergic neurons in the MS/VDB of these mice. Notably, this age-related reduction in the number of CBF neurons was apparently due to the greater number of MS/VDB cholinergic neurons found in the young 3xTg-AD mice.
In prior work, we showed that diffusional kurtosis imaging (DKI) is able to detect brain morphological abnormalities in the hippocampus, fimbria and fornix of young 2-month-old 3xTg-AD mice [31]. DKI is an extension of diffusion tensor imaging (DTI) that includes dMRI data acquired with stronger diffusion weightings than what is typical for DTI. In this way, DKI provides all the diffusion measures available with DTI plus additional measures related to the kurtosis of the water diffusion displacement probability density. These kurtosis measures quantify the extent to which water diffusion is non-Gaussian and are closely associated with the degree of tissue microstructural complexity [32–34]. Therefore, the goal of this study was to investigate the sensitivity of DTI and DKI in capturing the age and AD pathology induced microstructure alterations in the BF and hippocampus, as well as in the white matter (WM) tracks comprising the septo-hippocampal pathway.
2. Methods
2.1. AD mouse model
All experimental procedures were approved by the Institutional Animal Care and Use Committee at the Medical University of South Carolina (MUSC), and they were conducted in accordance with the National Institutes of Health (NIH) Guide for Care and Use of Laboratory Animals. All animals were purchased from The Jackson Laboratory. The 3xTg-AD (TG) [B6;129-Psen1tm1Mpm Tg(APPSwe, tauP301L)1Lfa/Mmjax; MMRRC Stock No: 34830-JAX|3xTg-AD] and age-matched controls (NC) [101045 B6129SF2/J] were studied at 2 (NC, n=30; TG, n=49), 8 (NC, n=17; TG, n=28) and 15 (NC, n=9; TG, n=12) months of age. The control mice are the recommended controls for genetically engineered strains generated with 129-derived embryonic stem cells and maintained on a mixed B6;129 background. All mice were housed in temperature- and humidity-controlled rooms on a 12-h light/dark cycle (lights on at 6:00 AM) in an accredited animal care facility.
2.2. MRI acquisition
Acquisition was performed as previously reported [31]. Briefly, mice were anesthetized using an isoflurane vaporizer set at the following percentages: 3% for induction, 2% during pilot scanning and data acquisition. After induction, mice were placed on a mouse holder and restrained using a mouse tooth bar (Bruker, T10146) and ear bars (Bruker, T10147) placed in the auditory canal. Compressed air was used as the carrier gas and delivered at a flow rate of 1L/min into a nose cone positioned around the tooth bar, where gases mixed with air and passed over the rodent’s nose. All animals were maintained at 37.0 ± 0.2 °C and respiration ranged between 60 and 80 breaths per minute during scanning.
The in vivo MRI experiments were all performed on a 7T Bruker Biospin 30 cm bore scanner (BioSpec 70/30 USR) running Paravision version 5.1. A 86 mm 1H quadrature volume coil (T128038) was used for signal transmission and an actively decoupled phase array coil (four channel receiver T11765) was used for signal reception. A 2-shot SE-EPI dMRI sequence was employed for the DKI acquisition [32,33]. Imaging parameters were: TR/TE = 3750/34.4 ms, δ/Δ = 5/18ms, slice thickness = 0.7 mm, 15 slices with no gap, data matrix = 128×128, image resolution = 156×156 μm2, 2 signal acquisitions, 10 b-value = 0 (b0) images, followed by 30 diffusion encoding gradient directions with 4 b-values for each gradient direction (0.5, 1.0, 1.5, and 2.0 ms/μm2) and fat suppression flip angle = 105°. Total acquisition time = 33 min.
2.3. DKI post-processing and Image analysis
DKI post-processing was performed using DKE [35] (http://nitrc.org/projects/dke). Post-processing included motion correction by aligning all DWIs to the first b=0 image using SPM12 (Wellcome Trust Centre for Neuroimaging, UCL, UK). A principal component analysis approach [36] and the method of moments [37] were used to reduce the effects of signal noise on the dMRI data. Parametric maps were obtained by fitting dMRI signal measurements to the DKI signal model for each voxel using a linearly constrained weighted linear least squares fitting algorithm, which generated the diffusion and kurtosis tensors. These two tensors were then used to calculate parametric maps for all diffusion metrics [33,34]. Figure 1 illustrates (A) the MRI slice selection, (B) a representative fractional anisotropy (FA) maps of a 2-month-old TG mouse exemplifying the selected ROIs, and (C) all diffusion metrics maps from both NC and TG mouse. In our analysis, we considered the four diffusion tensor (DT) parameters of mean diffusivity (MD), axial diffusivity (D∥), radial diffusivity (D⊥), and fractional anisotropy (FA). MD corresponds to the diffusivity averaged over all diffusion directions, D∥ corresponds to the diffusivity in the direction of the principal diffusion tensor eigenvector, D⊥ corresponds to the diffusivity averaged over all diffusion directions perpendicular to the principal diffusion tensor eigenvector, and FA quantifies the anisotropy of the diffusion tensor. We similarly considered the four diffusional kurtosis (DK) metrics of mean kurtosis (MK), axial kurtosis (K∥), radial kurtosis(K⊥), and kurtosis fractional anisotropy (KFA). These are kurtosis analogs of the DT metrics that quantify diffusional non-Gaussianity and provide complementary information about the diffusion dynamics [34,38]. All four b-values (0.5, 1.0, 1.5, 2.0 ms/μm2), for each gradient direction, were used in calculating the diffusion metrics. It is worth noting that, due to the inclusion of non-Gaussian effects, DKI yields more accurate estimates of DT metrics than does conventional DTI [39], as well as enabling a more comprehensive assessment of the diffusion microenvironment in brain tissue.
Figure 1.
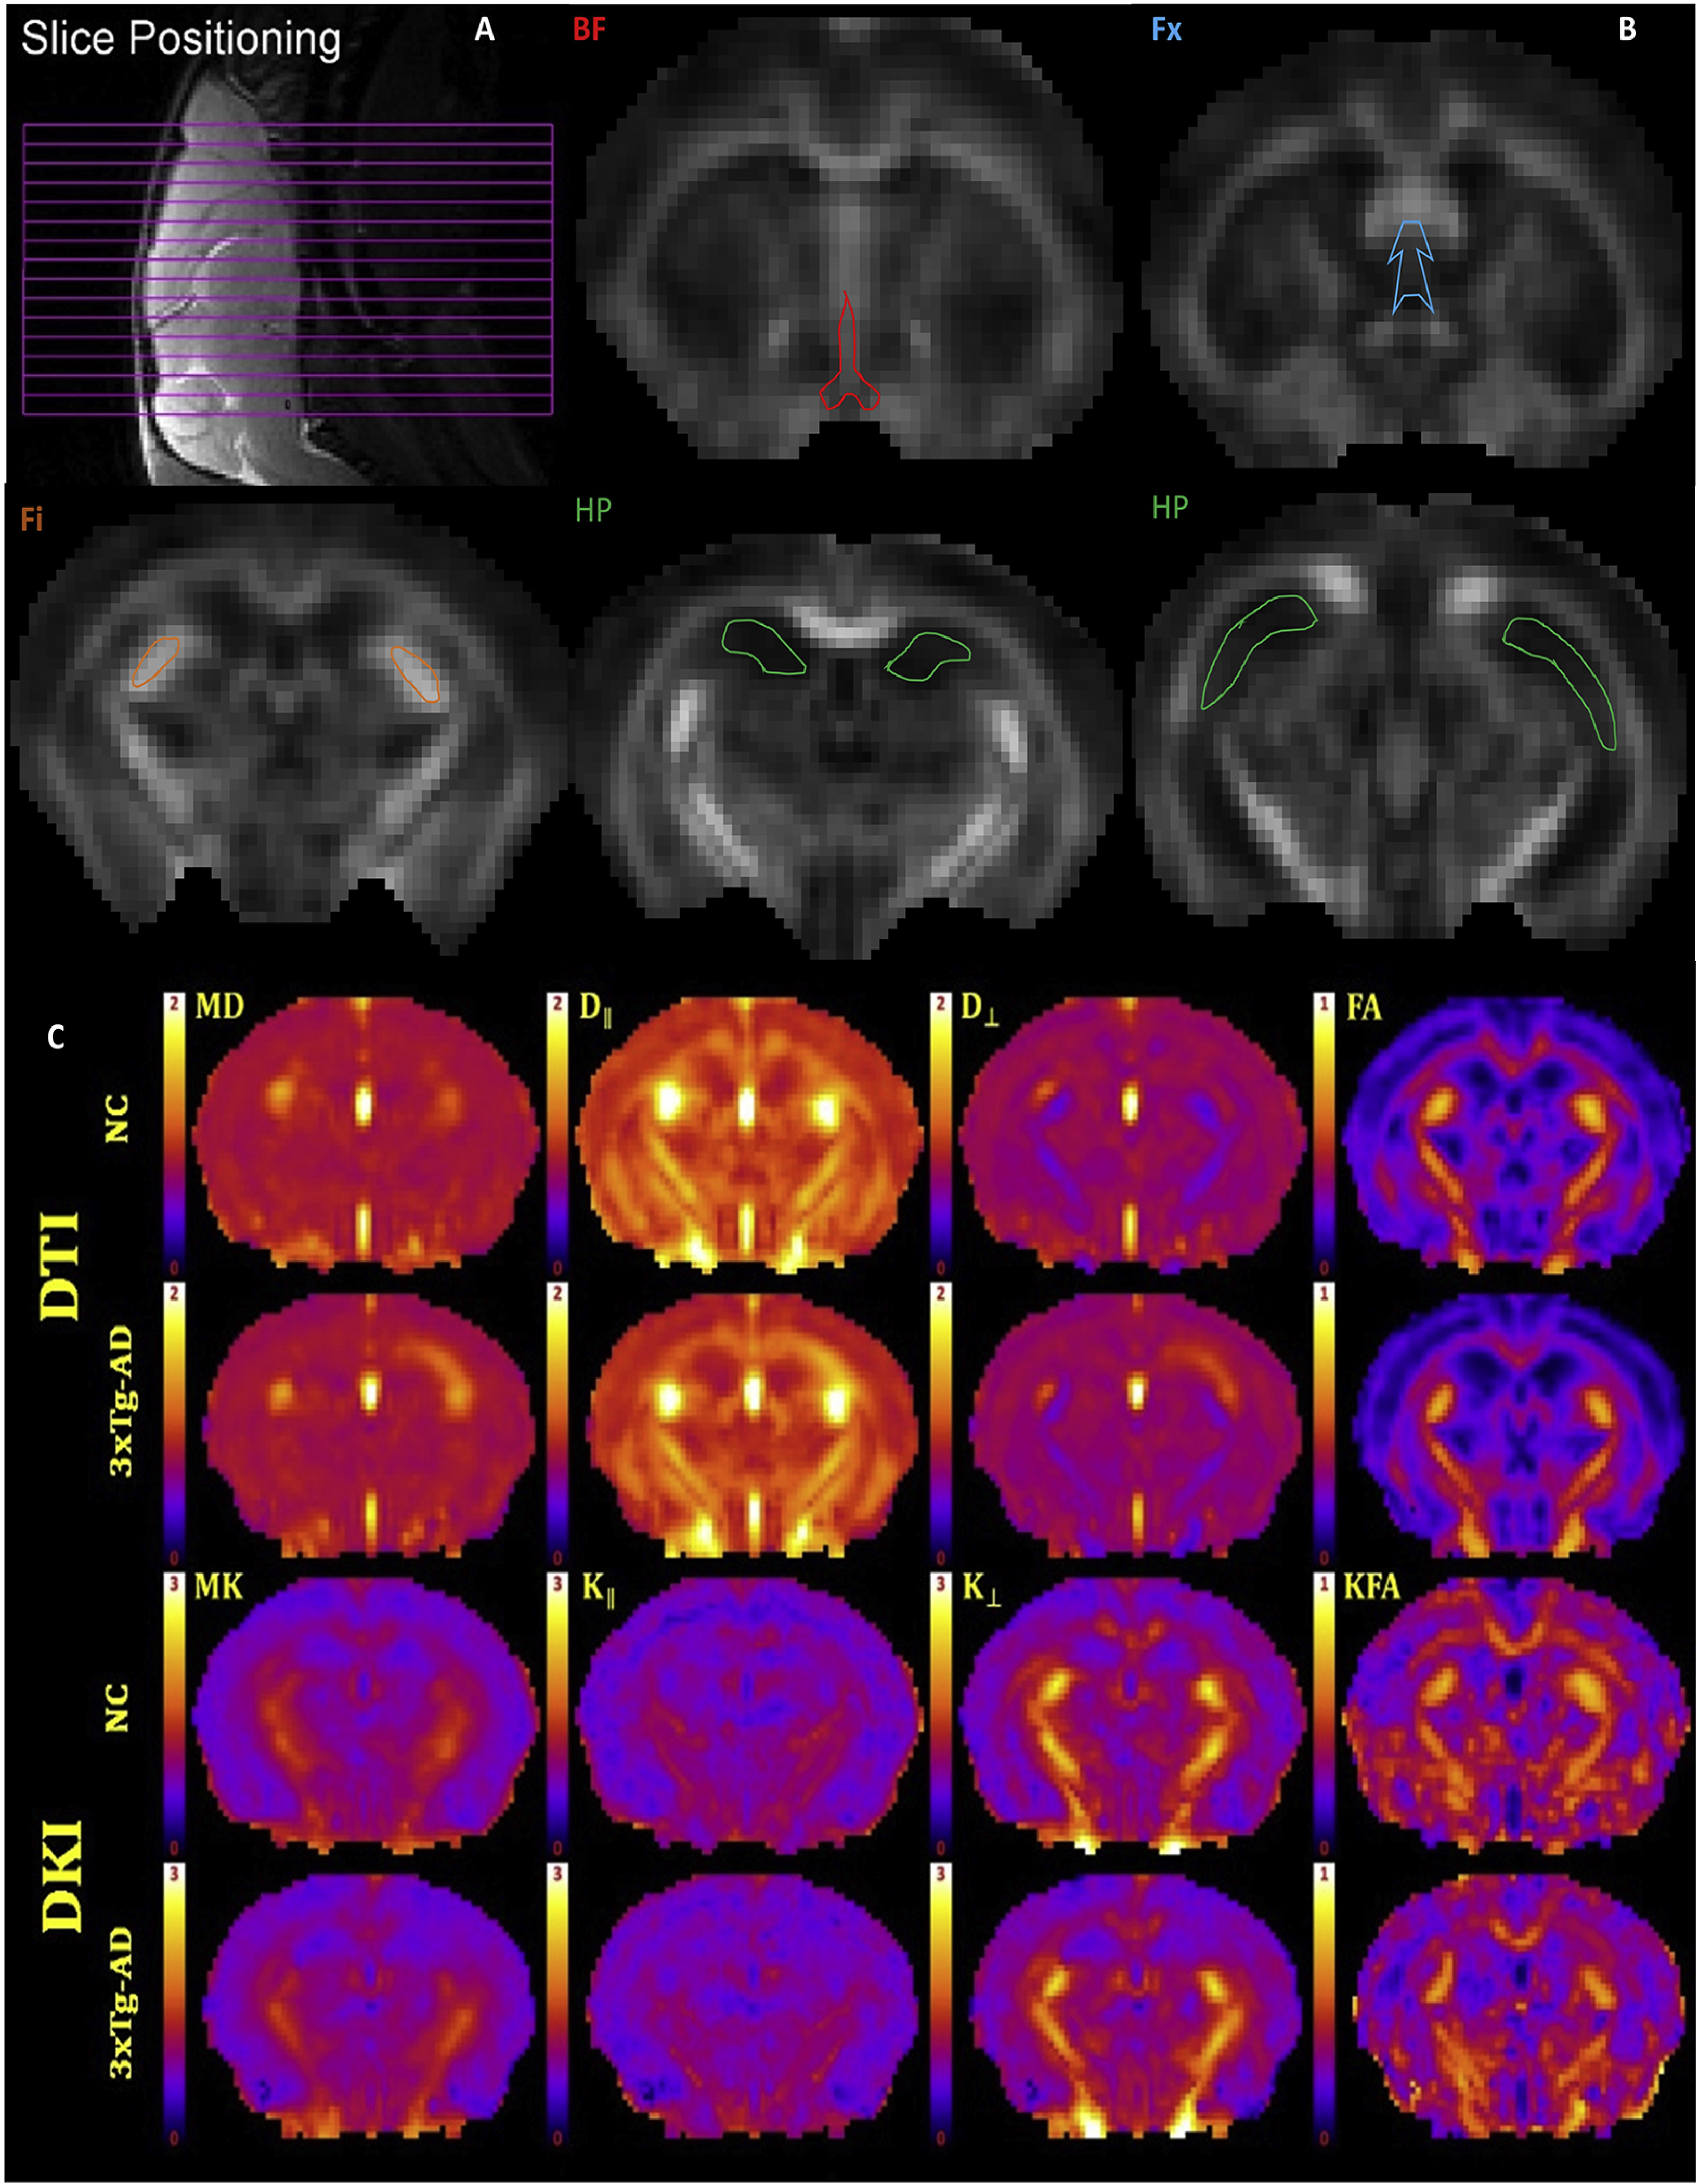
(A) Slice positioning for the 15 coronal slices. (B) Representative fractional anisotropy maps of a 2-month-old 3xTg-AD mouse illustrating the selected ROIs: basal forebrain (BF-red), fornix (Fx-blue), fimbria (Fi-orange) and hippocampus (HP-green). (C) Representative dMRI parametric maps of all diffusion metrics, for a single anatomical slice, from a normal control (NC) and a 3xTg-AD mouse. DT measures are mean diffusivity (MD), axial diffusivity (D∥), radial diffusivity (D⊥), and fractional anisotropy (FA). DK measures are mean kurtosis (MK), axial kurtosis (K∥), radial kurtosis (K⊥), and kurtosis fractional anisotropy (KFA). Scale bars: 0–1 for FA and KFA; 0–2 μm2/ms for MD, D∥ and D⊥; 0–3 for MK, K∥, and K⊥.
Regions of interest (ROIs) (Figure 1-B) were defined for basal forebrain (BF – one slice) and hippocampus (HP - four slices, including dorsal and ventral areas). Additionally, we assessed fimbria (Fi - three slices) and fornix (Fx - one slice), which are WM tracks relevant to age-related and AD pathology changes, comprising the septo-hippocampal pathway. All ROIs were manually drawn on the averaged b0 image by a neuropathologist (MFF), using ImageJ (http://imagej.nih.gov/ij//) [40]. Anatomical guidelines for outlining these regions were determined by comparing anatomical structures in the MRI slices with a standard mouse atlas [41] and verified with the FA maps to ensure correct anatomical location and to avoid contamination of unintended tissue or cerebrospinal fluid (CSF). To reduce bias when drawing the ROIs, we randomly chose mice ID numbers, which included both NC and TG mice, and sampled the same number of MRI slices for each mouse for each ROI. The regional values for the dMRI measures were obtained by averaging all voxels within an ROI except those with MD > 1.5 μm2/ms, which were excluded to minimize the effect of CSF contamination.
2.4. Statistical analyses
Summary statistics were expressed as group-averaged means ± standard error of the mean (SE). Two-tailed, two-sample t-tests were performed to assess group differences for the dMRI in each ROI. The Benjamini-Hochberg false discovery rate method [42] was used to adjust for multiple testing within each ROI. We also reported the effect size (Cohen’s d) for each dMRI metric when comparing 3×Tg-AD and NC mice.
For the longitudinal data, piecewise linear mixed effects models [43] were used to estimate the slopes for each group between 2–8 and 8–15 months of age. Three covariance structures were considered when accounting for the fact that measurements were made repeatedly over time within subjects: unstructured (empirically-based), compound symmetry (equal correlation over time), and spatial power (decreasing correlation over time), with the final selection for each ROI and dMRI metrics made using Bayesian Information Criterion fit statistics [44]. Model estimate p-values were adjusted for multiple testing using the Benjamini-Hochberg false discovery rate method42. An adjusted p-value of ≤0.05 was considered to be statistically significant. Analyses were conducted using SAS v9.4 (SAS Institute, Cary, NC).
3. Results
3.1. Group analysis
Estimates of the diffusion metrics (mean ± standard error of the mean (SE) in each ROI for each time point (2, 8 and 15 months of age) are presented in Tables 1–3 and Figures 2–5. For each brain ROI several dMRI metrics showed significant differences between the two groups at 2 and 8 months of age. In the BF, dMRI metrics values for 2-month-old TG mice were statistically different from the NC mice for D∥, FA, MK and K⊥. At 8 months, dMRI metrics values for the TG mice were statistically different from the NC for D∥, D⊥, FA and KFA. In the HP, dMRI metrics values for the 2-month-old TG mice were statistically different from the NC mice for MD, D∥, D⊥ and FA. At 8 months, the dMRI metrics values for the TG mice were statistically different from the NC mice for MD, D∥, D⊥, FA and K⊥. In the Fi, dMRI metrics values for the 2 and 8 month-old TG mice were statistically different from the NC for MD, D⊥, FA, K⊥ and KFA. In the Fx, only K⊥ in the TG mice was statistically different from the NC mice at 2 months. At 8 months, there was non-significant trends for increased MD, D⊥ and decreased of KFA in the TG mice. No statistical difference between the two groups were observed in 15-month-old mice in any ROI, for any dMRI metric.
Table 1.
Diffusion metric estimates (mean ± standard error of the mean (SE)) in each brain region of interest for the 2 months old mice. For group comparison, a two-tailed, two-sample t-test with significance at the level of p≤ 0.05 (in bold) after Benjamini-Hochberg false discovery rate was applied to correct for multiple comparisons (8 dMRI metrics compared within each ROI). Mean diffusivity (MD); axial diffusivity (D∥); radial diffusivity (D⊥); fraction anisotropy (FA); mean kurtosis (MK); axial kurtosis (K∥); radial kurtosis (K⊥); kurtosis fraction anisotropy (KFA); normal control (NC) and 3xTG-AD (TG) groups; basal forebrain (BF), hippocampus (HP), fimbria (Fi) and fornix (Fx).
| MD μm2/ms | D∥ μm2/ms | D⊥ μm2/ms | FA | MK | K∥ | K⊥ | KFA | |
|---|---|---|---|---|---|---|---|---|
|
| ||||||||
| BF | ||||||||
| NC | 0.82 ± 0.004 | 1.17 ± 0.006 | 0.65 ± 0.004 | 0.36 ± 0.004 | 1.01 ± 0.006 | 0.97 ± 0.009 | 1.12 ± 0.012 | 0.47 ± 0.006 |
| TG | 0.81 ± 0.003 | 1.12 ± 0.005 | 0.65 ± 0.003 | 0.34 ± 0.003 | 0.98 ± 0.008 | 0.94 ± 0.009 | 1.05 ± 0.011 | 0.45 ± 0.006 |
| P-values | 0.051 | <.0001 | 0.106 | <.0001 | 0.007 | 0.073 | 0.0001 | 0.071 |
| Cohen’s d | −0.51 | −1.30 | 0.38 | −1.33 | −0.63 | 0.07 | −1.00 | −0.45 |
| HP | ||||||||
| NC | 0.79 ± 0.004 | 0.88 ± 0.005 | 0.74 ± 0.003 | 0.12 ± 0.001 | 0.77 ± 0.007 | 0.78 ± 0.007 | 0.78 ± 0.007 | 0.32 ± 0.004 |
| TG | 0.80 ± 0.003 | 0.91 ± 0.005 | 0.75 ± 0.002 | 0.13 ± 0.002 | 0.76 ± 0.004 | 0.76 ± 0.004 | 0.78 ± 0.005 | 0.32 ± 0.002 |
| P-values | <.0001 | 0.003 | 0.047 | 0.003 | 0.369 | 0.134 | 0.999 | 0.999 |
| Cohen’s d | 1.00 | 0.81 | 0.53 | 0.72 | −0.25 | −0.41 | 0.03 | −0.0001 |
| Fi | ||||||||
| NC | 0.97 ± 0.007 | 1.74 ± 0.009 | 0.63 ± 0.008 | 0.59 ± 0.005 | 1.11 ± 0.008 | 0.78 ± 0.003 | 1.78 ± 0.025 | 0.60 ± 0.006 |
| TG | 1.01 ± 0.005 | 1.75 ± 0.007 | 0.58 ± 0.003 | 0.56 ± 0.003 | 1.10 ± 0.005 | 0.79 ± 0.003 | 1.70 ± 0.013 | 0.56 ± 0.003 |
| P-values | <.0001 | 0.452 | <.0001 | <.0001 | 0.452 | 0.452 | 0.013 | <.0001 |
| Cohen’s d | 1.00 | 0.19 | 1.29 | −1.34 | −0.21 | 0.17 | −0.71 | −1.40 |
| Fx | ||||||||
| NC | 0.95 ± 0.011 | 1.46 ± 0.009 | 0.70 ± 0.015 | 0.45 ± 0.009 | 1.06 ± 0.009 | 0.83 ± 0.009 | 1.40 ± 0.011 | 0.46 ± 0.010 |
| TG | 0.95 ± 0.006 | 1.46 ± 0.007 | 0.70 ± 0.009 | 0.44 ± 0.006 | 1.03 ± 0.008 | 0.82 ± 0.007 | 1.34 ± 0.012 | 0.46 ± 0.008 |
| P-values | 0.952 | 0.952 | 0.952 | 0.952 | 0.097 | 0.770 | 0.021 | 0.998 |
| Cohen’s d | 0.05 | −0.06 | 0.07 | −0.14 | −0.53 | −0.25 | −0.72 | 0.0005 |
Table 3.
Diffusion metric estimates (mean ± standard error of the mean (SD)) in each brain region of interest for the 8 months old mice. For group comparison, a two-tailed, two-sample t-test with significance at the level of p≤ 0.05 (in bold) after Benjamini-Hochberg false discovery rate was applied to correct for multiple comparisons (8 dMRI metrics compared within each ROI). Mean diffusivity (MD); axial diffusivity (D∥); radial diffusivity (D⊥); fraction anisotropy (FA); mean kurtosis (MK); axial kurtosis (K∥); radial kurtosis (K⊥); kurtosis fraction anisotropy (KFA); normal control (NC) and 3xTG-AD (TG) groups; basal forebrain (BF), hippocampus (HP), fimbria (Fi) and fornix (Fx).
| MD μm2/ms | D∥ μm2/ms | D⊥ μm2/ms | FA | MK | K∥ | K⊥ | KFA | |
|---|---|---|---|---|---|---|---|---|
|
| ||||||||
| BF | ||||||||
| NC | 0.80 ± 0.011 | 1.09 ± 0.014 | 0.65 ± 0.011 | 0.32 ± 0.009 | 1.09 ± 0.018 | 1.02 ± 0.012 | 1.17 ± 0.022 | 0.43 ± 0.012 |
| TG | 0.80 ± 0.010 | 1.07 ± 0.012 | 0.66 ± 0.011 | 0.31 ± 0.005 | 1.05 ± 0.028 | 0.99 ± 0.016 | 1.13 ± 0.037 | 0.41 ± 0.016 |
| P-values | 0.849 | 0.502 | 0.502 | 0.426 | 0.502 | 0.426 | 0.502 | 0.555 |
| Cohen’s d | 0.08 | −0.48 | 0.40 | −0.75 | −0.52 | −0.79 | −.040 | −0.31 |
| HP | ||||||||
| NC | 0.79 ± 0.013 | 0.90 ± 0.013 | 0.74 ± 0.013 | 0.13 ± 0.004 | 0.79 ± 0.011 | 0.82 ± 0.015 | 0.80 ± 0.011 | 0.35 ± 0.023 |
| TG | 0.79 ± 0.005 | 0.90 ± 0.006 | 0.73 ± 0.005 | 0.14 ± 0.003 | 0.78 ± 0.017 | 0.79 ± 0.014 | 0.80 ± 0.020 | 0.34 ± 0.012 |
| P-values | 0.959 | 0.959 | 0.959 | 0.959 | 0.959 | 0.856 | 0.959 | 0.959 |
| Cohen’s d | −0.07 | 0.14 | −0.19 | 0.43 | −0.22 | −0.75 | 0.02 | −0.15 |
| Fi | ||||||||
| NC | 1.01 ± 0.016 | 1.81 ± 0.029 | 0.62 ± 0.018 | 0.59 ± 0.012 | 1.15 ± 0.023 | 0.76 ± 0.012 | 1.88 ± 0.078 | 0.56 ± 0.011 |
| TG | 0.99 ± 0.016 | 1.78 ± 0.016 | 0.59 ± 0.017 | 0.58 ± 0.008 | 1.19 ± 0.014 | 0.78 ± 0.009 | 1.94 ± 0.040 | 0.57 ± 0.012 |
| P-values | 0.529 | 0.529 | 0.529 | 0.529 | 0.529 | 0.529 | 0.529 | 0.695 |
| Cohen’s d | −0.46 | −0.38 | −0.40 | 0.35 | 0.65 | 0.50 | 0.33 | 0.17 |
| Fx | ||||||||
| NC | 0.89 ± 0.013 | 1.46 ± 0.019 | 0.60 ± 0.016 | 0.51 ± 0.013 | 1.11 ± 0.025 | 0.85 ± 0.023 | 1.52 ± 0.040 | 0.53 ± 0.012 |
| TG | 0.88 ± 0.014 | 1.41 ± 0.017 | 0.61 ± 0.016 | 0.49 ± 0.011 | 1.15 ± 0.017 | 0.89 ± 0.012 | 1.54 ± 0.036 | 0.51 ± 0.013 |
| P-values | 0.695 | 0.328 | 0.695 | 0.422 | 0.422 | 0.328 | 0.695 | 0.525 |
| Cohen’s d | −0.23 | −0.85 | 0.17 | −0.57 | 0.61 | 0.81 | 0.19 | −0.44 |
Figure 2.
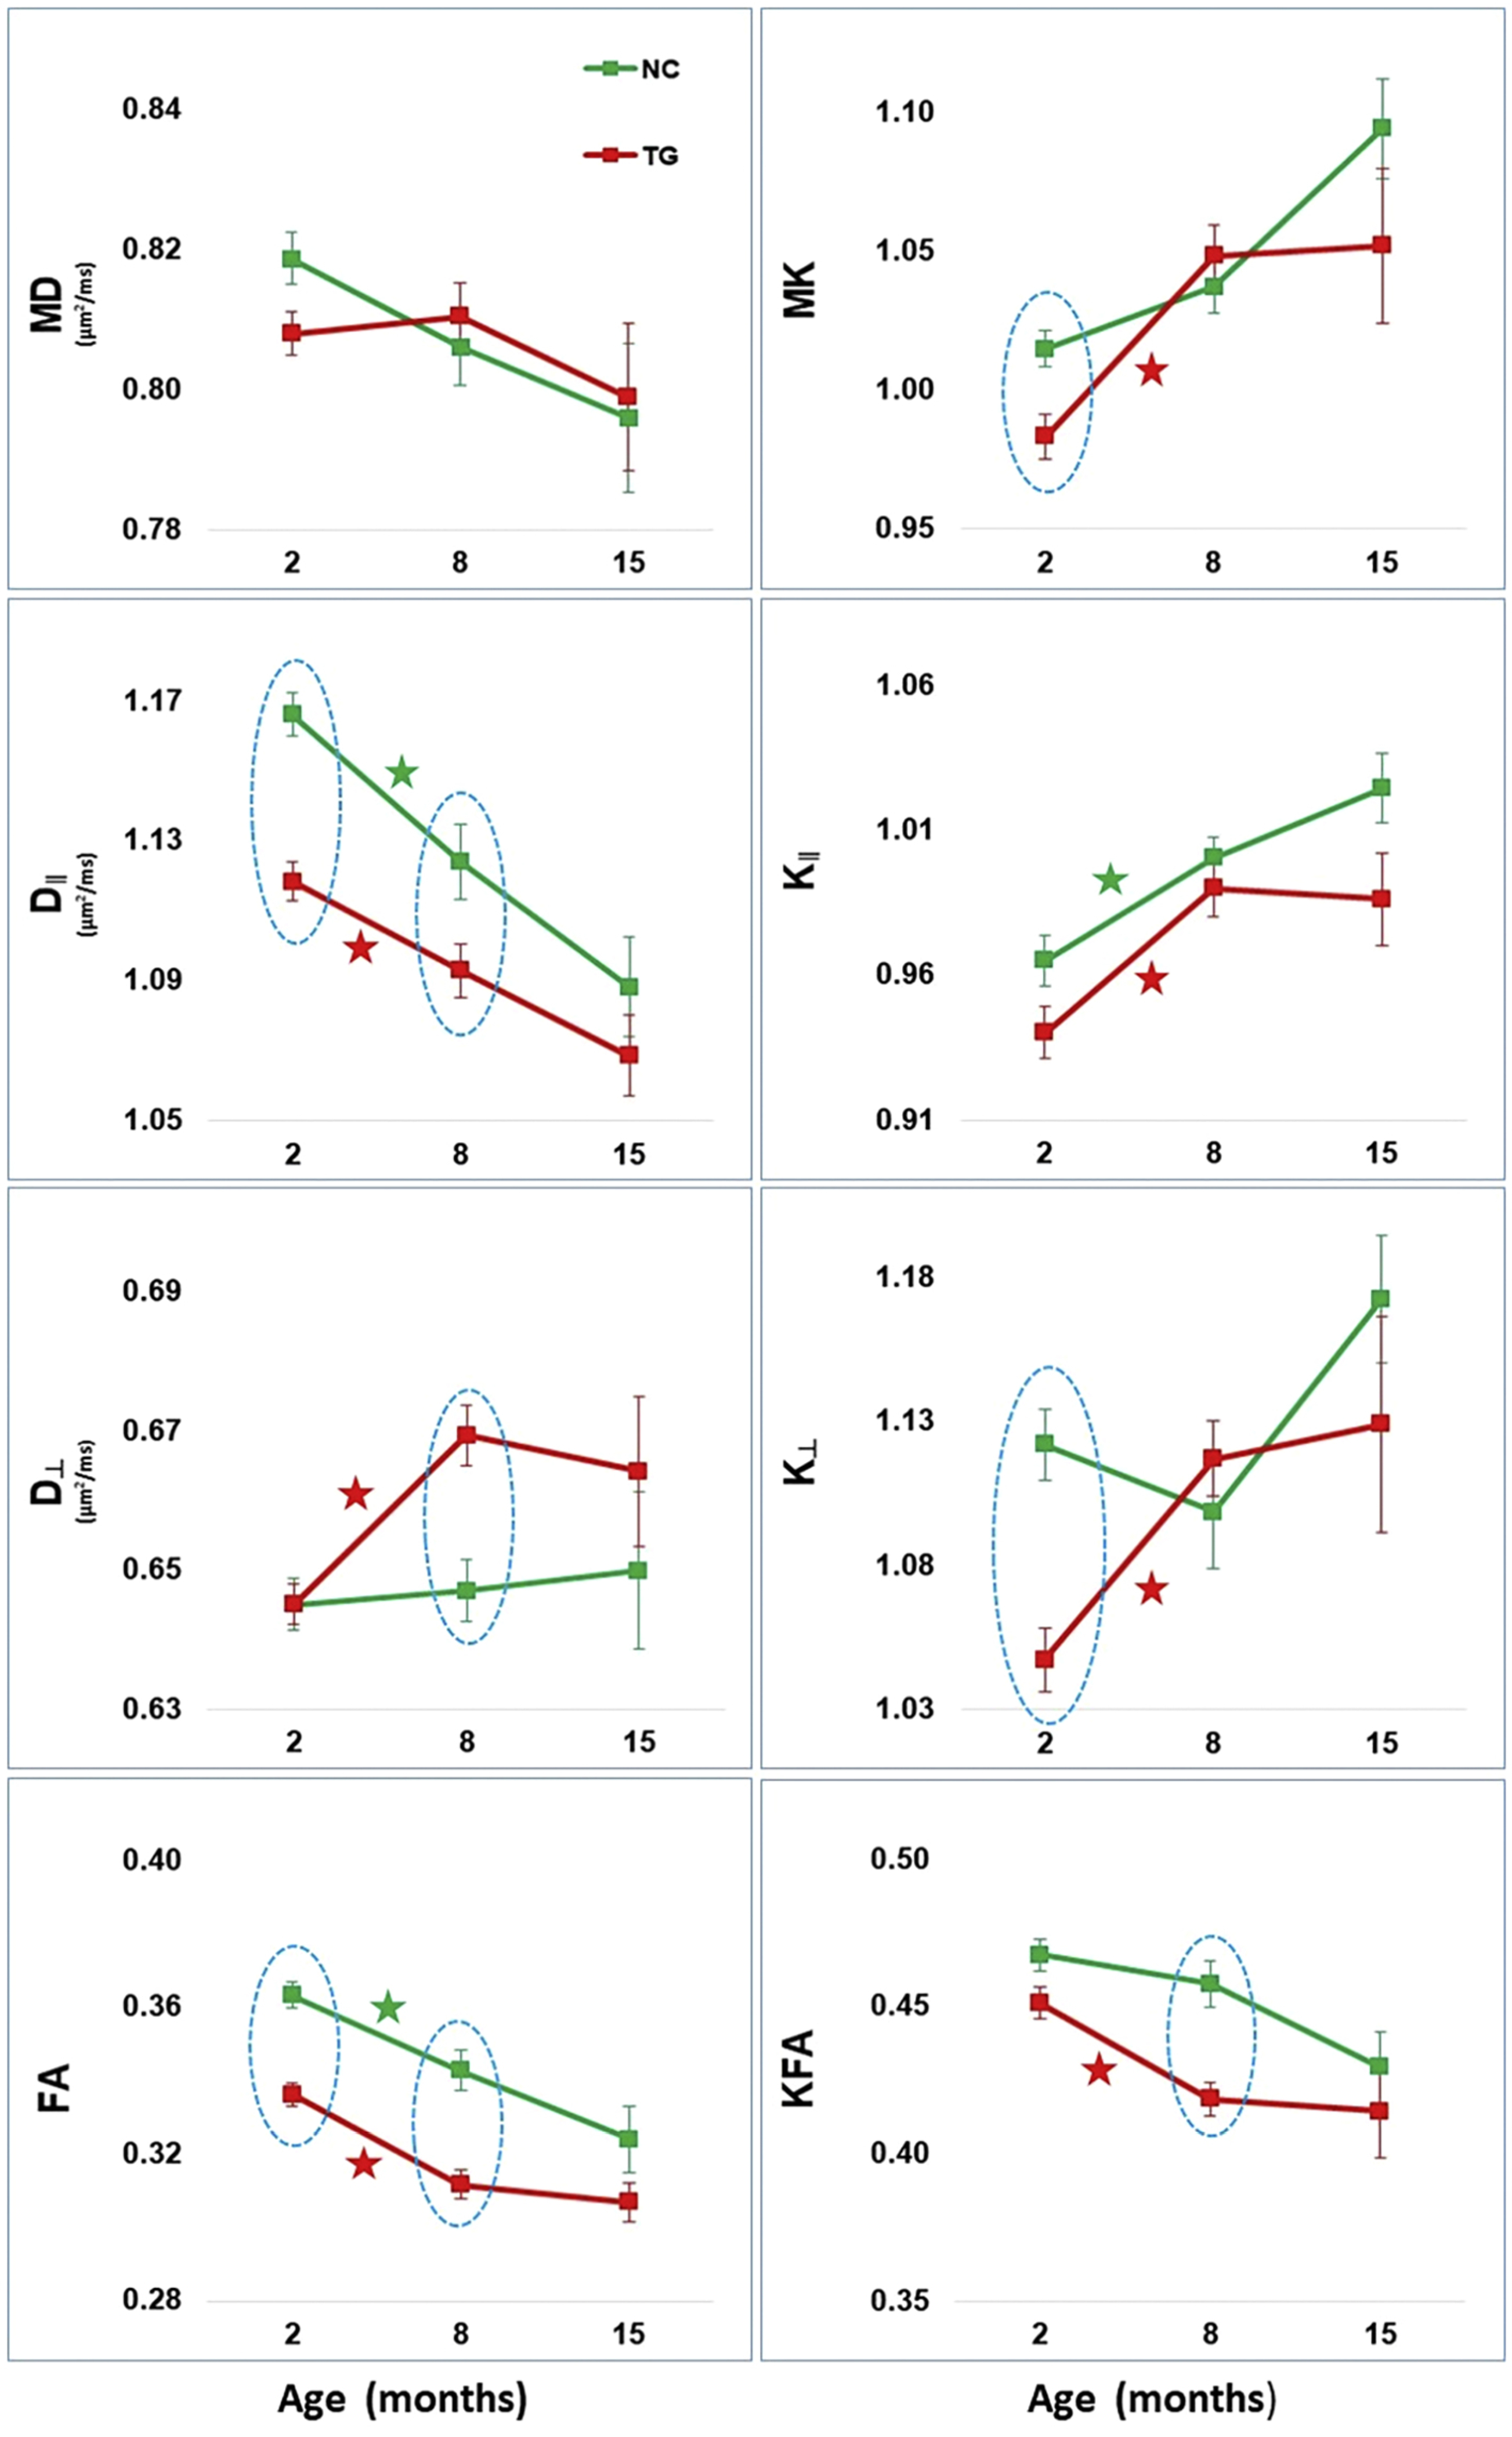
Basal Forebrain diffusion tensor (DT) and diffusional kurtosis (DK) metrics (mean ± standard error) and the slopes for each mouse group between 2–8 and 8–15 months. DT measures are mean diffusivity (MD), axial diffusivity (D∥), radial diffusivity (D⊥), and fractional anisotropy (FA). DK measures are mean kurtosis (MK), axial kurtosis (K∥), radial kurtosis (K⊥), and kurtosis fractional anisotropy (KFA). Normal control (NC - green) and 3xTG-AD (TG - red). Time points with statistically significant group differences are indicated by a light blue dotted oval shape. Between successive time points, group-specific slopes that are significantly positive (or negative) are represented by a (★) in the color of each mouse group.
Figure 5.

Fornix diffusion tensor (DT) and diffusional kurtosis (DK) metrics (mean ± standard error) and the slopes for each mouse group between months 2–8 and months 8–15. DT measures are mean diffusivity (MD), axial diffusivity (D∥), radial diffusivity (D⊥), and fractional anisotropy (FA). DK measures are mean kurtosis (MK), axial kurtosis (K∥), radial kurtosis (K⊥), and kurtosis fractional anisotropy (KFA). Normal control (NC - green) and 3xTG-AD (TG - red) groups. Time points with statistical significant group differences are indicated by a light blue dotted oval shape. Between successive time points, group-specific slopes that are significantly positive (or negative) are represented by a (★) in the color of each mouse group.
3.2. Age-related trajectories
Estimates of NC and TG mice slopes for the time period between 2–8 and 8–15 months are presented in Tables 4–5 and in Figures 2–5. In the BF (Tables 4–5 – Figure 2), there were significant age-related changes between 2 and 8 months for several dMRI metrics in both groups, but no changes were present between 8 and 15 months of age. In the HP (Table 4–5 – Figure 3), only FA increased significantly between 2 and 8 months in the TG group, and K∥ increased significantly between 8 and 15 months in the NC group. In the Fi (Table 4–5 – Figure 4) and Fx (Table 4–5 – Figure 5), there were significant age-related changes for several dMRI metrics in both groups. In the NC group, these changes occurred only between 2 and 8 months of age, but for the TG group these changes were significant both between 2 and 8 and 8 and 15 months, sometimes in opposite directions, e.g. for MD, D∥, K∥ and KFA in the Fi and for D∥ in the Fx.
Table 4.
Diffusion tensor (DT) and diffusional kurtosis (DK) metrics slope estimates in each brain region for the period of 2 to 8 months of age. Normal control (NC) and 3xTG-AD (TG) groups; S: slope estimates; SE: standard error of the slope; mean diffusivity (MD); axial diffusivity (D∥); radial diffusivity (D⊥); fraction anisotropy (FA); mean kurtosis (MK); axial kurtosis (K∥); radial kurtosis (K⊥); kurtosis fraction anisotropy (KFA); p-values at the level of p≤ 0.05 (in bold) after Benjamini-Hochberg false discovery rate applied to correct for multiple comparisons (8 dMRI metrics compared within each ROI).
| BF | S | SE | P-values | S | SE | P-values | |
|
| |||||||
| MD μm2/ms | MK | ||||||
| Slope NC | −0.00211 | 0.001258 | 0.1964 | Slope NC | 0.003877 | 0.002703 | 0.2504 |
| Slope TG | 0.000421 | 0.000982 | 0.6694 | Slope TG | 0.01079 | 0.002109 | <.0001 |
| D∥ μm2/ms | K ∥ | ||||||
| Slope NC | −0.00704 | 0.002022 | 0.0037 | Slope NC | 0.006126 | 0.002518 | 0.0477 |
| Slope TG | −0.00432 | 0.001578 | 0.0092 | Slope TG | 0.008235 | 0.001965 | 0.0002 |
| D⊥ μm2/ms | K ⊥ | ||||||
| Slope NC | 0.000239 | 0.001117 | 0.8312 | Slope NC | −0.00412 | 0.0042 | 0.4306 |
| Slope TG | 0.002708 | 0.000871 | 0.0038 | Slope TG | 0.01179 | 0.003279 | 0.001 |
| FA | KFA | ||||||
| Slope NC | −0.00307 | 0.000836 | 0.0031 | Slope NC | −0.00153 | 0.001679 | 0.4192 |
| Slope TG | −0.00369 | 0.000654 | <.0001 | Slope TG | −0.00524 | 0.00131 | 0.0003 |
|
| |||||||
| HP | S | SE | P-values | S | SE | P-values | |
|
| |||||||
| MD μm2/ms | MK | ||||||
| Slope NC | −0.00058 | 0.001055 | 0.8529 | Slope NC | −0.0005 | 0.001601 | 0.8661 |
| Slope TG | 0.000612 | 0.000824 | 0.6138 | Slope TG | 0.002793 | 0.001249 | 0.1013 |
| D∥ μm2/ms | K ∥ | ||||||
| Slope NC | 0.000206 | 0.001459 | 0.8881 | Slope NC | −0.00063 | 0.001651 | 0.8661 |
| Slope TG | 0.001786 | 0.001141 | 0.1944 | Slope TG | 0.00186 | 0.001289 | 0.3077 |
| D⊥ μm2/ms | K ⊥ | ||||||
| Slope NC | −0.00098 | 0.000892 | 0.7329 | Slope NC | −0.00069 | 0.001798 | 0.8661 |
| Slope TG | −4.83E-6 | 0.000697 | 0.9945 | Slope TG | 0.002975 | 0.001403 | 0.1013 |
| FA | KFA | ||||||
| Slope NC | 0.000938 | 0.000521 | 0.5666 | Slope NC | 0.002045 | 0.000978 | 0.1931 |
| Slope TG | 0.001325 | 0.000407 | 0.0145 | Slope TG | 0.000143 | 0.000763 | 0.9732 |
|
| |||||||
| Fi | S | SE | P-values | S | SE | P-values | |
|
| |||||||
| MD μm2/ms | MK | ||||||
| Slope NC | 0.008025 | 0.001772 | <.0001 | Slope NC | 0.006069 | 0.001857 | 0.0028 |
| Slope TG | 0.00666 | 0.001383 | <.0001 | Slope TG | 0.005122 | 0.00145 | 0.0013 |
| D∥ μm2/ms | K ∥ | ||||||
| Slope NC | 0.01672 | 0.002665 | <.0001 | Slope NC | −0.0057 | 0.001044 | <.0001 |
| Slope TG | 0.01554 | 0.00208 | <.0001 | Slope TG | −0.00674 | 0.000815 | <.0001 |
| D⊥ μm2/ms | K ⊥ | ||||||
| Slope NC | 0.003672 | 0.001727 | 0.0428 | Slope NC | 0.02136 | 0.005481 | 0.0005 |
| Slope TG | 0.002351 | 0.00135 | 0.0867 | Slope TG | 0.01676 | 0.00428 | 0.0005 |
| FA | KFA | ||||||
| Slope NC | 0.001382 | 0.001065 | 0.1992 | Slope NC | −0.00351 | 0.001271 | 0.01 |
| Slope TG | 0.001638 | 0.000831 | 0.0609 | Slope TG | −0.00333 | 0.000993 | 0.0018 |
|
| |||||||
| Fx | S | SE | P-values | S | SE | P-values | |
|
| |||||||
| MD μm2/ms | MK | ||||||
| Slope NC | −0.00943 | 0.002231 | 0.0002 | Slope NC | 0.000249 | 0.002831 | 0.9721 |
| Slope TG | −0.00492 | 0.001741 | 0.0085 | Slope TG | 0.009508 | 0.00221 | 0.0002 |
| D∥ μm2/ms | K ∥ | ||||||
| Slope NC | −0.00019 | 0.002489 | 0.9382 | Slope NC | 0.000375 | 0.002168 | 0.9721 |
| Slope TG | 0.003209 | 0.001943 | 0.1036 | Slope TG | 0.004499 | 0.001693 | 0.0114 |
| D⊥ μm2/ms | K ⊥ | ||||||
| Slope NC | −0.01418 | 0.002801 | <.0001 | Slope NC | 0.009921 | 0.004312 | 0.0396 |
| Slope TG | −0.00919 | 0.002187 | 0.0002 | Slope TG | 0.02239 | 0.003365 | <.0001 |
| FA | KFA | ||||||
| Slope NC | 0.009179 | 0.001603 | <.0001 | Slope NC | 0.01148 | 0.002441 | <.0001 |
| Slope TG | 0.007258 | 0.001253 | <.0001 | Slope TG | 0.006112 | 0.001905 | 0.0034 |
Table 5.
Diffusion tensor (DT) and diffusional kurtosis (DK) metrics slope estimates in each brain region for the period of 2 to 8 months of age. Normal control (NC) and 3xTG-AD (TG) groups; S: slope estimates; SE: standard error of the slope; mean diffusivity (MD); axial diffusivity (D∥); radial diffusivity (D⊥); fraction anisotropy (FA); mean kurtosis (MK); axial kurtosis (K∥); radial kurtosis (K⊥); kurtosis fraction anisotropy (KFA); p-values at the level of p≤ 0.05 (in bold) after Benjamini-Hochberg false discovery rate applied to correct for multiple comparisons (8 dMRI metrics compared within each ROI).
| BF | S | SE | P-values | S | SE | P-values | |
|
| |||||||
| MD μm2/ms | MK | ||||||
| Slope NC | −0.0014 | 0.001458 | 0.3881 | Slope NC | 0.008032 | 0.003201 | 0.059 |
| Slope TG | −0.00166 | 0.001219 | 0.7148 | Slope TG | 0.00075 | 0.002681 | 0.892 |
| D∥ μm2/ms | K ∥ | ||||||
| Slope NC | −0.00513 | 0.002344 | 0.0672 | Slope NC | 0.003224 | 0.002993 | 0.3684 |
| Slope TG | −0.00356 | 0.001961 | 0.5959 | Slope TG | −0.00022 | 0.002507 | 0.9295 |
| D⊥ μm2/ms | K ⊥ | ||||||
| Slope NC | 0.000546 | 0.001328 | 0.6825 | Slope NC | 0.01051 | 0.004836 | 0.0672 |
| Slope TG | −0.00063 | 0.001112 | 0.892 | Slope TG | 0.001296 | 0.004039 | 0.8561 |
| FA | KFA | ||||||
| Slope NC | −0.00291 | 0.001032 | 0.0519 | Slope NC | −0.00416 | 0.002015 | 0.0672 |
| Slope TG | −0.0007 | 0.000865 | 0.892 | Slope TG | −0.00062 | 0.001689 | 0.892 |
|
| |||||||
| HP | S | SE | P-values | S | SE | P-values | |
|
| |||||||
| MD μm2/ms | MK | ||||||
| Slope NC | 0.000842 | 0.001435 | 0.6386 | Slope NC | 0.003739 | 0.001911 | 0.1465 |
| Slope TG | −0.00267 | 0.001228 | 0.1145 | Slope TG | 0.000606 | 0.001601 | 0.7063 |
| D∥ μm2/ms | K ∥ | ||||||
| Slope NC | 0.001718 | 0.001494 | 0.5071 | Slope NC | 0.006666 | 0.001965 | 0.0097 |
| Slope TG | −0.00294 | 0.001275 | 0.1145 | Slope TG | 0.001657 | 0.001646 | 0.5086 |
| D⊥ μm2/ms | K ⊥ | ||||||
| Slope NC | 0.000413 | 0.001431 | 0.7734 | Slope NC | 0.002172 | 0.002148 | 0.4357 |
| Slope TG | −0.00252 | 0.001223 | 0.1145 | Slope TG | −0.00083 | 0.001799 | 0.7063 |
| FA | KFA | ||||||
| Slope NC | 0.001208 | 0.000606 | 0.1395 | Slope NC | 0.002359 | 0.002709 | 0.6184 |
| Slope TG | 0.000339 | 0.000508 | 0.6747 | Slope TG | 0.002554 | 0.002322 | 0.5334 |
|
| |||||||
| Fi | S | SE | P-values | S | SE | P-values | |
|
| |||||||
| MD μm2/ms | MK | ||||||
| Slope NC | −0.0011 | 0.002073 | 0.7793 | Slope NC | 0.001712 | 0.002173 | 0.6942 |
| Slope TG | −0.00869 | 0.001735 | <.0001 | Slope TG | 0.008592 | 0.001818 | <.0001 |
| D∥ μm2/ms | K ∥ | ||||||
| Slope NC | −0.00487 | 0.003117 | 0.492 | Slope NC | 0.002071 | 0.001221 | 0.492 |
| Slope TG | −0.00979 | 0.00261 | 0.0006 | Slope TG | 0.005322 | 0.001023 | <.0001 |
| D⊥ μm2/ms | K ⊥ | ||||||
| Slope NC | 0.000724 | 0.002128 | 0.735 | Slope NC | −0.00258 | 0.006661 | 0.735 |
| Slope TG | −0.00769 | 0.001785 | <.0001 | Slope TG | 0.02007 | 0.005584 | 0.001 |
| FA | KFA | ||||||
| Slope NC | −0.00169 | 0.00129 | 0.5181 | Slope NC | −0.0017 | 0.001545 | 0.5484 |
| Slope TG | 0.003641 | 0.001082 | 0.0015 | Slope TG | 0.004142 | 0.001295 | 0.0022 |
|
| |||||||
| Fx | S | SE | P-values | S | SE | P-values | |
|
| |||||||
| MD μm2/ms | MK | ||||||
| Slope NC | −0.00074 | 0.002606 | 0.9196 | Slope NC | 0.005345 | 0.003279 | 0.4328 |
| Slope TG | −0.00611 | 0.002182 | 0.0181 | Slope TG | 0.007301 | 0.002743 | 0.0198 |
| D∥ μm2/ms | K ∥ | ||||||
| Slope NC | 0.00047 | 0.002974 | 0.8749 | Slope NC | 0.003187 | 0.002536 | 0.5693 |
| Slope TG | −0.0087 | 0.002491 | 0.0069 | Slope TG | 0.00714 | 0.002122 | 0.0053 |
| D⊥ μm2/ms | K ⊥ | ||||||
| Slope NC | −0.00087 | 0.003278 | 0.9196 | Slope NC | 0.008947 | 0.005019 | 0.4328 |
| Slope TG | −0.0041 | 0.002744 | 0.1864 | Slope TG | 0.00951 | 0.004201 | 0.0433 |
| FA | KFA | ||||||
| Slope NC | 0.000464 | 0.001869 | 0.9196 | Slope NC | −0.00086 | 0.002854 | 0.9196 |
| Slope TG | 0.000078 | 0.001563 | 0.9606 | Slope TG | 0.000904 | 0.002389 | 0.8073 |
Figure 3.
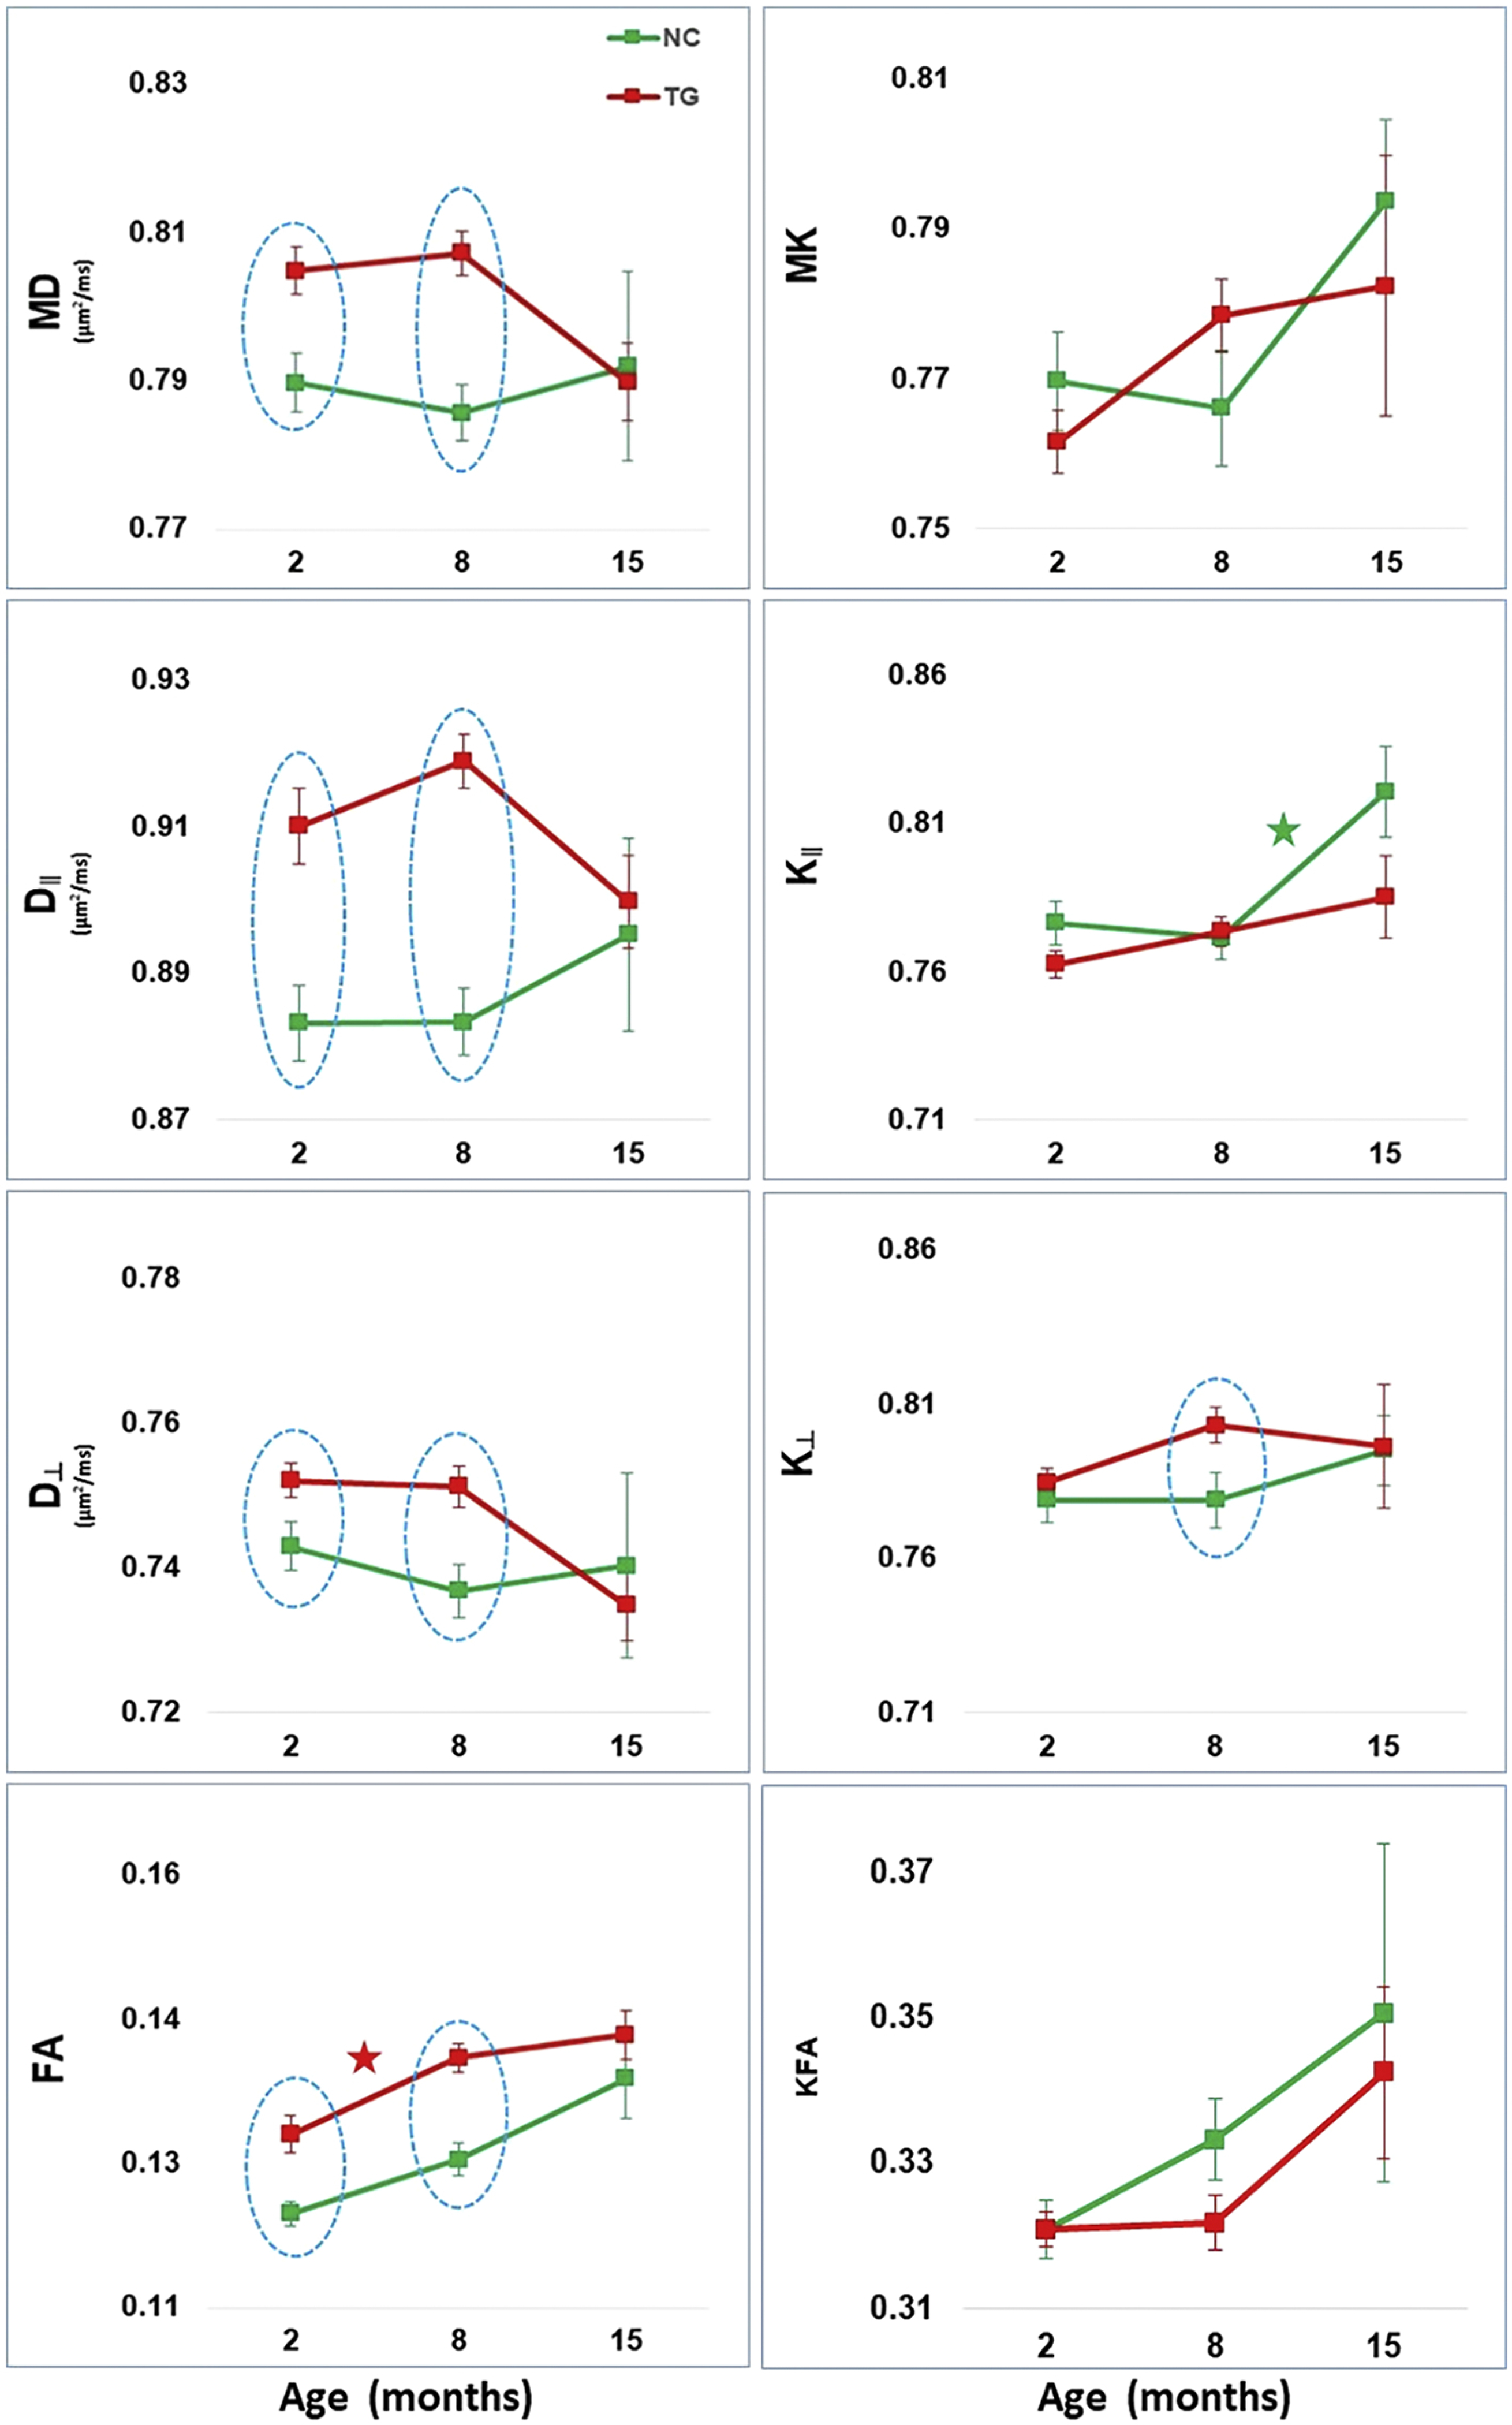
Hippocampus diffusion tensor (DT) and diffusional kurtosis (DK) metrics (mean ± standard error) and the slopes for each mouse group between 2–8 and 8–15 months. DT measures are mean diffusivity (MD), axial diffusivity (D∥), radial diffusivity (D⊥), and fractional anisotropy (FA). DK measures are mean kurtosis (MK), axial kurtosis (K∥), radial kurtosis (K⊥), and kurtosis fractional anisotropy (KFA). Normal control (NC - green) and 3xTG-AD (TG - red). Time points with statistically significant group differences are indicated by a light blue dotted oval shape. Between successive time points, group-specific slopes that are significantly positive (or negative) are represented by a (★) in the color of each mouse group.
Figure 4.

Fimbria diffusion tensor (DT) and diffusional kurtosis (DK) metrics (mean ± standard error) and the slopes for each mouse group between months 2–8 and months 8–15. DT measures are mean diffusivity (MD), axial diffusivity (D∥), radial diffusivity (D⊥), and fractional anisotropy (FA). DK measures are mean kurtosis (MK), axial kurtosis (K∥), radial kurtosis (K⊥), and kurtosis fractional anisotropy (KFA). Normal control (NC - green) and 3xTG-AD (TG - red) groups. Time points with statistically significant group differences are indicated by a light blue dotted oval shape. Between successive time points, group-specific slopes that are significantly positive (or negative) are represented by a (★) in the color of each mouse group.
4. Discussion
Our results demonstrate that dMRI is able to detect significant group (NC vs.TG) and age-associated differences in the BF, HP, Fi and Fx of both NC and TG mice. The interpretation of changes in dMRI metrics is complex, particularly when taking in account changes that occur during normal brain maturation [45–47], including axonal pruning and myelination, as well as changes that occur during the aging process [48–50] and with pathological neurodegeneration [51].
In the BF, the 2 months-old TG mice exhibited statistically significant lower values compared with NC mice for most of the dMRI metrics. Since DT metrics tends to decrease with diffusion restrictions and DK metrics tends to decrease with diffusional homogeneity, these results may be related to the increased number of cholinergic (ChAT) neurons in the BF of the TG mice at this age [18]. This increase in cellularity creates more diffusion barriers and restrictions, leading to lower DT metrics, and at the same time, a greater proportion of these larger cells (ChAT neurons) occupying this region creates a more homogenous dMRI environment, leading to lower DK metrics. Also, ChAT neurons axons are thinner, thus an increased number of this type of axons can also contribute to restricted diffusion [52]. In 8 month-old mice, changes in the dMRI metrics were generally similar to what we observed at 2 months, but no group differences were detected for the DK metrics, except for a significant lower KFA in TG mice. For the DT metrics, D∥ and FA were significant lower and D⊥ was significant higher in the TG mice. These dMRI changes may be reflecting a combination of structural integrity abnormalities detected in young TG mice, and the appearance of pathology related changes in this model at this age. Starting around 5 months, there is a progressive reduction in the number of ChAT neurons in the BF of the TG mice, which will return to similar cell numbers in aged TG mice compared with NC mice [18]. When taking in consideration the age-related changes in the BF, we observed that most of the significant changes were evident only between 2 and 8 months of age. These age-related dMRI changes may be reflecting the complex age-related alterations described in the BF, with diffuse and homogeneous depletion of ChAT neurons [53], more intense and significant in aged TG mice [18]. Although our study lacks a direct morphological correlation, we speculate based on Perez at al. [18] study, which described the BF morphological changes with age in TG mice. The decrease of ChAT neurons overtime, with loss of axons creates a more isotropic distribution of axons which is reflected in the decrease FA and KFA overtime. It also establishes a more heterogeneous environment, with progressive axonal fragmentation and increase of the diffusion barriers, which is reflected in the decrease of D∥ and in the increase of MK and K∥ overtime in both groups. There was no significant age-associated change for D⊥ and K⊥ in the NC group between 2 and 8 months of age, different from what we observed in the TG group. This may be reflecting the accentuated loss of ChAT unmyelinated axons leading to a higher proportion of GABAergic myelinated axons in this region, which stabilized after 8 months of age in the TG mice. It is noteworthy to point out that there was a trend towards increased MK, K∥ and K⊥ between 8 and 15 months for the NC group, while the TG group did not change; although it did not reach significance after adjusting for multiple comparisons, it suggests an increase in the complexity and heterogeneity of the BF in the NC mice, not apparent in the TG mice.
DT and DK metrics group differences were also detected in the HP, Fi and Fx of 2 months-old mice. In the HP, all DT metrics were significantly higher in the TG mice; in the Fi, MD and D⊥ were significantly higher and K⊥, FA, and KFA were significantly lower in the TG mice; in the Fx, only K⊥ was significantly lower in the TG mice compared to NC mice. These results are in agreement with our previous report in 2-month-old TG mice [31] and may be reflecting the previously described significant volumetric and structural integrity differences [54,55] and abnormal myelination patterns in the hippocampal complex and Fi-Fx tracks of young TG mice [56,57]. These dMRI parameter differences continue to be present at 8 months, a time where swollen cholinergic dystrophic neurites are seen in the hippocampal-septal cholinergic axonal projections [18], which increases in an age-dependent manner, in parallel with the progression of Aβ plaque and tau pathology in this model [13]. The dMRI group differences observed in the Fi and Fx may be related to a progressive loss of fibers and decrease in the density of myelinated axons in the WM tracks that forms the septo-hippocampal pathway. No group differences were detected at 15 months, but this may be due to the small sample size at this age which reduced the statistical power. Since BF provides the major cholinergic innervation to the hippocampus and receive projections back through the fimbria-fornix bundles [2], our dMRI results also indicate a relationship between the morphological changes present in the BF and HP, and the WM disruption in the septo-hippocampal pathway, even at a young age. Changes in the age-related trajectories were also observed in the Fi and Fx, but scarcely in the HP. In the HP, there was trends towards increase in MK and KFA and a significant increase in K∥ after 8 months in NC mice, reflecting a normal pattern of increased fiber density complexity, which was not seen in the TG mice. It is important to point out that aged TG mice have confounding factors related to neuroinflammation and the development of AD pathology in the HP [58,59], which may have masked the detection of age-associated dMRI changes in this region. Only future studies taking all these aspects into consideration and with a morphological correlation can definitively establish the biological interpretation for the HP dMRI changes reported in our study. In the Fi and Fx, the age trajectories for both NC and TG mice had similar progression between 2 and 8 months, except for D∥ and K∥, but after 8 months there was a significant decrease in DT metrics associated with an increase in KT metrics in the TG group. The similar dMRI metrics trajectories before 8 months are probably reflecting the progressive decrease in the BF cholinergic axons, resulting in fiber density decrease. This Fi results are in agreement with our previous study in which we studied only 4 TG mice longitudinally, reporting dMRI changes in the Fi with similar trajectory patterns [60]. The HP and the BF have reciprocal pathways; the HP receives both cholinergic and GABAergic projections from cells located in the MS/DB complex through the fimbria-fornix complex. By acting as the major output tract of the hippocampus, the fimbria-fornix fibers play an important role in the formation and consolidation of memories, and they have been shown to be vulnerable to aging as well as AD pathology [23] [61–65]. Thus, the decrease in DT metrics associated with an increase in KT metrics in the Fi and Fx of the TG mice after 8 months of age probably is a secondary effect of the increase in swollen dystrophic neurites and AD pathology progression present in the hippocampus.
This is the first longitudinal dMRI study to report age and AD pathology alterations in the BF, HP and two WM tracks (Fi and Fx) comprising the septo-hippocampal pathway. Little is known about the BF dMRI patterns in normal or transgenic mice. Only two previous studies, both in fixed mouse brain, described changes in the integrity of the BF cholinergic system detected by DTI. Kerbler et al. [66] reported a significant increase in FA, MD, D∥ and D⊥ in adult mice with ~25% loss of BF ChAT neurons compared to control animals. Their results are difficult to compare with ours since, unlike in transgenic mouse models of AD, the cholinergic degeneration was caused by the injection of the toxin saporin conjugated to an antibody to a receptor expressed by BF cholinergic neurons (p75 neurotrophin receptor). This approach has no influence from other AD pathological features, and it is a onetime point experiment, with mice being imaged only fourteen days after the injection that causes loss of the BF ChAT neurons. They also reported, using probabilistic tractography analysis of the septo-hippocampal tracts originating from the BF, an increase in streamline MD and D⊥ in lesioned mice. In the second paper, Hara et al. [21] examined the BF-hippocampal track in a tau mouse model of AD. They found that the streamlines connecting BF and hippocampus, which comprises the Fi-Fx track, were decrease in old (22 months) compared with adult mice (6 months), and these changes were associated with a decrease of cholinergic neurons. They also reported a decrease in FA at the level of the BF in old mice, with no changes in D∥ and D⊥. In spite of substantial methodological differences between our study and theirs, we also detected an age-related decrease in FA at the BF.
There is no previous dMRI study assessing changes in the BF in this transgenic AD mouse model. In fact, few dMRI studies [67,68] have investigated any type of brain abnormalities in this model, including our two previous DKI studies where we reported longitudinal WM microstructure changes [60] and brain abnormalities in 2-month-old TG mice [31]. Also, two structural MRI studies have reported significant volumetric differences in the hippocampus and several WM regions, including fimbria, in young TG mice [54,55]. Therefore, this study is the first to use dMRI metrics to investigate early and progressive AD pathology related morphological alterations in the BF, hippocampus, and associated WM tracks.
Our study has two important limitations. First, the relatively small number of mice at later age (15 months old), which reduced the statistical power of the data analysis. Second, our study lacks a direct correlation with morphological data. It should also be noted that some ROIs, particularly Fi and Fx, are adjacent to the ventricles, which makes them susceptible to partial volume effects of CSF. However, DK metrics are known to be less sensitive to CSF contamination [69] and we also mitigated this problem by masking all voxels with MD >1.5 μm2/ms. Thus, these results should be cautiously interpreted. Further studies are needed to confirm the underlying biological mechanisms associated with the group differences and age-associated changes detected by dMRI in the BF, HP, Fi and Fx of both NC and TG mice.
5. Conclusion:
The present in vivo dMRI study of a mouse model of AD (3xTg-AD) demonstrates that dMRI can detect early abnormalities in the BF, HP, Fi and Fx, as well as detect the neurodegenerative process present in this AD mouse model. Specifically, several of the considered dMRI measures are sensitive to changes in brain cytoarchitecture and are promising candidates as in vivo biomarkers for monitoring age-related and disease progression. Since the dMRI methods employed here are easily translatable to clinical MRI, this study also demonstrates their potential for detection of brain abnormalities in human AD patients.
Table 2.
Diffusion metric estimates (mean ± standard error of the mean (SE)) in each brain region of interest for the 8 months old mice. For group comparison, a two-tailed, two-sample t-test with significance at the level of p≤ 0.05 (in bold) after Benjamini-Hochberg false discovery rate was applied to correct for multiple comparisons (8 dMRI metrics compared within each ROI). Mean diffusivity (MD); axial diffusivity (D∥); radial diffusivity (D⊥); fraction anisotropy (FA); mean kurtosis (MK); axial kurtosis (K∥); radial kurtosis (K⊥); kurtosis fraction anisotropy (KFA); normal control (NC) and 3xTG-AD (TG) groups; basal forebrain (BF), hippocampus (HP), fimbria (Fi) and fornix (Fx).
| MD μm2/ms | D∥ μm2/ms | D⊥ μm2/ms | FA | MK | K∥ | K⊥ | KFA | |
|---|---|---|---|---|---|---|---|---|
|
| ||||||||
| BF | ||||||||
| NC | 0.81 ± 0.005 | 1.12 ± 0.011 | 0.65 ± 0.004 | 0.34 ± 0.005 | 1.04 ± 0.010 | 1.00 ± 0.007 | 1.10 ± 0.020 | 0.46 ± 0.008 |
| TG | 0.81 ± 0.005 | 1.09 ± 0.008 | 0.67 ± 0.004 | 0.31 ± 0.004 | 1.05 ± 0.011 | 0.99 ± 0.010 | 1.12 ± 0.013 | 0.42 ± 0.006 |
| P-values | 0.542 | 0.042 | 0.004 | 0.0002 | 0.542 | 0.542 | 0.542 | 0.0007 |
| Cohen’s d | 0.189 | −0.73 | 1.05 | −1.44 | 0.22 | −0.23 | 0.25 | −1.26 |
| HP | ||||||||
| NC | 0.79 ± 0.004 | 0.88 ± 0.005 | 0.74 ± 0.004 | 0.13 ± 0.002 | 0.77 ± 0.008 | 0.77 ± 0.007 | 0.78 ± 0.009 | 0.33 ± 0.006 |
| TG | 0.81 ± 0.003 | 0.92 ± 0.004 | 0.75 ± 0.003 | 0.14 ± 0.001 | 0.78 ± 0.005 | 0.77 ± 0.005 | 0.80 ± 0.006 | 0.32 ± 0.004 |
| P-values | 0.0002 | <.0001 | 0.006 | 0.0002 | 0.182 | 0.806 | 0.034 | 0.117 |
| Cohen’s d | 1.00 | 1.83 | 0.97 | 1.41 | 0.44 | 0.07 | 0.73 | −0.54 |
| Fi | ||||||||
| NC | 1.02 ± 0.011 | 1.84 ± 0.012 | 0.61 ± 0.012 | 0.60 ± 0.006 | 1.15 ± 0.012 | 0.75 ± 0.004 | 1.91 ± 0.034 | 0.58 ± 0.008 |
| TG | 1.05 ± 0.007 | 1.85 ± 0.012 | 0.65 ± 0.007 | 0.58 ± 0.004 | 1.13 ± 0.008 | 0.75 ± 0.005 | 1.81 ± 0.021 | 0.54 ± 0.005 |
| P-values | 0.028 | 0.807 | 0.003 | 0.001 | 0.442 | 0.615 | 0.014 | 0.001 |
| Cohen’s d | 0.76 | 0.07 | 1.05 | −1.19 | −0.30 | −0.19 | −0.87 | −1.26 |
| Fx | ||||||||
| NC | 0.90 ± 0.008 | 1.46 ± 0.013 | 0.61 ± 0.013 | 0.51 ± 0.009 | 1.07 ± 0.011 | 0.83 ± 0.014 | 1.45 ± 0.021 | 0.53 ± 0.011 |
| TG | 0.92 ± 0.007 | 1.48 ± 0.011 | 0.65 ± 0.009 | 0.48 ± 0.007 | 1.09 ± 0.009 | 0.85 ± 0.008 | 1.47 ± 0.015 | 0.50 ± 0.008 |
| P-values | 0.053 | 0.423 | 0.053 | 0.132 | 0.132 | 0.423 | 0.423 | 0.053 |
| Cohen’s d | 0.81 | 0.27 | 0.75 | −0.56 | 0.54 | 0.29 | 0.25 | −0.74 |
Acknowledgements:
This work was supported by the National Institutes of Health (1RF1AG057602–01) to M.F.F and J.H.J.
Footnotes
Declarations of interest: none
Publisher's Disclaimer: This is a PDF file of an unedited manuscript that has been accepted for publication. As a service to our customers we are providing this early version of the manuscript. The manuscript will undergo copyediting, typesetting, and review of the resulting proof before it is published in its final form. Please note that during the production process errors may be discovered which could affect the content, and all legal disclaimers that apply to the journal pertain.
References:
- [1].Zaborszky L, van den Pol A, Gyengesi E. Chapter 28 - The Basal Forebrain Cholinergic Projection System in Mice. In: Watson C, Paxinos G, Puelles L, editors. Mouse Nerv. Syst, San Diego: Academic Press; 2012, p. 684–718. doi: 10.1016/B978-0-12-369497-3.10028-7. [DOI] [Google Scholar]
- [2].Khakpai F, Nasehi M, Haeri-Rohani A, Eidi A, Zarrindast MR. Septo-hippocampo-septal loop and memory formation. Basic Clin Neurosci 2013;4:5–23. [PMC free article] [PubMed] [Google Scholar]
- [3].Muller C, Remy S. Septo-hippocampal interaction. Cell Tissue Res 2018;373:565–75. doi: 10.1007/s00441-017-2745-2. [DOI] [PMC free article] [PubMed] [Google Scholar]
- [4].Ballinger EC, Ananth M, Talmage DA, Role LW. Basal Forebrain Cholinergic Circuits and Signaling in Cognition and Cognitive Decline. Neuron 2016;91:1199–218. doi: 10.1016/j.neuron.2016.09.006. [DOI] [PMC free article] [PubMed] [Google Scholar]
- [5].Blake MG, Boccia MM. Basal Forebrain Cholinergic System and Memory. Curr Top Behav Neurosci 2018;37:253–73. doi: 10.1007/7854_2016_467. [DOI] [PubMed] [Google Scholar]
- [6].Zaborszky L, Gombkoto P, Varsanyi P, Gielow MR, Poe G, Role LW, et al. Specific Basal Forebrain-Cortical Cholinergic Circuits Coordinate Cognitive Operations. J Neurosci 2018;38:9446–58. doi: 10.1523/JNEUROSCI.1676-18.2018. [DOI] [PMC free article] [PubMed] [Google Scholar]
- [7].Schliebs R, Arendt T. The significance of the cholinergic system in the brain during aging and in Alzheimer’s disease. J Neural Transm 2006;113:1625–44. doi: 10.1007/s00702-006-0579-2. [DOI] [PubMed] [Google Scholar]
- [8].Auld DS, Kornecook TJ, Bastianetto S, Quirion R. Alzheimer’s disease and the basal forebrain cholinergic system: relations to beta-amyloid peptides, cognition, and treatment strategies. Prog Neurobiol 2002;68:209–45. doi: 10.1016/s0301-0082(02)00079-5. [DOI] [PubMed] [Google Scholar]
- [9].Dumas JA, Newhouse PA. The cholinergic hypothesis of cognitive aging revisited again: cholinergic functional compensation. Pharmacol Biochem Behav 2011;99:254–61. doi: 10.1016/j.pbb.2011.02.022. [DOI] [PMC free article] [PubMed] [Google Scholar]
- [10].Terry AV Jr., Buccafusco JJ. The cholinergic hypothesis of age and Alzheimer’s disease-related cognitive deficits: recent challenges and their implications for novel drug development. J Pharmacol Exp Ther 2003;306:821–7. doi: 10.1124/jpet.102.041616. [DOI] [PubMed] [Google Scholar]
- [11].Geula C, Nagykery N, Nicholas A, Wu CK. Cholinergic neuronal and axonal abnormalities are present early in aging and in Alzheimer disease. J Neuropathol Exp Neurol 2008;67:309–18. doi: 10.1097/NEN.0b013e31816a1df3. [DOI] [PMC free article] [PubMed] [Google Scholar]
- [12].Teipel SJ, Flatz WH, Heinsen H, Bokde AL, Schoenberg SO, Stockel S, et al. Measurement of basal forebrain atrophy in Alzheimer’s disease using MRI. Brain 2005;128:2626–44. doi: 10.1093/brain/awh589. [DOI] [PubMed] [Google Scholar]
- [13].Grothe M, Heinsen H, Teipel SJ. Atrophy of the cholinergic Basal forebrain over the adult age range and in early stages of Alzheimer’s disease. Biol Psychiatry 2012;71:805–13. doi: 10.1016/j.biopsych.2011.06.019. [DOI] [PMC free article] [PubMed] [Google Scholar]
- [14].Grothe M, Heinsen H, Teipel S. Longitudinal measures of cholinergic forebrain atrophy in the transition from healthy aging to Alzheimer’s disease. Neurobiol Aging 2013;34:1210–20. doi: 10.1016/j.neurobiolaging.2012.10.018. [DOI] [PMC free article] [PubMed] [Google Scholar]
- [15].Wolf D, Grothe M, Fischer FU, Heinsen H, Kilimann I, Teipel S, et al. Association of basal forebrain volumes and cognition in normal aging. Neuropsychologia 2014;53:54–63. doi: 10.1016/j.neuropsychologia.2013.11.002. [DOI] [PubMed] [Google Scholar]
- [16].Brueggen K, Dyrba M, Barkhof F, Hausner L, Filippi M, Nestor PJ, et al. Basal Forebrain and Hippocampus as Predictors of Conversion to Alzheimer’s Disease in Patients with Mild Cognitive Impairment - A Multicenter DTI and Volumetry Study. J Alzheimers Dis 2015;48:197–204. doi: 10.3233/JAD-150063. [DOI] [PubMed] [Google Scholar]
- [17].Jaffar S, Counts SE, Ma SY, Dadko E, Gordon MN, Morgan D, et al. Neuropathology of mice carrying mutant APP(swe) and/or PS1(M146L) transgenes: alterations in the p75(NTR) cholinergic basal forebrain septohippocampal pathway. Exp Neurol 2001;170:227–43. doi: 10.1006/exnr.2001.7710. [DOI] [PubMed] [Google Scholar]
- [18].Perez SE, Dar S, Ikonomovic MD, DeKosky ST, Mufson EJ. Cholinergic forebrain degeneration in the APPswe/PS1DeltaE9 transgenic mouse. Neurobiol Dis 2007;28:3–15. doi: 10.1016/j.nbd.2007.06.015. [DOI] [PMC free article] [PubMed] [Google Scholar]
- [19].Bearer EL, Manifold-Wheeler BC, Medina CS, Gonzales AG, Chaves FL, Jacobs RE. Alterations of functional circuitry in aging brain and the impact of mutated APP expression. Neurobiol Aging 2018;70:276–90. doi: 10.1016/j.neurobiolaging.2018.06.018. [DOI] [PMC free article] [PubMed] [Google Scholar]
- [20].Cranston AL, Wysocka A, Steczkowska M, Zadrozny M, Palasz E, Harrington CR, et al. Cholinergic and inflammatory phenotypes in transgenic tau mouse models of Alzheimer’s disease and frontotemporal lobar degeneration. Brain Commun 2020;2:fcaa033. doi: 10.1093/braincomms/fcaa033. [DOI] [PMC free article] [PubMed] [Google Scholar]
- [21].Hara Y, Motoi Y, Hikishima K, Mizuma H, Onoe H, Matsumoto SE, et al. Involvement of the Septo-Hippocampal Cholinergic Pathway in Association with Septal Acetylcholinesterase Upregulation in a Mouse Model of Tauopathy. Curr Alzheimer Res 2017;14:94–103. doi: 10.2174/1567205013666160602235800. [DOI] [PubMed] [Google Scholar]
- [22].Badea A, Johnson GA, Jankowsky JL. Remote sites of structural atrophy predict later amyloid formation in a mouse model of Alzheimer’s disease. Neuroimage 2010;50:416–27. doi: 10.1016/j.neuroimage.2009.12.070. [DOI] [PMC free article] [PubMed] [Google Scholar]
- [23].Badea AK, Kane L, Anderson RJ, Qi Y, Foster M, Cofer GP, et al. The fornix provides multiple biomarkers to characterize circuit disruption in a mouse model of Alzheimer’s disease. Neuroimage 2016;142:498–511. doi: 10.1016/j.neuroimage.2016.08.014. [DOI] [PMC free article] [PubMed] [Google Scholar]
- [24].Kim S, Nam Y, Jeong YO, Park HH, Lee SK, Shin SJ, et al. Topographical Visualization of the Reciprocal Projection between the Medial Septum and the Hippocampus in the 5XFAD Mouse Model of Alzheimer’s Disease. Int J Mol Sci 2019;20. doi: 10.3390/ijms20163992. [DOI] [PMC free article] [PubMed] [Google Scholar]
- [25].Devi L, Ohno M. Phospho-eIF2alpha level is important for determining abilities of BACE1 reduction to rescue cholinergic neurodegeneration and memory defects in 5XFAD mice. PLoS One 2010;5:e12974. doi: 10.1371/journal.pone.0012974. [DOI] [PMC free article] [PubMed] [Google Scholar]
- [26].Sterniczuk R, Dyck RH, Laferla FM, Antle MC. Characterization of the 3xTg-AD mouse model of Alzheimer’s disease: part 1. Circadian changes. Brain Res 2010;1348:139–48. doi: 10.1016/j.brainres.2010.05.013. [DOI] [PubMed] [Google Scholar]
- [27].Oddo S, Caccamo A, Shepherd JD, Murphy MP, Golde TE, Kayed R, et al. Triple-transgenic model of Alzheimer’s disease with plaques and tangles: intracellular Abeta and synaptic dysfunction. Neuron 2003;39:409–21. doi: 10.1016/S0896-6273(03)00434-3. [DOI] [PubMed] [Google Scholar]
- [28].Oddo S, Caccamo A, Kitazawa M, Tseng BP, LaFerla FM. Amyloid deposition precedes tangle formation in a triple transgenic model of Alzheimer’s disease. Neurobiol Aging 2003;24:1063–70. doi: 10.1016/j.neurobiolaging.2003.08.012. [DOI] [PubMed] [Google Scholar]
- [29].Oddo S, Caccamo A, Tran L, Lambert MP, Glabe CG, Klein WL, et al. Temporal profile of amyloid-beta (Abeta) oligomerization in an in vivo model of Alzheimer disease. A link between Abeta and tau pathology. J Biol Chem 2006;281:1599–604. doi: 10.1074/jbc.M507892200. [DOI] [PubMed] [Google Scholar]
- [30].Perez SE, He B, Muhammad N, Oh KJ, Fahnestock M, Ikonomovic MD, et al. Cholinotrophic basal forebrain system alterations in 3xTg-AD transgenic mice. Neurobiol Dis 2011;41:338–52. doi: 10.1016/j.nbd.2010.10.002. [DOI] [PMC free article] [PubMed] [Google Scholar]
- [31].Falangola MF, Nie X, Ward R, McKinnon ET, Dhiman S, Nietert PJ, et al. Diffusion MRI detects early brain microstructure abnormalities in 2-month-old 3×Tg-AD mice. NMR Biomed 2020;33. doi: 10.1002/nbm.4346. [DOI] [PMC free article] [PubMed] [Google Scholar]
- [32].Jensen JH, Helpern JA, Ramani A, Lu H, Kaczynski K. Diffusional kurtosis imaging: the quantification of non-gaussian water diffusion by means of magnetic resonance imaging. Magn Reson Med 2005;53:1432–40. doi: 10.1002/mrm.20508. [DOI] [PubMed] [Google Scholar]
- [33].Lu H, Jensen JH, Ramani A, Helpern JA. Three-dimensional characterization of non-gaussian water diffusion in humans using diffusion kurtosis imaging. NMR Biomed 2006;19:236–47. doi: 10.1002/nbm.1020. [DOI] [PubMed] [Google Scholar]
- [34].Jensen JH, Helpern JA. MRI quantification of non-Gaussian water diffusion by kurtosis analysis. NMR Biomed 2010;23:698–710. doi: 10.1002/nbm.1518. [DOI] [PMC free article] [PubMed] [Google Scholar]
- [35].Tabesh A, Jensen JH, Ardekani BA, Helpern JA. Estimation of tensors and tensorderived measures in diffusional kurtosis imaging. Magn Reson Med 2011;65:823–36. doi: 10.1002/mrm.22655. [DOI] [PMC free article] [PubMed] [Google Scholar]
- [36].Veraart J, Novikov DS, Christiaens D, Ades-Aron B, Sijbers J, Fieremans E. Denoising of diffusion MRI using random matrix theory. Neuroimage 2016;142:394–406. doi: 10.1016/j.neuroimage.2016.08.016. [DOI] [PMC free article] [PubMed] [Google Scholar]
- [37].Gudbjartsson H, Patz S. The Rician distribution of noisy MRI data. Magn Reson Med 1995;34:910–4. doi: 10.1002/mrm.1910340618. [DOI] [PMC free article] [PubMed] [Google Scholar]
- [38].Glenn GR, Helpern JA, Tabesh A, Jensen JH. Quantitative assessment of diffusional kurtosis anisotropy. NMR Biomed 2015;28:448–59. doi: 10.1002/nbm.3271. [DOI] [PMC free article] [PubMed] [Google Scholar]
- [39].Veraart J, Poot DH, Van Hecke W, Blockx I, Van der Linden A, Verhoye M, et al. More accurate estimation of diffusion tensor parameters using diffusion Kurtosis imaging. Magn Reson Med 2011;65:138–45. doi: 10.1002/mrm.22603. [DOI] [PubMed] [Google Scholar]
- [40].Schneider CA, Rasband WS, Eliceiri KW. NIH Image to ImageJ: 25 years of image analysis. Nat Methods 2012;9:671–5. doi: 10.1038/nmeth.2089. [DOI] [PMC free article] [PubMed] [Google Scholar]
- [41].Paxinos G, Franklin KBJ. The mouse brain in stereotaxic coordinates. Compact 2n. Amsterdam ; Boston: Elsevier Academic Press; 2004. [Google Scholar]
- [42].Benjamini Yosef YH. Controlling the False Discovery Rate: A Practical and Powerful Approach to Multiple Testing. J R Stat Soc Ser B 1995;57:289–300. doi: 10.1111/j.2517-6161.1995.tb02031.x. [DOI] [Google Scholar]
- [43].Fitzmaurice GM, Laird NM, Ware JH. Applied Longitudinal Analysis. Hoboken, NJ: John Wiley & Sons; 2004. [Google Scholar]
- [44].Schwarz G Estimating the Dimension of a Model. Ann Stat 1978;6:461–4. doi: 10.1214/aos/1176344136. [DOI] [Google Scholar]
- [45].Goffinet AM, Rakic P, Goffinet AM, Rakic P. Mouse Brain Development. Springer, Berlin, Heidelberg; 2000. doi: 10.1007/978-3-540-48002-0. [DOI] [Google Scholar]
- [46].Hedley-Whyte ET, Kirschner DA. Morphological evidence of alteration in myelinstructure with maturation. Brain Res 1976;113:487–97. doi: 10.1016/0006-8993(76)90051-2. [DOI] [PubMed] [Google Scholar]
- [47].deToledo-Morrell L, Geinisman Y, Morrell F. Age-dependent alterations in hippocampal synaptic plasticity: relation to memory disorders. Neurobiol Aging 1988;9:581–90. doi: 10.1016/s0197-4580(88)80117-9. [DOI] [PubMed] [Google Scholar]
- [48].Brody H The aging brain. Acta Neurol Scand Suppl 1992;137:40–4. doi: 10.1111/j.16000-404.1992.tb05037.x. [DOI] [PubMed] [Google Scholar]
- [49].Guttmann CR, Jolesz FA, Kikinis R, Killiany RJ, Moss MB, Sandor T, et al. White matter changes with normal aging. Neurology 1998;50:972–8. doi: 10.1212/wnl.50.4.972. [DOI] [PubMed] [Google Scholar]
- [50].Raz N, Rodrigue KM. Differential aging of the brain: patterns, cognitive correlates and modifiers. Neurosci Biobehav Rev 2006;30:730–48. doi: 10.1016/j.neubiorev.2006.07.001. [DOI] [PMC free article] [PubMed] [Google Scholar]
- [51].LaFerla FM, Oddo S. Alzheimer’s disease: Abeta, tau and synaptic dysfunction. Trends Mol Med 2005;11:170–6. doi: 10.1016/j.molmed.2005.02.009. [DOI] [PubMed] [Google Scholar]
- [52].Lee HH, Papaioannou A, Kim SL, Novikov DS, Fieremans E. A time-dependent diffusion MRI signature of axon caliber variations and beading. Commun Biol 2020;3:354. doi: 10.1038/s42003-020-1050-x. [DOI] [PMC free article] [PubMed] [Google Scholar]
- [53].Altavista MC, Rossi P, Bentivoglio AR, Crociani P, Albanese A. Aging is associated with a diffuse impairment of forebrain cholinergic neurons. Brain Res 1990;508:51–9. doi: 10.1016/0006-8993(90)91116-x. [DOI] [PubMed] [Google Scholar]
- [54].Kong V, Devenyi GA, Gallino D, Ayranci G, Germann J, Rollins C, et al. Early-in-life neuroanatomical and behavioural trajectories in a triple transgenic model of Alzheimer’s disease. Brain Struct Funct 2018;223:3365–82. doi: 10.1007/s00429-018-1691-4. [DOI] [PubMed] [Google Scholar]
- [55].Chiquita S, Ribeiro M, Castelhano J, Oliveira F, Sereno J, Batista M, et al. A longitudinal multimodal in vivo molecular imaging study of the 3xTg-AD mouse model shows progressive early hippocampal and taurine loss. Hum Mol Genet 2019;28:2174–88. doi: 10.1093/hmg/ddz045. [DOI] [PMC free article] [PubMed] [Google Scholar]
- [56].Desai MK, Mastrangelo MA, Ryan DA, Sudol KL, Narrow WC, Bowers WJ. Early oligodendrocyte/myelin pathology in Alzheimer’s disease mice constitutes a novel therapeutic target. Am J Pathol 2010;177:1422–35. doi: 10.2353/ajpath.2010.100087. [DOI] [PMC free article] [PubMed] [Google Scholar]
- [57].Desai MK, Sudol KL, Janelsins MC, Mastrangelo MA, Frazer ME, Bowers WJ. Triple-transgenic Alzheimer’s disease mice exhibit region-specific abnormalities in brain myelination patterns prior to appearance of amyloid and tau pathology. Glia 2009;57:54–65. doi: 10.1002/glia.20734. [DOI] [PMC free article] [PubMed] [Google Scholar]
- [58].Lam B, Masellis M, Freedman M, Stuss DT, Black SE. Clinical, imaging, and pathological heterogeneity of the Alzheimer’s disease syndrome. Alzheimer’s Res Ther 2013;5. doi: 10.1186/alzrt155. [DOI] [PMC free article] [PubMed] [Google Scholar]
- [59].Dá Mesquita S, Ferreira AC, Sousa JC, Correia-Neves M, Sousa N, Marques F. Insights on the pathophysiology of Alzheimer’s disease: The crosstalk between amyloid pathology, neuroinflammation and the peripheral immune system. Neurosci Biobehav Rev 2016;68:547–62. doi: 10.1016/j.neubiorev.2016.06.014. [DOI] [PubMed] [Google Scholar]
- [60].Nie X, Falangola MF, Ward R, McKinnon ET, Helpern JA, Nietert PJ, et al. Diffusion MRI detects longitudinal white matter changes in the 3xTg-AD mouse model of Alzheimer’s disease. Magn Reson Imaging 2019;57:235–42. doi: 10.1016/j.mri.2018.12.003. [DOI] [PMC free article] [PubMed] [Google Scholar]
- [61].Chen DQ, Strauss I, Hayes DJ, Davis KD, Hodaie M. Age-related changes in diffusion tensor imaging metrics of fornix subregions in healthy humans. Stereotact Funct Neurosurg 2015;93:151–9. doi: 10.1159/000368442. [DOI] [PubMed] [Google Scholar]
- [62].Gonzalez-Lima F, Berndt JD, Valla JE, Games D, Reiman EM. Reduced corpus callosum, fornix and hippocampus in PDAPP transgenic mouse model of Alzheimer’s disease. Neuroreport 2001;12:2375–9. doi: 10.1097/00001756-200108080-00018. [DOI] [PubMed] [Google Scholar]
- [63].Jang SH, Cho SH, Chang MC. Age-related degeneration of the fornix in the human brain: A diffusion tensor imaging study. Int J Neurosci 2011;121:94–100. doi: 10.3109/00207454.2010.531894. [DOI] [PubMed] [Google Scholar]
- [64].Amlien IK, Fjell AM. Diffusion tensor imaging of white matter degeneration in Alzheimer’s disease and mild cognitive impairment. Neuroscience 2014;276:206–15. doi: 10.1016/j.neuroscience.2014.02.017. [DOI] [PubMed] [Google Scholar]
- [65].Chen Y, Dyakin V V., Branch CA, Ardekani B, Yang D, Guilfoyle DN, et al. In vivo MRI identifies cholinergic circuitry deficits in a Down syndrome model. Neurobiol Aging 2009;30:1453–65. doi: 10.1016/j.neurobiolaging.2007.11.026. [DOI] [PMC free article] [PubMed] [Google Scholar]
- [66].Kerbler GM, Fripp J, Rowe CC, Villemagne VL, Salvado O, Rose S, et al. Basal forebrain atrophy correlates with amyloid β burden in Alzheimer’s disease. NeuroImage Clin 2015;7:105–13. doi: 10.1016/j.nicl.2014.11.015. [DOI] [PMC free article] [PubMed] [Google Scholar]
- [67].Kastyak-Ibrahim MZ, Di Curzio DL, Buist R, Herrera SL, Albensi BC, Del Bigio MR, et al. Neurofibrillary tangles and plaques are not accompanied by white matter pathology in aged triple transgenic-Alzheimer disease mice. Magn Reson Imaging 2013;31:1515–21. doi: 10.1016/j.mri.2013.06.013. [DOI] [PubMed] [Google Scholar]
- [68].Manno FAM, Isla AG, Manno SHC, Ahmed I, Cheng SH, Barrios FA, et al. Early Stage Alterations in White Matter and Decreased Functional Interhemispheric Hippocampal Connectivity in the 3xTg Mouse Model of Alzheimer’s Disease. Front Aging Neurosci 2019;11. doi: 10.3389/fnagi.2019.00039. [DOI] [PMC free article] [PubMed] [Google Scholar]
- [69].Yang AW, Jensen JH, Hu CC, Tabesh A, Falangola MF, Helpern JA. Effect of cerebral spinal fluid suppression for diffusional kurtosis imaging. Journal of magnetic resonance imaging: JMRI. 2013;37(2):365–371. doi: 10.1002/jmri.23840 [DOI] [PMC free article] [PubMed] [Google Scholar]