


Abstract
RNA provides the framework for the assembly of some of the most intricate macromolecular complexes within the cell, including the spliceosome and the mature ribosome. The assembly of these complexes relies on the coordinated association of RNA with hundreds of trans-acting protein factors. While some of these trans-acting factors are RNA-binding proteins (RBPs), others are adaptor proteins, and others still, function as both. Defects in the assembly of these complexes results in a number of human pathologies including neurodegeneration and cancer. Here, we demonstrate that Silencing Defective 2 (SDE2) is both an RNA binding protein and also a trans-acting adaptor protein that functions to regulate RNA splicing and ribosome biogenesis. SDE2 depletion leads to widespread changes in alternative splicing, defects in ribosome biogenesis and ultimately complete loss of cell viability. Our data highlight SDE2 as a previously uncharacterized essential gene required for the assembly and maturation of the complexes that carry out two of the most fundamental processes in mammalian cells.
Graphical Abstract
Graphical Abstract.
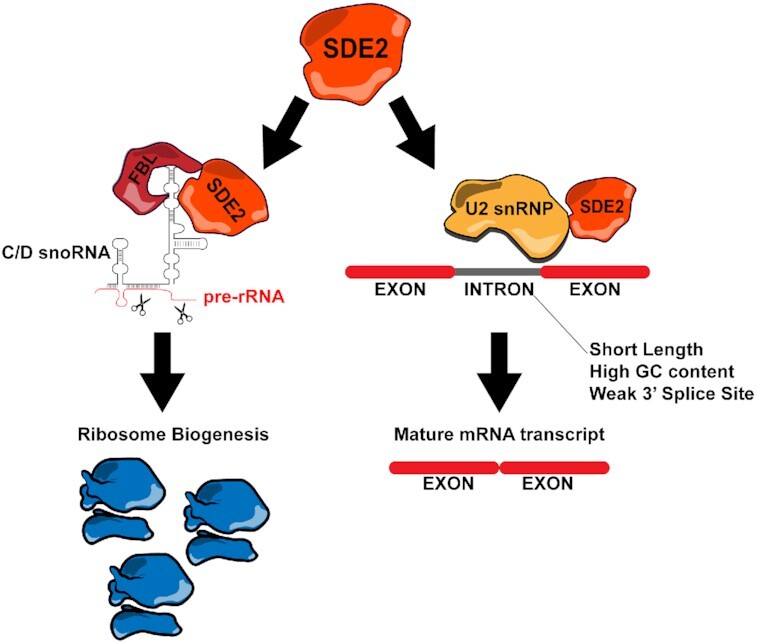
SDE2 directly interacts with C/D snoRNAs and the methyltransferase FBL to promote ribosome biogenesis. SDE2 also interacts with the U2 snRNP complex and is required for efficient pre-mRNA splicing.
INTRODUCTION
Mammalian cells contain thousands of RNA-binding proteins (RBPs) often fulfilling critical roles in a multitude of cellular processes from transcription to translation. These RBPs harbor structural domains that directly interact with their cognate RNA targets, including RNA recognition motifs (RRMs), K-Homology domains (KH), cold shock domains (CSD) or Zinc finger CCHC domains (1). However, more recent biochemical purifications of RNA have identified RBPs containing no known RNA-binding domains (2,3). These findings not only highlight unexplored protein interfaces supporting RNA binding but may also indicate novel biological functions in RNA biology. Thus, although the involvement of RBPs across cellular processes is ubiquitous, there remain many enigmatic RBPs that are yet to be functionally defined (4). Identifying these RBPs and their functions provide an opportunity to further delineate some of the most complex and energy consuming pathways in the cell including pre-mRNA splicing and ribosome biogenesis.
Ribosomes are assembled from 80 different ribosomal proteins (r-proteins) and four non-polyadenylated ribosomal RNAs (rRNAs) 18S, 5.8S, 28S and 5S through a process that requires hundreds of trans-acting factors. Three of the rRNAs (18S, 5.8S and 28s) are transcribed as a single 47S polycistronic precursor transcript from the tandem-repeat ribosomal DNA (rDNA) arrays by RNA polymerase I (Pol I). This 47S precursor undergoes a series of cleavage events and nucleolytic trimmings to remove external (5’ETS, 3’ETS) and internal (ITS1, ITS2) transcribed spacers from the transcript to generate the mature rRNAs (18S, 5.8S and 28S) (5). The rRNA maturation process relies heavily on two major classes of small nucleolar RNAs (snoRNAs), the H/ACA snoRNAs and the C/D snoRNAs. snoRNAs are bound by additional proteins to form small nucleolar ribonucleoprotein (snoRNP) complexes which function to regulate the chemical modification, folding and/or cleavage of rRNA (6). Mature rRNAs are critical for ribosome structure, with 18S rRNA essential for the formation of the small ribosomal subunit (SSU) and the 5.8S, 28S and 5S essential for formation of the large ribosomal subunit (LSU). Together, these rRNAs provide the framework for the assembly of the ribosomal proteins, and ultimately the formation of a fully functional and translationally competent ribosome. Thus, rRNA maturation is a requisite step in ribosome biogenesis that is highly dependent on an array of RBPs and snoRNAs.
The human spliceosome is similar to the ribosome in structural complexity, consisting of five small nuclear RNAs (snRNAs) (U1, U2, U4, U5 and U6) and approximately 300 protein factors (7). However, these two macromolecular machines differ in that, once assembled, ribosomal subunits are very stable while the spliceosome is assembled de novo on each substrate RNA and is disassembled once splicing is complete. The spliceosome functions to catalyze two sequential transesterification reactions that lead to the cleavage of pre-mRNA at the exon-intron boundaries, removal of the intervening intron and ligation of the adjacent exons to create a mature mRNA transcript (7,8). This process relies on the intricate coordination between the trans-acting ribonucleoprotein factors of the spliceosome and the cis-elements located on the transcript itself. The most frequently described cis-elements include the 5′ and 3′ splice sites, the branch-point sequence and the splicing regulatory elements (SREs) (7). Changes in the expression of the splicing regulatory proteins or accessibility of the cis-elements can lead to significant changes in the cellular transcriptome in the form of differential, or alternative splicing (AS) (9–12). AS not only allows for the formation of unique mature RNA isoforms from the expression of a single gene, but it also increases proteomic diversity, and likely functions to refine and coordinate complex biological processes within the cell (13,14). The physiological relevance of AS is underscored by the fact that over 90% of human transcripts undergo some form of AS (15,16).
Ribosome biogenesis and pre-mRNA splicing are essential processes within the cell that require the function of hundreds of unique RBPs and trans-acting protein factors. Approximately 25% of all known RBPs are mutated in various human diseases including neurological pathologies and cancer (17). Therefore, fully defining the catalogue of RBPs required for both pre-mRNA splicing and ribosome biogenesis is essential to our understanding of both basic biological processes and complex human diseases. Silencing defective 2 (SDE2) was originally identified in Schizosaccharomyces pombe and has since been linked to several cellular processes in eukaryotes including heterochromatin formation, telomere silencing, DNA replication and pre-mRNA processing (18–22). Here, we identify SDE2 as a previously uncharacterized RBP and trans-acting adaptor protein, with critical roles in both rRNA processing and pre-mRNA splicing. Moreover, we demonstrate that loss of SDE2 function causes defects in ribosome biogenesis, widespread changes in AS and ultimately complete loss of cellular viability.
MATERIALS AND METHODS
Cell lines
All cell lines were submitted for Short Tandem Repeat (STR) analysis by ATCC and certificates of authentication can be provided upon request. HeLa, U2OS and 293FT cells were cultured in Dulbecco’s Modified Eagle Medium (DMEM) (10% FBS, 1% penicillin/streptomycin). U2OS cells were engineered to stably express H2B-mCherry and were a gift from Dr Neil J. Ganem. RPE cells were cultured in DMEM/F12 (10% FBS, 1% penicillin/streptomycin). Cell culture media and supplements were obtained from Gibco Invitrogen and all plasticware came from Corning (Corning, NY). All cells were maintained at 37°C in a humidified incubator at 5% CO2.
Transfections and siRNA
Cells were seeded at 5 × 10⁴ cells per well in a 6-well plate and reverse transfected with ON-TARGETplus siRNA (Dharmacon). Cells were transfected with either 100 nM (non-targeting control, siSDE2-2) or 20 nM (siSDE2-1) siRNA using Lipofectamine RNAiMax diluted in Opti-MEM according to the manufacturer’s instructions. The next day, the siRNA solution was removed from cells and replaced with fresh media. Cells were collected for various downstream applications after 3 days, or collected, subjected to a second reverse transfection and plated, and collected after another 2 days (5 days total from the time of the initial reverse transfection). siRNA target sequences: siSDE2-1 (CUACUAAAUCUCAAACAGAdTdT), siSDE2-2 (GGAAGCUUGUAGAACCCAAdTdT), ON-TARGETplus Non-targeting siRNA #1 (UGGUUUACAUGUCGACUAA).
Antibodies and plasmids
The following antibodies and plasmids were used where indicated. SF3B1 (Bethyl Laboratories A300-997A), SDE2 (Bethyl Laboratories A302-098A and A302-099A), GAPDH (Santa Cruz Biotechnologies sc-47724), U2AF1 (Bethyl Laboratories A302-079A), CUL7 (Bethyl Laboratories A300-223A), PITPNM1 (Abcam AB254959), Puromycin (EMD Millipore MABE343), Histone 4 (Active Motif #39269), eIF2α (Cell Signaling Technology 9722S), Phospho- eIF2α−Ser51 (Cell Signaling Technology 9721S), 4E-BP1 (Cell Signaling Technology 9644S), Phospho-4E-BP1-Thr37/46 (Cell Signaling Technology 2855S), Cactin (Bethyl Laboratories A303-349A), FBL (Abcam ab5821), Tubulin (Cell Signaling Technology 2125S), p54 (Santa Cruz Biotechnology sc-126) and p21 (Santa Cruz Biotechnology sc-6246). The following plasmids were used: pLKO.1.
Western blotting
Western blots were performed using standard protocols. Briefly, cells were collected by trypsinization and washed with ice-cold 1× PBS. Samples were then lysed in 2× sample buffer and sonicated in a water bath at 4°C for 5 min (20-s pulse on/30-s pulse off at 100% amplitude), then boiled at 95°C for 10 min. Soluble protein lysates were then analyzed by western blot using standard SDS-PAGE techniques and transferred onto PVDF membranes. Membranes were blocked in TBS-T (1× TBS, 0.1% Tween-20) containing 5% milk for 1 h and then incubated overnight at 4°C with the appropriate primary antibodies. Following overnight incubation with primary antibodies, membranes were washed 3× in TBS-T for 10 min each, incubated with peroxidase conjugated secondary antibodies for 1 h, then washed 3× in TBS-T for 10 min each and visualized using enhanced chemiluminescence reagents from BioRad and Thermo Fisher. Zyagen Human Tissue Western Blot was probed with the indicated antibodies.
Cellular fractionation
Cells were collected by trypsinization and lysed in CSK buffer (10 mM HEPES pH 7.5, 10 mM KCl, 2 mM MgCl2, 300 mM sucrose, 10% glycerol, 0.1% Triton X-100) for 5 min on ice and then centrifuged for 5 min at 1400 × g at 4°C. The supernatant was collected and analyzed as the cytoplasmic fraction. The cell pellet was washed in CSK buffer without Triton X-100, then centrifuged for 5 min at 1400 × g at 4°C and supernatant discarded. The remaining cell pellet was then collected and analyzed as the nuclear fraction.
UV crosslinking and immunoprecipitation
CLIP was performed as previously described with the following modifications (23). Briefly, cells were UV crosslinked at 254 nm at 150 mJ/cm2. Immediately after crosslinking, cells were collected via cell lifter and pelleted. Pellet was resuspended in 1 ml lysis buffer (50 mM Tris-HCl pH 7.4, 100 mM NaCl, 1% NP-40, 0.5% sodium deoxycholate, 0.1% SDS, 1:1000 SUPERase-IN) and vortexed, then placed on ice. Next, 4 μl of Turbo DNase and 10 μl of RNase I diluted 1:500 were added to the mixture, and the solution was incubated in a thermomixer for 3 min at 37°C and 1100 rpm. Following this, 5 μl of SUPERase-IN was added and the solution was placed on ice for 3 min. Next, the solution was centrifuged for 10 min at 14,000 rpm at 4°C in a tabletop centrifuge. The resulting supernatant was then immunoprecipitated by incubation with beads for 120 min at 4°C. Beads were previously prepared by washing in lysis buffer 3×, then incubating with the appropriate antibody for 60 min at RT. Here, we used 3 μg antibody and 30 μl Dynabeads A per condition. Beads were removed from solution by magnet and washed 2× with a high salt wash (50 mM Tris-HCl pH 7.4, 1 M NaCl, 1 mM EDTA, 1% NP-40, 0.1% SDS, 0.5% sodium deoxycholate), followed by washing 3× with PNK buffer (20 mM Tris-HCl pH 7.4, 10 mM MgCl2, 0.2% Tween-20). After removing the last wash buffer, beads were incubated for 5 min with 4 μl of a radiolabeling mixture consisting of 0.2 μl T4 PNK and 0.4 μl 10x PNK Buffer, 0.4 μl gamma-32-ATP, 2.8 μl H2O and 0.2 μl SUPERase-IN. The beads were separated from the radiolabeling mixture by magnet, and the mixture was discarded. Beads were washed once more with PNK buffer. Beads were then resuspended in 30 μl Laemmli’s sample buffer and boiled for 5 min. After boiling, samples were again placed on a magnet, and the supernatant was subjected to western blotting following standard procedures. After transfer of gel to a PVDF membrane using the iBlot 2 gel transfer device, membrane was wrapped in plastic wrap and set into a light-protected radiographic film cassette. Image was developed using a GE Healthcare Typhoon FLA 7000.
eCLIP protocol and analysis
eCLIP was performed to the manufacturer’s instructions with the eCLIP Kit (Eclipse Bioinnovations #ECEK8-0001) using antibodies for SDE2 and U2AF1 listed above. eCLIP-Seq short read datasets for SDE2 and U2AF IPs and their corresponding inputs were first quality and adapter trimmed using trimmomatic (24) and then assessed for quality using FastQC (25) and MultiQC (26) packages. Trimmed libraries were analyzed using the published analytical pipeline strategy described in (27). Briefly, PCR duplicate reads were collapsed by Unique Molecular Identifier (UMI) using the umi-tools package (26). A database of repetitive elements was constructed included human RepBase sequences (28), snoRNA sequences from snoDB (29), tRNA sequences from GtRNAdb (30), snRNA sequences extracted from the GRCh38 reference human genome using the GENCODE v27 annotation coordinates for genes with biotype ‘snRNA’, and the rRNA sequences with NCBI accessions U13369.1 and NR_046235.3. Reads were aligned against the repetitive element database using STAR and reads were separated based on whether they align against this database. Reads that did not align to repetitive elements were then aligned against the GRCh38 reference genome using STAR and analyzed with the Yeo lab clipper pipeline (31) to characterize SDE2 and U2AF binding events to the non-repetitive genome.
Reads mapping to the repetitive element database were further analyzed to identify which classes and families of repetitive elements were enriched in SDE2 and U2AF IP over input. First, the Yeo lab repetitive element analysis pipeline (32) was employed to provide family level quantification of different repetitive element classes. Because this default pipeline only provides summary information on the family level, a custom analysis pipeline was developed in parallel to further characterize more detailed binding event information on a per-repetitive-sequence basis. Briefly, the reads aligned with STAR against the repetitive element database allowing a read to have 1000 multimaps were counted for each repetitive element sequence. Library size normalized counts were computed by dividing the number of aligned reads for each repetitive element by the total number of reads in each dataset. Repetitive sequence level log2 fold change was computed as the log2 ratio of normalized counts of IP versus corresponding input. Family (e.g. snoRNAs) and subfamily (e.g. SNORD3 A-D) log2 fold change was computed similarly by first summing normalized counts for each family or subfamily member and then taking the log2 ratio of IP versus input. Finally, the STAR aligned reads were consolidated into per-base pileups for each repetitive element sequence, where only the 5′ base position of each alignment was counted. This strategy yielded a base-resolution binding profile for each repetitive element that is not influenced by the repetitive nature of the sequence database. The code that implements this analysis pipeline is available at https://bitbucket.org/bucab/sde2/src/master/analysis/24_eclip.
Phenol toluol extraction (PTex)
Phenol Toluol extraction of RNA was performed as previously described (33). Briefly, cells were UV crosslinked at 254 nm at 150 mJ/cm2 and immediately collected with cell lifters. Cells were counted, and 6 × 10⁶ per condition were centrifuged and resuspended in 1 ml PBS. From here, 400 μl of cells were collected for input, and the rest were mixed with 300 μl phenol, 300 μl toluene and 200 μl 1,3-bromochloropropane (BCP). The resulting solution was shaken in a thermomixer for 1 min at 21°C and centrifuged at 17 500 × g for 3 min at 4°C. The aqueous phase was collected and mixed with 5.85 M guanidine isothiocyanate, 31.1 mM sodium citrate, 25.6 mM N-lauroyl-sarcosine and 1% 2-mercaptoethanol and mixed well. Next, 600 μl phenol and 200 μl BCP were added to this solution, and it was mixed and centrifuged as before. Approximately 3/4 of the resulting aqueous phase and 3/4 of the organic phase were removed and discarded; the remaining interphase was mixed with 200 μl 100% ethanol and 400 μl water, followed by 400 μl phenol and 200 μl BCP. The resulting solution was mixed and centrifuged as before. Again, 3/4 of the aqueous phase and 3/4 of the organic phase were removed from the solution after centrifugation. The remaining interphase was mixed with 4.5 ml of ethanol and precipitated at -80°C overnight. The next day, tubes with ethanol and the remaining interphase were centrifuged at 17 500 × g for 30 min at 4°C. Ethanol was carefully decanted and tubes dried for 5 min in the chemical fume hood, followed by resuspension in 2x Laemmli sample buffer and subsequent western blotting. To increase detection by western blot, each condition was run in duplicate (6 × 10⁶ cells per tube, 12 × 106 cells total) and combined in the last step by resuspension in 2x Laemmli sample buffer to be run in the same well by western blot.
Immunoprecipitation
5 μg of each antibody was incubated with Dynabeads Protein A (Invitrogen 1001D) suspended in NETN buffer (150 mM NaCl, 20 mM TRIS pH 8.0, 0.5 mM EDTA, 0.5% NP-40) supplemented with protease inhibitor cocktail (Sigma-Aldrich P8340) at a 1:100 ratio for one hour at room temperature with gentle rotation. Cells were lysed in NETN buffer and sonicated in a water bath at 4°C for 15 min (20-s pulse on/40-s pulse off at 50% amplitude). Lysate was centrifuged at 12 000 × g for 3 min at 4°C and supernatant was collected. Supernatant was added to Dynabeads-antibody mixture and allowed to incubate for 16 h at 4°C with gentle rotation. After incubation, beads were collected on a magnet and supernatant was discarded. Beads were further washed 3× with NETN buffer supplemented 1:100 with protease inhibitor complex. After final wash, beads were collected on a magnet, wash buffer was discarded, and beads were resuspended in standard western blot sample buffer.
Lentiviral infection
293 FT cells were seeded at a density of 5 × 10⁵ cells per well and transfected using Fugene 6 Transfection Reagent (Promega #E2691). Standard lentiviral packaging plasmids (0.5 μg pMD2.G, 1.5 μg psPAX2) and 2 μg of indicated plasmid DNA (pLKO.1 empty vector or shSDE2-30, Sigma Aldrich TRCN0000370430) were incubated with Fugene 6 diluted in Opti-MEM according to the manufacturer’s instructions. Transfection media were removed after 8 h and replaced with fresh media. Cells were allowed to proliferate for 48 h before supernatant was collected and filtered using 0.45 μm filters (Corning #431220). Viral supernatants were then directly used to infect target cells. RPE cells were seeded at 7 × 10⁴ cells per well one day prior to 293 FT viral media collection. RPE media were removed and replaced with filtered viral media (either undiluted or diluted 1:10 with DMEM/F12) from 293 FT cells. After 24 h, media were removed from RPE cells and replaced with fresh media. After a subsequent 24 h, 7 μg/ml puromycin was added to media for 72 h. After 72 h, media with puromycin were removed and replaced with fresh media, and the RPE cells were allowed to proliferate for 7 days before being counted and processed for downstream application.
RNA electrophoresis and northern blotting
5 μg of RNA in RNA loading buffer [70% v/v formamide (Fisher Scientific BP228), 7.4% v/v formaldehyde (Fisher Scientific BP531), 20 mM HEPES/5mM sodium acetate/1 mM EDTA, pH 7.0] was heated at 85°C for 10 min, followed by a 10-min incubation on ice. RNA samples were then separated on a denaturing agarose gel (1.2% agarose for high molecular weight RNA species or 2.4% agarose for low molecular weight RNA species, 7% v/v formaldehyde, in HEPES/sodium acetate/EDTA buffer) for either 6 h (2.4% agarose gel) or 16 h (1.2% agarose gel) at 55 V. Following electrophoresis, the 1.2% agarose gel was washed with water, followed by 50 mM NaOH/10 mM NaCl for 10 min, then 2.5x TBE buffer for 10 min, then 10x SSC (1.5 M NaCl,150 mM SSC) buffer. The 2.4% agarose gel was washed with water, then 10x SSC buffer for 10 min. After incubation with 10x SSC buffer, agarose gels were transferred to positively charged nylon membranes (GE Healthcare RPN 203S) in 10x SSC buffer by capillary action. After transfer, membranes were pre-hybridized for 1 h at 55°C in hybridization buffer (Invitrogen AM8669). Membranes were then incubated with DIG-labeled probe (see below) overnight at 55°C. Sequences of the probes are described in Supplementary Table S1.
DIG-labeling
Following transfer and UV crosslinking, membranes were incubated with Dig-labeled DNA probes. DNA probes were Dig-labeled following manufacturer’s protocol from Sigma-Aldrich (03353575910) and detected with Sigma-Aldrich Anti-Digoxigenin-AP (11093274910) and Sigma-Aldrich chemiluminescent substrate CDP-Star (11685627001). Images were captured and visualized using a BioRad ChemiDoc XRS + imaging system.
Immunofluorescence (IF) imaging
HeLa cells were grown on glass cover slips (Corning Cat No. 2845–22). Upon processing for IF, cells were washed in PBS, pre-extracted (in 100 mM NaCl, 300 mM sucrose, 3 mM MgCl2, 10 mM PIPES pH 7.0, 0.1% Triton X-100), washed with PBS, then fixed with 4% paraformaldehyde in PBS for 10 min at RT. The cells were then washed again with PBS and permeabilized with 0.1% Triton X-100 for 10 min at RT. Following this step, cells were washed with PBS and incubated with blocking buffer (0.5% BSA, 0.2% fish gelatin) for 1 h at RT. The cells were then incubated with FBL antibody diluted 1:250 in blocking buffer overnight in a humidified chamber at 4°C. The following day, cells were washed with PBS and incubated with secondary antibody (Abcam ab6564) diluted in blocking buffer for 45 min in a humidified chamber at RT. The cells were then washed in PBS and subjected to a final wash in 2× SSC with DAPI (Sigma-Aldrich D9542) for 10 min, followed by Vectashield (Vector Laboratories H-1000–10) treatment before mounting slides and imaging with a Zeiss LSM 710 confocal microscope. Images were visualized with FIJI Image software package.
Population doubling assays
Cells were seeded at 5 × 10⁴ cells per well and reverse transfected with the appropriate siRNAs. Cells were allowed to proliferate for 3 days. At this time, cells were collected and counted, then 5 × 10⁴ cells per well were re-seeded into a new plate and subjected to a second reverse transfection with the appropriate siRNAs. After another 3 days, cells were collected and counted, then used for downstream applications. To determine population doubling, we used the formula: Pop. Doubling = log(Nfinal/Ninitial)/log(2) where Nfinal is the cell count after 3 days and Ninitial is 5 × 10⁴ cells.
Crystal violet stain
Cells were washed twice with cold PBS, then fixed for 15 min with 100% methanol at -20°C. Methanol was removed from cells and replaced with 10% crystal violet stain, 25% methanol for 60 min. Crystal violet stain was removed from cells and cells were washed with water 6× and left to dry overnight. The next day, pictures were taken of the cells.
SUnSET assays
Cells were reverse transfected with the appropriate siRNAs as described above. Sixty minutes before collection, cells were pulsed with 10 μg/ml of puromycin. For our cycloheximide control, we added 10 μg/ml cycloheximide (Sigma Aldrich C7698) 10 min before addition of puromycin (70 min before collection of cells). Cells were then subject to standard western blotting procedures, and puromycin incorporation was detected by the anti-puromycin antibody listed above.
Polysome profiling
10–50% sucrose gradients (in polysome gradient buffer: 20 mM Tris, pH 7.5, 0.125 M NaCl, 10 mM MgCl2) were poured one day before use and kept at 4°C. HeLa cells were grown to 80% confluence, then on the day of collection, were treated with 100 μg/ml cycloheximide for 10 min, then washed twice in PBS with 100 μg/ml cycloheximide, before being collected. About 6 × 10⁶ cells were collected in each condition and lysed in polysome gradient buffer supplemented with 2 mM DTT, 100 μg/ml cycloheximide, 2% NP-40 and 1× EDTA-free protease inhibitor (Millipore-Sigma 11873580001). Cells were centrifuged for 10 min at 16 000 × g to collect the cytoplasmic fraction, and supernatant was extracted and loaded to top of sucrose gradients. Gradients and lysates were centrifuged at 100 000 × g for 2 h at 4°C in an ultracentrifuge (Beckman Coulter) with an SW41 Ti rotor. Following centrifugation, samples were fractionated into 12 fractions of roughly 1 ml volume each, using a BioLogic DuoFlow Chromatography System with continuous measurement of the absorbance at 254 nm.
Live cell imaging
U2OS cells stably expressing H2B-mCherry were grown on glass-bottom 12-well tissue culture dishes (MatTek) and transfected with either scrambled or SDE2-1 siRNAs as previously described. Cells were imaged on a Nikon TE2000-E2 inverted microscope equipped with the Nikon Perfect Focus system beginning 24–48 h following transfection. The microscope was enclosed within a temperature- and CO2-controlled environment that maintained an atmosphere of 37°C and 5% humidified CO2. Fluorescence images were captured from a single focal plane every 10 min for 4 days with a 10 × 0.5 NA Plan Fluor objective. All captured images were analyzed using NIS-Elements software.
RT-PCR amplification and gel electrophoresis
Cell pellets for each cell line or siRNA condition were collected from actively growing cells. Genomic DNA (gDNA) and total cellular RNA were then extracted from the cell pellets using the QIAamp DNA Mini Kit and RNeasy Mini Kit protocols according to manufacturer’s instructions. For RT-PCR experiments, 0.5 μg of total cellular RNA was converted to complementary DNA (cDNA) using the SuperScript IV Reverse Transcriptase protocol (Life Technologies #18090010) in a volume of 20 μl according to manufacturer’s instructions. gDNA or cDNA samples underwent three-step PCR amplification using Phusion High-Fidelity PCR Master Mix according to manufacturer’s instructions. PCR reaction parameters were as follows: (i) 0:30 at 98°C; (ii) 0:10 at 98°C; (iii) 0:30 at annealing temperature (58.5°C for ARSA and RFNG, 57.4°C for PITPNM1 and SPATA20, 64.2°C for CUL7, and 55°C for FBF1); (iv) 0:10 at 72°C; (v) repeat steps 2–4 for 31 cycles; (vi) 10:00 at 72°C; (vii) hold at 12°C. PCR products were then resolved using agarose gel electrophoresis, stained using GelRed and visualized using a BioRad ChemiDoc XRS + imaging system. Sequences of primers are described in Supplementary Table S1.
Computational alternative splicing profiling
Total RNA was extracted from three biological replicates of HeLa cells with SDE2 knockdown on day 3 and day 5, using Qiagen RNeasy Kit (Qiagen 74106). Samples were submitted to the BU Microarray and Sequencing Core for library preparation and polyadenylated RNA selection using Kapa RNA HyperPrep kit with Riboerase, and sequenced yielding 2 × 75 bp paired-end read datasets. Read library quality was assessed using FastQC (25) and MultiQC (26) packages. Illumina adapters were removed and leading and trailing low quality bases (below quality 30) were trimmed using Trimmomatic (24). Reads which were <36 bases long after these steps were dropped. Three tools were engaged in the AS profiling process: Whippet, IRFinder and rMATS.
Whippet
Annotation (GTF) only index was built using GENCODE v27 annotations (34) by Whippet (35). Trimmed reads were then aligned directly to the contiguous splice graphs built from the hg38 human reference genome, and Percent Spliced In (PSI) of each AS event was quantified. After pooling the three PSI results for each biological sample, the comparison between siSDE2-1 and control, as well as siSDE2-2 and control were implemented. For both of these comparisons, three filters were applied. The absolute difference between PSI in knockdown and in control should be >0.1. The probability of this event happening as identified by Whippet algorithm should be >0.9, and the PSI in the knockdown condition should be >0.1. The filtered results from the two comparisons were then intersected to find the significant events.
IRFinder
The IRFinder (36) reference was built from the GENCODE v27 annotations and hg38 human reference genome, prior to aligning trimmed reads to it in FASTQ mode. The resulted unsorted BAM files from the three replicates were then concatenated and pooled together for each biological sample, producing quantification of the intron retention (RI) events for siSDE2-1, siSDE-2 and control. Next, the comparisons between siSDE2-1 and control, as well as siSDE2-2 and control were analyzed using the provided script for small amounts of replicates. For both of the results, two filters were applied. Events marked as known exons or minor isoforms were removed, and events with FDR <0.05 were selected. The filtered results from the two comparisons were then intersected to find the significant events.
rMATS
Mapping the trimmed reads to the reference genome was completed via STAR (37) using the same annotation and reference genome files as noted above. The produced BAM files were then used as input for pooling and contrasting through the rMATS (38) algorithm between knockdown and control, generating quantitative results of the five AS categories. Only FDR values <0.05 were considered for further analysis.
The three sets (Whippet, IRFinder, rMATS) of overlapped results were subsequently combined to create an aggregated view with all of the AS events, after removing duplicated ones that were identified by more than one tool. The PSI in knockdown was calculated as the average of that in siSDE2-1 and siSDE2-2, and delta PSI was computed as the difference between PSI knockdown and PSI control.
Genome-wide intron identification
Only genes that have expression in at least one sample(s) were chosen for further analysis. Next, for each gene we retrieved the coordinates of the unique introns from all of the transcripts according to the GENCODE v27 annotations. Finally, only the introns with a length >30 nt were kept to eliminate inclusion of any false positive candidates that were actually indels.
Characterization of RI events
Comparison between ENCODE data and SDE2 data
The IRFinder paper accessed RNA sequencing data from 8 shRNA knockdown samples in ENCODE (39), and included a presentation of the number of both significantly increased and decreased RI events under nominal P values <0.05 for each of the experiments. The same processing was performed on the SDE2 RNA sequencing data, but only the increased RI events were selected to show in the figure, as well as those from the ENCODE data. The individual siRNAs against SDE2, the intersection of the two siRNAs, and the union of the two siRNA were included in the final result. The raw numbers were divided by the total number of all introns expressed in the genome to compute a percentage of RI.
Location of the retained introns
Two groups were involved in the comparison, the significant (Sig) events and the non-significant (Non-sig) ones. After removing events recognized as known exons and minor isoforms in both the siSDE2-1 VS control and siSDE2-2 VS control, the Sig events were selected as the intersected events that have FDR <0.05, while the Non-sig events were selected as the intersected events that have FDR ≥0.05. The locations of the RI events were computed as a fraction of the middle point of the RI in proportion to the length of the gene, with 0 representing the 5′ splice site and 1 representing the 3′ splice site.
Length of the retained introns
Three groups were included in the comparison: Sig, Non-sig and Non-AS. The last group includes all the introns in the genome except for the events in the Sig and Non-sig groups. Length is calculated as the difference between the start and end coordinates. The pairwise statistical comparison was done using the Mann–Whitney U test.
GC content of the retained introns
Four groups were included in the comparison, with the Non-AS events divided into Non-AS-short and Non-AS-long. The discriminating threshold is the 75th percentile of the length of the Sig events, which is 358 nt. Percentage of GC was calculated in the retrieved sequences and statistical comparison was done using the Mann–Whitney U test.
Splice site score of the retained introns
Utilizing the online portal for the MaxEntScan (40), which is based on the maximum entropy modeling of short sequence motifs, scores were computed with sequences at both the 5′ and 3′ splice sites. At 5′ splice site, each sequence must be 9 bases long (3 bases in the exon and 6 bases in the intron), while at the 3′ splice site, each sequence must be 23 bases long (20 bases in the intron and 3 bases in the exon). An additional filter was added to remove any sites that appeared to be a splice site but were not validated when scrutinizing the sequences. The satisfying score threshold was determined in such a way that at least 50% of the sequences falling into the ± 0.2 range of the chosen score should have the correct splicing signal at the correct position, which led to -7.2 for the 5′ splice site and 1.4 for the 3′ splice site. The statistical comparison was done using the Mann–Whitney U test.
Code availability
All code written to implement the analyses in this paper are available at https://bitbucket.org/bucab/sde2/.
RESULTS
Identification of RNA bound by SDE2 via eCLIP
The C-terminus of SDE2 was initially demonstrated to share a region of homology with both the splicing factor SF3A3/SF3A60, and also the SAF-A/B, Acinus and PIAS (SAP) domain (Supplementary Figure S1A) (18,19). SF3A3 is a subunit of the trimeric SF3A complex which, together with the SF3B complex, assembles with the core U2 snRNP to form the U2 snRNP that is assembled into the spliceosome (41). SAP domains are found in diverse nuclear and cytoplasmic proteins and function to mediate nucleic acid binding (2,42,43). These regions of homology provided early evidence that SDE2 may function to regulate RNA processing. At the cellular level, SDE2 is distributed across both the nucleus and the cytoplasm. This pattern of localization for SDE2 was consistent across several established cell lines, including HeLa, U2OS, 293 FT and RPE-1 (Figure 1A).
Figure 1.

SDE2 is an RNA binding protein that interacts with ncRNAs. (A) Western blot of SDE2, GAPDH, and H4 following cellular fractionation of HeLa, U2OS, 293 FT and RPE-1 cell lines. GAPDH is used as a marker for the cytoplasmic fraction and H4 is used as a marker for the nuclear fraction. (B) Radiographic image of 32P labelled RNA from CLIP of SDE2 and IgG in HeLa cells, in both uncrosslinked (-UV) and crosslinked (+UV) conditions. (C) Western blot of PTex samples in HeLa cells from both uncrosslinked (-UV) and crosslinked (+UV) conditions. U2AF1 is used as a positive control and DNA-binding protein H4 is used as a negative control. (D) eCLIP usable reads were identified as either ‘unique,’ or ‘repetitive,’ and were plotted as percentages of total usable reads for both IPs and inputs for SDE2 and U2AF1. (E) All (unique and repetitive) elements were filtered for information content >100. Unique non-repetitive elements correspond to mRNA components including unique proximal intron, unique 3′ UTR, unique 5′ UTR, unique intergenic and unique noncoding proximal intron. These unique counts were averaged between IP replicates and plotted at the family level for both SDE2 and U2AF1. (F) Using a custom bioinformatic pipeline, repetitive elements from SDE2 and U2AF1 eCLIP were identified at the gene level by filtering for raw counts >100 and Log2 fold change >0 in duplicate IP conditions relative to respective inputs. Normalized counts were calculated and averaged between replicates and plotted against the average Log2 fold change between replicates. Two genes from SDE2 and four genes from U2AF1 were excluded in (F) because their data points were outside the axis limits. The omission did not alter the overall analysis or interpretation of the data.
To determine whether SDE2 directly interacted with RNA, we performed UV crosslinking and immunoprecipitation (CLIP) analysis. Here, we either left cells untreated or irradiated them with UV prior to lysis and immunoprecipitation using IgG or SDE2 specific antibodies. The precipitated protein–RNA complexes were subjected to 5′ labeling using 32P-γ-ATP and then visualized by autoradiography following SDS-PAGE separation and transfer to a PVDF membrane. Neither the uncrosslinked samples, nor the IgG control antibody precipitated RNA. However, SDE2 immunoprecipitation demonstrated a signal by autoradiography, suggesting that SDE2 directly interacts with RNA (Figure 1B).
To further confirm the interaction between SDE2 and RNA, we also performed a Phenol Toluol extraction (PTex) analysis (33). While CLIP protocols require immunoprecipitation of the protein of interest, PTex allows for the separation of RNA, proteins and crosslinked protein–RNA complexes in biphasic extractions. This eliminates the risk of non-specific interactions associated with antibodies in the CLIP experiments, providing an additional and potentially less biased approach to assessing protein–RNA interactions. Following crosslinking and biphasic extractions, we confirmed that the splicing factor U2AF1 was highly enriched in the ribonucleoprotein fraction while the histone protein H4 was undetectable, thus confirming the purity of the phases in the extraction process. Consistent with the results of our eCLIP experiments, we demonstrate that SDE2 is highly enriched in the fraction containing the crosslinked ribonucleoprotein complexes suggesting that, like U2AF1, SDE2 is an RBP (Figure 1C).
To gain better mechanistic insight into SDE2 function and identify unique RNA targets, we performed enhanced CLIP (eCLIP) in HeLa cells (44). Using SDE2 and U2AF1 antibodies, we performed each eCLIP reaction in duplicate with corresponding size-matched inputs as controls. Using a previously published bioinformatic pipeline (31,45,46) for analysis, we found that approximately half of all usable reads from our U2AF1 immunoprecipitations (∼44%) uniquely mapped to the genome and largely corresponded to mRNA elements (Figure 1D and E). These RNA sequences were specifically enriched for proximal introns, consistent with previously published data and validating the quality of our own eCLIP profiles (47). In contrast, only ∼2% of reads in the SDE2 eCLIP uniquely mapped to the genome, with the vast majority (∼98%) of all usable reads mapping to repetitive elements (Figure 1D and E). Using a custom bioinformatic pipeline to analyze repetitive elements at the gene level, we found that SDE2 immunoprecipitations were enriched for non-coding RNAs (ncRNAs) including ribosomal RNA (rRNA), transfer RNA (tRNA) and small nucleolar RNAs (snoRNA) (Figure 1F and Supplementary Figure S2). Notably, SDE2’s interaction with snoRNAs was not universal across the entire family, but almost entirely restricted to C/D box snoRNAs.
A role for SDE2 in ribosome biogenesis
There are over 350 C/D snoRNAs in the human genome ranging in length from 60 to 300 nt (48,49). C/D snoRNAs are defined by two conserved sequence motifs, a 5′ C box (RUGAUGA) and a 3′ D box (CUGA). In addition, some C/D snoRNAs also contain more centrally located degenerate C/D box motifs referred to as C’/D’ box. The C/D snoRNAs are bound by four core proteins including small nuclear ribonucleoprotein 13 (SNU13), NOP56 ribonucleoprotein (NOP56), NOP58 ribonucleoprotein (NOP58) and fibrillarin (FBL) to form active snoRNP complexes. While most C/D snoRNAs function as guide RNAs to promote the 2′-O-methylation of rRNA by FBL, others do not chemically modify rRNA. Instead, they function to direct the cleavage and processing of pre-rRNA to promote rRNA maturation (6). We identified 85 C/D snoRNAs by SDE2 eCLIP, of these, the SNORD3 (A, B, C and D) family and SNORD118 were highly enriched. These C/D snoRNA are not only abundant in the cell, but have been demonstrated to regulate the cleavage and processing of rRNA. Although the SNORD3 and SNORD118 families share little sequence conservation, they both maintain the canonical C box and D box motifs (50). We found that SDE2 directly interacts with nucleotides 135–151 of SNORD3 and between nucleotides 45–52 of SNORD118 (Figure 2A). Remarkably, these SDE2-binding sites are located immediately adjacent to the 5′ end of the C box in both SNORD3 and SNORD118. Given that SDE2 directly interacted with C/D snoRNAs, we hypothesized that SDE2 would also associate with one of the core C/D snoRNA associated proteins, FBL. Therefore, we performed reciprocal immunoprecipitations with SDE2 and FBL antibodies and analyzed interactions by western blot (Figure 2B). These reciprocal immunoprecipitations demonstrated robust interaction between FBL and SDE2, further supporting our eCLIP analysis.
Figure 2.

SDE2 functions in ribosome biogenesis. (A) Heat map corresponding to read counts from SDE2 eCLIP replicates 1 and 2 for the SNORD3 family (top panel) and SNORD118 (bottom panel). Nucleotide positions are labeled on the horizontal axis with 0 = 5′ end of each snoRNA. Below each heatmap is a diagram showing annotated domains of each respective snoRNA. Black boxes indicate SDE2-binding regions on each transcript. (B) Reciprocal immunoprecipitation of SDE2 and FBL with a 1% input from whole cell extract in HeLa cells. Tubulin is used as a negative IP control. (C) Northern blot of SDE2-depleted or control HeLa cells, incubated with the indicated probes in separate northern blots; n = 3 replicates. (D) Western blot of RPE-1 cells depleted of SDE2. * indicates a background band immediately above the SDE2 band. (E) Immunostaining of FBL in SDE2-depleted HeLa cells (red); scale bar: 20 μm. (F) Western blot of SUnSET assay measuring global translation in HeLa cells 3 or 5 days following SDE2 knockdown. Protein synthesis was measured by the incorporation of puromycin, and puromycin was detected using a puromycin specific antibody. UT, cells not treated with puromycin; CHX, cells treated with puromycin and cycloheximide. Representative image shown from experiments performed in triplicate. (G) Quantification of experiments performed in (F). Graph shows mean puromycin intensity for each lane relative to the mean puromycin intensity for Day 3 siCTRL ± SD. The intensity of the puromycin in the Day 3 siCTRL lane was normalized to 1.0. P-values calculated by two-way ANOVA comparing mean puromycin intensity of each condition to Day 3 siCTRL, followed by Dunnet’s multiple comparisons test, with P ≤ 0.01 denoted by **, P ≤ 0.001 denoted by ***, and P ≤ 0.0001 denoted by ****.
Previous studies have demonstrated that SNORD3 functions to direct the cleavage of the A0 and 1 cleavage sites within the 5′ ETS of the 47S rRNA precursor to promote rRNA maturation (Supplementary Figure S3) (50). Consequently, loss of SNORD3, or SNORD3 interacting factors, leads to defects in pre-rRNA cleavage and the accumulation of the 47S and 34S rRNA precursors. Here, we demonstrate that, similar to loss of SNORD3, depletion of SDE2 also leads to defects in rRNA cleavage within the 5′ ETS region, resulting in the accumulation of both the 47S and 34S rRNA precursors by northern blot (Figure 2C, top panel). SNORD118 is required to promote rRNA processing within the 5′ ETS and also the internal transcribed spacer regions ITS1 and ITS2 to ensure processing of the 5.8S and 28S precursors. Loss of SNORD118 leads to an accumulation of the 47S precursor and decrease of both the 32S and the 12S rRNA precursors (Supplementary Figure S3) (50). Consistent with defects in SNORD118, knockdown of SDE2 led to an increase in 47S and a decrease in the 32S and 12S precursors by northern blot (Figure 2C, bottom two panels). Notably, SNORD3 and SNORD118 RNA levels are unchanged following SDE2 depletion demonstrating that SDE2 does not regulate snoRNA stability (Supplementary Figure S1B). Taken together, these data demonstrate that SDE2 is critical for pre-rRNA processing and required for SNORD3 and SNORD118 functions.
Defects in rRNA processing shift the stoichiometry between rRNA and r-proteins, leading to an excess of unbound, or free, r-proteins. These free r-proteins are then available to bind MDM2 and inhibit p53 degradation, which activates a ribosomal stress response pathway that leads to cell cycle arrest (51). Given that loss of SDE2 led to defects in rRNA processing, we asked whether these defects were sufficient to release r-proteins and trigger p53 stabilization. Here, we silenced SDE2 in RPE-1 cells, a non-transformed, immortalized, p53 WT cell line, and analyzed p53 by western blot. After knockdown of SDE2, we observed p53 stabilization and downstream p21 activation (Figure 2D) in the absence of DNA damage (19), indicative of a defect in ribosome biogenesis. Many of the r-proteins that stabilize p53 and function in ribosome biogenesis are also required for maintaining the structural integrity of the nucleolus (52,53). The nucleolus forms around the rDNA arrays and is composed of a fibrillar center (FC), a granular component (GC) and a dense fibrillar component (DFC) (54). FBL is enriched in the DFC and is considered a marker of nucleolar integrity (55,56). We observed defects in nucleolar integrity as measured by FBL immunostaining in SDE2-depleted HeLa cells (Figure 2E), further supporting the conclusion that ribosome biogenesis is defective.
Defects in ribosome biogenesis and/or maturation can be visualized by changes in the sedimentation of the ribosomes with mRNA using polysome profiles. Following polysome analysis, we show that loss of SDE2 leads to a decrease in the relative abundance of the 40S ribosomal subunit and to a lesser extent the 60S subunit. In addition, we also observe that loss of SDE2 leads to an accumulation of 80S monosomes and a relative decrease in higher molecular weight polysomes resulting in an approximate 2-fold decrease in the polysome/monosome (P/M) ratio (Supplementary Figure S1C). We reasoned that these defects in ribosome biogenesis and/or maturation may drive a concomitant decrease in global protein translation. Therefore, we asked whether loss of SDE2 led to defects in protein synthesis using SUrface seNSing of Translation, or SunSET assays (57). Following transfection with siRNA for SDE2, we allowed cells to proliferate for either 3 or 5 days before pulsing cells with puromycin. Following the incubation with puromycin, we collected cells and analyzed whole cell lysates for puromycin incorporation by western blot using a puromycin-specific antibody. As expected, cells transfected with a control siRNA demonstrated a strong pattern of active protein synthesis by western blot. However, loss of SDE2 led to a significant and progressive decrease in protein synthesis over the course of 5 days (Figure 2F and G). This defect in translation was not simply due to the activation of the integrated stress response that drives translational repression via the eIF2α signaling pathway, nor was it caused by disruptions in mTOR signaling (Supplementary Figure S1D and E). Together, our data suggest SDE2 plays a critical role in maintaining ribosome biogenesis and global protein synthesis in mammalian cells through regulation of snoRNA-dependent rRNA cleavage and the maturation of functional ribosomes.
SDE2 is present in a post-catalytic spliceosome complex
The biological functions of snoRNAs are still largely underexplored; however, recent studies have demonstrated that, in addition to functioning in rRNA processing and modification, some snoRNAs are cleaved into smaller fragments that bind pre-mRNAs and snRNAs to regulate pre-mRNA splicing (58–61). Thus, not surprisingly, a number of snoRNA interacting proteins have dual functions in both ribosome biogenesis and pre-mRNA splicing including, IBP60, U2AF1, 15.5k/SNU13, FBL and PRP43 (62–66). While our data identify SDE2 as a snoRNA-interacting protein, previous studies have identified SDE2 in spliceosomal complexes, suggesting that in addition to rRNA processing (Figure 2C), SDE2 may also function in pre-mRNA splicing. In fact, structural databases highlight a region of homology between SDE2 and the human splicing factor SF3A3 (Supplementary Figure S1A), a canonical component of the U2 snRNP. In addition, a partial crystal structure of SDE2 was recently resolved as part of the post-catalytic spliceosomal P complex, in which disassembly is blocked just after exon ligation. The intron is also retained in this complex, together with the U2/U6 snRNAs, suggesting a role for SDE2 in 3′ splice site recognition (22). Given that spliceosome disassembly is not blocked in our experiments, it is plausible that we did not detect an enrichment of snRNAs, introns or ligated exons following SDE2 eCLIP. Therefore, we asked whether SDE2 is associated with the U2 snRNP complex. Using reciprocal immunoprecipitation, we detected an interaction between SDE2, SF3B1 and U2AF1, confirming that SDE2 associates with the U2 snRNP complex (Figure 3A). Moreover, SDE2 protein interactions extended beyond the U2 snRNP, to proteins critical for 3′ splice site docking including Cactin (Figure 3A), fueling the hypothesis that SDE2 is intimately involved in the catalytic steps of pre-mRNA splicing. Finally, we demonstrate that SDE2 expression, while prevalent in all tissues tested, is specifically enriched in brain, liver, and lung (Figure 3B), tissues known to be associated with increased and distinctive patterns of AS (67). Notably, the SDE2 expression pattern in human tissue mimics that of the splicing factor and core U2 snRNP component SF3B1, consistent with the idea that SDE2 is a component of the U2 snRNP.
Figure 3.

SDE2 depletion increases intron retention. (A) Reciprocal immunoprecipitation of SDE2, SF3B1, U2AF1 and Cactin, with a 1% input from whole cell extract in HeLa cells. Tubulin is used as a negative IP control. (B) Western blot of SF3B1, SDE2 and GAPDH on a membrane containing 16 human tissue samples. (C) Overview of the AS events identified using our custom pipeline after 3 days of SDE2 depletion via siRNA. Pie chart represents the percentage of each AS type. The total number of significant AS events is annotated at the bottom. (D) Bar plot demonstrating the absolute number of each AS type. (E) Schematic representation of one gene containing an RI event identified in our analysis pipeline; exons are depicted by peach boxes, the retained intron is depicted with a thick black line, and the exons flanking the RI event are depicted by larger orange colored boxes. Location of primers used to amplify RI events are shown as gray arrows. (F and G) DNA gels depicting intron retention events following RT-PCR. RNA was extracted from siCTRL and siSDE2 cells and target genes were amplified by RT-PCR in HeLa cells (F and H) and U2OS cells (G and I) with (+RT) and without (-RT) reverse transcriptase. RI events and spliced events are labeled. Graphs show mean percent intron retention in each condition relative to total transcript (intron retained + spliced) ± SD. RFNG does not demonstrate a dAS RI event and serves as a negative control. n=3 for all quantifications and experiments, P-values denoted by comparing siCTRL versus siSDE2-1 or siSDE2-2 by two-way ANOVA followed by Dunnet's multiple comparison test, P ≤ 0.01 denoted by **, P ≤ 0.001 denoted by ***, and P ≤ 0.0001 denoted by ****, ns = not significant. For RI events with different levels of P-values between siSDE2-1 and siSDE2-2, the least significant value is shown.
Depletion of SDE2 modulates RNA splicing patterns
To determine whether loss of SDE2 leads to changes in the patterns of pre-mRNA splicing, we treated cultured HeLa cells with one of two unique siRNAs to deplete SDE2 protein and extracted RNA at 72 h (3 days) and 120 h (5 days) in preparation for high-throughput polyA + mRNA sequencing. We identified transcriptome-wide differential alternative splicing (dAS) events using a custom bioinformatic pipeline (Supplementary Figure S4A). Briefly, an AS event is defined as a genomic locus (e.g. an intron) that shows evidence of differential inclusion. For example, an intron involved in an RI event might show evidence of being included in only 30% of transcripts that originate from that locus. Such an event would have a ‘percent spliced in’ (PSI) of 0.3. To identify changes in AS, we identified AS events that show significantly different PSI values, or delta PSI, between conditions. When considering the above example, if in one condition the RI event has a PSI of 0.3, while in another the PSI is 0.9, the delta PSI is 0.9–0.3 = 0.6. This delta PSI is large, and thus we infer that there is dAS at this locus. Our pipeline uses multiple published methods for detecting dAS events and identifies consensus results from both siRNAs to arrive at the set of dAS events that are likely the most robust (see Materials and Methods section for more details).
At the 72-h timepoint, we found that there was a significant increase in AS with 2431 dAS events affecting 1474 unique genes with an FDR < 0.05 (Figure 3C and D). This increased to 3577 dAS events consisting of 2288 unique genes with an FDR < 0.05 at the 120-h timepoint (Supplementary Figure S4B and C). Of the 2431 AS events detected 3 days after knockdown, RI were the most common AS type, consisting of 1385 events, or 57% of all AS events (Figure 3C). Also enriched were alternate terminal exons (TE 14%), cassette exons (CE12.7%), and alternative transcriptional start site (TS, 11%). The distribution of dAS event types was similar at day 5 albeit with an increase in CE (Supplementary Figure S4B and C).
Given that RI were by far the most abundant AS event following SDE2 depletion, we chose ten candidate genes at random (ADAMTSL4, ARSA, CUL7, DGKQ, FBF1, KIFC2, PARP10, PITPNM1, RHBDF1 and SPATA20), each with at least one significant RI dAS event identified by our pipeline, to validate using RT-PCR (Figure 3E and Supplementary Figure S5A). In addition, we also selected one event from the gene RFNG, predicted to demonstrate intron retention, but that was not significantly different between control cells and SDE2 knockdown cells (no change in delta PSI). We then visualized each of these ten loci in the integrated genome viewer (IGV) to confirm the predictions from our pipeline (Supplementary Figure S5B). As predicted by our analysis, ADAMTSL4, ARSA, CUL7, DGKQ, FBF1, KIFC2, PARP10, PITPNM1, RHBDF1 and SPATA20 all demonstrated robust and significant increases in intron retention at the predicted loci by RT-PCR following knockdown of SDE2 (Figure 3F,H). In contrast, RFNG, which served as a negative control, showed no change in intron retention between control and SDE2 knockdown cells (Figure 3F,H). To ensure that the AS events were not cell line specific, we also analyzed the RI events in all ten of our candidate genes and RFNG in U2OS cells following SDE2 knockdown (Figure 3G,I). Consistent with the data in HeLa cells, loss of SDE2 in U2OS also led to a significant increase in intron retention in nine out of ten candidate genes. The tenth candidate gene, PARP10, displayed increased intron retention, but was not significantly changed with SDE2 depletion, while intron retention in RFNG remained unchanged.
Previous studies have demonstrated that transcripts with RIs can exhibit defects in nuclear mRNA export (68,69). Therefore, we analyzed the cellular localization of 10 of the transcripts containing an increase in RI events by RT-PCR. Following SDE2 knockdown, we fractionated HeLa cells into cytoplasmic and nuclear fractions and analyzed ADAMTSL4, ARSA, CUL7, DGKQ, FBF1, KIFC2, PARP10, PITPNM1, RHBDF1, SPATA20 and RFNG RI events by RT-PCR. Consistently, we found that all transcripts containing increased RI events and RFNG were localized in both the cytoplasm and the nucleus, suggesting there was not a universal defect in mRNA export (Supplementary Figure S6A–D).
Our data suggest that SDE2 functions in pre-mRNA splicing, yet it was unclear how SDE2 activity compared to other established splicing factors. Using publicly available RNA sequencing data from the ENCODE Project, we asked whether the percent of dAS RI events following SDE2 knockdown was similar to the percent of RI events following the knockdown of other known splicing factors including TIA1, SRSF1, U2AF2, PCBP1, PCBP2, PTBP1, SRSF7 and FUS (39). To do this, we calculated the number of RI events in each knockdown condition using a custom pipeline and divided that by the total number of introns within the genome to calculate the percent of RI each condition (Supplementary Figures S7A,B, 8A). We calculated the percent RI for each SDE2 siRNA individually, for the RI events shared between both SDE2 siRNAs (intersection), and for the RI events in both SDE2 siRNAs combined (union). Regardless of which way we analyzed the SDE2 knockdown condition, the data demonstrated that between 0.5 and 1.95% of introns within the genome demonstrate an increase in retention in the absence of SDE2. This is consistent with the percent RI following knockdown of the other known splicing factors using the data from the ENCODE Project. However, loss of SDE2 led to an increase in the percent RI that was most consistent with loss of the core splicing factor U2AF2 suggesting a role for SDE2 in splicing (Figure 4A).
Figure 4.

Characterization of the retained intron events following SDE2 depletion. (A) Comparison of the number and percentage of increased significant RI events (P<0.05) in knockdown between ENCODE data and SDE2 data. The percentages represent the fraction of introns in the whole genome affected by the knockdown of the corresponding splicing factor. (B) Histogram of the Location of the RIs between significant (Sig) and non-significant (Non-sig) events. On the X-axis, ‘0’ corresponds to the 5′ end of the transcript and the ‘1’ corresponds to the 3′ end of the transcript. Position of the RI is determined using the center of the RI. Dashed lines mark the median of the fraction in each group. (C) Boxplot of the Length of the RIs among Sig, Non-sig and Non-AS group. The number of events in each group is annotated. Length is log10 transformed on Y-axis. (ns: not significant, ***P < 0.001, ****P < 0.0001, Mann–Whitney U test). (D) Boxplot of the GC content of the RIs among Sig, Non-sig, Non-AS-short and Non-AS-long groups. The number of events in each group is annotated (**** P < 0.0001, Mann–Whitney U test). (E) Boxplot of the splice site scores on both the 5′ and 3′ end of the RIs among the four groups. The plot is only showing the distribution of positive scores, but the statistical test included all of the data (ns: not significant, ***P < 0.001, ****P < 0.0001, Mann–Whitney U test).
To determine whether a specific subset of introns was differentially affected by loss of SDE2, we analyzed the cis-characteristics of the RI events. Initially, we noted that several of the transcripts demonstrated dAS RI events located toward the 3′ end of the transcript (Supplementary Figure S5A). Therefore, we asked whether this 3′ bias was a consistent feature among all of the significant RI-containing transcripts. To address this, we computed the position of each RI event relative to the gene body length of each gene for both significant and non-significant dAS RI events (Supplementary Figure S8B). While 8 of our 10 analyzed transcripts (ADAMTSL4, CUL7, DGKQ, FBF1, KIFC2, PARP10, PITPNM1 and SPATA20) all demonstrated an RI event located near the 3′ end of the transcript, the position of the remainder of the dAS RI events was uniform across the gene body, suggesting that loss of SDE2 does not lead to a significant positional bias in splicing efficiency (Figure 4B).
In addition to the perceived positional bias, we also noticed that the introns of all 10 RI events we had initially validated were relatively short, between 69 and 327 nucleotides in length (Supplementary Figure S5A). Therefore, we asked whether the introns among the significant RI events were overall shorter in length than the introns of the non-significant RI events, as shorter introns follow a spliceosome assembly pathway characterized by intron definition while exons with longer introns on either side are recognized via exon definition (70). We found that in the absence of SDE2, the significant RI events were on average shorter in length than the non-significant RI events. Specifically, the significant RI events had a median length of 136 nucleotides whereas the non-significant RI events had a median length of 1398 nucleotides. However, the non-significant group of RI events had almost half of the number of events as the significant RI events (1265 significant events versus 717 non-significant events), raising the possibility that the unequal distribution of events may have skewed the analysis. To account for this possibility, we included a third group of introns for comparison. This group consists of all introns from expressed genes in our RNA-sequencing analysis that were not alternatively spliced (i.e. not identified in our AS pipeline) and consists of 333,400 introns (referred to as ‘non-AS’) (Supplementary Figures S7A,B and 8C). Even when compared to this much larger group, the introns in the significant RI events group were still significantly shorter than all non-AS introns combined (significant RI events-136 nucleotides versus non-AS events-1438 nucleotides) (Figure 4C).
Short introns have often been associated with differential GC content and weaker splice site strength (69,71,72). Therefore, we asked whether the introns in the significant RI events displayed changes in the GC content as compared to either the non-significant RI events or the non-AS introns. As with our earlier analysis, we considered the possibility that the analysis of the GC content in the significantly retained introns may be skewed simply because the introns were on average significantly shorter than both of the other comparison groups. Therefore, we split the non-AS intron group into non-AS short and non-AS long introns (Supplementary Figures S7A,B and 8D). Here, ‘short’ and ‘long’ were determined using the box and whisker plot from the significant RI events where ‘short’ was defined as intron lengths less than or equal to the 75th percentile (≤400 nt) and ‘long’ was defined as lengths greater than the 75th percentile (>400 nt). Notably, the significant RI events had a GC content of 62% whereas the non-significant, non-AS short, and non-AS long introns had GC contents of 50%, 56% and 42%, respectively (Figure 4D). These data highlight a high GC content as a defining feature of the significant RI events. To determine whether the shorter length and higher GC content affected the strength of the 5′ and/or 3′ splice site we calculated the maximum entropy (MaxENT) score (73) of each splice site within each intron. A higher MaxENT score is indicative of a stronger splice site. The significant RI events have significantly lower MaxENT scores as compared to non-significant RI events (MaxENT = 8.05 versus 8.55). Moreover, while the MaxENT scores of the significant RI events were lower than the non-AS short introns at the 3′ splice site (MaxENT = 8.05 versus 8.25), there was no difference in MaxENT scores at the 5′ splice site (MaxENT = 8.05 versus 8.1) (Figure 4E, Supplementary Figure S8E), suggesting that SDE2 may be especially critical for 3′ splice site definition.
Taken together, our data define the subset of introns that are retained in the absence of SDE2 as short, GC-rich, and containing weak 3′ splice sites. All of these analyses were done using the set of RI events that were shared between each SDE2 siRNA. However, the overall results were identical if we combined all of the RI events between both siRNAs (union) (Supplementary Figure S9A–E). In addition, the characteristics of these RI events were consistent at 120 h after knockdown, albeit with an increase in total events by this time (Supplementary Figures S10A–E and S11A–E).
Depletion of SDE2 leads to impairment of the cell cycle and cell death
Our functional characterization of SDE2 has demonstrated that SDE2 is an RBP with critical functions in regulating specific snoRNA-mediated cleavage in rRNA maturation, and that it also associates with the U2 snRNP to regulate the AS of a specific subset of introns. Given the essentiality of these pathways in cell viability, we used live cell imaging to monitor the fate of U2OS cells depleted of SDE2. We found that loss of SDE2 led to an increase in the fraction of cells that arrested in the cell cycle, as well as an increase in the number of interphase or mitotic cells that underwent cell death, relative to controls (Figure 5A–C). These defects were observed in almost half (47.8%) of all cells depleted of SDE2 (Figure 5D). The remaining SDE2 depleted cells that were able to proceed to mitosis exhibited mitotic slippage or prolonged mitosis (Supplementary Figure S12A–D). Unsurprisingly, cells that underwent abnormal mitosis did not survive multiple rounds of cell division in culture.
Figure 5.

SDE2 is essential for cell viability. (A–C) Representative still images from live cell imaging experiments of U2OS cells stably expressing H2B-mCherry transfected with siSDE2-1. (A) Representative image of a cell undergoing cell cycle arrest (white arrow), defined by the absence of mitosis for >36 h. Teal and green arrows denote cells that undergo catastrophic mitosis and subsequent cellular death. (B) Representative image of cells undergoing death in interphase. White arrows mark a cell that enters mitosis and divides, forming two daughter cells (yellow arrows) that both exhibit cellular death in interphase. (C) Representative image of a cell undergoing mitotic cell death (white arrow); Time, hr: min. (D) Pie charts representing the fate of cells following control or siSDE2-1 knockdown, n = 179 cells in the siCTRL condition and 186 cells in the siSDE2-1 condition. (E) Population doubling assay in HeLa cells. Cells were counted at Day 0, 3 and 6 and reverse transfected with corresponding siRNAs at Day 0 and Day 3. n = 3 independent experiments with duplicate technical replicates for each condition in each independent experiment. Graph shows cumulative population doubling in each condition at the indicated time ± SD. P-values calculated by two-way ANOVA followed by Dunnet’s multiple comparisons test, with P ≤ 0.0001 denoted by ****. (F and G) RPE-1 cells expressing shSDE2 were collected after 12 days, counted, and plated again. The following day, cells were stained with crystal violet or collected for western blot (n = 3 independent experiments). The graph shows mean cell number ± SD. P-value calculated by unpaired t-test with P ≤ 0.0001 denoted by ****. (H) Data from The Broad Institute's Project Achilles dataset DepMap 19Q3 Public. The graph shows dependency scores for each gene listed on the x-axis in 625 different cancer cell lines. Each cell line is represented by a single point, and all cell lines are represented for each listed gene. The average dependency score of an essential gene is -1, denoted by the red dashed horizontal line drawn at y = -1. For the indicated genes, the black horizontal line in front of the dots is the average mean dependency score between all cell lines.
Following the results of our live cell imaging, we asked whether cells would survive long-term following SDE2 depletion. Not surprisingly, knockdown of SDE2 using two different siRNAs in HeLa cells led to significant defects in cellular proliferation and culminated in cell death 6 days after SDE2 knockdown (Figure 5E). Likewise, we used shRNA to knockdown SDE2 in RPE-1 cell lines and analyzed viability by clonogenic survival. While cells infected with empty vector continued to proliferate, the cells infected with shSDE2 demonstrated significant defects in proliferation and increased cell death 12 days after shRNA knockdown (Figure 5F and G). Finally, the recent advances in CRISPR technology and the release of the DepMap through the Broad Institute allowed us to ask whether SDE2 was essential for viability in all cancer cells (74). In support of our analysis in HeLa and U2OS cells, DepMap confirmed that SDE2 was essential for cellular viability in 100% of the 625 cell lines analyzed following CRISPR knockout. Although this loss of viability following CRISPR knockout was consistent with other genes known to regulate pre-mRNA splicing and ribosomal biogenesis, essentiality is not a universal characteristic for all splicing or ribosome assembly factors, highlighting the critical nature of SDE2 function in pre-mRNA processing and ribosome biogenesis (Figure 5H).
DISCUSSION
The complex and dynamic nature of ribosome biogenesis and pre-mRNA splicing have precluded the identification and characterization of every RBP that is critical for these processes. Therefore, there are likely many proteins and RNA moieties that function as trans-acting factors in one or both of these processes that have yet to be defined. Given that mutations in genes regulating ribosome biogenesis and pre-mRNA splicing are strongly associated with human disease, identifying the proteins that function in these pathways may lead to the discovery of unrealized genes implicated in disease pathology. Here, we demonstrate that SDE2 is an RNA binding protein that directly interacts with C/D snoRNAs and is required for efficient rRNA processing. In addition, we have identified that SDE2 interacts with the U2 snRNP complex to regulate pre-mRNA splicing. SDE2 depletion leads to misprocessed rRNA intermediates, global loss of translation, and widespread increases in AS. These deficits overwhelm the cell and result in the complete loss of cell viability, highlighting the essentiality of SDE2 in mammalian cells.
Recent biochemical purifications of over one thousand RBPs have identified that approximately half lack the classical RNA-binding domains (i.e. RRM, KH, CSD or CCHC) (2,3). Instead, these RBPs contain classical DNA binding domains such as the SAP domain, while others contain intrinsically disordered regions (IDRs). Similar to these RBPs, SDE2 not only contains both an IDR and a SAP domain but also demonstrates direct interactions with RNA. Using eCLIP, we identified that SDE2 directly interacts with the C/D box subfamily of snoRNAs. C/D snoRNAs are defined by two highly conserved C and D box motifs and two less conserved C’ and D’ box motifs. Structurally, snoRNAs fold to ensure that both the C and D (and C’/D’) core motifs oppose one another, creating a hairpin structure. The C/D and C’/D’ box motifs are bound by the core C/D snoRNP factors NOP56, NOP58, SNU13 and FBL to regulate a number of functions in snoRNA biogenesis including the trimming of snoRNA from within introns of pre-mRNA, localization of snoRNA to the nucleolus and methylation of the snoRNA cap (75). Conceivably, the SAP and/or IDR of SDE2 directly interacts with snoRNA near the C box motif to promote snoRNA biogenesis. Additional studies will be needed to determine whether SDE2 functions as a core snoRNP component or an auxiliary factor for distinct snoRNA.
Within the C/D box class of snoRNA, the SNORD3 family is structurally unique, containing A, A’, Hinge, B, C, C’ and D sequence motifs. In contrast to other C/D box snoRNAs, SNORD3 family members fold into a hairpin structure where the C’ box opposes the D box and the C box opposes the B box. As a result, SNORD3 maintains both a C’/D box motif and a unique B/C box motif. The B/C box is critical for interactions with not only the core C/D snoRNP factors but also the SNORD3 specific factor U3-55K (75). Together, these proteins function to regulate both SNORD3 stability and the assembly of the small ribosomal subunit (75,76). In contrast, SNORD118 contains only the canonical C/D box motif, in which the C box directly opposes the D box (77). SDE2 interacted with both SNORD3 and SNORD118 adjacent to and immediately 5′ of each C box. Although the C box sequences are identical, SNORD3 and SNORD118 lack sequence conservation within the region surrounding the C/D box motifs. This suggests that the folding and/or structure of the C box flanking regions play a role in mediating SDE2 interaction, similar to the interaction between the B/C box of SNORD3 with U3-55K (78). SDE2’s interaction with the 5′ C box flanking regions suggests that SDE2 binds near these motifs and functions to regulate C/D snoRNP complexes to coordinate rRNA processing events including, cleavage, methylation, folding and/or localization ultimately, providing the framework for assembly and maturation of the ribosome.
Ribosome biogenesis is a complex process and, while no single experiment we have performed clearly reveals the mechanism through which SDE2 functions, our data in aggregate are consistent with a role for SDE2 in this pathway. Several possible functions that are not necessarily exhaustive, nor mutually exclusive, can be suggested. First, SDE2 interacts broadly with C/D snoRNAs, and also with the methyltransferase FBL. FBL is the catalytic core of the C/D snoRNP complexes and functions to regulate 2′-O-methylation of a range of RNA species including rRNA, mRNA and snRNA (79–82). Defects in 2′-O-methylation are known to impair ribosome biogenesis and protein translation (80). Therefore, it is tempting to speculate that SDE2 may promote unique 2′-O-methylation events on rRNA and/or pre-mRNA to regulate processing and/or protein synthesis. RNA methyl-sequencing approaches are rapidly expanding and will undoubtedly provide an opportunity for future studies investigating the genome-wide methylation events in which SDE2 functions. Second, SDE2 depleted cells could have defects in the kinetics of ribosomal subunit assembly or produce suboptimal subunits that, while competent for initiation, may be defective for ribosomal elongation. Finally, monosomes are known to be enriched in misspliced mRNAs targeted for nonsense-mediated decay (NMD) (83). Given that SDE2 depleted cells harbor an increase in RI events, and many of these RI events contain NMD-triggering premature termination codons, it stands to reason that these RI events may sequester functional ribosomes and competitively inhibit translation. Future studies investigating SDE2 function in ribosome biogenesis and/or maturation will aim to provide additional insight towards these possible mechanisms.
We have found that SDE2 interacts with the U2 snRNP complex and, likewise, others have identified SDE2 in biochemical purifications of human and yeast spliceosomal complexes (20,22,66,84,85). SDE2 is not a constitutive component across all spliceosomal purifications, suggesting that SDE2 may be a dynamic factor that plays a specific role in the post-catalytic stage of pre-mRNA splicing. Here, we demonstrate that loss of SDE2 led to an increase in dAS, with RI being the most significantly enriched dAS event type. Moreover, our bioinformatics pipeline has allowed us to capture both novel RI events as well as annotated RI events. One of the defining characteristics of the significant dAS RI events is that they are shorter in length than introns that were properly spliced, suggesting that SDE2 may be a trans-acting splicing factor that functions to define splice site boundaries at short introns. Given SDE2’s interaction with components of the U2 snRNP, SDE2 function may be especially critical to define the boundaries of short introns that have high GC content and weak splice sites. Although the RI events we identified following loss of SDE2 were shorter in length, they were not always the smallest introns within a given AS transcript. Likewise, we identified short introns that were retained but were not dAS following loss of SDE2. These data suggest that the short introns that are not retained, or short RI events that did not demonstrate dAS, have strong splice sites and lower GC content and are therefore efficiently spliced during mRNA processing in the absence of SDE2. Alternatively, there may simply be additional defining features for the significantly retained introns as compared to the non-significantly retained introns that are yet to be uncovered. Our analyses here have focused on RI events, however, as computational tools continue to expand, our ability to detect AS events may improve. As a result, we may uncover novel AS events in the future, that are significantly enriched in the absence of SDE2 beyond RI events.
The predicted protein domains contained within SDE2 served as an initial indicator for SDE2’s functions. In addition to the IDR and SAP domains, SDE2 also contains an N-terminal ubiquitin-like domain (UBL) (19). Proteins containing UBL domains are often enzymatically cleaved, generating a ubiquitin peptide that is then covalently linked to a substrate protein to regulate various cellular pathways, including RNA processing and ribosome biogenesis (86,87). In fission yeast, the UBL domain of Sde2 is cleaved by the deubiquitinating enzyme paralogs Ubp5 and Ubp15, creating an N-terminal UBL fragment and a C-terminal fragment (20). Likewise, in mammalian cells, SDE2 has been reported to be cleaved in response to DNA damage, resulting in both an N-terminal UBL fragment and a C-terminal SAP fragment (19). While the exact function of the liberated UBL domain has not been explored, recent studies highlight a role for the C-terminal fragment in pre-mRNA splicing. Specifically, SDE2 was identified in a crystal structure of the human spliceosomal P complex, which is stalled at a post-catalytic step immediately after exon ligation. These studies indicate that removal of the UBL is required to allow SDE2 to associate with the spliceosome (22). Our experiments were performed in the absence of exogenous DNA damage, which limited our ability to detect this cleavage event. However, our data support a role for SDE2 in pre-mRNA splicing through an interaction with both the U2 snRNP complex and the auxiliary factor reported in the resolved crystal structure, Cactin.
Here, we demonstrate that depletion of SDE2 leads to significant alterations in the pattern of pre-mRNA splicing, leading to an increase in AS and ultimately, cell death. While we describe RIs as the most significant event detected following SDE2 knockdown, our RNA sequencing analysis was performed on polyA + purified RNA. Therefore, if defects in splicing led to transcripts that were inherently unstable and preferentially degraded, we would be unable to detect them in our analysis. Likewise, the purification of spliceosomal complexes has placed SDE2 in various complexes throughout the splicing process. If SDE2 were also to function in late stages of the splicing reaction, it is plausible that defects in the transesterification reactions would lead to the formation of RNA fragments that might not be recovered in our polyA + purified RNA. Thus, we may be underestimating the effects of depleting SDE2 on the transcriptome. Regardless, depletion of SDE2 led to significant and catastrophic defects in mitosis, protein translation, and cell viability.
Ribosome biogenesis and pre-mRNA splicing are essential processes in mammalian cells, and as such, many of the factors within these pathways are essential genes. However, some (FUS, TIA1 and RPS26) are not required for viability in the vast majority of cancer cells, highlighting a critical function for SDE2 (74). Though impaired ribosome biogenesis and pathologic changes in AS are linked to human disease, it is unclear on a molecular level the exact mechanism, or mechanisms, by which they lead to loss of cell viability. Future studies will likely shed light on these mechanisms and provide insight to the highly complex regulation of these essential processes.
DATA AVAILABILITY
All code generated during this study are publicly available at https://bitbucket.org/bucab/sde2. All datasets generated during this study are publicly available through NCBI’s Gene Expression Omnibus and are accessible through GEO Series accession number GSE143258 https://www.ncbi.nlm.nih.gov/geo/query/acc.cgi?acc=GSE143258.
Supplementary Material
ACKNOWLEDGEMENTS
We would like to thank all members of the Flynn lab for helpful discussions and suggestions. We also thank members of the Ganem lab for their helpful discussions surrounding the live cell imaging experiments. This work was supported by the Boston University Microarray and Sequencing Resource (BUMSR) Core and Core Director, Dr. Yuriy Alekseyev.
Author Contributions: Conceptualization, J.A.F and R.L.F.; Methodology, J.A.F., A.L. and R.L.F.; Formal Analysis, J.A.F., A.D., A.L., J.D, S.M.L. and R.L.F. Investigation, J.A.F., A.D., A.M., C.W., N.J.G., A.M.M., A.L. J.D. and S.M.L; Writing – Original Draft, J.A.F. and R.L.F; Writing – Review and Editing, J.A.F., A.D., N.J.G., A.L. C.W. D.C., J.D, S.M.L. and R.L.F; Funding Acquisition, J.A.F. and R.L.F.; Resources, R.L.F., A.L., N.J.G. and D.C.; Data Curation, A.D. and A.L.; Supervision, R.L.F. and A.L.
Contributor Information
Jess Floro, Departments of Pharmacology and Experimental Therapeutics, and Medicine, Cancer Center, Boston University School of Medicine, Boston, MA 02118, USA.
Anqi Dai, Departments of Pharmacology and Experimental Therapeutics, and Medicine, Cancer Center, Boston University School of Medicine, Boston, MA 02118, USA; Bioinformatics Program, Boston University, Boston, MA 02118 USA.
Abigail Metzger, Departments of Pharmacology and Experimental Therapeutics, and Medicine, Cancer Center, Boston University School of Medicine, Boston, MA 02118, USA.
Alexandra Mora-Martin, Department of Biochemistry, Boston University School of Medicine, Boston, MA 02118, USA.
Neil J Ganem, Departments of Pharmacology and Experimental Therapeutics, and Medicine, Cancer Center, Boston University School of Medicine, Boston, MA 02118, USA.
Daniel Cifuentes, Department of Biochemistry, Boston University School of Medicine, Boston, MA 02118, USA.
Ching-Shyi Wu, Department and Graduate Institute of Pharmacology, National Taiwan University College of Medicine, Taipei, 10051, Taiwan.
Jasbir Dalal, Department of Biochemistry, Boston University School of Medicine, Boston, MA 02118, USA.
Shawn M Lyons, Department of Biochemistry, Boston University School of Medicine, Boston, MA 02118, USA.
Adam Labadorf, Bioinformatics Program, Boston University, Boston, MA 02118 USA; Department of Neurology, Boston University School of Medicine, Boston, MA 02118 USA.
Rachel L Flynn, Departments of Pharmacology and Experimental Therapeutics, and Medicine, Cancer Center, Boston University School of Medicine, Boston, MA 02118, USA.
SUPPLEMENTARY DATA
Supplementary Data are available at NAR Online.
FUNDING
National Institutes of Health [R01CA214880to R.L.F.; T32HL00750to J.F.]. Funding for open access charge: National Institutes of Health [R01CA214880].
Conflict of interest statement. None declared.
REFERENCES
- 1.Lunde B.M., Moore C., Varani G.. RNA-binding proteins: modular design for efficient function. Nat. Rev. Mol. Cell Biol. 2007; 8:479–490. [DOI] [PMC free article] [PubMed] [Google Scholar]
- 2.He C., Sidoli S., Warneford-Thomson R., Tatomer D.C., Wilusz J.E., Garcia B.A., Bonasio R.. High-resolution mapping of RNA-binding regions in the nuclear proteome of embryonic stem cells. Mol. Cell. 2016; 64:416–430. [DOI] [PMC free article] [PubMed] [Google Scholar]
- 3.Castello A., Fischer B., Frese C.K., Horos R., Alleaume A.M., Foehr S., Curk T., Krijgsveld J., Hentze M.W.. Comprehensive identification of RNA-binding domains in human cells. Mol. Cell. 2016; 63:696–710. [DOI] [PMC free article] [PubMed] [Google Scholar]
- 4.Beckmann B.M., Horos R., Fischer B., Castello A., Eichelbaum K., Alleaume A.M., Schwarzl T., Curk T., Foehr S., Huber W.et al.. The RNA-binding proteomes from yeast to man harbour conserved enigmRBPs. Nat. Commun. 2015; 6:10127. [DOI] [PMC free article] [PubMed] [Google Scholar]
- 5.Baßler J., Hurt E.. Eukaryotic ribosome assembly. Annu. Rev. Biochem. 2019; 88:281–306. [DOI] [PubMed] [Google Scholar]
- 6.Ojha S., Malla S., Lyons S.M.. snoRNPs: functions in ribosome biogenesis. Biomol. 2020; 10:783. [DOI] [PMC free article] [PubMed] [Google Scholar]
- 7.Jurica M.S., Moore M.J.. Pre-mRNA splicing: awash in a sea of proteins. Mol. Cell. 2003; 12:5–14. [DOI] [PubMed] [Google Scholar]
- 8.Will C.L., Lu R.. Spliceosome structure and function. Cold Spring Harb. Perspect. Biol. 2011; 3:a003707. [DOI] [PMC free article] [PubMed] [Google Scholar]
- 9.Breitbart R.Alternative splicing: a ubiquitous mechanism for the generation of multiple protein isoforms from single genes. Annu. Rev. Biochem. 1987; 56:467–495. [DOI] [PubMed] [Google Scholar]
- 10.Xiong H.Y., Alipanahi B., Lee L.J., Bretschneider H., Merico D., Yuen R.K.C., Hua Y., Gueroussov S., Najafabadi H.S., Hughes T.R.et al.. The human splicing code reveals new insights into the genetic determinants of disease. Science (80-.). 2015; 347:1254806. [DOI] [PMC free article] [PubMed] [Google Scholar]
- 11.Dvinge H., Kim E., Abdel-Wahab O., Bradley R.K.. RNA splicing factors as oncoproteins and tumour suppressors. Nat. Rev. Cancer. 2016; 16:413–430. [DOI] [PMC free article] [PubMed] [Google Scholar]
- 12.Hsiao Y.-H.E., Bahn J.H., Yang Y., Lin X., Tran S., Yang E.-W., Quinones-Valdez G., Xiao X.. RNA editing in nascent RNA affects pre-mRNA splicing. Genome Res. 2018; 28:812–823. [DOI] [PMC free article] [PubMed] [Google Scholar]
- 13.Maniatis T., Tasic B.. Alternative pre-mRNA splicing and proteome expansion in metazoans. Nature. 2002; 418:236–243. [DOI] [PubMed] [Google Scholar]
- 14.Graveley B.R.Alternative splicing: Increasing diversity in the proteomic world. Trends Genet. 2001; 17:100–107. [DOI] [PubMed] [Google Scholar]
- 15.Wang E.T., Sandberg R., Luo S., Khrebtukova I., Zhang L., Mayr C., Kingsmore S.F., Schroth G.P., Burge C.B.. Alternative isoform regulation in human tissue transcriptomes. Nature. 2008; 456:470–476. [DOI] [PMC free article] [PubMed] [Google Scholar]
- 16.Sterne-Weiler T., Weatheritt R.J., Best A.J., Ha K.C.H., Blencowe B.J.. Efficient and accurate quantitative profiling of alternative splicing patterns of any complexity on a laptop. Mol. Cell. 2018; 72:187–200. [DOI] [PubMed] [Google Scholar]
- 17.Gebauer F., Schwarzl T., Valcárcel J., Hentze M.W.. RNA-binding proteins in human genetic disease. Nat. Rev. Genet. 2021; 22:185–198. [DOI] [PubMed] [Google Scholar]
- 18.Sugioka-Sugiyama R., Sugiyama T.. Sde2: a novel nuclear protein essential for telomeric silencing and genomic stability in Schizosaccharomyces pombe. Biochem. Biophys. Res. Commun. 2011; 406:444–448. [DOI] [PubMed] [Google Scholar]
- 19.Jo U., Cai W., Wang J., Kwon Y., D’Andrea A.D., Kim H.. PCNA-dependent cleavage and degradation of SDE2 regulates response to replication stress. PLoS Genet. 2016; 12:e1006465. [DOI] [PMC free article] [PubMed] [Google Scholar]
- 20.Thakran P., Pandit P.A., Datta S., Kolathur K.K., Pleiss J.A., Mishra S.K.. Sde2 is an intron-specific pre- mRNA splicing regulator activated by ubiquitin-like processing. EMBO J. 2018; 37:89–101. [DOI] [PMC free article] [PubMed] [Google Scholar]
- 21.Rageul J., Park J.J., Jo U., Weinheimer A.S., Vu T.T.M., Kim H.. Conditional degradation of SDE2 by the Arg/N-End rule pathway regulates stress response at replication forks. Nucleic Acids Res. 2019; 47:3996–4010. [DOI] [PMC free article] [PubMed] [Google Scholar]
- 22.Fica S.M., Oubridge C., Wilkinson M.E., Newman A.J., Nagai K.. A human postcatalytic spliceosome structure reveals essential roles of metazoan factors for exon ligation. Science (80-.). 2019; 363:710–714. [DOI] [PMC free article] [PubMed] [Google Scholar]
- 23.Huppertz I., Attig J., D’Ambrogio A., Easton L.E., Sibley C.R., Sugimoto Y., Tajnik M., König J., Ule J.. iCLIP: Protein-RNA interactions at nucleotide resolution. Methods. 2014; 65:274–287. [DOI] [PMC free article] [PubMed] [Google Scholar]
- 24.Bolger A.M., Lohse M., Usadel B.. Trimmomatic: a flexible trimmer for Illumina sequence data. Bioinformatics. 2014; 65:274–287. [DOI] [PMC free article] [PubMed] [Google Scholar]
- 25.Andrews S.FASTQC a quality control tool for high throughput sequence data. 2015; Babraham Inst.
- 26.Ewels P., Magnusson M., Lundin S., Käller M.. MultiQC: Summarize analysis results for multiple tools and samples in a single report. Bioinformatics. 2016; 32:3047–3048. [DOI] [PMC free article] [PubMed] [Google Scholar]
- 27.Van Nostrand E.L., Freese P., Pratt G.A., Wang X., Wei X., Xiao R., Blue S.M., Chen J.-Y., Cody N.A.L., Dominguez D.et al.. A large-scale binding and functional map of human RNA-binding proteins. Nature. 2020; 583:711–719. [DOI] [PMC free article] [PubMed] [Google Scholar]
- 28.Bao W., Kojima K.K., Kohany O.. Repbase Update, a database of repetitive elements in eukaryotic genomes. Mob. DNA. 2015; 6:11. [DOI] [PMC free article] [PubMed] [Google Scholar]
- 29.Bouchard-Bourelle P., Desjardins-Henri C., Mathurin-St-Pierre D., Deschamps-Francoeur G., Fafard-Couture É., Garant J.-M., Elela S.A., Scott M.S.. snoDB: an interactive database of human snoRNA sequences, abundance and interactions. Nucleic Acids Res. 2020; 48:D220–D225. [DOI] [PMC free article] [PubMed] [Google Scholar]
- 30.Chan P.P., Lowe T.M.. GtRNAdb 2.0: an expanded database of transfer RNA genes identified in complete and draft genomes. Nucleic Acids Res. 2016; 44:D184–D189. [DOI] [PMC free article] [PubMed] [Google Scholar]
- 31.Clipper Clipper. n.d. Github.
- 32.Repetitive-Element-Mapping Repetitive-Element-Mapping.
- 33.Urdaneta E.C., Vieira-Vieira C.H., Hick T., Wessels H.H., Figini D., Moschall R., Medenbach J., Ohler U., Granneman S., Selbach M.et al.. Purification of cross-linked RNA-protein complexes by phenol-toluol extraction. Nat. Commun. 2019; 10:990. [DOI] [PMC free article] [PubMed] [Google Scholar]
- 34.Harrow J., Frankish A., Gonzalez J.M., Tapanari E., Diekhans M., Kokocinski F., Aken B.L., Barrell D., Zadissa A., Searle S.et al.. GENCODE: The reference human genome annotation for the ENCODE project. Genome Res. 2012; 22:1760–1774. [DOI] [PMC free article] [PubMed] [Google Scholar]
- 35.Sterne-Weiler T., Weatheritt R.J., Best A.J., Ha K.C.H., Blencowe B.J.. Efficient and accurate quantitative profiling of alternative splicing patterns of any complexity on a laptop. Mol. Cell. 2018; 72:187–200. [DOI] [PubMed] [Google Scholar]
- 36.Middleton R., Gao D., Thomas A., Singh B., Au A., Wong J.J.L., Bomane A., Cosson B., Eyras E., Rasko J.E.J.et al.. IRFinder: assessing the impact of intron retention on mammalian gene expression. Genome Biol. 2017; 18:51. [DOI] [PMC free article] [PubMed] [Google Scholar]
- 37.Dobin A., Davis C.A., Schlesinger F., Drenkow J., Zaleski C., Jha S., Batut P., Chaisson M., Gingeras T.R.. STAR: Ultrafast universal RNA-seq aligner. Bioinformatics. 2013; 29:15–21. [DOI] [PMC free article] [PubMed] [Google Scholar]
- 38.Shen S., Park J.W., Lu Z.X., Lin L., Henry M.D., Wu Y.N., Zhou Q., Xing Y.. rMATS: Robust and flexible detection of differential alternative splicing from replicate RNA-Seq data. Proc. Natl. Acad. Sci. USA. 2014; 111:E5593–E5601. [DOI] [PMC free article] [PubMed] [Google Scholar]
- 39.Dunham I., Kundaje A., Aldred S.F., Collins P.J., Davis C.A., Doyle F., Epstein C.B., Frietze S., Harrow J., Kaul R.et al.. An integrated encyclopedia of DNA elements in the human genome. Nature. 2012; 489:57–74. [DOI] [PMC free article] [PubMed] [Google Scholar]
- 40.Yeo G., Burge C.B.. Maximum entropy modeling of short sequence motifs with applications to RNA splicing signals. J. Comput. Biol. 2004; 11:377–394. [DOI] [PubMed] [Google Scholar]
- 41.Tanackovic G., Krämer A.. Human splicing factor SF3a, but not SF1, is essential for pre-mRNA splicing in vivo. Mol. Biol. Cell. 2005; 16:1366–1377. [DOI] [PMC free article] [PubMed] [Google Scholar]
- 42.Iida T., Kawaguchi R., Nakayama J.. Conserved Ribonuclease, Eri1, Negatively Regulates Heterochromatin Assembly in Fission Yeast. Curr. Biol. 2006; 16:1459–1464. [DOI] [PubMed] [Google Scholar]
- 43.Aravind L., Koonin E.V.. SAP - A putative DNA-binding motif involved in chromosomal organization. Trends Biochem. Sci. 2000; 25:112–114. [DOI] [PubMed] [Google Scholar]
- 44.Van Nostrand E.L., Pratt G.A., Shishkin A.A., Gelboin-Burkhart C., Fang M.Y., Sundararaman B., Blue S.M., Nguyen T.B., Surka C., Elkins K.et al.. Robust transcriptome-wide discovery of RNA-binding protein binding sites with enhanced CLIP (eCLIP). Nat. Methods. 2016; 13:508–514. [DOI] [PMC free article] [PubMed] [Google Scholar]
- 45.Yeo G.W., Coufal N.G., Liang T.Y., Peng G.E., Fu X.-D., Gage F.H.. An RNA code for the FOX2 splicing regulator revealed by mapping RNA-protein interactions in stem cells. Nat. Struct. Mol. Biol. 2009; 16:130–137. [DOI] [PMC free article] [PubMed] [Google Scholar]
- 46.Lovci M.T., Ghanem D., Marr H., Arnold J., Gee S., Parra M., Liang T.Y., Stark T.J., Gehman L.T., Hoon S.et al.. Rbfox proteins regulate alternative mRNA splicing through evolutionarily conserved RNA bridges. Nat. Struct. Mol. Biol. 2013; 20:1434–1442. [DOI] [PMC free article] [PubMed] [Google Scholar]
- 47.Nostrand E.L.V., Freese P., Pratt G.A., Wang X., Wei X., Xiao R., Blue S.M., Chen J.Y., Cody N.A.L., Dominguez D.et al.. A Large-Scale Binding and Functional Map of Human RNA-Binding Proteins. Nature. 2020; 583:711–719. [DOI] [PMC free article] [PubMed] [Google Scholar]
- 48.Kiss T.Small nucleolar RNAs: an abundant group of noncoding RNAs with diverse cellular functions. Cell. 2002; 109:145–148. [DOI] [PubMed] [Google Scholar]
- 49.Jorjani H., Kehr S., Jedlinski D.J., Gumienny R., Hertel J., Stadler P.F., Zavolan M., Gruber A.R.. An updated human snoRNAome. Nucleic Acids Res. 2016; 44:5068–5082. [DOI] [PMC free article] [PubMed] [Google Scholar]
- 50.Langhendries J.-L., Nicolas E., Doumont G., Goldman S., Lafontaine D.L.J.. The human box C/D snoRNAs U3 and U8 are required for pre-rRNA processing and tumorigenesis. Oncotarget. 2016; 7:59519–59534. [DOI] [PMC free article] [PubMed] [Google Scholar]
- 51.Golomb L., Volarevic S., Oren M.. p53 and ribosome biogenesis stress: the essentials. FEBS Lett. 2014; 588:2571–2579. [DOI] [PubMed] [Google Scholar]
- 52.Farley-Barnes K.I., McCann K.L., Ogawa L.M., Merkel J., Surovtseva Y.V., Baserga S.J.. Diverse regulators of human ribosome biogenesis discovered by changes in nucleolar number. Cell Rep. 2018; 22:1923–1934. [DOI] [PMC free article] [PubMed] [Google Scholar]
- 53.Nicolas E., Parisot P., Pinto-Monteiro C., de Walque R., De Vleeschouwer C., Lafontaine D.L.J.. Involvement of human ribosomal proteins in nucleolar structure and p53-dependent nucleolar stress. Nat. Commun. 2016; 7:11390. [DOI] [PMC free article] [PubMed] [Google Scholar]
- 54.Pederson T.The nucleolus. Cold Spring Harb. Perspect. Biol. 2011; 3:a000638. [DOI] [PMC free article] [PubMed] [Google Scholar]
- 55.He J.-S., Soo P., Evers M., Parsons K.M., Hein N., Hannan K.M., Hannan R.D., George A.J.. High-content imaging approaches to quantitate stress-induced changes in nucleolar morphology. Assay Drug Dev. Technol. 2018; 16:320–332. [DOI] [PubMed] [Google Scholar]
- 56.Hernandez-Verdun D., Roussel P., Thiry M., Sirri V., Lafontaine D.L.. The nucleolus: structure/function relationship in RNA metabolism. Wiley Interdiscip. Rev. RNA. 2010; 1:415–431. [DOI] [PubMed] [Google Scholar]
- 57.Schmidt E.K., Clavarino G., Ceppi M., Pierre P.. SUnSET, a nonradioactive method to monitor protein synthesis. Nat. Methods. 2009; 6:275–277. [DOI] [PubMed] [Google Scholar]
- 58.Kishore S., Stamm S.. The snoRNA HBII-52 regulates alternative splicing of the serotonin receptor 2C. Science. 2006; 311:230–232. [DOI] [PubMed] [Google Scholar]
- 59.Cavaillé J., Buiting K., Kiefmann M., Lalande M., Brannan C.I., Horsthemke B., Bachellerie J.P., Brosius J., Hüttenhofer A.. Identification of brain-specific and imprinted small nucleolar RNA genes exhibiting an unusual genomic organization. Proc. Natl. Acad. Sci. U.S.A. 2000; 97:14311–14316. [DOI] [PMC free article] [PubMed] [Google Scholar]
- 60.Kishore S., Khanna A., Zhang Z., Hui J., Balwierz P.J., Stefan M., Beach C., Nicholls R.D., Zavolan M., Stamm S.. The snoRNA MBII-52 (SNORD 115) is processed into smaller RNAs and regulates alternative splicing. Hum. Mol. Genet. 2010; 19:1153–1164. [DOI] [PMC free article] [PubMed] [Google Scholar]
- 61.Falaleeva M., Pages A., Matuszek Z., Hidmi S., Agranat-Tamir L., Korotkov K., Nevo Y., Eyras E., Sperling R., Stamm S.. Dual function of C/D box small nucleolar RNAs in rRNA modification and alternative pre-mRNA splicing. Proc. Natl. Acad. Sci. 2016; 113:E1625–E1634. [DOI] [PMC free article] [PubMed] [Google Scholar]
- 62.Hirose T., Ideue T., Nagai M., Hagiwara M., Shu M.-D., Steitz J.A.. A Spliceosomal Intron Binding Protein, IBP160, Links Position-Dependent Assembly of Intron-Encoded Box C/D snoRNP to Pre-mRNA Splicing. Mol. Cell. 2006; 23:673–684. [DOI] [PubMed] [Google Scholar]
- 63.Li Z., Lee I., Moradi E., Hung N.-J., Johnson A.W., Marcotte E.M.. Rational extension of the ribosome biogenesis pathway using network-guided genetics. PLoS Biol. 2009; 7:e1000213. [DOI] [PMC free article] [PubMed] [Google Scholar]
- 64.Akef A., McGraw K., Cappell S.D., Larson D.R.. Ribosome biogenesis is a downstream effector of the oncogenic U2AF1-S34F mutation. PLoS Biol. 2020; 18:e3000920. [DOI] [PMC free article] [PubMed] [Google Scholar]
- 65.Nottrott S., Urlaub H., Lührmann R.. Hierarchical, clustered protein interactions with U4/U6 snRNA: a biochemical role for U4/U6 proteins. EMBO J. 2002; 21:5527–5538. [DOI] [PMC free article] [PubMed] [Google Scholar]
- 66.Bessonov S., Anokhina M., Will C.L., Urlaub H., Lührmann R.. Isolation of an active step I spliceosome and composition of its RNP core. Nature. 2008; 452:846–850. [DOI] [PubMed] [Google Scholar]
- 67.Yeo G., Holste D., Kreiman G., Burge C.B.. Variation in alternative splicing across human tissues. Genome Biol. 2004; 5:R74. [DOI] [PMC free article] [PubMed] [Google Scholar]
- 68.Boutz P.L., Bhutkar A., Sharp P.A.. Detained introns are a novel, widespread class of post-transcriptionally spliced introns. Genes Dev. 2015; 29:63–80. [DOI] [PMC free article] [PubMed] [Google Scholar]
- 69.Braunschweig U., Barbosa-Morais N.L., Pan Q., Nachman E.N., Alipanahi B., Gonatopoulos-Pournatzis T., Frey B., Irimia M., Blencowe B.J.. Widespread intron retention in mammals functionally tunes transcriptomes. Genome Res. 2014; 24:1774–1786. [DOI] [PMC free article] [PubMed] [Google Scholar]
- 70.De Conti L., Baralle M., Buratti E.. Exon and intron definition in pre-mRNA splicing. WIREs RNA. 2013; 4:49–60. [DOI] [PubMed] [Google Scholar]
- 71.Sakabe N.J., de Souza S.J.. Sequence features responsible for intron retention in human. BMC Genomics. 2007; 8:59. [DOI] [PMC free article] [PubMed] [Google Scholar]
- 72.Galante P.A.F., Sakabe N.J., Kirschbaum-Slager N., De Souza S.J.. Detection and evaluation of intron retention events in the human transcriptome. RNA. 2004; 10:757–765. [DOI] [PMC free article] [PubMed] [Google Scholar]
- 73.Yeo G., Burge C.B.. Maximum entropy modeling of short sequence motifs with applications to RNA splicing signals. J. Comput. Biol. 2004; 11:377–394. [DOI] [PubMed] [Google Scholar]
- 74.DepmapBroad 2019; DepMap Achilles 19Q1 Public. figshare. Fileset.
- 75.Terns M.P., Terns R.M.. Small nucleolar RNAs: versatile trans-acting molecules of ancient evolutionary origin. Gene Expr. 2002; 10:17–39. [PMC free article] [PubMed] [Google Scholar]
- 76.Hughes J.M.X.Functional Base-pairing Interaction Between Highly Conserved Elements of U3 Small Nucleolar RNA and the Small Ribosomal Subunit RNA. J. Mol. Biol. 1996; 259:645–654. [DOI] [PubMed] [Google Scholar]
- 77.Tyc K., Steitz J.A.. U3, U8 and U13 comprise a new class of mammalian snRNPs localized in the cell nucleolus. EMBO J. 1989; 8:3113–3119. [DOI] [PMC free article] [PubMed] [Google Scholar]
- 78.Lukowiak A.A., Granneman S., Mattox S.A., Speckmann W.A., Jones K., Pluk H., Venrooij W.J., Terns R.M., Terns M.P.. Interaction of the U3-55k protein with U3 snoRNA is mediated by the box B/C motif of U3 and the WD repeats of U3-55k. Nucleic Acids Res. 2000; 28:3462–3471. [DOI] [PMC free article] [PubMed] [Google Scholar]
- 79.Kiss-László Z., Henry Y., Bachellerie J.-P., Caizergues-Ferrer M., Kiss T.. Site-specific ribose methylation of preribosomal RNA: a novel function for small nucleolar RNAs. Cell. 1996; 85:1077–1088. [DOI] [PubMed] [Google Scholar]
- 80.Elliott B.A., Ho H.-T., Ranganathan S.V, Vangaveti S., Ilkayeva O., Abou Assi H., Choi A.K., Agris P.F., Holley C.L.. Modification of messenger RNA by 2′-O-methylation regulates gene expression in vivo. Nat. Commun. 2019; 10:3401. [DOI] [PMC free article] [PubMed] [Google Scholar]
- 81.Jády B.E., Kiss T.. A small nucleolar guide RNA functions both in 2′-O-ribose methylation and pseudouridylation of the U5 spliceosomal RNA. EMBO J. 2001; 20:541–551. [DOI] [PMC free article] [PubMed] [Google Scholar]
- 82.Karijolich J., Yu Y.-T.. Spliceosomal snRNA modifications and their function. RNA Biol. 2010; 7:192–204. [DOI] [PMC free article] [PubMed] [Google Scholar]
- 83.Heyer E.E., Moore M.J.. Redefining the translational status of 80S monosomes. Cell. 2016; 164:757–769. [DOI] [PubMed] [Google Scholar]
- 84.Bayne E.H., Portoso M., Kagansky A., Kos-Braun I.C., Urano T., Ekwall K., Alves F., Rappsilber J., Allshire R.C.. Splicing factors facilitate RNAi-directed silencing in fission yeast. Science (80-.). 2008; 322:602–606. [DOI] [PMC free article] [PubMed] [Google Scholar]
- 85.Chen W., Shulha H.P., Ashar-Patel A., Yan J., Green K.M., Query C.C., Rhind N., Weng Z., Moore M.J.. Endogenous U2•U5•U6 snRNA complexes in S. pombe are intron lariat spliceosomes. RNA. 2014; 20:308–320. [DOI] [PMC free article] [PubMed] [Google Scholar]
- 86.Shcherbik N., Pestov D.G.. Ubiquitin and ubiquitin-like proteins in the nucleolus: multitasking tools for a ribosome factory. Genes Cancer. 2010; 1:681–689. [DOI] [PMC free article] [PubMed] [Google Scholar]
- 87.Chanarat S., Mishra S.K.. Emerging roles of ubiquitin-like proteins in pre-mRNA splicing. Trends Biochem. Sci. 2018; 43:896–907. [DOI] [PubMed] [Google Scholar]
Associated Data
This section collects any data citations, data availability statements, or supplementary materials included in this article.
Supplementary Materials
Data Availability Statement
All code generated during this study are publicly available at https://bitbucket.org/bucab/sde2. All datasets generated during this study are publicly available through NCBI’s Gene Expression Omnibus and are accessible through GEO Series accession number GSE143258 https://www.ncbi.nlm.nih.gov/geo/query/acc.cgi?acc=GSE143258.