Abstract
The perinatal period, sensitive for newborn survival, is also one of the most critical moments in human brain development. Perinatal hypoxia due to reduced blood supply to the brain (ischemia) is one of the main causes of neonatal mortality. Brain damage caused by perinatal hypoxia–ischemia (HI) can lead to neuro‐ and psychological disorders. However, its impact seems to be region‐dependent, with the hippocampus being one of the most affected areas. Among the neuronal populations of the hippocampus, some interneuron groups – such as somatostatin‐ or neuropeptide Y‐expressing neurons – seem to be particularly vulnerable. The limited information available about the effects of HI in the hippocampus comes mainly from animal models and adult human studies. This article presents an immunohistochemical analysis of somatostatin (SOM) and neuropeptide Y (NPY) expression in the developing human hippocampus after perinatal HI. Two rostrocaudal sections of the body of the hippocampus were analysed, and the number of immunostained cells in the polymorphic layer of the dentate gyrus (DG) and the pyramidal cell layer and stratum oriens of the CA3, CA2 and CA1 fields of the hippocampus proper were quantified. The results showed a lower density of both neuropeptides in hypoxic compared to control cases. In the HI group, the number of SOM‐immunoreactive cell bodies was statistically significantly lower in the pyramidal cell layer and stratum oriens of CA1, while the number of NPY‐expressing neurons was statistically lower in the pyramidal cell layer of CA2. Besides, the number of SOM‐expressing neurons was significantly higher in the stratum oriens of CA1 compared to that in CA2. In sum, we observed a different vulnerability of SOM‐ and NPY‐containing neurons in the developing human hippocampus following perinatal HI damage. Our results could contribute to a better understanding of the behaviour of these neuronal populations under stressful conditions during the perinatal period.
Keywords: brain development, hippocampus, hypoxia–ischemia, neuropeptide Y, somatostatin
Hypoxia‐ischemia during the perinatal period could damage the hippocampal interneuron populations which might lead to the appearance of different problems during subsequent development. Interneurons containing Somatostatin and Neuropeptide Y located in the hippocampal ammonic fields are affected differently, although there is a global reduction after suffering perinatal hypoxia‐ischemia. This work is the first study that describes this issue in depth in the developmental human hippocampus.
1. INTRODUCTION
The perinatal period is one of the critical moments in human brain development, as well as a sensitive period for newborn survival. Perinatal hypoxia due to reduced blood supply to the brain (ischemia) is one of the most important causes of neonatal mortality, linked to approximately 25% of the total number of deaths in the early stages of the immediate postnatal period (Lawn et al., 2014). Brain damage caused by perinatal hypoxia–ischemia (HI) can lead to disorders in the neurological and psychological development, i.e., cerebral palsy, mental retardation, learning disabilities, cognitive deficits (Vannucci & Hagberg, 2004) and attention‐deficit/hyperactivity disorder (Smith et al., 2016).
Compared with the adult brain, the immature brain has long been considered “resistant” to the damaging effects of HI, although with periods of heightened sensitivity to injuries (Vannucci & Hagberg, 2004). Several mechanisms exist in the foetus that might counteract the conditions of reduced oxygenation during gestation. However, when these mechanisms are not sufficiently effective, the developing brain may be exposed to HI injuries (Nalivaeva et al., 2018). Although neurons are more vulnerable to hypoxia than other cell types (Nalivaeva et al., 2018), the effects of HI differ depending on the developmental stage. Insults occurring up to the 24th week of gestation affect axon/dendritic formation, synaptogenesis and myelination, which impinge upon circuitry maintenance and/or development (Rumajogee et al., 2016). Thus, gestational age is a critical factor in the pattern of brain damage (Swarte et al., 2009).
Besides, brain damage following HI seems to be region‐dependent, with the brainstem, thalamus and hippocampus being the most vulnerable areas (Johnston, 2005; Nikonenko et al., 2009; Northington et al., 2001; Swarte et al., 2009). The hippocampus, which plays a key role in memory and learning processes, is particularly sensitive to HI (Bird & Burgess, 2008). Damage to the hippocampus, mainly in the CA1 field, was noticeable in the days immediately following an HI episode in rats (Almli et al., 2000; Kuchna, 1994; Towfighi et al., 1997). In addition, several neuronal populations (among them, interneurons) display selective vulnerability to HI (Bering & Johansen, 1993; Hsu et al., 1994; Johansen, 1993; Larsson et al., 2001; Matsuyama et al., 1993; Schwarzer et al., 1996).
Most of the data on HI brain damage, particularly the effect of HI on hippocampal interneurons, are based on animal model studies. Although a small number of human studies are available, none have focused on the perinatal period. Our group has previously reported the existence of physiological variations in the cell density of the interneurons containing somatostatin (SOM) and neuropeptide Y (NPY) – both considered markers of GABAergic hippocampal interneurons – in the human dentate gyrus of the hippocampus during the postnatal development in control cases (Cebada‐Sanchez et al., 2014). However, there are no data on the effects of HI on these neuronal populations. Since hippocampal interneurons contribute to the regulation of the connections underlying memory and learning processes, their pathological variations after HI might alter information transmission along the pathways they control – with further functional consequences. Therefore, our study aims to look at possible variations in the cell density of somatostatin‐ (SOM)‐ and neuropeptide Y‐immunoreactive (NPY‐IR) interneurons in the human DG and hippocampal fields following neuropathological diagnosis of perinatal HI injury.
2. MATERIALS AND METHODS
Ten infant brain cases from routine autopsies were used in this study (Table 1). After neuropathological examination, six cases (numbers 5–10 in Table 1) were diagnosed as hypoxic (hypoxic group, HYG). Diagnosis was based on hypoxia indicators such as cytoplasm retraction, pyknotic nuclei and disruption of normal neuronal morphology. Four cases (numbers 1–4 in Table 1) were considered control cases (control group, CG) as they did not show any clinical or neuropathological signs of hypoxia–ischemia. Demographic information on the different cases (age, gender, cause of death) is presented in Table 1. Approval was obtained from the Ethics Committee for Clinical Research of the University Hospital in Albacete (Spain), following Spanish legislation and the Declaration of Helsinki for Medical Research involving Human Subjects.
TABLE 1.
Relation of the cases considered for this study
| Case number | Gestational age at birth | Postnatal life time | Total age at death (w) | Gender | Cause of death | Post‐mortem time (h) | Clinical signs and Neuropathological aspects |
|---|---|---|---|---|---|---|---|
| 1 | 36 w | 3 h | 36.01 | M | Respiratory Failure | 5 | No hypoxia signs |
| 2 | 40 w | 40 | F | Foetal death | 12–24 | No hypoxia signs | |
| 3 | 39 w | 22 d | 42.1 | M | Bronchial pneumonia | 12–24 | No hypoxia signs |
| 4 | 41 w + 6 d | 14 d | 43.8 | M | Multiorganic failure. Congenital heart disease | 12–24 | No hypoxia signs |
| 5 | 33.5 w | 6 d | 34.5 | M | Sepsis | 2 | Minor hypoxic changes |
| 6 | 36 w | 4 d | 36.5 | M | Multiple haemorrhages | 2.5 | Recent signs of hipoxia in areas of selective vulnerability (i.e hippocapus and watershed regions) |
| 7 | 38 w | 2 d | 38.3 | M | Disseminated intravascular coagulation | 5 |
Ischemic cortical neurons Signs of hypoxic alterations |
| 8 | 40 w | 7 h | 40.03 | F | Bronchial pneumonia. Brain oedema | 12–24 |
Perinatal asphyxia. Foetal suffering Signs of hypoxia |
| 9 | 40 w | 8 h | 40.04 | M | Bronchial pneumonia | 5 |
White matter oedema. Reactive astrocytosis Signs of hypoxic alterations |
| 10 | 41 w | 1 d | 41.1 | M | Left diaphragmatic herniation | 7 | Severe hypoxemia |
Demographic data like gestational age at birth, postnatal life time, total age at death (Gestational age + Postnatal life time) and gender are represented in separate columns. The cause of death, postmortem time (from death to the autopsy) as well as clinical signs and neuropathological aspects, showing the most relevat aspects of the autopsy report, are described. Abbreviations: h: hours, d: days, w: weeks, F: female, M: male.
2.1. Tissue processing
All samples were processed following the same protocol. Brains were immersion‐fixed in 10% formalin, and after a variable period of storage (typically under one year), they were transferred to 4% paraformaldehyde in phosphate‐buffered saline (PBS), 0.1 M, pH 7.4, for at least one month (Insausti et al., 2010). Hemispheres were then cut in the coronal plane into 1‐cm‐thick slabs, orthogonal to the line between the anterior and posterior commissures (intercommissural line), as described elsewhere (Insausti et al., 2010). Blocks from the temporal lobe containing the hippocampus and parahippocampal gyrus (thus including the whole hippocampal formation) were dissected and cryoprotected by immersion in increasingly graded sucrose solutions (15%–30% in PBS) until they sank. Blocks were then serially sectioned in the coronal plane into 50‐μm‐thick sections using a sliding microtome coupled to a freezing unit (Micron, Heidelberg, Germany). One of every five sections (250 µm between adjacent sections) was immediately mounted onto gelatin‐coated slides for Nissl staining with 0.25% thionin. Adjacent sections were used for immunohistochemical (IHC) analysis.
2.2. IHC procedure
The IHC procedure was carried out in a series of one‐in‐ten free‐floating sections (500 µm between adjacent sections), following a previously described protocol particularly well‐suited for human brain tissue (Cebada‐Sanchez et al., 2014; Covenas et al., 2014; Covenas et al., 2015). This protocol increases the sensitivity of immunolabelling and minimises background interference (Ramos‐Vara, 2005). To reduce possible variability among batches, simultaneous processing was carried out in all cases. Sections were extensively washed in PBS, followed by immersion in a 1% NaOH, 10% ammonium and 10% hydrogen peroxide solution for 15 min to inhibit endogenous peroxidase activity (Guntern et al., 1989). After several washes in PBS, the sections were pre‐incubated in a 1% bovine serum albumin, 1% normal horse serum and 0.3% Triton X‐100 PBS solution. The primary antibodies used were goat anti‐SOM‐28 (D‐20, sc‐7819 Santa Cruz Biotechnology Inc.), and rabbit anti‐NPY (FL‐97, sc‐28943 Santa Cruz Biotechnology Inc.).
Incubations with primary antibodies were carried out overnight at 4ºC in agitation. Sections were then incubated with the corresponding biotinylated secondary antibody (1:2000 anti‐goat for SOM and anti‐rabbit for NPY; Jackson Immunoresearch Laboratories Inc.) for 90 min, and then in peroxidase‐coupled streptavidin (1:2000, Jackson Immunoresearch Laboratories Inc.) for another 90 min. The reaction product was visualised with a 0.25% 3.3’‐diaminobenzidine and 0.3% hydrogen peroxide solution. Sections were faintly counterstained with thionin, dehydrated and coverslipped with DPX.
Primary antibodies used in this study are well‐known, and have been used in previous studies to detect interneurons in human tissue (Cebada‐Sanchez et al., 2014). Their specificity was checked based on the manufacturer's technical information. The epitope of goat anti‐SOM was located close to the C‐terminus of human SOM, and the immunogen was a synthetic peptide mapping amino acids 84–102 of human SOM. Anti‐NPY antibody is a rabbit polyclonal antibody raised against amino acids 1–97, representing the full‐length human NPY. No cross‐reactions with other peptides have been reported. However, negative controls were included in all IHC experiments to ensure the specificity of the immunostaining: (i) by replacing the primary antibody with blocking solution, or pre‐immune goat or horse serum, or (ii) by omitting the secondary antibody or replacing it with an inappropriate secondary antibody. No immunolabelling was detected in control sections (Figure 1a and b).
FIGURE 1.
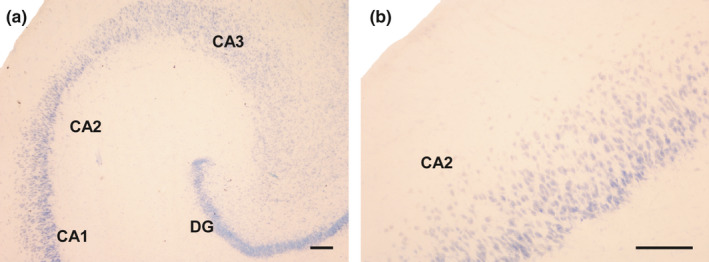
Negative controls for the antibodies used in this study. (a): The primary antibodies (goat anti‐SOM and rabbit anti‐NPY) were omitted from their respective incubation baths, and sections were reacted with the respective biotinylated secondary antibodies and streptavidin before being counterstained with thionin. (b): Section incubated with primary antibody goat anti‐SOM followed by a biotinylated goat anti‐rabbit antibody and streptavidin. No immunoreaction was detected. See also controls carried out for the same antibodies in a previous work (Cebada‐Sánchez et al., 2014). Abbreviations: DG: dentate gyrus; CA1: ammonic hippocampal field 1; CA2: ammonic hippocampal field 2. Scale bar: 200 µm
2.3. Mapping
In each case, sections taken from two rostrocaudal levels of the hippocampal body were analysed. A detailed description of the human hippocampal formation (HF) (Insausti et al., 2010) was used to determine the fields and regions of the HF during the different perinatal stages. The density of immunoreactive (IR) cells (immunostained cells/mm2) in the polymorphic layer of the DG, as well as in the stratum pyramidale and stratum oriens in the CA3, CA2 and CA1 regions of the hippocampus proper, was quantified at each level and for each neuropeptide.
The distribution of IR neurons was examined under a light microscope (Nikon Eclipse 80‐i) and mapped with MDPLOT v4 software (AccuStage, Minnesota Datametrics MD‐3 Digitizer). This was also used for calculation of the IR neuron density (IR cells/mm2). Images were taken of the different layers and sections, and were digitally processed using Adobe Photoshop CS 8.0.1 software – adjusting brightness and contrast only. Images and illustrations were prepared with Canvas X Build 925 (Deneba).
2.4. Statistical analysis
The statistical analysis was carried out using the SPSS Statistical Software Package 19.0 (SPSS Inc., Chicago, Illinois, U.S.A). Individual data for each case, region, and layer are shown in Table 2. The mean cell density value (immunostained cells/mm2) in each group (CG and HYG) was used for the statistical analysis. The normal distribution was verified using the Shapiro–Wilk test. Levene's test was performed to confirm the equality of variances. An unpaired t‐test (p < 0.05) was employed to assess the data obtained from density analysis. Although the data showed a normal distribution, since the number of cases studied was low, a non‐parametric Mann–Whitney test was carried out to support the results of the parametric tests. Data were expressed as means ± SEM for each group.
TABLE 2.
Individual values for each case/region/layer
| Region | DG | CA3 | CA2 | CA1 | |||
|---|---|---|---|---|---|---|---|
| Layer | pl | pyr | so | Pyr | so | pyr | so |
| SOM | |||||||
| Case 1 | 105.7 | 15.7 | 60.5 | 13.3 | 12.1 | 19.4 | 39.8 |
| Case 2 | 64.3 | 14.0 | 40.7 | 13.2 | 18.9 | 34.4 | 49.8 |
| Case 3 | 24.0 | 7.3 | 14.6 | 9.0 | 8.6 | 13.6 | 23.1 |
| Case 4 | 71.0 | 22.3 | 26.8 | 20.2 | 13.3 | 26.6 | 38.4 |
| Case 5 | 33.4 | 9.6 | 10.8 | 22.3 | 19.7 | 10.8 | 22.7 |
| Case 6 | 59.0 | 16.7 | 46.6 | 13.3 | 35.0 | 14.7 | 32.4 |
| Case 7 | 51.0 | 8.8 | 33.3 | 15.1 | 18.3 | 19.3 | 30.1 |
| Case 8 | 36.2 | 11.5 | 9.9 | 5.4 | 8.5 | 12.1 | 23.5 |
| Case 9 | 12.5 | 6.3 | 8.7 | 5.4 | 13.3 | 4.8 | 14.8 |
| Case 10 | 47.5 | 11.0 | 20.9 | 13.2 | 16.4 | 13.2 | 22.8 |
| NPY | |||||||
| Case 1 | 35.8 | 5.4 | 32.0 | 13.1 | 11.8 | 3.6 | 15.7 |
| Case 2 | 42.5 | 6.3 | 15.5 | 9.6 | 7.6 | 6.3 | 19.6 |
| Case 3 | 18.8 | 2.9 | 4.0 | 2.4 | 2.4 | 1.7 | 6.3 |
| Case 4 | 49.9 | 4.3 | 13.8 | 7.8 | 5.1 | 5.4 | 19.0 |
| Case 5 | 20.7 | 0.4 | 13.7 | 0.0 | 4.7 | 6.4 | 9.8 |
| Case 6 | 64.3 | 9.7 | 34.5 | 7.2 | 17.4 | 4.6 | 21.4 |
| Case 7 | 21.5 | 2.5 | 3.5 | 0.0 | 4.1 | 0.3 | 3.8 |
| Case 8 | 0.4 | 0.5 | 0.0 | 0.0 | 0.8 | 0.3 | 2.8 |
| Case 9 | 0.2 | 0.0 | 0.3 | 0.0 | 9.0 | 0.5 | 2.8 |
| Case 10 | 38.9 | 5.9 | 18.6 | 4.7 | 8.5 | 2.8 | 19.4 |
The data are expressed as density of cells (immunostained cells/mm2).
3. RESULTS
Microscopic analysis comparison of the CG and HYG did not show clear differences in the principal cells of the hippocampus. Only case 6, from the HYG, displayed a remarkable cell loss in the granular cell layer of the DG and the pyramidal cell layer of the ammonic fields (CAs) (Figure 2a and 2b). This massive cell loss was observed mainly in layers containing principal cells (Figure 2c–h). The individual data indicate that the density of SOM‐ or NPY‐expressing neurons did not show significant variation from other hypoxic cases, including controls (Table 2). Only SOM‐IR neurons of the pyramidal layer of CA2 and CA1 and NPY‐IR neurons of the same layer of CA1 showed a slight decrease in density compared to other cases (Figure 2e–h). In the remainder of the regions analysed, the values found in case 6 were similar and even higher than those found in other cases. Therefore, they do not contribute substantially to the generalised decrease observed in the HYG compared to the CG. In general, cases 3 (CG) and 8–9 (HYG) displayed the lowest density values in all layers and regions analysed.
FIGURE 2.
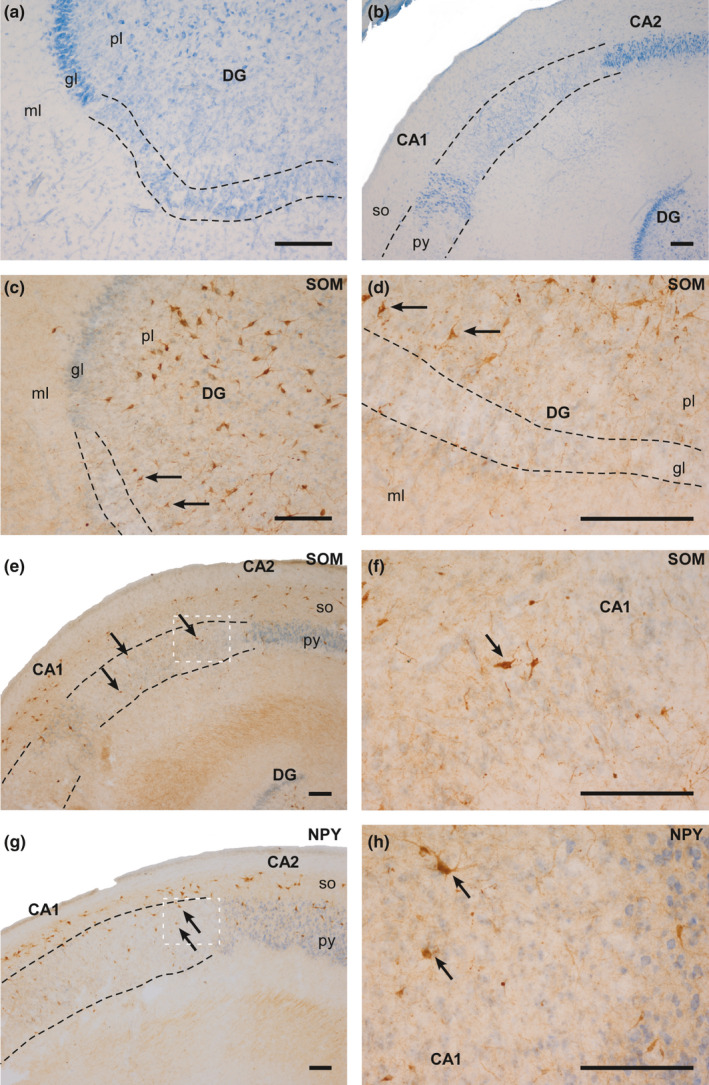
Photographs of different fields of the hippocampus of case 6 (HYG). Clear cell loss can be observed (dashed line), mainly in the granular layer of the DG and in the pyramidal layer. (a and b): Nissl‐staining of DG (a) and ammonic fields (b). (c and d): SOM‐IR counterstained with thionin in the DG. The arrows indicate SOM‐IR cells in the polymorphic layer of the DG. (e): SOM‐IR counterstained with thionin in CA2 and CA1. The arrows indicate SOM‐IR cells in the pyramidal layer of CA1. (f): High‐power magnification of image (e). (g): NPY‐IR counterstained with thionin in CA2 and CA1. The arrows indicate NPY‐IR cells in the pyramidal layer of CA1. (h): High‐power magnification of image G. Abbreviations: DG: dentate gyrus; ml: molecular layer; gl: granular layer; pl: polymorphic layer; py: pyramidal layer; so: stratum oriens; CA1: ammonic hippocampal field 1; CA2: ammonic hippocampal field 2. Scale bar: 200 µm
Individual values of neuronal density were relatively heterogeneous (Table 2). However, the overall number of IR neurons was higher for SOM than NPY in all the fields of the hippocampus (Figures 3, 4, and 5). Moreover, the HYG had a lower density of SOM and NPY cells in all the fields analysed compared to the CG, except the stratum oriens in CA2 (Figure 5d). Significant differences between both groups (p < 0.05) were detected in the pyramidal layer and stratum oriens of CA1 for SOM (Figures 4e and 5e) and pyramidal layer of CA2 for NPY (Figure 4d).
FIGURE 3.
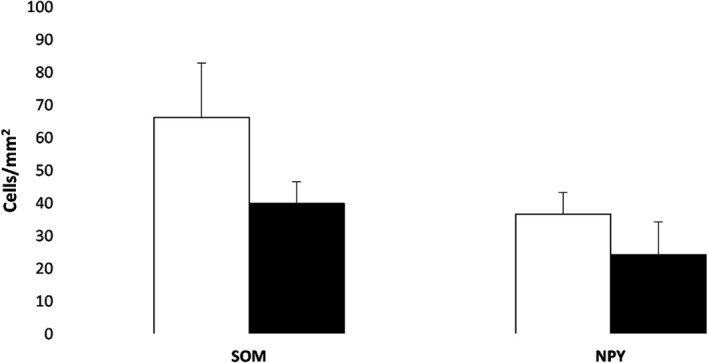
Analysis of SOM‐IR and NPY‐IR cells in the polymorphic layer of the DG. Histograms show the mean value (±SEM) of SOM‐IR and NPY‐IR neuron density (cells/mm2) in CG (white bar) and HYG (dark bar)
FIGURE 4.
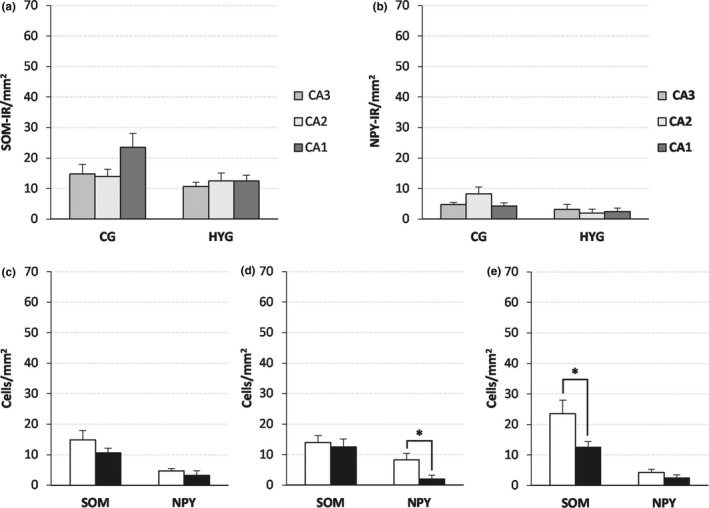
SOM‐IR and NPY‐IR cell density (mean ± SEM) in the pyramidal layer of the ammonic fields. (a and b) SOM‐IR (a) and NPY‐IR (b) cell density by groups. (c–e) SOM‐IR and NPY‐IR cell density by area, (c) CA3, (d) CA2, and (e) CA1. White bar: CG; black bar: HYG. Significance *: p < 0.05. Abbreviations: CG: control group. HYG: hypoxia–ischemia group
FIGURE 5.
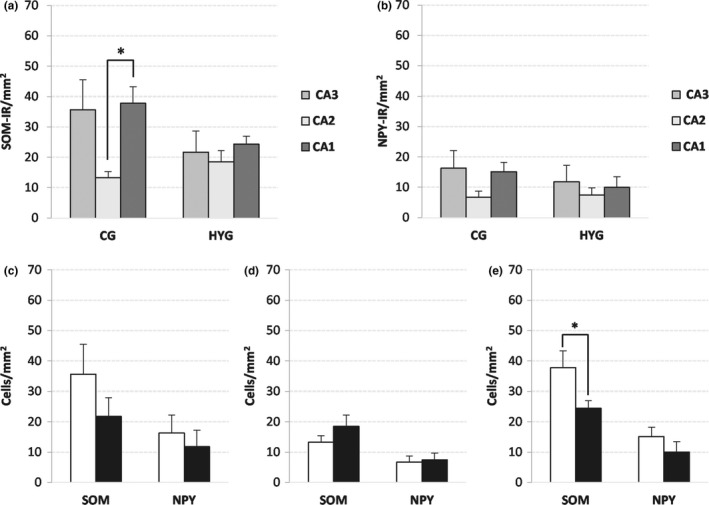
SOM‐IR and NPY‐IR cell density (mean ± SEM) in the stratum oriens. (a) and (b) SOM‐IR (a) and NPY‐IR (b) cell density by groups. (c–e) SOM‐IR and NPY‐IR cell density by area, (c) CA3, (d) CA2, and (e) CA1. White bar: CG; black bar: HYG. Significance *: p < 0.05. Abbreviations: CG: control group. HYG: hypoxia–ischemia group
3.1. Dentate gyrus
Most positive neurons were located at the central zone of the polymorphic layer, with little or no IR present in the infragranular zone, although the distribution of SOM‐IR and NPY‐IR neurons was similar in both groups (Figure 6).
FIGURE 6.
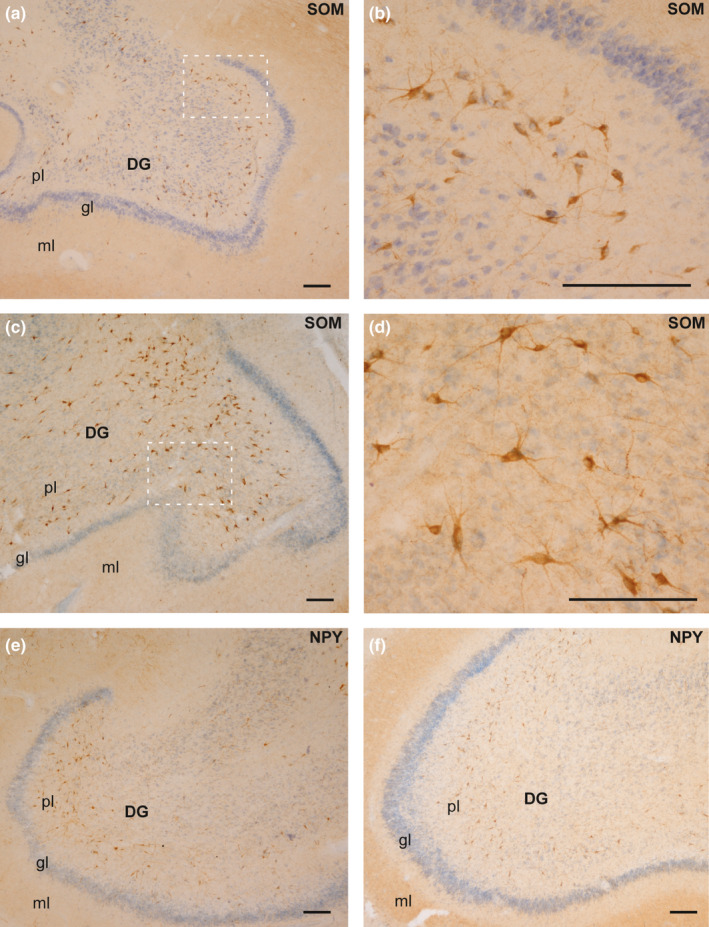
Distribution of SOM (a–d) and NPY (e–f) in the DG in both experimental groups. (a) SOM‐expressing neurons in the polymorphic layer of DG (case 4, CG). (b) High‐power magnification of the image squared in (a). (c) Distribution of SOM‐IR neurons in the HYG (case 6). (d) Magnification of the area squared in (c). (e): NPY‐IR neurons in the polymorphic layer of DG (case 2, CG). (f): Distribution of NPY‐expressing neurons in case 10 (HYG). Abbreviations: DG: dentate gyrus; ml: molecular layer; gl: granular layer; pl: polymorphic layer. Scale bar: 200 µm
3.2. Hippocampal fields
3.2.1. Pyramidal layer (stratum pyramidale)
A decrease in the density of SOM‐IR neurons was detected in HYG compared to CG (Figures 4 and 7), but values were statistically significant only in CA1 (p: 0.03, Figure 4e). The difference in NPY‐IR densities between the CG and the HYG was lower than in SOM‐IR cells (Figures 4 and 8). However, it reached statistical significance in CA2 (p: 0.025, Figure 4d).
FIGURE 7.
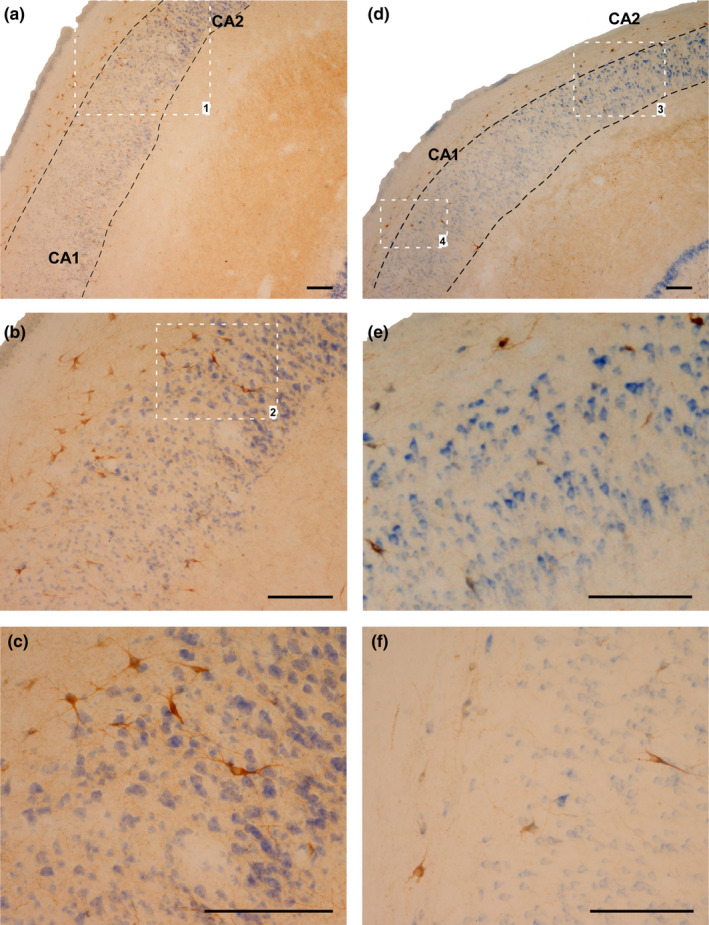
SOM‐IR cells in the stratum oriens and pyramidal layer of CA2 and CA1. (a–c) Case 2, CG. (b) Magnification of area limited by square 1 in (a). (c) Magnification of area limited by square 2 in (b). (d–e): Case 10 (HYG). (e): Magnification of area limited by square 3 in (a). (f): Magnification of area limited by square 4 in (a). Abbreviations: CA1: ammonic hippocampal field 1; CA2: ammonic hippocampal field. Scale bar: 200 µm
FIGURE 8.
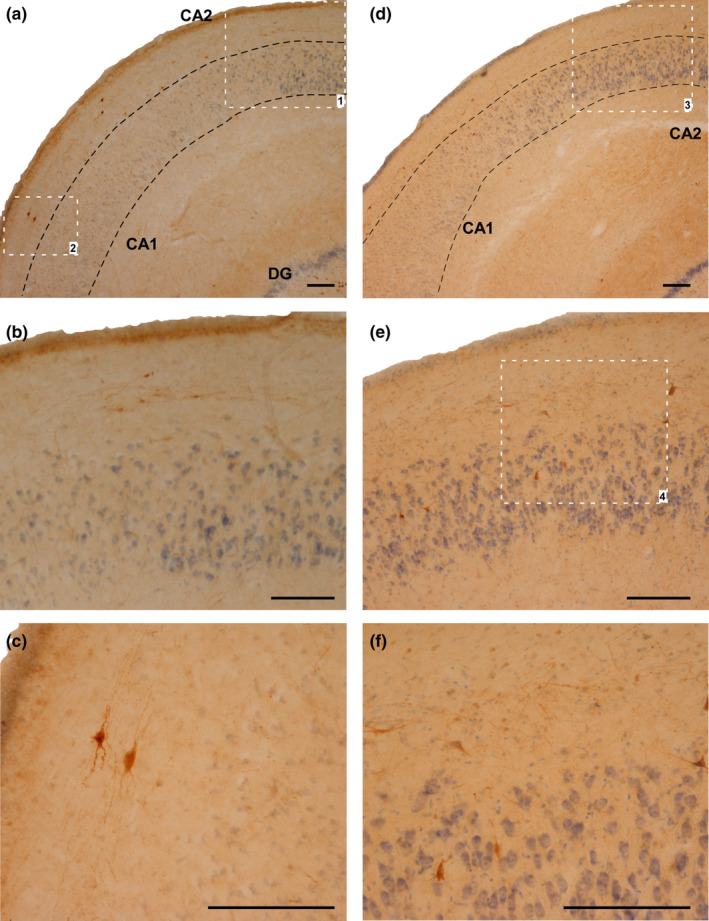
NPY‐IR cells in the stratum oriens and pyramidal layer of CA2 and CA1. (a–c) Case 4 (CG). (b) Magnification of area limited by square 1 in (a). (c): Magnification of area limited by square 2 in (a). (d–e): Case 10 (HYG). (e) Magnification of area limited by square 3 in (a). (f) Magnification of area limited by square 4 in (e). Abbreviations: CA1: ammonic hippocampal field 1; CA2: ammonic hippocampal field. Scale bar: 200 µm
3.2.2. Stratum oriens
The density of SOM‐IR cells was higher in CG than HYG, but it was statistically significant only in CA1 (p: 0.03, Figures 5d and 7). Comparing the cellular density of SOM‐IR neurons in the stratum oriens of the ammonic fields, significant differences were detected between CA1 and CA2 in the CG (p: 0.006, Figure 5a).
4. DISCUSSION
The main finding of this study of infant human brains with neuropathological signs of HI is a general decrease in the density of the SOM‐IR and NPY‐IR neuron populations of the hippocampus and DG in the layers and regions analysed. There were also significant differences between groups in the SOM‐IR population of the stratum oriens of CA1. This decrease might be due to cell death or a decrease in peptide expression, as suggested previously (Johansen et al., 1992). In addition, the density of SOM‐expressing neurons was higher than that of NPY‐IR cell bodies (significantly higher in CA1) except for CA2, where the opposite pattern was identified.
4.1. SOM and NPY in experimental HI animal models
Our results show a decrease in the density of both SOM and NPY neuron populations in the polymorphic layer of the DG following HI. This layer has been described as the most sensitive to HI in adult animal models (Hsu et al., 1994; Johansen, 1993; Larsson et al., 2001). However, a great variety of results has been described regarding NPY and SOM expression in this layer after HI. This suggests that the expression of both peptides may be affected by diverse variables and is strongly dependent on the experimental model (Bering & Johansen, 1993; Johansen & O'Hare, 1989; Johansen et al., 1987; Komitova et al., 2013; Matsuyama et al., 1993; Schwarzer et al., 1996; Zola‐Morgan et al., 1992).
It is generally accepted that CA1 is one of the most HI‐sensitive hippocampal regions, displaying cellular damage in the first days after an HI episode (Almli et al., 2000; Kuchna, 1994; Nalivaeva et al., 2018; Rempel‐Clower et al., 1996; Towfighi et al., 1997; Zola‐Morgan & Squire, 1986). However, not all cells in CA1 seem to have the same sensitivity to HI episodes. In fact, it has been suggested that interneurons in this field are more resistant than pyramidal cells (Johansen, 1993) – a finding which our results corroborate (see Figure 2, case 6 showing a massive cell loss of principal cells). However, several authors have reported selective damage to specific CA1 interneurons in animal models. Nitsch et al. (1989) described SOM‐IR and NPY‐IR as the CA1 neurons most sensitive to HI episodes, while other studies reported SOM to be the most affected neuropeptide (Bering & Johansen, 1993; Komitova et al., 2013). Our results are consistent with these studies – we observed a significant decrease in SOM‐IR neuronal density in the stratum oriens and pyramidal layer of CA1 in the HYG compared to CG. This suggests that the SOM‐IR population in CA1 may be particularly sensitive to HI damage, to which NPY‐IR neurons have lower susceptibility. This observation is supported by previous studies noting that NPY‐IR neurons in CA1 were more resistant to HI injuries (Duszczyk et al., 2009, Johansen, 1993, Larsson et al., 2001, Schwarzer et al., 1996).
4.2. SOM and NPY in HI human cases
Reduced neuronal density in the hippocampus following HI episodes is well‐documented in human adults (Mishra & Delivoria‐Papadopoulos, 1999; Nalivaeva et al., 2018; Rempel‐Clower et al., 1996; Squire et al., 2020; Vannucci & Hagberg, 2004; Zola‐Morgan & Squire, 1986). However, there are no reports in the available literature of neuropeptide expression after perinatal HI damage in humans.
The distributions of SOM‐IR and NPY‐IR neurons observed in the polymorphic layer of DG presented here are consistent with previous results obtained in normal control children (Cebada‐Sanchez et al., 2014). Our findings confirm the existence of very scarce labelling in the subgranular zone of the DG and higher expression of SOM than NPY in the DG. This would suggest that HI does not decisively influence the distribution of peptidergic neurons in this region.
In case 6, despite the massive neuron loss detected in the granular layer of the DG and the pyramidal layer of CA1, a few SOM‐ or NPY‐expressing neurons with an apparently normal morphology could be identified – together with the IR neurons of the polymorphic layer of DG. This may be due to the specific neurochemical content of these resistant neurons. It is likely that these surviving neurons also co‐express hypoxia‐inducible factor (HIF)‐1α – a molecule implicated in the initial adaptive responses to hypoxia and whose expression is dependent on oxygen levels (Nalivaeva et al., 2018; Wheaton & Chandel, 2011). This could be related to varying susceptibility depending on the developmental stage of newborns, as shown in the brainstem (Covenas et al., 2014). Our findings in the CA1 region suggest that the NPY‐IR neuronal population might be more resistant to HI than SOM‐positive neurons, which is also detected in the stratum oriens of CA2. In our study, this was the only hippocampal region where NPY‐IR density was higher than SOM‐IR. Moreover, CA2 was the only hippocampal field showing higher neuronal density in the HYG than in CG. In contrast, the pyramidal cell layer of CA2 in HYG displayed a significant decrease in the NPY‐IR population, but not in SOM‐IR. These results suggest differential responses to HI depending not only on the neuronal peptidergic phenotype, but also on the cellular location within the same hippocampal field. This possibility has been described in previous human brain studies (Sloviter et al., 1991).
4.3. Functional implications
The two neuropeptide‐expressing neurons analysed in our study are considered markers of GABAergic neurons. GABA acts as the primary inhibitory neurotransmitter in the mature mammalian central nervous system. However, it also acts as a depolarising neurotransmitter at early developmental stages, and high levels of intracellular Cl– are found in immature neurons, leading to depolarisation. The intracellular levels of Cl– are regulated by the neuron‐specific K+‐Cl– cotransporter 2 (KCC2), expressed from the 25th postconceptional week onwards in humans (Kaila et al., 2014). This transient mechanism has been interpreted as an evolutionary optimisation that reduces energetic costs – since this is a critical period for brain growth and synaptogenesis, which requires high energy expenditure (Kaila et al., 2014; Kirmse et al., 2018).
The mammalian neonate brain is particularly prone to hyperexcitability and seizures (Pamenter et al., 2011), and the above‐mentioned changes observed in the inhibitory system have been proposed as compensatory mechanisms. An acute downregulation of KCC2 has been associated with ischemia and other seizures in the immature cells, reflecting an endogenous safety mechanism and an adaptive response to promote neuronal survival (Kaila et al., 2014). Our results suggest that this could also be the mechanism adopted by SOM‐ and NPY‐expressing interneurons in response to perinatal HI. However, in human adults cellular damage after HI – even if restricted to the CA1 region – was enough to produce a clinically significant memory impairment (Zola‐Morgan & Squire, 1986). Damage limited to CA1 caused minimal retrograde amnesia (1–2 years) whereas, with more extensive damage (patient WH), the impairment lasted as much as 25 years (Rempel‐Clower et al., 1996). In adult cases, memory impairment following hippocampal damage is long‐lasting (Zola‐Morgan et al., 1986), and the consequences of HI depend on the degree of hypoxia and the duration of the episode. These data are not available in human studies, making it difficult to infer the exact functional consequences of the loss of interneurons detected in our study. Individual data indicated that cases 8–9 (HYG) and case 3 (CG) are those with the most significant decrease in the density of IR neurons. In all of these cases, the cause of death was bronchial pneumonia. This suggests that this mortality may be related to increased neuronal loss in the regions analysed in this work, although there are insufficient data to determine the extent of its impact. However, and considering other data obtained in humans with HI episodes, in our series of cases (particularly in case 6), due to the loss of SOM‐IR neurons, we would have expected learning and memory problems while growing up. The disruption of the inhibitory control of the hippocampal circuits due to cell loss to this extent may lead to alterations of the transmission in these circuits. Moreover, other disorders might have also arisen, depending on the extent of lesions (Munoz‐Lopez et al., 2017) –including cerebral palsy (Rumajogee et al., 2016), periventricular leukomalacia (Volpe, 2018) or attention‐deficit/hyperactivity disorder (Smith et al., 2016).
5. CONCLUSION
Our study highlights the paucity of available data on the morphological and neurochemical consequences of perinatal HI episodes. Further studies are needed to gain a better understanding of these mechanisms, in order to develop effective therapies to alleviate the damage that these episodes can cause.
Our results show that the hippocampal neuronal population – particularly SOM‐IR and, to a lesser degree, NPY‐IR cells – present lower density in the DG and the different hippocampal fields as a result of perinatal HI episodes. This neuron loss may cause an imbalance between excitatory and inhibitory hippocampal circuits, which could be long‐lasting and lead to neurological and psychological disorders in the future. More studies using different approaches are needed to better understand perinatal HI, so that effective therapeutic and/or preventive action can be taken.
CONFLICT OF INTEREST
The authors declare no conflicts of interest.
AUTHOR CONTRIBUTION
J. Gonzalez Fuentes: conception and study design, acquisition of data, tissue processing, immunohistochemical procedures, Nissl staining, data analysis and interpretation, drafting of the manuscript, critical revision of the manuscript, approval of the article. R. Insausti Serrano: drafting of the manuscript, critical revision of the manuscript, approval of the article. S. Cebada Sánchez: critical revision of the manuscript, approval of the article. M.J. Lagartos Donate: critical revision of the manuscript, approval of the article. E. Rivas Infante: critical revision of the manuscript, approval of the article. M. M. Arroyo‐Jimenez: critical revision of the manuscript, approval of the article. P. Marcos Rabal: conception and study design, acquisition of data, data analysis and interpretation, drafting of the manuscript, critical revision of the manuscript, approval of the article. All authors approved the final version of the manuscript.
ACKNOWLEDGEMENTS
This research has been conducted using samples from the Andalusian Public Health System Biobank (ISCIII‐Red de Biobancos RD09/0076/00085). We also thank the technical team of the Human Neuroanatomy Laboratory of the University of Castilla‐La Mancha, especially to Guillermo Lozano, and the technicians of the Virgen del Rocío Hospital for their critical contribution on preparation of the human brain tissue. Special thanks to the donors and their families. This study was supported by Consejería de Educación, Cultura y Deportes of Junta de Comunidades de Castilla‐La Mancha and Fondo Europeo de Desarrollo Regional (Spain, Grants PAI‐05‐067 and PEII‐2014‐003‐A). The authors thank Sara Fairén and Alexandra L. Salewski Müller for the professional edition of English language.
DATA AVAILABILITY STATEMENT
Data sharing not applicable to this article as no datasets were generated or analysed during the current study.
REFERENCES
- Almli, C.R., Levy, T.J., Han, B.H., Shah, A.R., Gidday, J.M. & Holtzman, D.M. (2000) BDNF protects against spatial memory deficits following neonatal hypoxia‐ischemia. Experimental Neurology, 166, 99–114. [DOI] [PubMed] [Google Scholar]
- Bering, R. & Johansen, F.F. (1993) Expression of somatostatin mRNA and peptide in rat hippocampus after cerebral ischemia. Regulatory Peptides, 49, 41–48. [DOI] [PubMed] [Google Scholar]
- Bird, C.M. & Burgess, N. (2008) The hippocampus and memory: insights from spatial processing. Nature Reviews Neuroscience, 9, 182–194. [DOI] [PubMed] [Google Scholar]
- Cebada‐Sanchez, S., Insausti, R., Gonzalez‐Fuentes, J., Arroyo‐Jimenez, M.M., Rivas‐Infante, E., Lagartos, M.J. et al. (2014) Distribution of peptidergic populations in the human dentate gyrus (somatostatin [SOM‐28, SOM‐12] and neuropeptide Y [NPY]) during postnatal development. Cell and Tissue Research, 358, 25–41. [DOI] [PubMed] [Google Scholar]
- Covenas, R., Gonzalez‐Fuentes, J., Rivas‐Infante, E., Lagartos‐Donate, M.J., Cebada‐Sanchez, S., Arroyo‐Jimenez, M.M. et al. (2014) Developmental study of the distribution of hypoxia‐induced factor‐1 alpha and microtubule‐associated protein 2 in children's brainstem: comparison between controls and cases with signs of perinatal hypoxia. Neuroscience, 271, 77–98. [DOI] [PubMed] [Google Scholar]
- Covenas, R., Gonzalez‐Fuentes, J., Rivas‐Infante, E., Lagartos‐Donate, M.J., Mangas, A., Geffard, M. et al. (2015) Developmental study of vitamin C distribution in children's brainstems by immunohistochemistry. Annals of Anatomy, 201, 65–78. [DOI] [PubMed] [Google Scholar]
- Duszczyk, M., Ziembowicz, A., Gadamski, R, Wieronska, J.M., Smialowska, M. & Lazarewicz, J.W. (2009) Changes in the NPY immunoreactivity in gerbil hippocampus after hypoxic and ischemic preconditioning. Neuropeptides, 43, 31–39. [DOI] [PubMed] [Google Scholar]
- Guntern, R., Vallet, P.G., Bouras, C. & Constantinidis, J. (1989) An improved immunohistostaining procedure for peptides in human brain. Experientia, 45, 159–161. [DOI] [PubMed] [Google Scholar]
- Hsu, M., Sik, A., Gallyas, F., Horvath, Z. & Buzsaki, G. (1994) Short‐term and long‐term changes in the postischemic hippocampus. Annals of the New York Academy of Sciences, 743, 121–139. [DOI] [PubMed] [Google Scholar]
- Insausti, R., Cebada‐Sanchez, S. & Marcos, P. (2010) Postnatal development of the human hippocampal formation. Advances in Anatomy, Embryology and Cell Biology, 206, 1–86. [PubMed] [Google Scholar]
- Johansen, F.F. (1993) Interneurons in rat hippocampus after cerebral ischemia. Morphometric, functional, and therapeutic investigations. Acta Neurologica Scandinavica. Supplementum, 150, 1–32. [PubMed] [Google Scholar]
- Johansen, F.F. & O'hare, M.M. (1989) Loss of somatal neuropeptide y immunoreactivity in the rat hippocampus following transient cerebral ischemia. Journal of Neurosurgical Anesthesiology, 1, 339–345. [DOI] [PubMed] [Google Scholar]
- Johansen, F.F., Sorensen, T., Tonder, N., Zimmer, J. & Diemer, N.H. (1992) Ultrastructure of neurons containing somatostatin in the dentate hilus of the rat hippocampus after cerebral ischaemia, and a note on their commissural connections. Neuropathology and Applied Neurobiology, 18, 145–157. [DOI] [PubMed] [Google Scholar]
- Johansen, F.F., Zimmer, J. & Diemer, N.H. (1987) Early loss of somatostatin neurons in dentate hilus after cerebral ischemia in the rat precedes CA‐1 pyramidal cell loss. Acta Neuropathologica, 73, 110–114. [DOI] [PubMed] [Google Scholar]
- Johnston, M.V. (2005) Excitotoxicity in perinatal brain injury. Brain Pathology, 15, 234–240. [DOI] [PMC free article] [PubMed] [Google Scholar]
- Kaila, K., Price, T.J., Payne, J.A., Puskarjov, M. & Voipio, J. (2014) Cation‐chloride cotransporters in neuronal development, plasticity and disease. Nature Reviews Neuroscience, 15, 637–654. [DOI] [PMC free article] [PubMed] [Google Scholar]
- Kirmse, K., Hubner, C.A., Isbrandt, D., Witte, O.W. & Holthoff, K. (2018) GABAergic transmission during brain development: multiple effects at multiple stages. The Neuroscientist 24, 36–53. [DOI] [PubMed] [Google Scholar]
- Komitova, M., Xenos, D., Salmaso, N., Tran, K.M., Brand, T., Schwartz, M.L. et al. (2013) Hypoxia‐induced developmental delays of inhibitory interneurons are reversed by environmental enrichment in the postnatal mouse forebrain. Journal of Neuroscience, 33, 13375–13387. [DOI] [PMC free article] [PubMed] [Google Scholar]
- Kuchna, I. (1994) Quantitative studies of human newborns’ hippocampal pyramidal cells after perinatal hypoxia. Folia Neuropathologica, 32, 9–16. [PubMed] [Google Scholar]
- Larsson, E., Lindvall, O. & Kokaia, Z. (2001) Stereological assessment of vulnerability of immunocytochemically identified striatal and hippocampal neurons after global cerebral ischemia in rats. Brain Research, 913, 117–132. [DOI] [PubMed] [Google Scholar]
- Lawn, J.E., Blencowe, H., Oza, S., You, D., Lee, A.C., Waiswa, P. et al. (2014) Every Newborn: progress, priorities, and potential beyond survival. Lancet, 384, 189–205. [DOI] [PubMed] [Google Scholar]
- Matsuyama, T., Tsuchiyama, M., Nakamura, H., Matsumoto, M. & Sugita, M. (1993) Hilar somatostatin neurons are more vulnerable to an ischemic insult than CA1 pyramidal neurons. Journal of Cerebral Blood Flow and Metabolism, 13, 229–234. [DOI] [PubMed] [Google Scholar]
- Mishra, O.P. & Delivoria‐Papadopoulos, M. (1999) Cellular mechanisms of hypoxic injury in the developing brain. Brain Research Bulletin, 48, 233–238. [DOI] [PubMed] [Google Scholar]
- Munoz‐Lopez, M., Hoskote, A., Chadwick, M.J., Dzieciol, A.M., Gadian, D.G., Chong, K. et al. (2017) Hippocampal damage and memory impairment in congenital cyanotic heart disease. Hippocampus, 27, 417–424. [DOI] [PMC free article] [PubMed] [Google Scholar]
- Nalivaeva, N.N., Turner, A.J. & Zhuravin, I.A. (2018) Role of prenatal hypoxia in brain development, cognitive functions, and neurodegeneration. Frontiers in Neurosciences, 12, 825. [DOI] [PMC free article] [PubMed] [Google Scholar]
- Nikonenko, A.G., Radenovic, L., Andjus, P.R. & Skibo, G.G. (2009) Structural features of ischemic damage in the hippocampus. Anatomical Record (Hoboken), 292, 1914–1921. [DOI] [PubMed] [Google Scholar]
- Northington, F.J., Ferriero, D.M., Graham, E.M., Traystman, R.J. & Martin, L.J. (2001) Early neurodegeneration after hypoxia‐ischemia in neonatal rat is necrosis while delayed neuronal death is apoptosis. Neurobiology of Diseases, 8, 207–219. [DOI] [PubMed] [Google Scholar]
- Pamenter, M.E., Hogg, D.W., Ormond, J., Shin, D.S., Woodin, M.A. & Buck, L.T. (2011) Endogenous GABA(A) and GABA(B) receptor‐mediated electrical suppression is critical to neuronal anoxia tolerance. Proceedings of the National Academy of Sciences of the United States of America, 108, 11274–11279. [DOI] [PMC free article] [PubMed] [Google Scholar]
- Ramos‐Vara, J.A. (2005) Technical aspects of immunohistochemistry. Veterinary Pathology, 42, 405–426. [DOI] [PubMed] [Google Scholar]
- Rempel‐Clower, N.L., Zola, S.M., Squire, L.R. & Amaral, D.G. (1996) Three cases of enduring memory impairment after bilateral damage limited to the hippocampal formation. Journal of Neuroscience, 16, 5233–5255. [DOI] [PMC free article] [PubMed] [Google Scholar]
- Rumajogee, P., Bregman, T., Miller, S.P., Yager, J.Y. & Fehlings, M.G. (2016) Rodent hypoxia‐ischemia models for cerebral palsy research: a systematic review. Frontiers in Neurology, 7, 57. [DOI] [PMC free article] [PubMed] [Google Scholar]
- Schwarzer, C., Sperk, G., Rauca, C. & Pohle, W. (1996) Neuropeptide Y and somatostatin immunoreactivity in the rat hippocampus after moderate hypoxia. Naunyn‐Schmiedeberg's Archives of Pharmacology, 354, 67–71. [DOI] [PubMed] [Google Scholar]
- Sloviter, R.S., Sollas, A.L., Barbaro, N.M. & Laxer, K.D. (1991) Calcium‐binding protein (calbindin‐D28K) and parvalbumin immunocytochemistry in the normal and epileptic human hippocampus. The Journal of Comparative Neurology, 308, 381–396. [DOI] [PubMed] [Google Scholar]
- Smith, T.F., Schmidt‐Kastner, R., Mcgeary, J.E., Kaczorowski, J.A. & Knopik, V.S. (2016) Pre‐ and Perinatal Ischemia‐Hypoxia, the Ischemia‐Hypoxia Response Pathway, and ADHD Risk. Behavior Genetics, 46, 467–477. [DOI] [PubMed] [Google Scholar]
- Squire, L.R., Kim, S., Frascino, J.C., Annese, J., Bennett, J., Insausti, R. & et al. (2020) Neuropsychological and neuropathological observations of a long‐studied case of memory impairment. Proceedings of the National Academy of Sciences of the United States of America, 117, 29883–29893. [DOI] [PMC free article] [PubMed] [Google Scholar]
- Swarte, R., Lequin, M., Cherian, P., Zecic, A., Van Goudoever, J. & Govaert, P. (2009) Imaging patterns of brain injury in term‐birth asphyxia. Acta Paediatrica, 98, 586–592. [DOI] [PubMed] [Google Scholar]
- Towfighi, J., Mauger, D., Vannucci, R.C. & Vannucci, S.J. (1997) Influence of age on the cerebral lesions in an immature rat model of cerebral hypoxia‐ischemia: a light microscopic study. Brain Research. Developmental Brain Research, 100, 149–160. [DOI] [PubMed] [Google Scholar]
- Vannucci, S.J. & Hagberg, H. (2004) Hypoxia‐ischemia in the immature brain. Journal of Experimental Biology, 207, 3149–3154. [DOI] [PubMed] [Google Scholar]
- Volpe, J.J. (2018) Volpe's neurology of the newborn. Elsevier. [Google Scholar]
- Wheaton, W.W. & Chandel, N.S. (2011) Hypoxia. 2. Hypoxia regulates cellular metabolism. American Journal of Physiology. Cell Physiology, 300, C385–C393. [DOI] [PMC free article] [PubMed] [Google Scholar]
- Zola‐Morgan, S. & Squire, L.R. (1986) Memory impairment in monkeys following lesions limited to the hippocampus. Behavioral Neuroscience, 100, 155–160. [DOI] [PubMed] [Google Scholar]
- Zola‐Morgan, S., Squire, L.R. & Amaral, D.G. (1986) Human amnesia and the medial temporal region: enduring memory impairment following a bilateral lesion limited to field CA1 of the hippocampus. Journal of Neuroscience, 6, 2950–2967. [DOI] [PMC free article] [PubMed] [Google Scholar]
- Zola‐Morgan, S., Squire, L.R., Rempel, N.L., Clower, R.P. & Amaral, D.G. (1992) Enduring memory impairment in monkeys after ischemic damage to the hippocampus. Journal of Neuroscience, 12, 2582–2596. [DOI] [PMC free article] [PubMed] [Google Scholar]
Associated Data
This section collects any data citations, data availability statements, or supplementary materials included in this article.
Data Availability Statement
Data sharing not applicable to this article as no datasets were generated or analysed during the current study.


