

Abstract
In all-atom simulations of lipid membranes, explicit hydrogen atoms contained in the hydrocarbon region are described by a large number of degrees of freedom, although they convey only limited physical information. We propose an implicit-hydrogen model for saturated and monounsaturated acyl chains, aimed at complementing the all-atom CHARMM27 model for phospholipid headgroups. Torsional potentials and nonbonded parameters were fitted to reproduce experimental data and free energy surfaces of all-atom model systems. Comparative simulations of fluid-phase POPC bilayers were performed using the all-hydrogen force field and the present model. The hybrid model accelerates a typical bilayer simulation by about 50% while sacrificing a minimal amount of detail with respect to the fully atomistic description. In addition, the united-atom description is energetically compatible with all-atom CHARMM models, making it suitable for simulations of complex membrane systems.
Introduction
Atomistic simulations of lipid membranes now belong to the toolbox of computational biologists and biophysicists.1 Because such simulations are widespread, it is tempting to view them as a dependable, black-box procedure, forgetting how challenging the field still is and how imperfect the current models and methods are. In a now-common type of application, simulations of membrane proteins,2 the description of the lipid component sometimes bears direct relevance to the biological problem: the literature contains numerous reports on the sensitivity of membrane proteins to their lipid environment.3–6 Great care should therefore be taken both when choosing the force field used to model such a heterogeneous system and when setting up the starting structure.7
The outstanding issues in membrane simulations are at least two-fold: the limits of the available models and the computational cost of long simulations of large systems required to sample the equilibrium structure and dynamics of bilayers. The first point can, to a large extent, be ascribed to our limited knowledge of the microscopic structure of lipid assemblies, particularly in biologically relevant mixtures and heterogeneous phases. One major obstacle faced by computational researchers when trying to create or refine empirical lipid force fields is the scarcity of experimental data suitable for direct comparison and calibration of the model.8 The progress that has been accomplished recently is, to a significant extent, due to tighter coupling of experiments and simulation, the former providing accurate spectroscopic data that the latter helps translate into well-resolved microscopic properties.9–11 Yet, reliable characterization of the models themselves also depends on the time scales readily accessible to simulations. In this respect, computational efficiency is also a major requirement of current and future improvements to models and methods for lipid simulations. Coarse-grained lipid models12,13 offer simulations access to effective time scales that are otherwise beyond reach.14–16 Yet, the lack of detail in such models makes the use of atomistic models still desirable in many cases, one of them being parametrization of the coarse-grained force fields themselves.12,17 Moreover, current hardware and software allow for simulations that sample major membrane rearrangements in atomistic detail,18–20 often using GROMOS-based force fields, which resort to an implicit description of nonpolar hydrogens.
Over the past 15 years, many phospholipid models have been published, most of them united-atom approaches such as GROMOS87,21,22 AMBER,23,24 GROMOS/Berger,25 Smondyrev and Berkowitz,26 GROMOS/Chiu et al.,27,28 and GROMOS96 45A3,29,30 the major all-atom models being successive versions of CHARMM.31–33 It was also shown recently34 that the generalized AMBER force field35 can be used to accurately simulate a phospholipid bilayer. Most present-day atomistic simulations of lipids use either the GROMOS/Berger or CHARMM27 model.8 Whereas the former offers a cost-effective description of the hydrocarbon phase, the latter offers compatibility with a more precise model for proteins36 and nucleic acids,37 as well as increased flexibility with regard to use of various headgroups and parametrization of new compounds. Tieleman et al.38 recently showed how these benefits could be combined by integrating united-atom lipids (adapted from GROMOS/Berger) and all-atom proteins described by OPL-SAA.39 Membrane simulations using a similar CHARMM-based model were reported by Treptow and Tarek,40,41 but the parameters were not published.
The present contribution pursues similar objectives, within the consistent framework of CHARMM27 (C27). We describe a model deriving from C27 phospholipids, from which explicit hydrogen atoms of only the acyl chains are removed and replaced by a united-atom representation. The resulting hybrid lipid model (CHARMM27 united-atom or C27-UA) has a much reduced number of degrees of freedom but essentially retains the accuracy of the original model, including the detailed description of the headgroups. The C27-UA model is intended for use in simulations of complex systems, including proteins and other compounds as described by C27. Parameters were derived by fitting to experimental data when available (i.e., for Lennard-Jones potentials) and to all-atom simulations of liquid-phase model systems otherwise. Particular care was taken to reproduce torsional free energy surfaces of the recently revised all-atom force field C27r.33 The structure of a 1-palmitoyl-2-oleoyl-sn-glycero-3-phosphocholine (POPC) bilayer simulated using C27-UA was compared quantitatively to that of an all-atom bilayer, as well as experimental data from NMR spectroscopy and X-ray diffraction. Compatibility of the united-atom hydrocarbon with all-atom compounds was tested by computing free energy profiles for the transfer of small molecules across a water–alkane interface.
Methods
Description of the Hybrid Model
C27-UA leaves the C27 headgroup intact, as well as the glycerol and ester moieties. Although only results for a phosphatidylcholine lipid are described below, the present parametrization is independent of the nature of the headgroup and can therefore be used for any type of phospholipid. In the acyl chains, each methylene and methyl group (and double-bonded CH groups in unsaturated chains) is represented by one pseudoatom. In accordance with the corresponding groups in C27, the first methylene group of each acyl chain bears a partial charge of +0.1, whereas the remaining CHn pseudoatoms are neutral. The nonbonded potential energy functional for the acyl chains is a 6–12 Lennard-Jones potential, with bonded atoms being excluded up to the third neighbor (i.e., no 1,4 interactions). As usual in the CHARMM force field, torsional potentials are defined as cosine series. They account for 1,4 interactions in an effective manner, in the spirit of Ryckaert and Bellemans,42 although our fitted parameters differ from the ones published by those authors. Other bonded terms (bonds and angles) are taken directly from C27r.
Parameter Fitting
Several existing sets of nonbonded parameters for hydrocarbons, listed in Table 1, were tested. Following Chiu et al.,27 we sought to reproduce the experimental molar volumes and enthalpies of vaporization43 of alkanes of different lengths, namely, pentane and pentadecane. The parameter sets tested were OPLS,44 the parameters of Berger et al.,25 and two different sets proposed by Chiu et al.27,28 During that initial phase, torsional potentials were taken from OPLS.44 After refinement of the torsional potentials as described below, the molar volume and enthalpy of vaporization of pentadecane were computed again to ensure consistency of the bonded and nonbonded parameters. All simulations of liquid model systems used the program NAMD.45
TABLE 1.
Lennard-Jones Parameters Tested for the Present Model, in CHARMM Formata
| CH1E
|
CH2E
|
CH3E
|
||||
|---|---|---|---|---|---|---|
| Rmin/2 | ɛ | Rmin/2 | ɛ | Rmin/2 | ɛ | |
| OPLS44 | 2.133 | −0.115 | 2.192 | −0.118 | 2.192 | −0.175 |
| Berger25 | 2.222 | −0.0908 | 2.222 | −0.1362 | ||
| Chiu 199927 | 2.2449 | −0.0908 | 1.9699 | −0.1362 | ||
| Chiu 200328 | 2.2225 | −0.1052 | 2.2730 | −0.1004 | 2.1046 | −0.1960 |
Rmin/2 is in angstroms; ɛ is in kcal/mol.
Torsional terms were calibrated according to the revised CHARMM27 (C27r) all-atom force field.33 C27r contains updated torsional parameters based on high-level ab initio calculations and aims at improving the description of the alkyl region of lipid bilayers. It is based on CHARMM2732 by Feller and MacKerell, which derived from CHARMM2231,46 with improved Lennard-Jones and torsional potentials. Torsional parameters for the united-atom region were obtained by fitting torsional potentials of mean force (PMF) obtained from angle distributions in model compounds simulated in the pure liquid state. Differences, ΔA, between the PMF values were fitted with an order-6 cosine series
| (1) |
where δk was chosen to be 0° for odd k and 180° for even k. That choice is consistent with the convention that the resulting CHARMM-style torsional potential
| (2) |
is zero for φ = 180°. Fit parameters Ak were added as corrections to Vk, yielding the next set of parameters. Iterating these simulation and parameter correction steps ensured that the torsional free energy surface of the united-atom model converged toward that of the all-atom model.
The model compounds were pentadecane for saturated hydrocarbon chains, cis-5-decene for monounsaturated chains, and methyl hexanoate for the ester region. Bulk liquid simulations were run in the NPT ensemble (pressure of 1 bar and temperatures of 312 K for pentadecane and 310 K for both 5-decene and methyl hexanoate) using the program NAMD.45 The systems comprised 128 molecules for pentadecane and 5-decene and 256 molecules in the case of methyl hexanoate. Lennard-Jones potentials were evaluated within a cutoff of 12 Å, with a smooth switching function above 10 Å. A time step of 2 fs was used, and all bonds involving hydrogen atoms were contrained to their equilibrium lengths. Each set of parameters was sampled for 1 ns. The CH2E-CH2E-CH1E-CH1E parameter describing rotation around the carbon—carbon bond adjacent to a cis double bond required special attention. Because of a significantly hindered rotation around that bond, values of the angle below 40° are very rarely sampled in liquid 5-decene, making that region of the histogram ill-defined. That problem was alleviated by performing extensive sampling for an isolated decene molecule, for the all-atom model as well as successive iterations of the UA model. The NAMD implementation47 of the adaptive biasing force method48,49 was used to enhance sampling of the torsional angle and directly yield a potential of mean force at 310 K. The adaptive bias was applied directly to the C—C—C—C torsional angle, without other restraints or constraints. One-nanosecond trajectories were sufficient to reach convergence for such low-dimensionality systems. The gas-phase profile was used to complement the liquid-phase data so that the UA effective potential could be tuned to reproduce the shape and height of the barrier. This method proved valid, as the free energy profiles for the liquid and gas phases were found to be similar.
POPC Bilayer Simulations
See Table 2 for a summary of bilayer simulations. Fully hydrated POPC bilayers in the liquid-crystal phase Lα were simulated using the program NAMD.45 The surface area, temperature, and normal pressure were kept constant (NPNAT ensemble). The temperature of 303 K and normal pressure of 1 bar were enforced using Langevin dynamics (decay time of 5 ps) and the Nosé-Hoover Langevin piston method as implemented in NAMD,50 with an oscillator period of 5 ps and a decay time of 2.5 ps. All simulations were carried on under periodic boundary conditions; one periodic box contained 128 POPC molecules, either all-atom or united-atom, and 31 TIP3P water molecules51 per lipid. Long-range electrostatics were calculated with the particle-mesh Ewald scheme using an order-4 interpolation and a grid spacing smaller than 1 Å. Lennard-Jones pair potentials were evaluated within a cutoff distance of 12 Å, with a smooth switching function above 10 Å. A multiple-time-step scheme was used, with a base time step of 2 fs and an extended time step of 4 fs for longer-range forces. All bonds involving hydrogen atoms were constrained to their equilibrium length by SHAKE/RATTLE. An additional round of all-atom simulations was performed using a larger bilayer containing 512 lipid molecules and 31 waters per lipid (see below), under otherwise identical simulation conditions. Simulations AA64″ and AA68″ were run with unconstrained carbon-hydrogen bonds; in these two runs, the base time step was reduced to 0.5 fs, keeping extended timesteps of 2 and 4 fs for short- and long-range nonbonded terms, respectively.
TABLE 2.
Summary of POPC Bilayer Simulations
| name | model | SHAKE | no. of lipids | area/lipid (Å2) | starting point | duration (ns) |
|---|---|---|---|---|---|---|
| UA68 | C27-UA | yes | 128 | 68 | Tielemana | 65 |
| UA66 | C27-UA | yes | 128 | 66 | UA68 at 15 ns | 25 |
| UA64 | C27-UA | yes | 128 | 64 | UA66 at 11 ns | 75 |
| AA68 | C27r | yes | 128 | 68 | Tieleman | 100 |
| AA64 | C27r | yes | 128 | 64 | UA64 at 0 ns | 100 |
| AA68′ | C27r | yes | 512 | 68 | AA68 at 100 ns | 90 |
| AA64′ | C27r | yes | 512 | 64 | AA64 at 100 ns | 75 |
| AA68″ | C27r | no | 128 | 68 | Tieleman | 50 |
| AA64″ | C27r | no | 128 | 64 | UA64 at 0 ns | 50 |
Pre-equilibrated liquid-crystal phase bilayer patch available from the Web site of Dr. Peter Tieleman (http://moose.bio.ucalgary.ca).
Although surface area per headgroup is one of the most useful structural characteristics of lipid systems, the determination of this quantity from experimental data is far from straightforward. Simple models can be used to provide estimates from NMR-measured carbon-deuterium order parameters or from X-ray and neutron scattering length density profiles.52 A more detailed approach is to perform simulations at different values of the area, from which observables are computed and matched against experimental measurements to determine the most likely value of the area.53 In this spirit, simulations of the united-atom model were carried out with areas per headgroup equal to 64, 66, and 68 Å2 (results for 66 Å2 not shown). The all-atom system was simulated at areas per molecule of 64 and 68 Å2. Carbon–deuterium order parameter (SCD) and electron density profiles computed from the trajectories were compared to experimental data. For united-atom simulations, order parameters were calculated by reconstructing the position of deuterium atoms assuming an ideal geometry.
The simulation conditions and starting points are summarized in Table 2. The initial configuration was a pre-equilibrated liquid-crystal phase bilayer patch available from the Web site of Dr. Peter Tieleman (http://moose.bio.ucalgary.ca). When needed, bilayer patches were scaled horizontally by moving lipid molecules as rigid bodies to obtain the desired surface area. After each scaling step, convergence of properties such as tail order parameters or surface tension required tens of nanoseconds, although the area changed by only about 3% at most. Apparent instabilities hampered equilibration of the all-atom systems. To alleviate that problem, larger patches were simulated. Starting points for 512-lipid simulations at 64 and 68 Å2 were built by duplicating the corresponding 128-lipid periodic cell along the x and y directions, yielding a square supercell. These two systems were simulated at constant area for 75 and 90 ns, respectively. Because of slow relaxation of some observables, notably acyl chain order parameters, only the last 20 ns of each trajectory was used for analysis.
Transfer Free Energy Profiles
Free energy profiles describing the transfer from water into a dodecane lamella were computed for three compounds: water, methanol, and ethane. In each case, two profiles were estimated, one using the all-atom C27r model of dodecane and one using our united-atom alkane model. The permeating molecules were modeled using TIP3P for water and all-atom C27 for methanol and ethane. The simulation box contained a lamella of 128 dodecane molecule and 1063 water molecules. Simulations were run in the NPNAT ensemble, with constant dimensions of 39.2 × 39.2 Å2 in the plane of the dodecane lamella. The temperature was set to 300 K, and the normal pressure to 1 bar. Lennard-Jones potentials were evaluated within a cutoff of 12 Å, with a smooth switching function above 10 Å. The choice of dodecane instead of a lipid bilayer was dictated by the need to obtain converged free energy profiles for a number of systems, which, because of the slow dynamics of lipid bilayers, would have required much longer trajectories.
To sample the transfer across the water-alkane interface and compute the free energy profile, the NAMD implementation47 of the ABF method48,49 was utilized. The reaction coordinate was the position, z, of the center of mass of the permeating molecule along the normal to the interface. Discretization of the free energy derivative over a 20-Å range of z was based on 0.2-Å-wide bins. After a short equilibration, each ABF simulation was run for 20–25 ns. Convergence of the free energy profiles was indicated by reversible diffusion throughout the full range of z resulting in uniform sampling, which implies that the underlying free energy landscape is accurately canceled by the adaptive bias.47 The origin along z was set to the center of the dodecane lamella. Because of the absence of a pressure-based long-range correction to Lennard-Jones interactions, the volume of the all-atom dodecane model was overestimated by approximately 3% with respect to both experiment and the united-atom model. The free energy plots for the united-atom model were shifted by 0.4 Å to match the position of the water-alkane interface between the two models.
Results and Discussion
Force-Field Parameters
Parameterizing Lennard-Jones terms is usually a delicate step. In the case of united-atom alkanes, the balance between methylene and methyl pseudoatoms poses a problem. The underdetermination can be artificially lifted by imposing relationships between the radii of these groups,25 but this is not compatible with a correct chain-length dependence of liquid alkane properties.27 Indeed, reproducing this dependence requires the counterintuitive choice of a radius for methyl smaller than that of methylene (see Table 1). Four sets of parameters were tested, and the second set of Chiu et al.28 was found to give good agreement with the target data.43 The density of liquid pentane was underestimated by 0.9%, and that of pentadecane was overestimated by a mere 0.1%. The enthalpies of vaporization of pentane and pentadecane were both slightly underestimated, by 0.26 and 0.22 kcal/mol, respectively. Consequently, these Lennard-Jones potentials, listed in the last row of Table 1, were used in the development of the remaining parameters and in the final model.
Because of the small number of degrees of freedom in the united-atom model, torsional parameters and liquid-phase torsional distributions are tightly coupled, leading to fast convergence of the iterative fitting procedures, after at most five iterations. In all cases, the resulting distributions closely matched the targets computed from C27r models. Table 3 contains the final values of the parameters. For consistency, order-6 truncated Fourier series were used for torsions around all single bonds, although some high-order coefficients are rather small in the converged set. The top panel of Figure 1 provides a comparison of the fitted potential for inner bonds of saturated chains with previous united-atom force fields, as well as the potential energy surface of the central bond of heptane. The latter was obtained by Klauda et al.33 at a post-Hartree–Fock level. The fitted united-atom potential can be seen to match the ab initio surface closely.
TABLE 3.
Torsional Parameters for the Ester Region and for Saturated and Monounsaturated Hydrocarbon Chainsa,b
| torsional angle | V 1 | V 2 | V 3 | V 4 | V 5 | V 6 |
|---|---|---|---|---|---|---|
| CH2E CH2E CL OSL | 0.4733 | 0.1436 | 0.3774 | 0.0737 | 0.0353 | −0.0256 |
| CL CH2E CH2E CH2E | −0.5567 | 0.0434 | 2.1105 | 0.0677 | 0.0270 | −0.0835 |
| CH2E CH2E CH2E CH2E | 0.9984 | −0.5617 | 1.6031 | −0.0811 | 0.1259 | −0.0698 |
| CH2E CH2E CH2E CH3E | 1.0331 | −0.6376 | 1.6736 | −0.0738 | 0.1997 | −0.0766 |
| CH2E CH2E CH2E CH1E | 0.5395 | −0.3210 | 2.1088 | 0.1340 | −0.0396 | −0.0578 |
| CH2E CH2E CH1E CH1E | −1.0753 | −0.1187 | −0.7115 | 0.0597 | −0.0828 | 0.0338 |
| CH2E CH1E CH1E CH2E | 14.0000 | 5.8031 |
Vk is in units of kcal/mol.
δk is 0° for odd k and 180° for even k, except for rotation around the double bond (last line), for which δ1 = δ2 = 180°.
Figure 1.
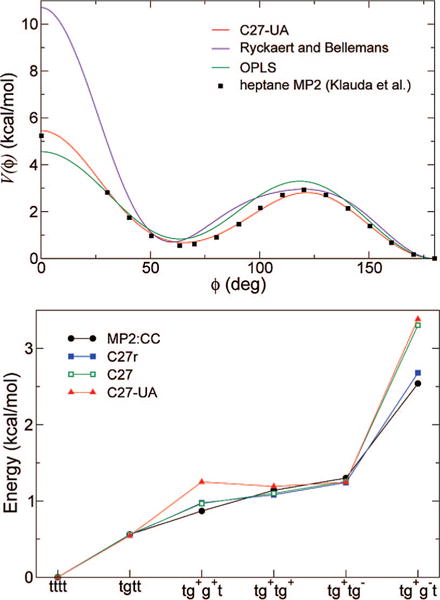
Top: Comparison of torsional potentials for alkanes. Black, OPLS;44 red, Ryckaert and Bellemans;42 blue, C27-UA (see CH2E-CH2E-CH2E-CH2E in Table 3). Bottom: Gas-phase energies of selected conformations of heptane with respect to that of the all-trans conformation, according to different models. Black, approximated CCSD(T);63 green, CHARMM27;32 red, C27-UA. Conformers are labeled according to the four C—C—C—C torsions, with letters t for trans and g for gauche, with the sign of the torsional angle.
Gas-Phase Conformational Properties
Although not of direct relevance to lipid simulations, the conformational properties of heptane were used as a means of precise comparison to existing force fields. Relative gas-phase energies of several conformers are shown in Figure 1 (bottom), for both empirical and ab initio calculations. The correlation between adjacent torsional angles54 is not trivially reproduced by all-atom empirical models.33 It is all the less likely to be accurately described by a united-atom model, wherein there are no hydrogen–hydrogen nonbonded interactions and the interactions arising between methylene pseudoatoms are too weak to significantly influence conformational energies. It should also be noted that long-chain alkanes were the main target of the present parametrization. In the case of C27-UA, energy penalties due to gauche bonds are essentially additive, except for the particular case of the tg+g−t conformer, in which the steric clash between methylene groups is effectively described by 1,5 nonbonded interactions. Most noticeable is the absence, in the united-atom model, of a “positive pentane effect”, whereby introducing a second gauche bond adjacent to an existing one incurs a reduced energetic penalty, hence stabilizing the tg+g+t conformer over tg+tg+ and tg+tg−. Although the description of heptane conformations is not comparable to that of C27r, it reasonably captures the energetics of low-energy conformers, given its low degree of detail. A larger deviation is observed for the tg+g−t form, which is not expected to be significantly populated at room temperature.
The heptane example suggests that the main discrepancy between C27r and C27-UA alkanes arises from the lack of positive coupling between adjacent gauche bonds. The procedure used to derive torsional potentials is intended to compensate that effect and yield a correct average gauche propensity in condensed-phase long-chain alkanes.
Bilayer Structure
The efficiency gain resulting from the united-atom model was estimated from benchmark times for POPC bilayer simulations. The all-atom representation of the fully hydrated 128-lipid bilayer contains 29041 atoms, whereas the united-atom system has 20849 atoms. Using 32 processors of an Intel Xeon cluster with Myrinet networking yielded 3.47 ns of trajectory per day for C27r and 5.23 ns per day for C27-UA, representing a 51% increase in simulation speed. Except the force field itself, all simulation parameters were identical.
It is known that CHARMM phospholipid bilayers do not reproduce the experimental area per headgroup when simulated under vanishing surface tension, but rather should be simulated under positive surface tension or in a constant-area ensemble.55 This is mostly dictated by properties of the headgroups, as shown, for example, by the lack of significant changes brought in this respect by the C27r set of parameters for the acyl chains.33 C27-UA is therefore expected to retain that behavior from C27r, which is confirmed by the surface tension measured in our constant-area simulations. Whereas the C27r simulations at 64 and 68 Å2 per lipid give respective surface tensions of 25 and 34 mN/m, C27-UA exhibits comparable values of 20 and 32 mN/m. Interestingly, this issue seems not to be limited to the CHARMM force field: it was recently reported34 that POPC bilayers simulations using the generalized AMBER force field35 combined with RESP charges56 require a total applied surface tension of 60 mN/m to reproduce the experimental membrane area.
Because the bilayer surface area is not known very precisely, both systems were run under two sets of boundary conditions, with respective areas per lipid of 64 and 68 Å2. All-atom simulations of the 128-lipid system exhibited an unexpected behavior, marked by instabilities. This was most noticeable from the long-term evolution of order parameter profiles around the double bond in sn-2. A clear equilibrium behavior was obtained by running larger, 512-lipid periodic bilayer patches.
Figure 2 depicts electron density profiles along the bilayer normal for components of the system. Note that density profiles computed from simulations were not symmetrized. C27r and C27-UA densities awere found to agree closely. A small difference can be noticed for the polar groups, whose distribution is slightly narrower and closer to the bilayer center in the united-atom simulation than in the all-atom one. There is a displacement in average vertical position of less than 0.3 Å (less than 1.5% relative change), and the change in width of 0.2–0.3 Å (less than 10%) is mostly due to increased undulations in the larger all-atom periodic cells. The lower panel in Figure 2 features densities fitted to X-ray diffraction data obtained by Kučerka et al.57 using the H2 model.11 Agreement with the united-atom bilayer structure is satisfactory. Data obtained at a smaller area provide a better fit inside the bilayer, but not as good in the outer part of the headgroup region. This suggests that both 64 and 68 Å2 are within the range of reasonable estimates of the actual area per lipid. It is interesting to note here that Kučerka et al. reported an area estimate of 68.3 ± 1.5 Å2, immediately adding that they found the value surprisingly large and discussing possible limitations of the method by which it was obtained. In addition, electron density profiles do not constitute raw experimental results, but are calculated by fitting structural models to experimental form factors. In this process, the total electron density is well-determined, but successful fitting of different models to the same form factors11 shows that sensitivity of the simulated data to the model might not always be sufficient to fully resolve some features of the bilayer. This point is consistent with the fact that agreement of the total electron densities is significantly better than that of the bilayer components that make up the H2 model.
Figure 2.
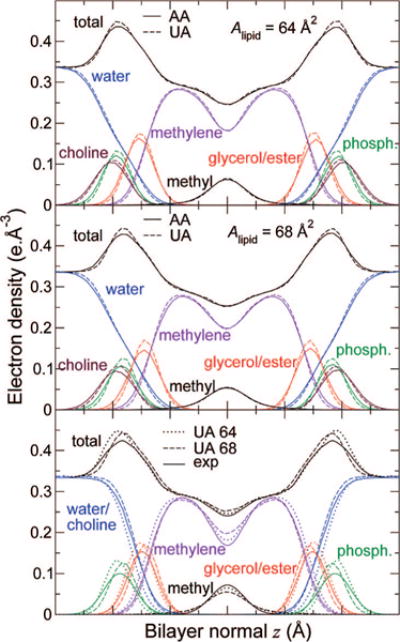
Comparisons of electron density profiles from simulations using C27r (solid lines) and C27-UA (dashed lines) at areas per lipid of (top) 64 Å2 and (middle) 68 Å2. Bottom: Comparison of electron density profiles from simulations using C27r at two different surface areas per lipid (dotted lines, 64 Å2; dashed lines, 68 Å2) with profiles obtained from the H2 model11 fitted to form factors obtained by X-ray diffraction57 (solid lines).
Carbon–deuterium order parameters are one of the best-resolved quantities that can be measured from liquid-crystal-state lipid systems. NMR measurements are compared with values from all-atom and united-atom simulations in Figure 3. Again, C27r and C27-UA behave similarly, although two differences can be noted. First, the sn-1 chain of the C27-UA bilayer is slightly more fluid than in the C27r bilayer. More intriguingly, order parameters around the double bond in the sn-2 chain show some deviation, the drop in order occurring later and being deeper in the united-atom system. An almost perfect agreement with experimental data is obtained from the united-atom simulation at 64 Å2/lipid. The only discrepancy appears in the first carbons of the sn-1 chain, a problem common to all systems studied here. The relative deviation of sn-2 order parameters in the all-atom, C27r systems could be an issue. Because the UA model seems unaffected and the SHAKE algorithm has been reported to affect the lateral pressure profile of bilayers,58 the possibility of SHAKE affecting the acyl chain structure of POPC was investigated. Simulations AA64″ and AA68″ were run for 50 ns with unconstrained carbon-hydrogen bonds. The resulting order parameter profiles, however, were not significantly different from constrained simulations (data not shown), ruling out SHAKE as a source of this discrepancy. This question warrants further investigation, although that falls outside the scope of the present work. As suggested by the electron density profiles, analysis of acyl chain order shows that 64–68 Å2 is a reasonable range for the area per lipid of this system and is seemingly as precise as can be determined using the currently available experimental data and computational models.
Figure 3.
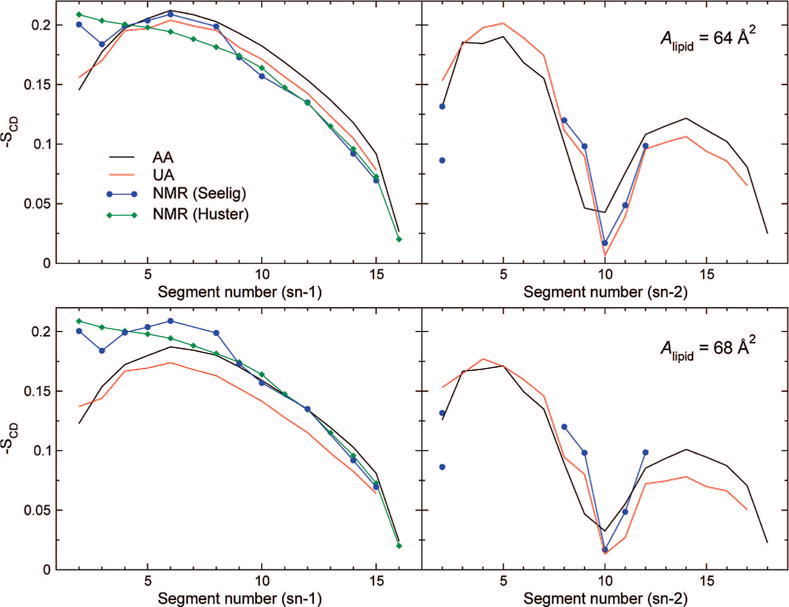
Experimental and simulated carbon-deuterium order parameter profiles. Simulations used the C27r (black) and C27-UA (red) models at areas per lipid of 64 (top) and 68 Å2 (bottom). Averaging was performed over 20 ns of MD trajectory. Experimental values from Seelig et al.59 (blue) and Huster et al.60 (green).
For NMR experiments from which SCD values were derived, Seelig and Seelig59 used selectively deuterated lipids for various positions along the chains. Huster et al.,60 in contrast, used perdeuterated acyl chains and attribute splittings by assuming a monotonic decrease in order parameter along the chain, following Lafleur et al.61 This approach, however, lacks a strong empirical or theoretical backing. Lafleur et al. cited POPC data by Seelig and Seelig as an example, although it can be seen from Figure 3 that, in this case, the decrease is not strictly monotonic: indeed, the first few methylene groups exhibit slightly lower ordering. This is a fragile basis for any general conclusion, and the method seems to be employed essentially for lack of a better source of information for assignment. In the future, comparison to simulations might provide the necessary information for attributing SCD order parameters, although this attribution will only be trustworthy provided that lipid force fields are first refined and tested against training sets of accurate, reliably assigned quadrupolar splittings from NMR spectroscopy. Another possibly significant issue with data obtained from perdeuterated samples lies in the influence of isotope effects on bilayer structure.62
Gauche fractions are plotted in Figure 4 for all carbon-carbon bonds in the acyl chains. Good agreement, in particular along the sn-2 chain, indicates that the C27-UA torsional parameters effectively mimic the particular conformational properties of the monounsaturated hydrocarbon. Only the first three bonds, next to the ester region, show imperfect agreement. This result indicates that properties of the model system, liquid methyl-hexanoate, only partially transfer to the environment experienced by a phospholipid in a bilayer. A correction to these torsional potentials could be calculated from bilayer data, but in addition to sampling difficulties, that approach entails a risk of overfitting. Our methodology aims at generating a generally valid model rather than matching one particular system with extreme precision.
Figure 4.

Gauche fractions of torsional angles along the acyl chains of POPC for C27r (circles) and C27-UA (squares) at 64 Å2 (top) and 68 Å2 (bottom).
Interaction with All-Atom Models
The practical usefulness of a united-atom lipid model that reproduces the essential properties of all-atom bilayers depends on whether the interactions with membrane-embedded compounds, notably membrane proteins, are satisfactorily described. Partitioning of small molecules into the bilayer is also an issue of broad biological and pharmacological interest. The work recently published by Tieleman et al.38 is a bolder endeavor than this one, as they tested the association of united-atom lipid and all-atom protein models directly taken from two altogether different force fields, namely, GROMOS and OPLS-AA. Our approach, leaving the headgroup model fully intact and modifying only the hydrocarbon region, makes closely matching standard, all-atom CHARMM simulations an easier objective. One possible source of incompatibility lies in the energetics of interactions between the hydrocarbon tails and various molecules, which determine the thermodynamics of membrane partitioning. Such interactions of all-atom compounds with the united-atom hydrocarbons were investigated in the following way: free energy profiles for transfer across a water–dodecane interface were estimated using either C27r or C27-UA for the alkane phase, for small molecules of varying hydrophobicity, namely, ethane, methanol, and water.
The resulting free energy profiles are shown in Figure 5. All three compounds show close agreement between profiles for the AA and UA models. Only in the case of methanol is there a discernible difference in the net transfer free energy, and that difference (0.4 kcal/mol) remains smaller than the thermal energy kBT. It should be noted that the depth of the interfacial minimum (1.2 kcal/mol) is preserved. The profile for ethane changes only in that the interfacial minimum disappears, but the depth of that minimum was about 0.2 kcal/mol, hardly significant at room temperature. Last, the free energy for transferring a water molecule between the aqueous and alkane phases shows no noticeable difference between the two alkane models. From these results, it is expected that the thermodynamics of inclusion of all-atom compounds into the membrane will be unaffected by switching to the united-atom representation of the lipid tails. In particular, the hydrophobicity of the hydrocarbon core should be preserved in a quantitative manner.
Figure 5.
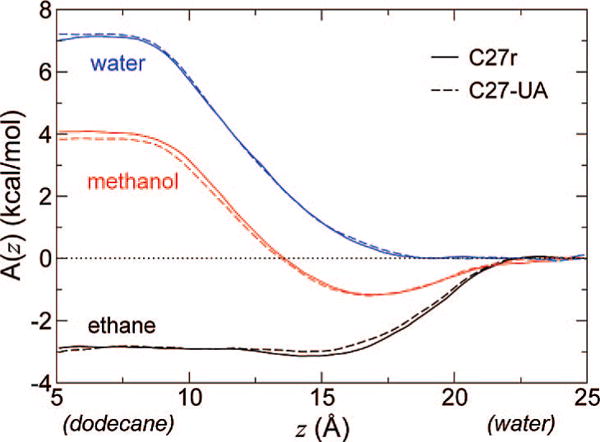
Comparison of free energy profiles for water–dodecane transfer of small molecules, using C27r (solid lines) and C27-UA (dashed lines) for the alkane phase. Free energy was conventionally taken to be zero in the water phase. Color indicates the permeating molecule: black, ethane; red, methanol; blue, water.
Conclusion
We describe an empirical model, C27-UA, that complements CHARMM phospholipid headgroups with an implicit-hydrogen description of the hydrocarbon chains, either saturated or containing one cis double bond. The united-atom hydrocarbon model was developed as a coarse-graining of C27r alkanes and alkenes, by effectively reproducing all-atom torsional free energy surfaces. Because parametrization was based only on simple, nonlipid model compounds, a significant degree of transferability is expected, in particular with respect to lipid headgroup and acyl chain length and saturation. C27-UA can therefore be used directly for any type of phospholipid for which C27 parameters are available, except those containing trans or polyunsaturated chains. Considerable performance improvement can be obtained, while preserving the structure of bilayers and retaining full compatibility with the all-atom CHARMM force field, making this model a useful compromise for many applications for which an explicit description of alkane hydrogens is not specifically required.
The structure of a C27-UA POPC bilayer was found to be similar to that of the equivalent all-atom system and in good agreement with known experimental observables such as electron density profiles and carbon-deuterium order parameters. Minimal deviation of the conformational preferences of united-atom chains with respect to the all-atom model are unavoidable given the simplicity and generality of the implicit-hydrogen potential. Comparison with experimental data suggests that such deviation remains within the accuracy of the force field as a whole. The energetics of interaction of small molecules in their all-atom description with united-atom or all-atom alkanes are virtually identical, suggesting that C27-UA is suitable for simulations of complex membranes involving interaction of lipids with nonlipid compounds, the latter being described by the standard, fully atomistic CHARMM force field.
Acknowledgments
Jeffery Klauda and Richard Pastor are gratefully acknowledged for fruitful discussions. This research was supported in part by the National Science Foundation through TeraGrid resources provided by NCSA. This work was funded in part by National Institutes of Health Grant GM055876.
Footnotes
Supporting Information Available: CHARMM-format parameter file for C27-UA lipids and topology file for POPC. This information is available free of charge via the Internet at http://pubs.acs.org.
References and Notes
- 1.Scott HL. Curr Opin Struct Biol. 2002;12:495–502. doi: 10.1016/s0959-440x(02)00353-6. [DOI] [PubMed] [Google Scholar]
- 2.Ash WL, Zlomislic MR, Oloo EO, Tieleman DP. Biochim Biophys Acta. 2004;1666(1–2):158–189. doi: 10.1016/j.bbamem.2004.04.012. [DOI] [PubMed] [Google Scholar]
- 3.Lee AG. Biochim Biophys Acta. 2004;1666(1–2):62–87. doi: 10.1016/j.bbamem.2004.05.012. [DOI] [PubMed] [Google Scholar]
- 4.daCosta CJB, Ogrel AA, McCardy EA, Blanton MP, Baenziger JE. J Biol Chem. 2002;277(1):201–208. doi: 10.1074/jbc.M108341200. [DOI] [PubMed] [Google Scholar]
- 5.Sotomayor M, Schulten K. Biophys J. 2004;87(5):3050–3065. doi: 10.1529/biophysj.104.046045. [DOI] [PMC free article] [PubMed] [Google Scholar]
- 6.Deol SS, Bond PJ, Domene C, Sansom MSP. Biophys J. 2004;87(6):3737–3749. doi: 10.1529/biophysj.104.048397. [DOI] [PMC free article] [PubMed] [Google Scholar]
- 7.Kandt C, Ash WL, Tieleman DP. Methods. 2007;41(4):475–488. doi: 10.1016/j.ymeth.2006.08.006. [DOI] [PubMed] [Google Scholar]
- 8.Mackerell AD. J Comput Chem. 2004;25(13):1584–1604. doi: 10.1002/jcc.20082. [DOI] [PubMed] [Google Scholar]
- 9.Benz RW, Castro-Román F, Tobias DJ, White SH. Biophys J. 2005;88(2):805–817. doi: 10.1529/biophysj.104.046821. [DOI] [PMC free article] [PubMed] [Google Scholar]
- 10.Kučerka N, Liu Y, Chu N, Petrache HI, Tristram-Nagle S, Nagle JF. Biophys J. 2005;88(4):2626–2637. doi: 10.1529/biophysj.104.056606. [DOI] [PMC free article] [PubMed] [Google Scholar]
- 11.Klauda JB, Kučerka N, Brooks BR, Pastor RW, Nagle JF. Biophys J. 2006;90(8):2796–2807. doi: 10.1529/biophysj.105.075697. [DOI] [PMC free article] [PubMed] [Google Scholar]
- 12.Shelley JC, Shelley MY, Reeder RC, Bandyopadhyay S, Klein ML. J Phys Chem B. 2001;105:4464–4470. [Google Scholar]
- 13.Marrink S, deVries A, Mark A. J Phys Chem B. 2004;108(2):750–760. [Google Scholar]
- 14.Lopez CF, Nielsen SO, Moore PB, Shelley JC, Klein ML. J Phys: Condens Matter. 2002;14:9431–9444. [Google Scholar]
- 15.Marrink S-J, Mark AE. Biophys J. 2004;87(6):3894–3900. doi: 10.1529/biophysj.104.048710. [DOI] [PMC free article] [PubMed] [Google Scholar]
- 16.Bond PJ, Sansom MSP. J Am Chem Soc. 2006;128(8):2697–2704. doi: 10.1021/ja0569104. [DOI] [PMC free article] [PubMed] [Google Scholar]
- 17.Shinoda W, DeVane R, Klein ML. Mol Simul. 2007;33:27–36. [Google Scholar]
- 18.Marrink SJ, Lindahl E, Edholm O, Mark AE. J Am Chem Soc. 2001;123(35):8638–8639. doi: 10.1021/ja0159618. [DOI] [PubMed] [Google Scholar]
- 19.de Vries AH, Mark AE, Marrink SJ. J Am Chem Soc. 2004;126(14):4488–4489. doi: 10.1021/ja0398417. [DOI] [PubMed] [Google Scholar]
- 20.Knecht V, Marrink S-J. Biophys J. 2007;92(12):4254–4261. doi: 10.1529/biophysj.106.103572. [DOI] [PMC free article] [PubMed] [Google Scholar]
- 21.van Gunsteren WF, Berendsen HJC. GROningen MOlecular Simulation (Gromos). Library Manual. Laboratory of Physical Chemistry, University of Groningen; Groningen, The Netherlands: 1987. [Google Scholar]
- 22.Egberts E, Marrink SJ, Berendsen HJC. Eur Biophys J. 1994;22:423–436. doi: 10.1007/BF00180163. [DOI] [PubMed] [Google Scholar]
- 23.Pearlman DA, Case DA, Caldwell JC, Ross WS, Cheatham TE, Seibel G, Singh UC, Weiner P, Kollman PA. Amber 4.1. University of California, San Francisco (UCSF); San Francisco, CA: 1994. [Google Scholar]
- 24.Essmann U, Perera L, Berkowitz ML. Langmuir. 1995;11:4519–4531. [Google Scholar]
- 25.Berger O, Edholm O, Jähnig F. Biophys J. 1997;72(5):2002–2013. doi: 10.1016/S0006-3495(97)78845-3. [DOI] [PMC free article] [PubMed] [Google Scholar]
- 26.Smondyrev AM, Berkowitz ML. J Comput Chem. 1999;20:531–545. [Google Scholar]
- 27.Chiu S, Clark M, Jakobsson E, Subramaniam S, Scott H. J Phys Chem B. 1999;103(30):6323–6327. [Google Scholar]
- 28.Chiu SW, Vasudevan S, Jakobsson E, Mashl RJ, Scott HL. Biophys J. 2003;85(6):3624–3635. doi: 10.1016/S0006-3495(03)74780-8. [DOI] [PMC free article] [PubMed] [Google Scholar]
- 29.Schuler LD, Daura X, van Gunsteren WS. J Comput Chem. 2001;22:1205–1218. [Google Scholar]
- 30.Chandrasekhar I, Kastenholz M, Lins RD, Oostenbrink C, Schuler LD, Tieleman DP, van Gunsteren WF. Eur Biophys J. 2003;32(1):67–77. doi: 10.1007/s00249-002-0269-4. [DOI] [PubMed] [Google Scholar]
- 31.Schlenkrich M, Brickmann J, MacKerell AD, Jr, Karplus M. In: Biological Membranes: A Molecular Perspective from Computation and Experiment. Merz KM, Roux B, editors. Birkhäuser; Boston, MA: 1996. pp. 31–81. [Google Scholar]
- 32.Feller SE, MacKerell AD., Jr J Phys Chem B. 2000;104:7510–7515. [Google Scholar]
- 33.Klauda JB, Brooks BR, MacKerell AD, Venable RM, Pastor RW. J Phys Chem B. 2005;109(11):5300–5311. doi: 10.1021/jp0468096. [DOI] [PubMed] [Google Scholar]
- 34.Jójárt B, Martinek TA. J Comput Chem. 2007;28(12):2051–2058. doi: 10.1002/jcc.20748. [DOI] [PubMed] [Google Scholar]
- 35.Wang J, Wolf RM, Caldwell JW, Kollman PA, Case DA. J Comput Chem. 2004;25(9):1157–1174. doi: 10.1002/jcc.20035. [DOI] [PubMed] [Google Scholar]
- 36.MacKerell AD, Feig M, Brooks CL. J Comput Chem. 2004;25(11):1400–1415. doi: 10.1002/jcc.20065. [DOI] [PubMed] [Google Scholar]
- 37.MacKerell AD, Banavali N, Foloppe N. Biopolymers. 2000;56(4):257–265. doi: 10.1002/1097-0282(2000)56:4<257::AID-BIP10029>3.0.CO;2-W. [DOI] [PubMed] [Google Scholar]
- 38.Tieleman DP, MacCallum JL, Ash WL, Kandt C, Xu Z, Monticelli L. J Phys: Condens Matter. 2006;18(28):S1221–S1234. doi: 10.1088/0953-8984/18/28/S07. [DOI] [PubMed] [Google Scholar]
- 39.Jorgensen W, Maxwell D, Tirado-Rives J. J Am Chem Soc. 1996;118(45):11225–11236. [Google Scholar]
- 40.Tarek M. Biophys J. 2005;88(6):4045–4053. doi: 10.1529/biophysj.104.050617. [DOI] [PMC free article] [PubMed] [Google Scholar]
- 41.Treptow W, Tarek M. Biophys J. 2006;90(9):L64–L66. doi: 10.1529/biophysj.106.080754. [DOI] [PMC free article] [PubMed] [Google Scholar]
- 42.Ryckaert J, Bellemans A. J Chem Soc Faraday Discuss. 1978;66:95–106. [Google Scholar]
- 43.Lide DR, editor. CRC Handbook of Chemistry and Physics on CDROM. CRC Press; Boca Raton, FL: 2002. [Google Scholar]
- 44.Jorgensen WL, Madura JD, Swenson CJ. J Am Chem Soc. 1984;106:6638–6646. [Google Scholar]
- 45.Phillips JC, Braun R, Wang W, Gumbart J, Tajkhorshid E, Villa E, Chipot C, Skeel LRD Kalé, Schulten K. J Comput Chem. 2005;26:1781–1802. doi: 10.1002/jcc.20289. [DOI] [PMC free article] [PubMed] [Google Scholar]
- 46.Feller SE, Yin D, Pastor RW, MacKerell AD. Biophys J. 1997;73(5):2269–2279. doi: 10.1016/S0006-3495(97)78259-6. [DOI] [PMC free article] [PubMed] [Google Scholar]
- 47.Hénin J, Chipot C. J Chem Phys. 2004;121:2904–2914. doi: 10.1063/1.1773132. [DOI] [PubMed] [Google Scholar]
- 48.Darve E, Pohorille A. J Chem Phys. 2001;115:9169–9183. [Google Scholar]
- 49.Darve E, Wilson M, Pohorille A. Mol Sim. 2002;28:113–144. [Google Scholar]
- 50.Bhandarkar M, Brunner R, Chipot C, Dalke A, Dixit S, Grayson P, Gullingsrud J, Gursoy A, Hardy D, Hénin J, Humphrey W, Hurwitz D, Krawetz N, Kumar S, Nelson M, Phillips J, Shinozaki A, Zheng G, Zhu F. NAMD User’s Guide, Version 2.6. Theoretical Biophysics Group, University of Illinois and Beckman Institute; Urbana, IL: Aug, 2006. [Google Scholar]
- 51.Jorgensen WL, Chandrasekhar J, Madura JD, Impey RW, Klein ML. J Chem Phys. 1983;79:926–935. [Google Scholar]
- 52.Nagle JF, Tristram-Nagle S. Biochim Biophys Acta. 2000;1469(3):159–195. doi: 10.1016/s0304-4157(00)00016-2. [DOI] [PMC free article] [PubMed] [Google Scholar]
- 53.Feller SE, Venable RM, Pastor RW. Langmuir. 1997;13:6555–6561. [Google Scholar]
- 54.Klauda JB, Pastor RW, Brooks BR. J Phys Chem B. 2005;109(33):15684–15686. doi: 10.1021/jp0527608. [DOI] [PMC free article] [PubMed] [Google Scholar]
- 55.Feller SE, Pastor RW. Biophys J. 1999;111:1281–1287. [Google Scholar]
- 56.Bayly CI, Cieplak P, Cornell WD, Kollman PA. J Phys Chem. 1993;97:10269–10280. [Google Scholar]
- 57.Kučerka N, Tristram-Nagle S, Nagle JF. J Membr Biol. 2005;208(3):193–202. doi: 10.1007/s00232-005-7006-8. [DOI] [PubMed] [Google Scholar]
- 58.Duque D, Vega LF. J Chem Phys. 2004;121(17):8611–8617. doi: 10.1063/1.1802672. [DOI] [PubMed] [Google Scholar]
- 59.Seelig A, Seelig J. Biochemistry. 1977;16(1):45–50. doi: 10.1021/bi00620a008. [DOI] [PubMed] [Google Scholar]
- 60.Huster D, Scheidt HA, Arnold K, Herrmann A, Müller P. Biophys J. 2005;88(3):1838–1844. doi: 10.1529/biophysj.104.048926. [DOI] [PMC free article] [PubMed] [Google Scholar]
- 61.Lafleur M, Fine B, Sternin E, Cullis PR, Bloom M. Biophys J. 1989;56(5):1037–1041. doi: 10.1016/S0006-3495(89)82749-3. [DOI] [PMC free article] [PubMed] [Google Scholar]
- 62.Guard-Friar D, Chen CH, Engle AS. J Phys Chem. 1985;89:1810–1813. [Google Scholar]
- 63.Klauda J, Garrison S, Jiang J, Arora G, Sandler S. J Phys Chem A. 2004;108(1):107–112. [Google Scholar]