Abstract.
Purpose: One major challenge facing simultaneous positron emission tomography (PET)/ magnetic resonance imaging (MRI) is PET attenuation correction (AC) measurement and evaluation of its accuracy. There is a crucial need for the evaluation of current and emergent PET AC methodologies in terms of absolute quantitative accuracy in the reconstructed PET images.
Approach: To address this need, we developed and evaluated a lesion insertion tool for PET/MRI that will facilitate this evaluation process. This tool was developed for the Biograph mMR and evaluated using phantom and patient data. Contrast recovery coefficients (CRC) from the NEMA IEC phantom of synthesized lesions were compared to measurements. In addition, SUV biases of lesions inserted in human brain and pelvis images were assessed from PET images reconstructed with MRI-based AC (MRAC) and CT-based AC (CTAC).
Results: For cross-comparison PET/MRI scanners AC evaluation, we demonstrated that the developed lesion insertion tool can be harmonized with the GE-SIGNA lesion insertion tool. About CRC curves difference between simulation and measurement was achieved. An average of 1.6% between harmonized simulated CRC curves obtained with mMR and SIGNA lesion insertion tools was achieved. A range of to 12% MRAC to CTAC SUV bias was respectively achieved in the vicinity and inside bone tissues in patient images in two anatomical regions, the brain, and pelvis.
Conclusions: A lesion insertion tool was developed for the Biograph mMR PET/MRI scanner and harmonized with the SIGNA PET/MRI lesion insertion tool. These tools will allow for an accurate evaluation of different PET/MRI AC approaches and permit exploration of subtle attenuation correction differences across systems.
Keywords: positron emission tomography/magnetic resonance imaging, attenuation correction, synthetic lesion insertion tool
1. Introduction
Positron emission tomography (PET) is a quantitative imaging technique for localizing radiotracer uptake. Quantitative PET has seen a growing interest, notably in oncology and neurology,1,2 for both evaluating absolute tracer uptake and uptake changes over time to assess disease progression or treatment efficacy. The most common measurement of tracer uptake is the standardized uptake value (SUV), which is the ratio of measured lesion activity concentration uptake to the total injected tracer activity normalized by the patient body weight.3
An essential element for accurate quantification in PET is the attenuation correction (AC). In PET/computed tomography (PET/CT), the AC maps are generated from the CT images based on information from photon attenuation due to different tissue radiodensity and attenuation maps are derived by a linear relationship4 between the Hounsfield unit (HU) and photon attenuation coefficients at 511 keV. PET/magnetic resonance imaging (MRI) was introduced as a new hybrid imaging modality, which has the potential to enhance the diagnostic accuracy provided by the excellent soft-tissue contrast of MRI.5 In PET/MRI, AC [MRI-based AC (MRAC)] is instead based on the proton magnetic properties in the tissues, and those properties cannot easily be related to photon attenuation. In particular, bones are problematic because protons in bone depict short transverse relaxation signal (T2), which is too short to be captured by most MRI techniques.6 The absence of adequate MRI signal for air and bone leads to errors in attenuation map generation in those regions,7,8 leading to erroneous quantitative measurements9,10 of activity in bones or close to bones. In addition, fat and soft-tissue AC coefficients are assigned fixed standard values rather than measured from actual regional density or composition.
Numerous approaches for AC in PET/MRI have been proposed over the last few years. PET/MRI AC approaches fall into three categories.6,11 The first class is based on the segmentation of the MRI images into tissues of interest using different MRI imaging sequences.12–16 A second class of approaches, an atlas-based approach, which uses an atlas or measured patient template of major bones combined with a pattern recognition technique.17–20 Finally, a recently introduced third class, deep learning-based approaches, are used to generate pseudo-CT images directly from MRI images.21–24
Most clinical evaluation of PET/MRI studies have compared PET/MRI to PET/CT, which requires patients to be imaged sequentially on PET/CT and PET/MRI.25 This procedure is inherently limited by the fact that the PET acquisitions are at a different time from the injection and requires many patients recruited that possess lesions of varied sizes and locations. Hence, this approach does not permit rapid development and evaluation of novel research PET/MRI AC approaches or the evaluation of new methodologies provided by the PET/MRI manufacturers.
Characterizing errors associated with various MRACs is difficult. Studies that use real patient data suffer from a lack of diversity in terms of lesions type or location.21,23,24,26–28 The evaluation of AC methodology could be accomplished with appropriately designed phantoms—employing anthropomorphic shapes. However, the construction of PET/MRI compliant phantoms requires the development of materials that are both mimicking human body tissue composition and exhibit both the photon attenuation properties of PET and protons magnetic field response for MR imaging. Such phantoms must also respond identically to body tissue when imaged with clinically employed AC MR sequences or methodologies. The construction of such a phantom is complex and may never completely represent the variety of human body shapes and bone structures observed in the population.
Therefore, to aid in the evaluation of different PET/MRI AC approaches, a fast and accurate lesion insertion tool is needed. A new tool was developed and validated for the Siemens mMR system,29 and its performance was evaluated along with the existing GE PET imaging lesion insertion tool,30,31 using NEMA IEC phantom and patient data in the brain and pelvis PET/MRI images. Using the NEMA IEC phantom, both lesion insertion tools were harmonized to provide the same CRC curves for spherical objects of varying sizes. The application of the lesion simulations tools was demonstrated in human patient PET/MRI imaging.
2. Methods
2.1. Lesion Insertion Tool Framework for mMR
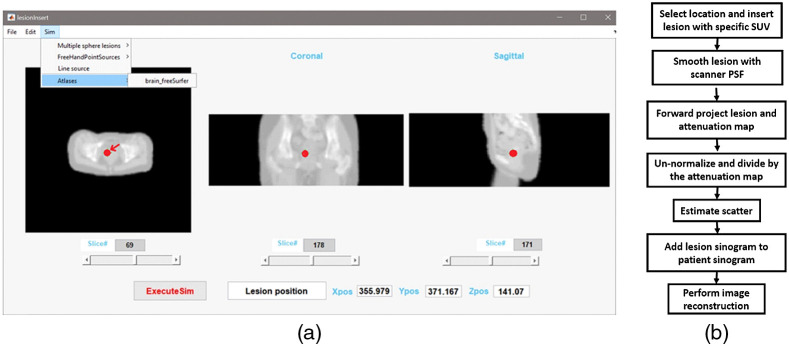
We developed a MATLAB (MathWorks, ver. R2018b) graphical application to allow interactively inserting lesions from locations defined from three-dimensional (3D) anatomical images [Fig. 1(a)]. The tool employs anatomical MRI and CT images as a reference for specifying the position of the synthetic lesion. The lesion insertion tool also allows the use of attenuation maps derived from CT or MRI images or a computed analytical phantom attenuation map with defined linear attenuation coefficients (LACs). Figure 1(b) shows the lesion insertion tool flow-chart. First, the 3D anatomical image is loaded into the application, and the user interactively identifies the insertion location. For this validation work, lesions (spherical by default) were inserted and defined by a diameter () at a location position identified by its orthogonal coordinates [horizontal-transverse position (), vertical-transverse position (), and horizontal-axial position ()]. Pixel intensities for the inserted spherical lesion are set to an initial known activity in Bq/ml corresponding to a lesion SUV specified by the user. The number of detected coincidences is then calculated based on the PET/MRI scanner acquisition parameters, which are acquisition time, injection time and activity, scanner sensitivity along with the known patient’s weight. The inserted lesion image is then smoothed using the scanner point spread function at full width half maximum (FWHM). For this study, we employed and isotropic FWHM of the Gaussian smoothing filer of . This value is correct for lesions positioned close to the center of the FOV.29 In general, a spatially variant non-isotropic FWHM should be used, depending on number of iterations, post-reconstruction filter, or use of point-spread function. This parameter can easily be changed by the user. Users can approximate this parameter according to lesions positions inside scanner’s FOV. The resulted inserted lesion is then forward projected into sinogram space and calibrated using the scanner quantification factor, which is provided in the normalization header file. Then, the calibrated lesion sinogram is divided by the attenuation correction factor sinogram, which was itself derived from the forward projection of the attenuation map. The algorithm employs the forward-projector included in the e7tools software distribution for the Biograph mMR. Finally, and since the sum of two Poisson distribution is a Poisson distribution, we simulated Poisson noise is added to the forward projected, un-normalized, attenuated lesion sinograms. The final lesion sinogram is then added to the measured patient sinogram and PET images including the inserted synthetic lesion (or lesions) are reconstructed using AC, scatter correction and normalization. Lesion scatter is calculated using single–scatter simulation provided with e7tools for the inserted lesion using its activity and the patient attenuation map. For small, diameter, with moderate activity, the contribution of additional scatter will be negligible and have little effect on patient scatter distribution.
Fig. 1.
(a) An example of lesion inserted interactively on patient pelvis attenuation map (indicated using an arrow). (b) Flowchart of the synthetic lesion insertion process for the lesion insertion tools for mMR.
Additional scatter generated by the lesion needs to be considered only in case of large and intense lesions.
2.2. Image Reconstruction
In this work, the 3D-OSEM image reconstruction algorithm was used and was performed using vendor specific image research reconstruction toolboxes e7tools (Siemens) and Duetto PET Toolbox (GE). Due to differences in scanner hardware and image reconstruction algorithm implementation, the quantitative accuracy of measuring activity in small lesions will be slightly different in response to image reconstruction parameters for each implementation. For the mMR lesion insertion tool, images were reconstructed with 3 iterations, 21 subsets, and 5-mm post-reconstruction Gaussian smoothing filter with matrix with voxels at each. For the GE Signa,32 images were reconstructed with two iterations and 16 subsets with time of flight (TOF) on a matrix size of and pixel size each. No post-reconstruction smoothing filter was initially applied with the SIGNA lesion insertion tool since post filtering will be used for harmonization with the lesion insertion tool developed for the mMR. AC was provided by CT images of the phantom registered using rigid registration with the elastix software33,34 to the MRI attenuation map, scaled to 511 keV attenuation coefficient.35 Scatter correction was used as implemented in the vendor-provided image reconstruction toolboxes.
2.3. Harmonization of the Lesion Insertion Tools
In the context of multi-center clinical trials, it often becomes necessary to pool data coming from multi-institutions and multi-scanners to increase the pool of studies included in a given research study. To allow examination of AC strategies across manufacturers using lesion insertion tool methodologies, it is necessary to demonstrate that tools developed for each manufacturer can adequately reproduce physical measurements of lesion activity and, also that lesions of similar sizes can be demonstrated to generate similar recovery and characteristics on different scanners. Two lesion insertion tools (this work and the GE-SIGNA) were harmonized by adjusting the post-reconstruction Gaussian smoothing to the images generated by the GE SIGNA lesion insertion tool to achieve identical CRC curves obtained from the images of the NEMA IEC phantom. The GE SIGNA lesion insertion tool images, were first reconstructed without a post-reconstruction smoothing and then smoothed using a 3D Gaussian kernel at different FWHM, starting from 1 to 3 mm by step of 0.01 mm. CRC curves were calculated for each FWHM kernel width, and the optimal post-reconstruction filter was defined by the best match between simulated CRC curves from mMR (CRCmMR) and SIGNA scanners (CRCSIGNA) by least-square minimization:
| (1) |
is the number spheres in the NEMA IEC phantom.
2.4. Phantom Imaging
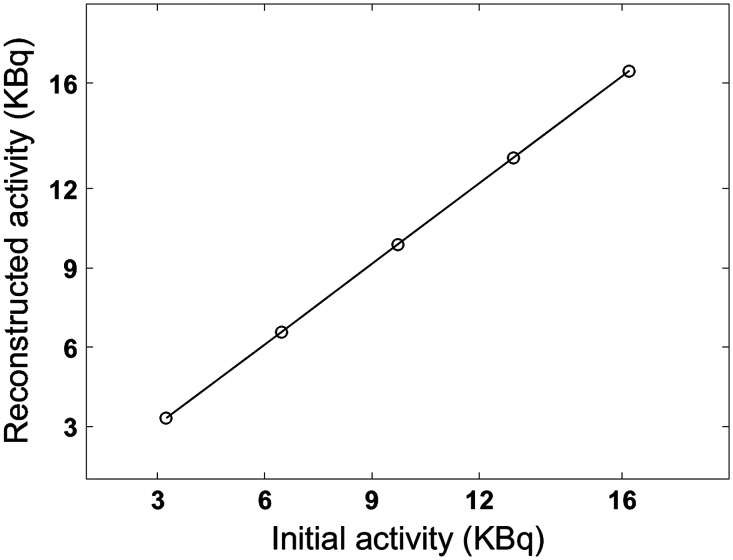
Phantom measurements were performed using the Siemens Biograph mMR (Siemens Knoxville, Tennessee) and GE SIGNA (GE Healthcare, Waukesha, Wisconsin) PET/MRI hybrid scanners. Performances and characteristics of the two scanners have been previously described.29,32 The NEMA IEC phantom, with its standard six spheres, was used in this study.36 This phantom consists of a hollow chamber embedded with six fillable spheres of diameter at 10, 13, 17, 28, and 37 mm. The NEMA IEC phantom was prepared so that lesion to background ratio was at the time of imaging with a total of 20 MBq in the phantom large water compartment. The developed lesion insertion tool does not limit lesion to background ratio, i.e., 3:1. This was checked through the linearity of the lesion response to a range of specified activities (Sec. 3.2.2 and added as Fig. 8 in appendix). These results demonstrate that inserting lesion activity is a linear process and would corresponds in linear behavior in terms of ratios of background activity.
Fig. 8.
Lesion activity linearity for the mMR scanner. Theoretical versus reconstructed lesion activities.
2.4.1. Validation using the NEMA IEC phantom
Lesion size dependency of contract recovery was validated using the NEMA IEC phantom with its standard six spheres. Six additional spheres, identical in size, and transverse positions, were inserted at an axial slice 58 mm away from to the plane containing the spheres of the actual physical phantom. CRC curves for the simulated and measured lesions were created for validation. CRC curves were calculated using volumes of interest (VOI) defined by the known water volume of each sphere for the simulated and experimental lesions using:
| (2) |
is the mean activity for the CRC mean, or max activity for CRC max, in the ’th lesion. is the mean activity in the background. is the known ratio between lesion activity and background. A histogram of pixels intensity was generated for the largest simulated and measured spherical lesion (37-mm diameter) for each system.
The average percentage differences between simulated and measured CRC values were calculated using:
| (3) |
where and are simulated and measured CRCs for all spheres, respectively. is the number of lesions.
The images with lesions simulated by the GE SIGNA lesion insertion tool were filtered using an optimal post-reconstruction Gaussian kernel that leads to the best fit between the simulated and measured CRC curves defined by -minimization of Eq. (1). The same approach was followed as in the harmonization of the lesion insertion tools, but here optimization was performed between simulated and measured lesions from the SIGNA lesion insertion tool.
2.4.2. Evaluation of spatial uniformity of SUV measurements
Spatial activity uniformity of inserted lesions was assessed using a numerical uniform water cylinder and simulated lesions. Spatial lesion activity uniformity was evaluated in the transaxial and axial directions inside the scanner FOV. The attenuation map was simulated by a numerical water cylinder phantom of an attenuation value of . The simulated lesion’s size was 20 mm in diameter. The center of the water cylinder phantom corresponds to the scanner center of FOV (). For transaxial radial positions, the simulated spherical lesions were lying on the -horizontal transverse of the scanner FOV (), starting at 10 mm from the edge of the water cylinder diameter and increasingly incremented by 10 mm until the center of the water cylinder. For transaxial vertical positions, the same simulation procedures were carried as for the transaxial radial lesion. However, for this case, lesions were aligned on the -vertical axis of the scanner FOV (). For axial positions, simulated lesions were laying on the -horizontal axial axis of the water cylinder (), starting from the axial front edge of the height of the water cylinder and incrementing 20 mm between each lesion until the water cylinder center. The lesions mean relative activity throughout the FOV was calculated using CRC as per Eq. (2).
2.5. Patient Imaging
Lesions were inserted in the brain and pelvis patient PET images. Brain PET images were selected from a PET/MRI (mMR) 18F-Florbetapir Alzheimer disease research study. Pelvis PET images were a part of research oncology FDG PET/MRI dataset. Both datasets had a paired CT available. In addition to data analysis, lesion insertion methodology in the brain and pelvis images is described in the following sections.
2.5.1. Brain images
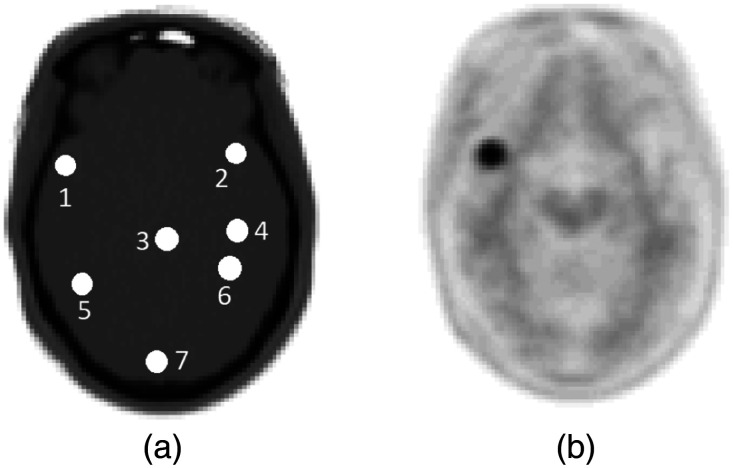
Using the mMR lesion insertion tool, 8-mm diameter spherical lesions were individually inserted at different positions in the brain images [Fig. 2(a)]. Images with inserted lesions were reconstructed [Fig. 2(b)] using three different MRAC approaches: the first one is the two-point DIXON,16,37 where the attenuation maps are segmented into two tissue density classes, water, and fat. The second one includes the bone atlas model to the two-point DIXON image, resulting in three tissue density classes, water, fat, and bone.19 The third one uses the ultrashort echo time (UTE) sequence, which contains three classes, fat, water, and an estimates of the bone structure from the ultra-short echo MR data.15 Additionally, the same brain images without any inserted lesions were reconstructed following the same procedure for images reconstructed with inserted lesions. Two types of simulation scenarios were considered to study the effect of bone and background activity on lesion uptake for a given MRAC approach. In the first scenario, lesions were inserted and reconstructed with patient brain background activity. In the second scenario, lesions were inserted and reconstructed without patient brain background activity (patient sinogram voxels were equal to zeros).
Fig. 2.
Illustration of 8-mm lesion inserted at seven different positions on the brain CT image (a). Same positions were kept for all PET-based MRAC and CTAC reconstructions. b) An example of an inserted lesion in the frontal cortex near cranial bones.
MRAC to CTAC SUV bias was calculated in inserted lesions reconstructed with and without background activity and in the reconstructed brain images without inserted lesion.
MRAC to CTAC to SUV bias was calculated following:
| (4) |
2.5.2. Pelvis images
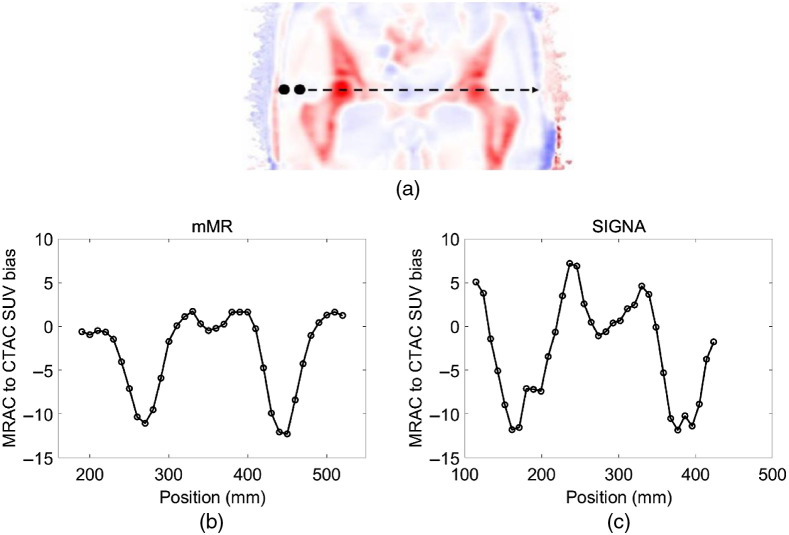
PET/MRI and CT pelvis images were available for both mMR and SIGNA scanners. CT images were elastically registered to the MRAC and scaled to 511-keV photon AC. The CT images of the patient were registered to MR with deformable registration using the Elastix software with three levels of multiresolution along with the B-spline interpolation, B-spline transform, advanced mutual information metric, and the adaptive stochastic gradient descent optimizer. CT HU to PET attenuation scaling was done according to35 with cut-off bone soft tissue at 300 HU. Patient MRAC was obtained from the two-point DIXON sequence to segment the MRI images into four tissue classes, which are air, fat, water, and lung. Then uniform LAC was specified for each of the segmented tissue classes.16 Finally, a 20-mm diameter spherical lesion was inserted, and its position swept across the transaxial radial positions on the patient pelvis images Fig. 6. SUV bias between lesions in the PET reconstructed MRAC and PET CTAC reconstructed patient images in the pelvis were evaluated.
Fig. 6.
(a) Bias between PET reconstructed MRAC to CTAC from the mMR scanner using two-point DIXONNo-skull-model. MRAC to CTAC SUV bias calculated in a 20-mm lesion inserted cross the patient pelvis image for the (b) mMR and (c) SIGNA.
3. Results
3.1. Harmonization of the Lesion Insertion Tools
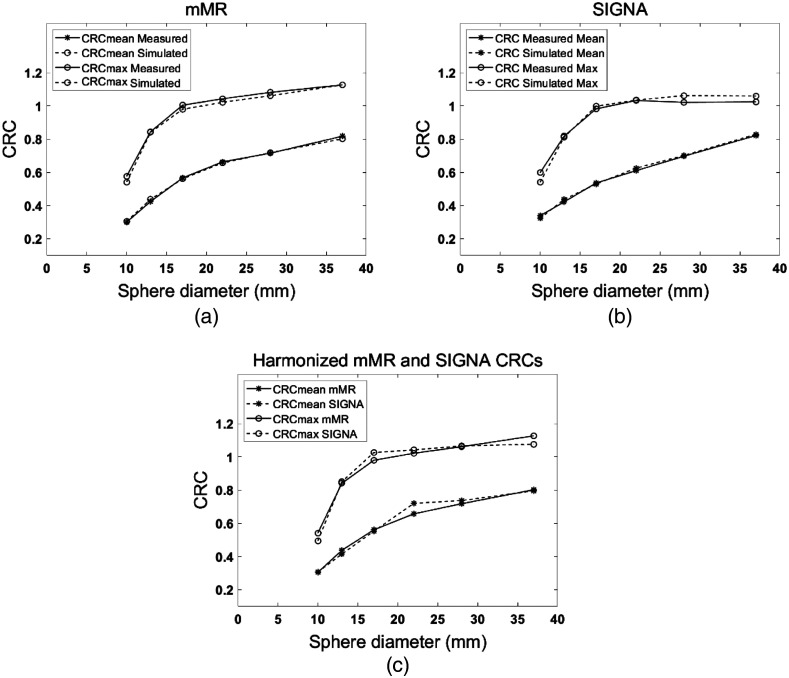
Figure 3(c) compares the and for the various sphere sizes simulated with the mMR (this work) and SIGNA lesion insertion tools. An average of 1.6% curves and 1.8% curves differences between simulated lesions obtained with the two lesion insertion tools was achieved. -minimization is achieved with a 1.64-mm FWHM Gaussian smoothing kernel applied to images reconstructed following lesion insertion with the SIGNA lesion insertion tool. For the and and the least-square values were and , respectively.
Fig. 3.
Comparison between simulated and measured CRC curves for both CRC mean and max in the NEMA IEC six lesions obtained with both lesion insertion tools. (a) Results are applied for the mMR and (b) SIGNA PET/MRI scanners. On the right, harmonized sphere size-dependent CRC values calculated in simulated lesions with both lesion insertions tools.
3.2. Phantom Imaging
3.2.1. Validation using the NEMA IEC phantom
About average of difference between simulations and measurements was achieved for both lesion insertion tools compared to the NEMA IEC phantom [Figs. 3(a) and 3(b)]. An average percentage difference of 1.5% and 2% between simulated and measured curves for the mMR and SIGNA scanners were observed, respectively. The Gaussian smoothing kernel that provided the best fit between the simulated and measured CRC for the SIGNA lesion insertion tool was 2.59-mm FWHM.
The accuracy of the agreement was estimated by -minimization between the measured and simulated curves. For mMR lesion insertion tool, the values for and are and , respectively. For the SIGNA lesion insertion tool, values for and CRCmax are and , respectively.
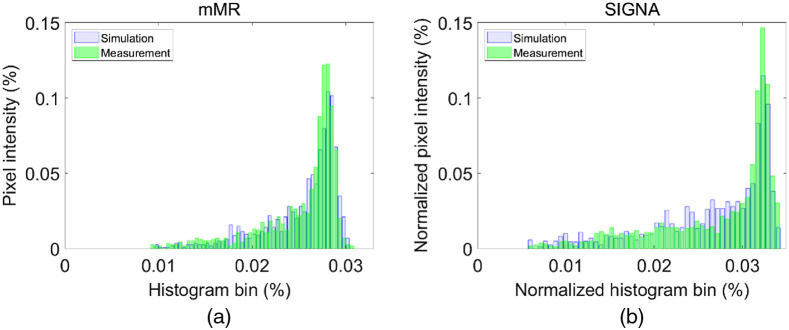
Both simulated and measured intensity histograms show similar distributions for inserted lesions Fig. 4. The histograms were fitted with a Gaussian function, and FWHM of the distributions were compared. For the mMR lesion insertion tool simulated and measured pixel intensity histograms, the Gaussian fit showed an FWHM = 0.059 and FWHM = 0.068, respectively. For the SIGNA lesion insertion tool, simulated and measured pixel histogram intensity, the Gaussian fit showed an FWHM = 0.054 and FWHM = 0.071, respectively. In these plots, the tails toward lower values correspond to the sphere edge pixels with lower statistics. Both lesion insertion tools showed similar tail distributions [Fig. 3(c)] with an excellent similarity between simulated and experimental sphere distributions.
Fig. 4.
Normalized pixels intensity histogram for the largest NEMA sphere, 37 mm. (a) For the mMR simulated and measured lesions and (b) the SIGNA simulated and measured lesions.
3.2.2. Evaluation of spatial uniformity
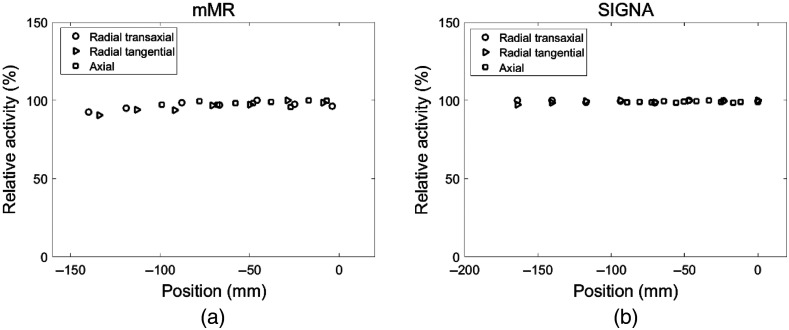
Spatial uniformity in the , and directions demonstrated excellent consistency in lesions activity through the scanner FOV is achieved for both lesion insertion tools (appendix). For the mMR scanner, the average relative activity bias, calculated as mean [100—(R_activity)] where R_activity is the lesion relative mean activity throughout the scanner FOV (Fig. 7 in appendix), is respectively 3.3%, 4.1%, and 1.6% at the , and sampled positions. For the SIGNA lesion insertion tool, the average relative bias is 0.5%, 0.8%, and 0.9%, respectively. The linearity of the lesion insertion tools in response to various simulated lesion activity was verified by a 37-mm sphere placed at the center of the FOV. The correlation coefficient between the initially specified and the reconstructed lesion activities was (Fig. 8 in appendix).
Fig. 7.
Lesion relative activity through the radial transaxial, radial tangential, and axial directions for the (a) mMR and (b) SIGNA.
3.3. Patient Imaging
3.3.1. Brain images
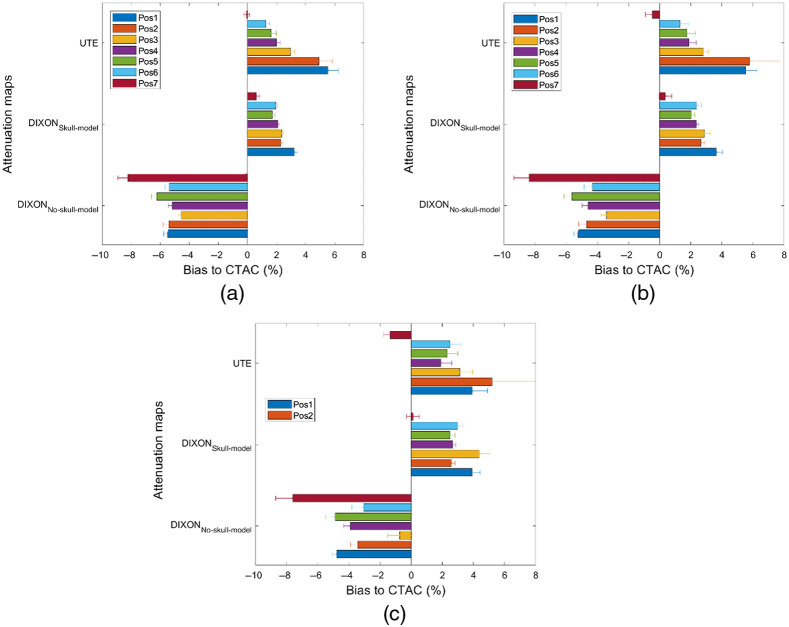
Figure 5 shows MRAC to CTAC SUV bias in lesions inserted in brain images with and without background activity. Furthermore, MRAC to CTAC SUV bias in VOIs corresponding to the same shape and positions of the inserted lesions in the original reconstructed brain image (without inserted lesions) was calculated. For the two-point DIXON-based MRAC, as expected, a negative MRAC to CTAC bias was observed for all inserted lesions. For the DIXON attenuation maps, and in lesions relatively closer to the cranial bones, a higher negative bias reflecting an underestimation of SUV uptake was observed. For the UTE attenuation maps, MRAC to CTAC SUV bias in lesion situated at positions 1 and 2, which is located in the left and right frontal cortex and the vicinity of the cranial bones (Figs. 2 and 5), was higher than what has been obtained using the and attenuation maps. This SUV bias is attributed to the difference between cranial bone thickness in the UTE and CTAC attenuation maps. Error bars in Fig. 5 shows the standard deviation of the count intensity within the lesion or within the region defined by the lesion. We observed much larger standard deviation and potentially larger errors in AC accuracy when simply using the brain activity rather than using data from a higher count synthetic lesion. This observation is consistent throughout all the lesions simulated.
Fig. 5.
MRAC to CTAC SUV bias calculated in 8-mm lesion inserted at different positions in the brain images. (a) Lesions were inserted without activity background. (b) Lesions were inserted on background activity. (c) Same lesions VOIs were used to calculate CTAC to MRAC in the original brain images (without inserted lesions).
3.3.2. Pelvis images
In the patient pelvis images, SUV bias in inserted lesions obtained with PET reconstructed using MRAC (using the two-point MRI (mMR) or LAVA-FLEX (GE Signa) sequences) and CTAC is shown in Fig. 6. A negative bias is observed when using MRAC with respect to CTAC within the vicinity or within bones, with a similar magnitude between simulated lesions inserted with the GE Signa lesion insertion tool. This negative bias is expected from the higher bone density correctly identified by CTAC.
4. Discussion
We have developed and validated a synthetic lesion insertion tool for the Siemens mMR Biograph scanner for the purpose to aid in the evaluation of attenuation methodology in PET/MRI and to quantify errors associated with the MRI-derived AC maps propagating through PET image reconstruction that affect lesions SUV uptake quantification.38 We have further demonstrated that harmonization with the GE lesion insertion tool was possible and have applied the lesion insertion tools to two clinically relevant scenarios, in the brain and in the pelvis patient images.
Using the NEMA IEC phantom data, excellent agreement was achieved between simulated and measured CRC curves with an accuracy and we demonstrated harmonization to the GE Signa insertion tool with an average of 1.6% difference is CRC values for spherical lesions with diameter down to 10 mm. Simulated spherical lesions in cylindrical water phantom showed excellent uniformity in the mean activity at different positions in the scanner FOV. Lesion activity/SUV linearity was also verified and excellent correlation coefficient between initial and reconstructed lesion activity. The correlation coefficient between the initially specified and the reconstructed lesion activities was .
We demonstrated that a simple approach for harmonizing the two lesion insertion tools was to apply an optimized post-reconstruction Gaussian filter. The FWHM of the Gaussian filter that resulted in the agreement of CRC curves was obtained at a harmonization filter (1.64 mm in this study) applied on the lesion simulated with the SIGNA lesion insertion tool. The optimization of the post-reconstruction filter provided near identical CRC curves compared to what has been published by other groups.30 The lesion insertion tools also provided remarkable similarity between pixel histogram intensity distributions between simulated and measured lesions, thereby creating lesions with realistic noise structure. Our work thus demonstrate lesion insertion tools can simulate realistic synthetic lesions of various sizes with accurate CRC, and our harmonization approach further supports the comparison of these synthetic lesions across manufacturers.
The lesion insertion in patient data sets mirrored MRAC to CTAC SUV bias that was previously seen in the published literature in the brain and for the three MRAC approaches, DIXON, DIXON/skull model, and UTE,12,13,18,39 and in the pelvis using the two-point DIXON.16,17,28,39 These results provide evidence that the synthetic lesions can replicate true lesions in patient data sets. Quantitative measurements from inserted lesion enables to study more accurately the error dependency from the use different attenuation maps on lesion SUV uptake, anatomical localization relative to bone structures, the quality of such attenuation maps as well as the accuracy of the registration of CT-based attenuation maps to MRI. As demonstrated by our study in the brain, the error measurement associated with the choice of AC methodologies is more accurately determined from high statistic inserted lesions, rather than using the underlying nominal brain activity. Our results also demonstrate lower bias relative to CTAC using the rather than the and UTE attenuation maps in the present patient brain images.
Lesion insertion tools, allows a fast analytical simulation of PET image acquisition, and enables the evaluation of AC strategies (MRAC or CTAC). Since the inserted lesions are set to a known initial SUV value, size, higher-counts, and accurate position inside the scanner FOV, the evaluation of PET/MRI AC approaches can thus be quantitatively and accurately evaluated.
Alternative methods to simulate lesions with known activity involve Monte Carlo (MC) simulations by inserting a lesion into patient images.40–42 Example of such software packages include GATE43 or SIMSET44 and PET-SORTEO.45,46 Simulating realistic PET scanner geometries and experiments with these packages requires lengthy computation and involves significant computing resources. These software are more suited for validation and analysis of novel PET scanner geometries and related developments.47 Another more general-purpose analytical PET simulator is ASIM, developed by,48 was proposed for general PET geometries and not specific to any particular scanner. We believe the application of a forward projector specific to a particular camera hardware allows for best match with experimental data.
The SIGNA lesion insertion tool was previously developed as general-purpose for GE PET scanners. Hence, deviations in CRCs values were observed for the GE lesion insertion tool from the experimental CRCs, especially for the smallest spheres () as reported in Ref. 30. Therefore, we have determined an optimal post-reconstruction Gaussian filter for the inserted lesion in the GE SIGNA to match the measured CRC values.
One of the limitations of this study is that MRAC was evaluated using spherical lesions inserted of uniform activity and various sizes. However, the methodology is easily expandable to the insertion of non-spherical, arbitrary shapes and heterogeneous lesions of irregular shapes or even segmented physical lesions from actual patient data. Evaluation of AC methodology and lesion morphology was not investigated in this work since we use spherical lesions, however, we have demonstrated even when small lesion overlaps, even partially, with the bone structures, SUV bias is much higher and thus SUV bias is very sensitive to the exact lesion location. Future work by our group will include evaluation with lesion insertion of various morphologies to evaluate the heterogeneous effect of AC within the lesion as well as using structural regional VOI as defined from brain segmentation.
Beyond the intended use of AC in PET/MRI, these tools allow for generation of a lesion of known ground truth and therefore allows one to study the impact of a subtle difference in image reconstruction, including the effects of choice of reconstruction parameters and possibly consequences from the scatter correction accuracy. Similar work has been published where MC simulations were used for generating deep learning training data for SPECT/CT scatter correction. Synthetic lesion insertion could also be useful to study scatter correction approaches.49 The application of the lesion insertion tool may not be limited to AC evaluation in PET/MRI. Its application could be extended to study lesion detectability, image segmentation, and image registration approaches.50 Evaluation of the effect of TOF, resolution modeling, statistical Poisson noise, and scan duration on the PET reconstructed images can be also performed.51 Assessment of PET/MRI measurement reproducibility in the case of inconsistencies between test-retest PET/MRI measurement for patients with cancer could be done using the lesion insertion tool.52
Synthetic imaging is also a promising solution for the evaluation of deep learning algorithms in clinical applications. For instance, the lesion insertion tool allows to insert a diversity of pathological shapes and intensities in the patients’ images for training and testing a deep learning-based PET/MRI AC or other machine learning applications such as lesion segmentation. This can be done using realistic lesions provided by segmented lesion images in the same or different patient anatomical regions.
The procedure of lesion insertion methodology and its harmonization developed in this paper can be extended to other scanners models or manufacturers as they become available Our group is working to make the mMR and SIGNA lesion insertion tools available through an online interface for general users.
5. Conclusion
AC accuracy in simultaneous PET/MRI is a crucial step for validation of this novel imaging modality. Several PET/MRI AC approaches already exist, and others are in development, and there is a crucial need to evaluate their accuracy efficiently and rigorously. A lesion insertion tool was developed and employed to compare MRAC approaches available in the commercial scanners using phantom data and patient images in the brain and pelvis. We have also demonstrated harmonization of the developed lesion insertion tools with the GE Signa lesion insertion tool, with simulated and measured lesion CRC curves and have demonstrated excellent agreement for both tools. These tools were further applied in clinically relevant imaging and demonstrated that AC bias on SUV values can be evaluated using lesion insertion tool, which in turn, can be used toward PET/MRI scanner validation for clinical application of in qualification in clinical trial.
6. Appendix
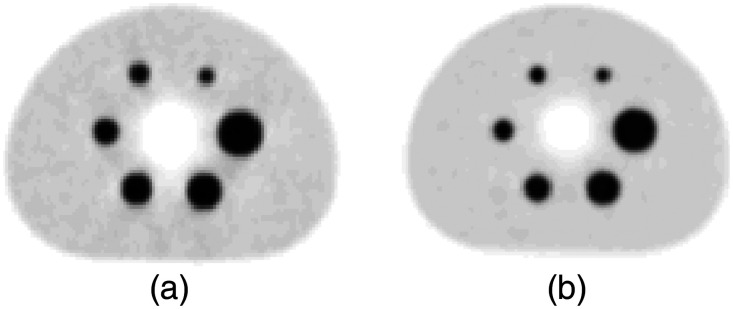
The uniformity of the inserted lesion activity through the transaxial and axial directions through the scanner FOV was verified for the SIGNA and mMR lesion insertion tools. Figure 7 depicts lesion activity uniformity inside the scanner FOV. Furthermore, lesion activity linearity was verified for the mMR lesion insertion tool and presented in Fig. 8. Figure 9 shows NEMA IEC reconstructed inserted lesions for the SIGNA and mMR lesion insertion tools.
Fig. 9.
Harmonized inserted NEMA lesions using (a) GE SIGNA and (b) Siemens mMR lesion insertion tools.
Acknowledgments
This study was supported by the National Institutes of Health (NIH), National Cancer Institute (NCI) Grant No. R01CA212148. TAH is supported by NCI Grant No. R01CA235741 and NIH Grant No. R01CA229354.
Biography
Biographies of the authors are not available.
Disclosures
Nothing to disclose.
Contributor Information
Mahdjoub Hamdi, Email: hamdi.m@wustl.edu.
Yutaka Natsuaki, Email: yutaka.natsuaki@gmail.com.
Kristen A. Wangerin, Email: kristenaw@gmail.com.
Hongyu An, Email: hongyuan@wustl.edu.
Sarah St. James, Email: sara.st.james@ucsf.edu.
Paul E. Kinahan, Email: kinahan@uw.edu.
John J. Sunderland, Email: john-sunderland@uiowa.edu.
Peder E. Z. Larson, Email: peder.larson@ucsf.edu.
Thomas A. Hope, Email: thomas.hope@ucsf.edu.
Richard Laforest, Email: rlaforest@wustl.edu.
References
- 1.Johnson P., et al. , “Adapted treatment guided by interim PET-CT scan in advanced Hodgkin’s lymphoma,” N. Engl. J. Med. 374, 2419–2429 (2016). 10.1056/NEJMoa1510093 [DOI] [PMC free article] [PubMed] [Google Scholar]
- 2.Cho H., et al. , “Tau PET in Alzheimer disease and mild cognitive impairment,” Neurology 87(4), 375–383 (2016). 10.1212/WNL.0000000000002892 [DOI] [PubMed] [Google Scholar]
- 3.Kinahan P. E., Fletcher J. W., “Positron emission tomography-computed tomography standardized uptake values in clinical practice and assessing response to therapy,” Semin. Ultrasound, CT MRI 31(6), 496–505 (2010). 10.1053/j.sult.2010.10.001 [DOI] [PMC free article] [PubMed] [Google Scholar]
- 4.Kinahan P. E., Hasegawa B. H., Beyer T., “X-ray-based attenuation correction for positron emission tomography/computed tomography scanners,” Semin. Nucl. Med. 33(3), 166–179 (2003). 10.1053/snuc.2003.127307 [DOI] [PubMed] [Google Scholar]
- 5.Hope T. A., et al. , “Summary of the first ISMRM-SNMMI workshop on PET/MRI: applications and limitations,” J. Nucl. Med. 60(10), 1340–1346 (2019). 10.2967/jnumed.119.227231 [DOI] [PMC free article] [PubMed] [Google Scholar]
- 6.Bezrukov I., et al. , “MR-based PET attenuation correction for PET/MR imaging,” Semin. Nucl. Med. 43(1), 45–59 (2013). 10.1053/j.semnuclmed.2012.08.002 [DOI] [PubMed] [Google Scholar]
- 7.Samarin A., et al. , “PET/MR imaging of bone lesions - Implications for PET quantification from imperfect attenuation correction,” Eur. J. Nucl. Med. Mol. Imaging 39(7), 1154–1160 (2012). 10.1007/s00259-012-2113-0 [DOI] [PubMed] [Google Scholar]
- 8.Yang J., et al. , “Evaluation of sinus/edge-corrected zero-echo-time–Based attenuation correction in brain PET/MRI,” J. Nucl. Med. 58(11), 1873–1879 (2017). 10.2967/jnumed.116.188268 [DOI] [PMC free article] [PubMed] [Google Scholar]
- 9.Andersen F. L., et al. , “Combined PET/MR imaging in neurology: MR-based attenuation correction implies a strong spatial bias when ignoring bone,” Neuroimage 84, 206–216 (2014). 10.1016/j.neuroimage.2013.08.042 [DOI] [PubMed] [Google Scholar]
- 10.Antoch G., Bockisch A., “Combined PET/MRI: a new dimension in whole-body oncology imaging?” Eur. J. Nucl. Med. Mol. Imaging 36(1), 113–120 (2009). 10.1007/s00259-008-0951-6 [DOI] [PubMed] [Google Scholar]
- 11.Chen Y., An H., “Attenuation correction of PET/MR imaging,” Magn. Reson. Imaging Clin. N. Am. 25(2), 245–255 (2017). 10.1016/j.mric.2016.12.001 [DOI] [PMC free article] [PubMed] [Google Scholar]
- 12.Catana C., et al. , “Toward implementing an MRI-based PET attenuation-correction method for neurologic studies on the MR-PET brain prototype,” J. Nucl. Med. 51(9), 1431–1438 (2010). 10.2967/jnumed.109.069112 [DOI] [PMC free article] [PubMed] [Google Scholar]
- 13.Berker Y., et al. , “MRI-based attenuation correction for hybrid PET/MRI Systems: a 4-class tissue segmentation technique using a combined ultrashort-echo-time/Dixon MRI sequence,” J. Nucl. Med. 53(5), 796–804 (2012). 10.2967/jnumed.111.092577 [DOI] [PubMed] [Google Scholar]
- 14.Cabello J., et al. , “MR-based attenuation correction using ultrashort-echo-time pulse sequences in dementia patients,” J. Nucl. Med. 56(3), 423–429 (2015). 10.2967/jnumed.114.146308 [DOI] [PubMed] [Google Scholar]
- 15.Keereman V., et al. , “MRI-based attenuation correction for PET/MRI using ultrashort echo time sequences.,” J. Nucl. Med. 51(5), 812–818 (2010). 10.2967/jnumed.109.065425 [DOI] [PubMed] [Google Scholar]
- 16.Martinez-Möller A., et al. , “Tissue classification as a potential approach for attenuation correction in whole-body PET/MRI: evaluation with PET/CT data,” J. Nucl. Med. 50(4), 520–526 (2009). 10.2967/jnumed.108.054726 [DOI] [PubMed] [Google Scholar]
- 17.Paulus D. H., et al. , “Whole-body PET/MR imaging: quantitative evaluation of a novel model-based MR attenuation correction method including bone,” J. Nucl. Med. 56(7), 1061–1066 (2015). 10.2967/jnumed.115.156000 [DOI] [PMC free article] [PubMed] [Google Scholar]
- 18.Ladefoged C. N., et al. , “A multi-centre evaluation of eleven clinically feasible brain PET/MRI attenuation correction techniques using a large cohort of patients,” Neuroimage 147, 346–359 (2017). 10.1016/j.neuroimage.2016.12.010 [DOI] [PMC free article] [PubMed] [Google Scholar]
- 19.Koesters T., et al. , “Dixon sequence with superimposed model-based bone compartment provides highly accurate PET/MR attenuation correction of the brain.,” J. Nucl. Med. 57(6), 918–924 (2016). 10.2967/jnumed.115.166967 [DOI] [PMC free article] [PubMed] [Google Scholar]
- 20.Hofmann M., et al. , “MRI-based attenuation correction for PET/MRI: a novel approach combining pattern recognition and atlas registration,” J. Nucl. Med. 49(11), 1875–1883 (2008). 10.2967/jnumed.107.049353 [DOI] [PubMed] [Google Scholar]
- 21.Liu F., et al. , “Deep learning MR imaging-based attenuation correction for PET/MR imaging,” Radiology 286(2), 676–684 (2018). 10.1148/radiol.2017170700 [DOI] [PMC free article] [PubMed] [Google Scholar]
- 22.Leynes A. P., et al. , “Direct pseudoCT generation for pelvis PET/MRI attenuation correction using deep convolutional neural networks with multi-parametric MRI: zero echo-time and dixon deep pseudoCT (ZeDD-CT),” J. Nucl. Med. 59, 852–858 (2017). 10.2967/jnumed.117.198051 [DOI] [PMC free article] [PubMed] [Google Scholar]
- 23.Gong K., et al. , “Attenuation correction for brain PET imaging using deep neural network based on Dixon and ZTE MR images.,” Phys. Med. Biol. 63(12), 125011 (2018). 10.1088/1361-6560/aac763 [DOI] [PMC free article] [PubMed] [Google Scholar]
- 24.Ladefoged C. N., et al. , “Deep learning based attenuation correction of PET/MRI in pediatric brain tumor patients: evaluation in a clinical setting,” Front. Neurosci. 12(Jan.), 1005 (2019). 10.3389/fnins.2018.01005 [DOI] [PMC free article] [PubMed] [Google Scholar]
- 25.Drzezga A., et al. , “First clinical experience with integrated whole-body PET/MR: comparison to PET/CT in patients with oncologic diagnoses,” J. Nucl. Med. 53(6), 845–855 (2012). 10.2967/jnumed.111.098608 [DOI] [PubMed] [Google Scholar]
- 26.Simonyan K., Zisserman A., “Very deep convolutional networks for large-scale image recognition,” in 3rd Int. Conf. Learn. Represent., ICLR 2015—Conf. Track Proc. (2015). [Google Scholar]
- 27.Torrado-Carvajal A., et al. , “Dixon-vibe deep learning (divide) pseudo-CT synthesis for pelvis PET/MR attenuation correction,” J. Nucl. Med. 60(3), 429–435 (2019). 10.2967/jnumed.118.209288 [DOI] [PMC free article] [PubMed] [Google Scholar]
- 28.Leynes A. P., et al. , “Zero-echo-time and dixon deep pseudo-CT (ZeDD CT): direct generation of pseudo-CT images for pelvic PET/MRI attenuation correction using deep convolutional neural networks with multiparametric MRI,” J. Nucl. Med. 59(5), 852–858 (2018). 10.2967/jnumed.117.198051 [DOI] [PMC free article] [PubMed] [Google Scholar]
- 29.Delso G., et al. , “Performance measurements of the siemens mMR integrated whole-body PET/MR scanner,” J. Nucl. Med. 52(12), 1914– (1922). 10.2967/jnumed.111.092726 [DOI] [PubMed] [Google Scholar]
- 30.Gabrani-Juma H., et al. , “Development and validation of the Lesion Synthesis Toolbox and the Perception Study Tool for quantifying observer limits of detection of lesions in positron emission tomography,” J. Med. Imaging 7(2), 022412 (2020). 10.1117/1.JMI.7.2.022412 [DOI] [PMC free article] [PubMed] [Google Scholar]
- 31.Wangerin K. A., et al. , “Evaluation of lesion detectability in positron emission tomography when using a convergent penalized likelihood image reconstruction method,” J. Med. Imaging 4, 011002 (2016). 10.1117/1.JMI.4.1.011002 [DOI] [PMC free article] [PubMed] [Google Scholar]
- 32.Grant A. M., et al. , “NEMA NU 2-2012 performance studies for the SiPM-based ToF-PET component of the GE SIGNA PET/MR system,” Med. Phys. 43(5), 2334–2343 (2016). 10.1118/1.4945416 [DOI] [PubMed] [Google Scholar]
- 33.Klein S., et al. , “elastix: a toolbox for intensity-based medical image registration,” IEEE Trans. Med. Imaging 29(1), 196–205 (2010). 10.1109/TMI.2009.2035616 [DOI] [PubMed] [Google Scholar]
- 34.Shamonin D. P., et al. , “Fast parallel image registration on CPU and GPU for diagnostic classification of Alzheimer’s disease,” Front. Neuroinf. 7, 50 (2014). 10.3389/fninf.2013.00050 [DOI] [PMC free article] [PubMed] [Google Scholar]
- 35.Burger C., et al. , “PET attenuation coefficients from CT images: experimental evaluation of the transformation of CT into PET 511-keV attenuation coefficients,” Eur. J. Nucl. Med. 29, 922–927 (2002). 10.1007/s00259-002-0796-3 [DOI] [PubMed] [Google Scholar]
- 36.National Electrical Manufacturers Association, “Performance measurements of positron emission tomographs,” NEMA Stand. Publ. NU 2-2001 (2001).
- 37.Coombs B. D., Szumowski J., Coshow W., “Two-point Dixon technique for water-fat signal decomposition with B0 inhomogeneity correction,” Magn. Reson. Med. 38, 884–889 (1997). 10.1002/mrm.1910380606 [DOI] [PubMed] [Google Scholar]
- 38.Keller S. H., et al. , “Image artifacts from MR-based attenuation correction in clinical, whole-body PET/MRI,” Magn. Reson. Mater. Phys. Biol. Med. 26(1), 173–181 (2013). 10.1007/s10334-012-0345-4 [DOI] [PubMed] [Google Scholar]
- 39.Hofmann M., et al. , “MRI-based attenuation correction for whole-body PET/MRI: quantitative evaluation of segmentation- and atlas-based methods,” J. Nucl. Med. 52(9), 1392–1399 (2011). 10.2967/jnumed.110.078949 [DOI] [PubMed] [Google Scholar]
- 40.Konik A. B., “Evaluation of attenuation and scatter correction requirements in small animal PET and SPECT imaging,” Ph.D. Thesis, Univ. of Iowa (2010).
- 41.De Beenhouwer J., et al. , “Cluster computing software for GATE simulations,” Med. Phys. 34(6), 1926–1933 (2007). 10.1118/1.2731993 [DOI] [PubMed] [Google Scholar]
- 42.Bert J., Lemaréchal Y., Visvikis D., “New hybrid voxelized/analytical primitive in Monte Carlo simulations for medical applications,” Phys. Med. Biol. 61, 3347–3364 (2016). 10.1088/0031-9155/61/9/3347 [DOI] [PubMed] [Google Scholar]
- 43.Strul D., et al. , “GATE (Geant4 application for tomographic emission): a PET/SPECT general-purpose simulation platform,” Nucl. Phys. B - Proc. Suppl. 125, 75–79 (2003). 10.1016/S0920-5632(03)90969-8 [DOI] [Google Scholar]
- 44.Lewellen T. K., Harrison R. L., Vannoy S., “The SimSET program,” in Monte Carlo Calculations in Nuclear Medicine: Applications in Diagnostic Imaging, Ljungberg M., Strand S. E., King M. A., Eds., pp. 77–92, Institute of Physics Publishing, Bristol: (1998). [Google Scholar]
- 45.Reilhac A., et al. , “PET-SORTEO: validation and development of database of simulated PET volumes,” IEEE Trans. Nucl. Sci. 52, 1321–1328 (2005). 10.1109/TNS.2005.858242 [DOI] [Google Scholar]
- 46.Reilhac A., et al. , “PET-SORTEO: a Monte Carlo-based simulator with high count rate capabilities,” IEEE Trans. Nucl. Sci. 51, 46–52 (2004). 10.1109/TNS.2003.823011 [DOI] [Google Scholar]
- 47.Dadgar M., Kowalski P., “Gate simulation study of the 24-module J-PET scanner: data analysis and image reconstruction,” Acta Phys. Polonica B 51(1), 309–315 (2020). 10.5506/APhysPolB.51.309 [DOI] [Google Scholar]
- 48.Comtat C., et al. , “Simulating whole-body PET scanning with rapid analytical methods,” IEEE Nuclear Sci. Symp. 3, 1260–1264 (1999). [Google Scholar]
- 49.Arabi H., et al. , “Deep learning-guided joint attenuation and scatter correction in multitracer neuroimaging studies,” Hum. Brain Mapp. 41(13), 3667–3679 (2020). 10.1002/hbm.25039 [DOI] [PMC free article] [PubMed] [Google Scholar]
- 50.Berthon B., et al. , “PETSTEP: generation of synthetic PET lesions for fast evaluation of segmentation methods,” Phys. Med. 31, 969–980 (2015). 10.1016/j.ejmp.2015.07.139 [DOI] [PMC free article] [PubMed] [Google Scholar]
- 51.Pfaehler E., et al. , “SMART (SiMulAtion and ReconsTruction) PET: an efficient PET simulation-reconstruction tool,” EJNMMI Phys. 5(1), 16 (2018). 10.1186/s40658-018-0215-x [DOI] [PMC free article] [PubMed] [Google Scholar]
- 52.Kuttner S., et al. , “Quantitative PET/MR imaging of lung cancer in the presence of artifacts in the MR-based attenuation correction maps,” Acta Radiol. 61(1), 11–20 (2020). 10.1177/0284185119848118 [DOI] [PubMed] [Google Scholar]


