

Summary
Significant evidence suggests an inverse relationship between socioeconomic status and tobacco smoking, where inequality is visible among different social and economic strata. The aim of this study was to investigate the prevalence and economic and social inequalities in tobacco smoking in women aged 15-54 in Iran. This study is a cross-sectional study. Sampling in this study was a randomized clustered multistage sampling with equal clusters. A total of 35,305 women aged 15-55 enrolled in the study. Data analysis was in two stages. In the first stage, the social and economic inequalities were investigated using the concentration index and concentration curve method, and in the second method, and multilevel method was used to identify the determinants. The prevalence of tobacco smoking in women was 12.24%. The concentration index for smoking was CI = -0.07 [95% CI (-0.09, -0.05)], which represents smoking in people with low socioeconomic status. The results of the multilevel analysis indicated that the marital status of people over the age of 35 and the economic class was related to smoking in women. Inequality in tobacco smoking in women is to the interest of the well-off group, and this inequality varies in different provinces. Marital status, place of residence, age and socioeconomic status of women are factors influencing the prevalence of tobacco smoking in women, and these issues should be noticed to reduce inequalities.
Keywords: Inequality, Tobacco smoking, Socioeconomic status, Women, Iran
Introduction
Today smoking is one of the challenges of global health, is one of the most significant causes of premature death and disability worldwide, and is one of the risk factors for non-communicable diseases such as cardiovascular disease, cancer, chronic respiratory diseases, and digestive tract [1, 2]. Tobacco smoking causes more than six million deaths every year worldwide [3]. The death rate from tobacco smoking is expected to exceed eight million by 2030, with 80% of these deaths occurring in low-income and middle-income countries [4].
The prevalence of tobacco smoking in different parts of the world varies from 14.2 to 39% [5]. The prevalence of tobacco smoking in the West and Southeast Asia is 23%, East Africa is 18%, South America is 15%, West Africa is 14%; with the lowest and the largest being Southeast Asia, with 12% and the Central European region, with 29% [6].
Statistics show that around 250 million women in the world use tobacco, of which 22% are in the developed countries and 9% in developing countries [7]. The prevalence of smoking in women in Kenya is 3.1%, China is 4.2%, Japan is 7.9%, Ukraine is 10.2%, Bangladesh is 13.3%, Venezuela is 14.4%, Turkey is 18.2%, Germany is 20.3%, Ireland is 21%, Denmark is 22.2%, Croatia is 27.1%, and Australia is 23.8% [8]. Studies have shown that women who use tobacco are at higher risk of various types of cancers, chronic obstructive pulmonary diseases, and the birth of neonates with a genetic defect [9].
Studies have shown that people with a lower socioeconomic status and lower levels of education are more likely to smoke [10-12], so that the prevalence of smoking in high socioeconomic groups is declining and this decline has led to inequality in the prevalence of tobacco smoking in various social economic classes [13]. There has been significant evidence of a reciprocal relationship between the economic situation and tobacco smoking, also international studies have shown that social and economic inequalities in tobacco smoking is stronger for women compared to men [14].
The causes of smoking and inequality are a complex and multifactorial phenomenon. Understanding how these inequalities arise and knowing these factors can provide valuable information for developing effective strategies [15]. Reducing social inequalities in tobacco smoking is a significant strategy to reduce inequality in life expectancy in the future [16, 17], as tackling regional and socio-economic disparities in smoking is one of the major public health goals worldwide. The WHO recommends monitoring and evaluating socioeconomic inequalities in health behaviors, including tobacco use, as one of the social determinants of health [18].
Therefore, considering the importance of examining social inequalities in smoking and considering that there are no studies on tobacco inequality in women, this study aims to investigate the prevalence and socioeconomic inequalities in smoking among women aged 15-54, conducted based on Iran’s Multiple Indicator Demographic and Health Survey (IRMIDHS).
Methods
DATA COLLECTION AND SAMPLING
This is a cross-sectional study conducted to determine socio-economic inequalities in tobacco smoking among women aged 15-55 based on IrMIDHS . The study population was all households that participated in the IrMIDHS study in 2010. Given that the size of the population varies in different provinces [19], the sample share for each province was initially determined. Hence, the sample ratio was different in each province. Sampling was performed according to population size in each province. Samples were weighted to reflect the rural and urban population in each region. Each region was selected randomly from clusters based on the sample size allocated to rural and urban households in each region. Each cluster included 10 households. For each province, at least 40 clusters were selected. As a result, a possible sample of about 31,000 families (3,096 clusters including 2,187 urban clusters and 909 rural clusters) was selected for the IrMIDHS sample. The sampling method was a multi-stage random cluster sampling [20]. Rural and urban areas were considered as two different classes. Random sampling of the clusters was conducted at the regional level to allow proper distribution of clusters in the country. A total of 35,305 women aged 15-55 were enrolled in the study.
THE DEPENDENT VARIABLE
The dependent variable for this study was tobacco smoking in women aged 15-54, which was investigated by posing the question “Which of the tobacco products are you currently consuming? (Cigarette, cigar, pip, chickpeas, hookah)”. In the present study, second-hand smoking was not considered for women and direct smoking by women at the frame time of the study was considered as an outcome variable.
DATA ANALYSIS
The data analysis consisted of two steps, performed with the Stata-14 software. The first stage was the study of social and economic inequalities using concentration index and concentration curve methods and the second stage was the study of the relationship between social and economic inequalities in smoking, with demographic variables of the subjects using Multilevel method.
CONCENTRATION INDEX FOR SOCIOECONOMIC INEQUALITY AND HOW TO CALCULATE THE ECONOMIC AND SOCIAL STATUS
In this study, the concentration index and concentration curves were used to measure inequality. The concentration index values range from +1 to -1. The negative values indicate that the health variable is concentrated between individuals with inappropriate social and economic status and the concentration curve is above the equality line. But positive values indicate that the health variable is concentrated among the rich, and when the distribution of health is the same among all individuals, the concentration index will be zero. The socioeconomic situation has a wide dimension such that there is no precise method for its measurement. Therefore, other proxies are used as alternatives [21, 22]. In this study, by using principal component analysis (PCA), first, the variables having the greatest effect on the variance of the total variables were identified and then a new variable (SES) was constructed based on these variables [23, 24]. In the present study, by using the principal component analysis method, the asset index was created. Asset index was based on the area of the building, the number of bedrooms, the materials used in the residential unit, household items such as refrigerators, televisions, landlines, mobile phones, washing machines, dishwashers, microwaves, vacuum cleaners, computers or laptops, Internet access, having cars, wristwatches, having private property, farmland, garden and greenhouse and agricultural machinery. Weights were considered for each asset to maximize the variance of the new variable. Using the mean of this variable, 5 quintiles were created which divided the population into 5 groups of very poor, poor, moderate, rich and very rich. In this study, tobacco smoking was assumed to be related to the socioeconomic status of individuals.
MULTILEVEL ANALYSIS TO IDENTIFY DETERMINANTS
At first, the relationship between tobacco smoking and independent variables were investigated using logistic regression. After determining the existence of inequality with the help of the concentration index and the concentration curve earlier described, the level of inequality at different levels was investigated using Multilevel method. Multilevel analysis was done at three levels. The first level included individual variables (age groups, occupation, marital status, place of residence (city/village), and education), the second level included the county of residence, and the third level was the province.
Level 2 Model
Level 3 Model
 |
In the multilevel model, the mean estimation of each group and the effect of these variables on the higher levels that vary in each group were examined on the individual response variable. In a simple model, regardless of the average levels, the variance between the groups was ignored, but in Multilevel, the level of relationship between the variance of the dependent variable and the factors of the level and between the individual factors was determined. The advantage of using the Multilevel analysis is the ability to evaluate the effects of independent two-level variables on the outcome of one level and the value of variance that they can explain. The first model is limited to individual variables and the second model includes both variables, i.e. individual variables and second-level variables [25].
In the present study, Level 1 Model included independent variables such as age, marital status, education, occupation, social class (quantile), place of residence (city/village), Level 2 Model included province and Level 3 model included the province and county of residence.
Results
In this study, a total of 35,305 women aged 15-55 participated in this study, with a mean age of 31.48 ± 10.75. More than half of the study participants were married and housewives. The highest number of people was 15,792 (44.73%) of the first quintile, and 4,158 (12.22%) who smoked tobacco were specified in different sub-groups (Tab. I).
Tab. I.
Frequency of demographic variables and the prevalence of smoking in study of IrMIDHS, Iran.
| Variable | Frequency (percent) | The prevalence of smoking | |
|---|---|---|---|
| Location | City | 24,602 (69.7) | 3,119 (13.2) |
| Village | 10,703 (30.3) | 1,039(10) | |
| Age groups | < 20 | 4,968 (14.6) | 617 (12.4) |
| 20-34 | 17,158 (50.5) | 2,203 (12.8) | |
| ≥ 35 | 11,848 (34.9) | 1,338 (11.2) | |
| Occupation | Employed | 10,046 (35.6) | 1,246 (12.9) |
| Unemployed | 18,109 (64.4) | 2,110 (12.1) | |
| Education | Illiterate | 3,741(11) | 361 (6.9) |
| Elementary | 8,367 (24.6) | 937 (11.2) | |
| High school | 4,919 (14.4) | 661 (13.4) | |
| Diploma | 11,453 (33.9) | 1,507 (13.1) | |
| Academic | 5,494 (16.2) | 692 (12.6) | |
| Marital status | Single | 23,493 (69.2) | 2,927 (12.4) |
| Married | 10,481 (30.8) | 1,231 (11.7) | |
| Quantile economic | Poor | 15,792 (44.7) | 2,075 (13.7) |
| The poorest | 6,539 (18.5) | 755 (11.9) | |
| Average | 5,017 (14.4) | 539(11) | |
| Rich | 4,231 (11.9) | 423 (10.3) | |
| The richest | 3,726 (10.5) | 366 (10.3) | |
The results of logistic regression showed that a statistically significant relationship exist between tobacco smoking with outcome and location variables, age groups over 35, marital status and economic variables (p < 0.05), while no relationship exist between smoking and occupation and education (P > 0.05) (Tab. II).
Tab. II.
The relationship between the smoking and independent variables according to logistic regression model.
| Variable | OR (crude) | OR (adjust) | P-value | |
|---|---|---|---|---|
| Location | City | 1 | 1 | |
| Village | 0.73 (0.68-0.79) | 0.77 (0.7-0.86) | 0.04 | |
| Age groups | < 20 | 1 | 1 | |
| 20-34 | 1.03 (0.94-1.14) | 0.98 (0.87-1.1) | 0.6 | |
| ≥ 35 | 0.89 (0.81-0.99) | 0.8 (0.69-0.91) | 0.04 | |
| Occupation | Employed | 1 | 1 | |
| Unemployed | 0.93 (0.86-1) | 0.96 (0.89-1.04) | 0.7 | |
| Education | Illiterate | 1 | 1 | |
| Elementary | 1.18 (1.03-1.34) | 1.12 (1.04-1.46) | 0.046 | |
| High school | 1.45 (1.26-1.6) | 1.23 (1.04-1.46) | 0.048 | |
| Diploma | 1.419 (1.25-1.54) | 1.17 (1-1.38) | 0.5 | |
| Academic | 1.34 (1.17-1.54) | 1.07 (0.9-1.29) | 0.65 | |
| Marital status | Single | 1 | 1 | |
| Married | 0.93 (0.87-1) | 0.84 (0.77-0.92) | 0.038 | |
| Quantile economic | Poor | 1 | 1 | |
| The poorest | 0.85 (0.77-0.93) | 0.85 (0.76-0.94) | 0.001 | |
| Average | 0.78 (0.7-0.86) | 0.78 (0.69-0.88) | 0.001 | |
| Rich | 0.72 (0.65-0.81) | 0.75 (0.65-0.86) | 0.001 | |
| The richest | 0.71 (0.63-0.8) | 0.8 (0.68-0.94) | 0.001 | |
The concentration index for smoking was CI = -0.07 [95% CI (-0.09, -0.05)], which indicate the existence of inequality in smoking, and smoking in the lower socioeconomic group was higher. This inequality is also specified in the concentration curve, and the curve is above the equal line representing the tobacco smoking in people with low socioeconomic status (Fig. 1).
Fig. 1.
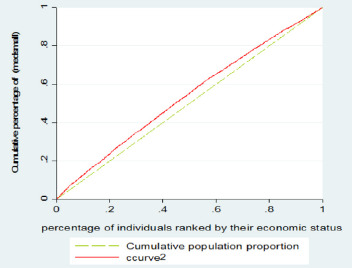
Concentration Index.
Table III shows the prevalence of smoking in women in different provinces, and the relationship between the prevalence of tobacco smoking and the socioeconomic quantiles and inequality in the prevalence of tobacco smoking in each province. The highest prevalence of smoking in women was related to the provinces of Boushehr (28.98%), Sistan and Balouchestan (24.42%), Kohkiluyeh and Boyerahmad (21.44%), Hormozgan (20.46%) and the lowest prevalence of Tobacco smoking in women was, respectively in the provinces of Ilam (1.39%), West Azarbaijan (2.52%), Ardabil (3.49%) and West Azarbaijan (3.71%). In the majority of the provinces of the country, except the provinces of Ardebil, Ilam, Chaharmahal Bakhtiari, North Khorasan, Semnan, Fars, Qom, Golestan, Lorestan, Markazi, Hamedan and Yazd, there was a statistically significant relationship between the social classes and the prevalence of tobacco use. The lower social classes are more likely to use tobacco (P < 0.05). In the study of the concentration index, the results of the study showed that the prevalence of smoking was higher in lower social economic classes in all provinces except Boushehr, Khorasan Razavi, Hormozgan, Golestan, Yazd and Sistan and Baluchestan provinces (Tab. IV, Fig. 2).
Tab. III.
Multilevel analysis, factors associated with socio-economic inequality in smoking (35,305 individuals of 337 county of 30 provinces).
| Variable | Model 1 with individual |
Model 2 with individual and county |
Model 3 with individual and province and county |
|||||||
|---|---|---|---|---|---|---|---|---|---|---|
| Coef | CI 95% | P-value | Coef | CI 95% | P-value | Coef | CI 95% | P-value | ||
| Location | City | 1 | 1 | 1 | ||||||
| Village | -0.25 | (-0.35,-0.16) | 0.0001 | -0.24 | 0.0001 | (-0.31, -0.09) | -0.2 | (-0.31, -0.09) | 0.0001 | |
| Age groups | < 20 | 1 | 1 | 1 | ||||||
| 20-34 | 0.11 | (-0.03, 0.26) | 0.12 | 0.03 | 0.7 | (-0.12, 0.18) | 0.03 | (-0.12, 0.18) | 0.7 | |
| ≥ 35 | 0.21 | (0.04,0.38) | 0.01 | 0.13 | 0.29 | (-0.08, 0.27) | 0.09 | (-0.08, 0.27) | 0.29 | |
| Occupation | Employed | 0.16 | (0.003, 0.32) | 0.04 | 0.04 | 0.62 | (-0.12, 0.21) | 0.04 | (-0.12, 0.21) | 0.62 |
| Unemployed | 0.07 | (-0.1, 0.25) | 0.4 | -0.03 | 0.73 | (-0.22, 0.15) | -0.03 | (-0.22, 0.15) | 0.73 | |
| Education | Illiterate | 1 | 1 | 1 | ||||||
| Elementary | -0.16 | (-0.25, -0.07) | 0.0001 | -0.15 | 0.0001 | (-0.27, -0.08) | -0.18 | (-0.27, -0.08) | 0.0001 | |
| High school | 1 | 1 | 1 | |||||||
| Diploma | -0.06 | (-0.13, 0.09) | 0.77 | -0.04 | 0.52 | (-0.17, 0.06) | -0.05 | (-0.17, 0.06) | 0.52 | |
| Academic | -0.22 | (-0.35, -0.08) | 0.001 | -0.27 | 0.0001 | (-0.44, -0.15) | -0.29 | (-0.44, -0.15) | 0.0001 | |
| Marital status | Single | 1 | 1 | 1 | ||||||
| Married | -0.03 | (-0.11, 0.04) | 0.37 | -0.04 | 0.18 | (-0.13, -0.02) | -0.05 | (-0.13, -0.02) | 0.18 | |
| Quantile economic | Poor | 1 | 1 | 1 | ||||||
| The poorest | -0.16 | (-0.26, -0.05) | 0.002 | -0.11 | 0.02 | (-0.22, -0.01) | -0.11 | (-0.22, -0.01) | 0.02 | |
| Average | -0.24 | (-0.36, -0.12) | 0.0001 | -0.19 | 0.007 | (-0.3, -0.04) | -0.17 | (-0.3, -0.04) | 0.007 | |
| Rich | -0.28 | (-0.42, -0.14) | 0.0001 | -0.3 | 0.006 | (-0.35, -0.06) | -0.20 | (-0.35, -0.06) | 0.006 | |
| The richest | -0.22 | (-0.37, -0.06) | 0.007 | -0.55 | 0.001 | (-0.47, -0.11) | -0.29 | (-0.47, -0.11) | 0.001 | |
| Variance province |
0.56
(0.3,1.04) |
|||||||||
| Covariance county, quintile | 0.029 (-0.007, 0.06) | |||||||||
| Variance quintile | 0.02 (0.01, 0.05) | |||||||||
| Variance county | 0.23 (0.11, 0.48) |
0.56
(0.41, 0.75) |
||||||||
Tab. IV.
Prevalence of tobacco use in different provinces of the country based on Quantiles Socioeconomic and calculation of concentration index in provinces.
| Province | Prevalence of smoking | The prevalence of smoking on quintiles | OR (CI 95%) |
Concentration Index (CI 95%) | |||||
|---|---|---|---|---|---|---|---|---|---|
| First | Second | Third | Fourth | Fifth | |||||
| 1 | East Azerbaijan | 64 (3.7) | 2 (3.13) | 7 (10.94) | 9 (14.06) | 13 (20.31) | 33 (51.56) | 0.79 (0.64-0.97) | -0.16 (-0.31, -0.2) |
| 2 | West Azerbaijan | 33 (2.5) | 0 (0) | 0 (0) | 11 (33.33) | 6 (18.18) | 16 (48.48) | 0.65 (0.48-0.88) | -0.29 (-0.51, -0.08) |
| 3 | Ardebil | 20 (3.4) | 0 (0) | 4(20) | 6(30) | 3(15) | 71(35) | 0.87 (0.62-1.21) | -0.07 (-0.32, 0.17) |
| 4 | Isfahan | 288 (11.8) | 2 (0.69) | 12 (4.17) | 21 (7.29) | 72(25) | 181 (62.85) | 0.81 (0.71-0.93) | -0.11 (-0.17, -0.04) |
| 5 | Ilam | 7 (1.4) | 1 (14.29) | 2 (28.57) | 0 (0) | 0 (0) | 4 (57.14) | 0.98 (0.57-1.69) | -0.03 (-0.45, 0.39) |
| 6 | Busher | 129(29) | 8 (6.2) | 16 (12.4) | 16 (12.4) | 20 (15.15) | 69 (53.49) | 1.21 (1.02-1.42) | 0.08 (-0.002, 0.16) |
| 7 | Tehran | 1020 (16.7) | 7 (0.69) | 30 (2.94) | 78 (7.65) | 154 (15.1) | 751 (73.63) | 0.78 (0.72-0.85) | -0.07 (-0.11, -0.04) |
| 8 | Chahar-Mahal & Bakhtiari | 83(17) | 9 (10.84) | 12 (14.46) | 5 (6.02) | 16 (19.28) | 41 (49.4) | 0.87 (0.74-1.03) | -0.1 (-0.21, 0.01) |
| 9 | Southern Khorasan | 22 (5.2) | 0 (0) | 2 (6.09) | 6 (27.27) | 1 (4.55) | 13 (59.09) | 1.08 (1.04-0.95) | -0.22 (-0.47, 0.02) |
| 10 | Khorasan Razavi | 436 (17.9) | 38 (8.72) | 55 (12.61) | 93 (21.33) | 91 (20.87) | 159 (36.47) | 1.08 (1.04-0.04) | 0.06 (0.01, 0.11) |
| 11 | North Khorasan | 38(9) | 7 (18.42) | 8 (21.05) | 8 (21.05) | 10 (26.32) | 5 (13.16) | 0.95 (0.75-1.19) | -0.05 (-0.22, 0.12) |
| 12 | Khuzestan | 119 (5.9) | 10 (8.4) | 13 (10.92) | 15 (12.61) | 19 (15.97) | 62 (52.1) | 0.79 (0.69-0.91) | -0.18 (-0.28, -0.07) |
| 13 | Zanjan | 39 (8.9) | 0 (0) | 5 (12.82) | 8 (20.51) | 3 (7.69) | 23 (58.97) | 0.68 (0.51-0.89) | -0.3 (-0.49, -0.1) |
| 14 | Semnan | 26(6) | 0 (0) | 2 (7.69) | 3 (11.54) | 6 (23.08) | 15 (57.69) | 0.99 (0.67-1.44) | 0.18 (-0.04, 0.4) |
| 15 | Sistan & Baluchestan | 231 (24.4) | 115 (49.78) | 47 (20.35) | 21 (9.09) | 25 (10.82) | 23 (9.96) | 1.11 (0.05-1.15) | 0.07 (0.008, 0.13) |
| 16 | Fars | 295 (14.3) | 24 (8.14) | 41 (13.9) | 43 (14.58) | 50 (16.95) | 137 (46.44) | 0.99 (0.9-1.08) | -0.01 (-0.07, 0.05) |
| 17 | Gazvin | 37(7) | 1 (2.7) | 3 (8.11) | 4 (10.81) | 11 (29.73) | 18 (48.65) | 0.74 (0.55-1.01) | -0.14 (-0.23, 0.03) |
| 18 | Qom | 70 (14.8) | 0 (0) | 7(10) | 11 (15.71) | 10 (14.29) | 42(6) | 0.94 (0.73-1.2) | -0.08 (-0.2, 0.04) |
| 19 | Kordestan | 27(4) | 0 (0) | 5 (8.52) | 6 (22.22) | 4 (14.81) | 12 (44.44) | 0.75 (0.56-1.01) | -0.22 (-0.45, 0.002) |
| 20 | Kerman | 154 (13.2) | 30 (19.48) | 21 (13.64) | 16 (10.39) | 18 (11.69) | 69 (44.81) | 0.9 (0.81-1) | -0.1 (-0.19, -0.01) |
| 21 | Kermanshah | 53 (5.8) | 7 (13.21) | 5 (9.43) | 5 (9.43) | 17 (32.08) | 19 (35.85) | 0.84 (0.68-1.03) | -0.13 (-0.29, 0.01) |
| 22 | Kohgilooye & Boyer-Ahmad | 116 (21.4) | 25 (14.97) | 18 (15.52) | 14 (12.07) | 28 (24.14) | 31 (26.72) | 0.9 (0.79-1.02) | -0.06 (-0.15, 0.02) |
| 23 | Golestan | 59 (7.6) | 8 (13.56) | 14 (23.73) | 13 (22.03) | 6 (10.17) | 18 (30.51) | 1.03 (0.84-1.25) | 0.01 (-0.12,0.16) |
| 24 | Gilan | 120 (10.8) | 8 (6.67) | 14 (11.67) | 11 (9.17) | 25 (20.83) | 62 (51.67) | 0.68 (0.58-0.79) | -0.27 (-0.38, -0.17) |
| 25 | Lorestan | 69 (8.7) | 11 (15.94) | 4 (5.8) | 20 (28.99) | 13 (18.84) | 21 (30.43) | 0.88 (0.74-1.04) | -0.11 (-0.24, 0.01) |
| 26 | Mazandaran | 226 (13.3) | 10 (4.42) | 20 (8.85) | 33 (14.6) | 53 (23.81) | 110 (48.67) | 0.84 (0.75-0.94) | -0.11 (-0.18, -0.04) |
| 27 | Markazi | 84 (13.5) | 1 (1.19) | 6 (7.14) | 17 (20.24) | 20 (23.81) | 40 (47.62) | 0.93 (0.76-1.15) | -0.02 (-0.14, 0.08) |
| 28 | Hormozgan | 134 (20.5) | 29 (21.64) | 25 (18.66) | 25 (18.66) | 29 (21.64) | 26 (19.4) | 1.18 (1.04-1.33) | 0.12 (0.03, 0.21) |
| 29 | Hamedan | 112 (14.5) | 10 (8.93) | 21 (18.75) | 15 (13.39) | 23 (20.54) | 43 (38.39) | 0.97 (0.83-1.12) | -0.02 (-0.12, 0.07) |
| 30 | Yazd | 47 (9.9) | 3 (6.38) | 4 (8.51) | 6 (12.77) | 9 (19.15) | 25 (53.9) | 1.14 (0.9-1.45) | 0.006 (-0.15, 0.16) |
| 31 | Total country | 4158 (12.24) | 366 (8.8) | 423 (10.1) | 539 (12.9) | 755 (18.16) | 2075 (49.9) | 0.9 (0.88-0.93) | -0.07 (-0.09, -0.05) |
Fig. 2.
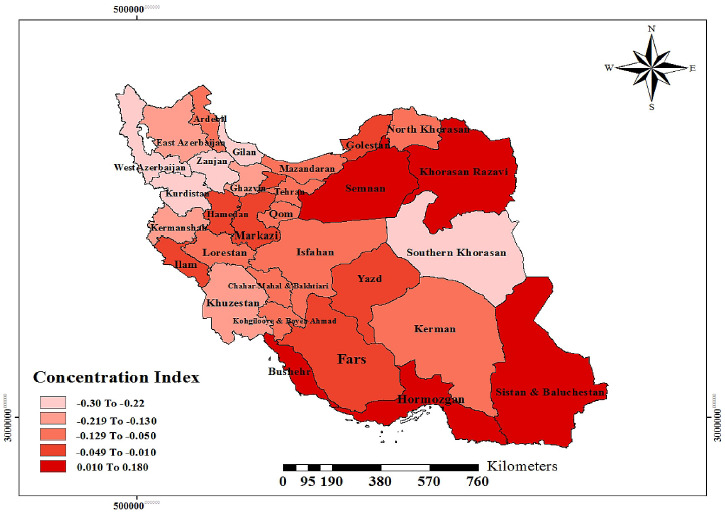
Dispersion of concentration index in different provinces of Iran.
After determining the inequality, using the Multilevel method, the contribution of each of the determinants associated with tobacco smoking was analyzed in regard with the inequality creation between the two poor and rich groups.
The results of Model 1 that were performed on individual level showed that location, marital status, age over 35 years and the economic status of people were related with smoking (P < 0.05).
The results of Model 2, which was performed in the province, showed that the place of residence (β = -0.21, P = 0.000), the marital status of individuals (β = -0.1, P = 0.015), age over 35 (β = -0.2, P = 0.0001) and the economic class (β = -0.29, P = 0.0001) were related to tobacco smoking. From the results of the analysis, smoking in women living in the village was lower than that of women living in the city, so that women living in the village (1-e-0.21) had 19% less chance of smoking). Also the chances of smoking in wives were more than single women, and single women had a lower incidence (1-e-0.1) of tobacco use. The results showed that women aged 35 and over in comparison with women under the age of 20, had less smoking chance (1-e-0.2) (19.0%). In the study of socio-economic classes in the province, people in higher economic classes had a lower chance of smoking than those in lower economic categories, so that people in the fifth quintile were 26% (1-e-0.29) less likely to smoke than those in the first quintile.
The results of the survey at the county level (Model3) showed that at the level of the city, between the place of residence (β = -0.18, P = 0.000), the marital status of individuals (β = -0.13, P = 0.003), age over 35 years (β = -0.23, P = 0.001) and the economic class (β = -0.3, P = 0.000), a significant relationship existed with tobacco use. The results of the county-level analysis also confirmed that smoking in women who live in the village was lower than that of women living in the city, so that women living in the village smoked tobacco 17% (1-e-0.18) less than them, and the chance of smoking in wives was more than single women, and single women had a lower chance of smoking as 13 percent (1-e-0.13). In the study of age groups in the county, the results of the study showed that women over the age of 35 had a chance of smoking 21% (1-e-0.23) less than women under the age of 20. In the study of socioeconomic classes in the county level, the results of the analysis showed that those in higher economic classes were less likely to use tobacco than those in lower economic classes, so that people in the fifth quintile were less likely to smoke than those in the first quantile, as 26% (1-e-0.3) (Tab. III).
Discussion
The prevalence of tobacco smoking as a major public health problem has been widespread in Iran and in the world [8]. Today, in most high-income countries, there is a negative trend in tobacco use, so smoking is more common in people with a lower socioeconomic status [15]. There is a negative social and economic slope in all age and gender groups, and this slope is poor in the age group under 40 and strong in the age group above 40 [26].
The results of this study showed that the prevalence of smoking in women was 12.24%. A significant relationship existed between tobacco smoking and place of residence, age groups over 35, marital status and economic variables. The concentration Index for tobacco was CI = -0.19 [95% CI (-0.20, -0.18)], which indicated the existence of inequality in tobacco smoking, and the rate of tobacco smoking was lower in the lower socioeconomic group. Multilevel analysis showed that marital status, age, and economic status of people were related to tobacco use. Model1 showed that the marital status of individuals (β = 0.206, P = 0.0001), age (β = -0.009, P = 0.0001) and economic class (β = -0.107, P = 0.0001) were related to tobacco smoking.
The present study showed that the prevalence of smoking in women aged 15-54 was 12.24%. The study by Bosdriesz et al. showed that the prevalence of smoking in women was 3.3% in Kongo, Senegal 2.1%, Brazil 18.9%, Mexico 14.4%, Kazakhstan 6.6%, Pakistan 6.7%, India 18.3% and South Africa 14.4% [8] . The results of Yang et al. in China showed that the prevalence of smoking in women was 6.7% [27]. This difference in the prevalence of tobacco smoking can be due to differences in culture, education level and socioeconomic status of people in different countries.
Significant social and economic inequalities exist in the health sector [28]. Socio-economic inequality in smoking is well known in previous studies [29]. Various studies have reported similar results that tobacco smoking is strongly linked to the household’s economic situation [22, 30].
In the present study, the prevalence of smoking in Iranian women was unevenly distributed in the socio-economic classes of society. Also in this study, the concentration index for tobacco was CI = -0.19 [95% CI (-0.20, -0.18)], which indicates a higher prevalence of tobacco smoking in lower social classes. In studying the multilevel results, the results also showed that at the individual level, the province level, and the county level, people who at higher social classes were less likely to smoke, but in studying the multilevel results which were done separately in urban and rural areas of Iran, the results showed that a significant relationship existed between the socioeconomic status of women and the chance of smoking in urban areas, and people with higher social classes had lower chances of smoking. In rural areas there was no significant relationship between smoking and social classes.
Thakur et al., in India [28], the prevalence of tobacco smoking was higher in more deprived economic classes, which was consistent with the results of our study [29].
The study by Bosdriesz et al. showed that in Latin America and the Eastern Mediterranean countries, the prevalence of tobacco smoking among women in higher socio-economic classes was higher, which did not match the results of our study in Iran [8].
In lower socioeconomic classes, tobacco smoking costs replaces other essential health costs, which in the long run lead to serious complications, the incidence of illness and death due to the use of tobacco, and consequently enlarges the gap between economic and social inequalities [31].
The results of Badr’s study in multilevel analysis showed that educational level does not cause socioeconomic inequality in smoking, while in the urban areas, the results of the multilevel analysis revealed that the chances of smoking in people with a high school education was higher than the illiterates.
In the study of Wang et al. [32], Sarkar et al. [33] and Hoebel et al. [34], there was a significant relationship between education level and smoking inequality, which was consistent with the results of our study.
From the present study, social economic inequality in tobacco smoking had a significant relationship with marital status of women, and the prevalence of smoking in wives was more than single women. These results were consistent with the results of the study by Si et al. [35] in Australia and Emamian et al. [15], in iran.
The results of this study showed that smoking inequality has a significant relationship with the age of women and the prevalence of tobacco smoking in all socioeconomic groups is higher among women aged over 35 than those under 35, which is consistent with the results of Corsi et al. in India [36], the study of Hamrah et al. [37], while the study of Yang et al. in Taiwan found an inverse relationship between age and tendency to smoking, which was not consistent with the results of this study [38].
Studies have shown that to effectively address inequalities in health new interventions are required which can reduce inequity by identifying and organizing inequities in social health factors and promoting appropriate interventions through public health programs [39, 40].
It is expected that in the future decades the mortality from tobacco smoking will increase, especially in developing countries, thus the need is more felt for taking effective measures such as advertising bans, increasing tobacco prices and providing effective solutions for people to quit smoking [40, 41].
Conclusions
The results of our study represented that inequality exists in the prevalence of smoking among women. In addition, the prevalence of smoking among women living in lower socioeconomic status is higher. Therefore, considering to the socio-economic factors and other factors related to smoking such as marital status, place of residence and age among women can help the government to run programs to reduce the prevalence of smoking in these women.
Figures and tables
Acknowledgements
This research is the result of a Master’s degree in Epidemiology with the identification code No ir.muk.rec.1395.27 from the Kurdistan University of Medical Sciences, sponsored by Kurdistan University of Medical Sciences. Thanks are also due to the collaboration of the National Institute of Health Research of Iran with the provision of this data, as well as all those involved in the data collection process.
Footnotes
Conflict of interest statement
The authors declare no conflict of interest.
Authors’ contributions
EG carried out the design of the study and carried out analyzing the data and prepared the manuscript. GM and EG critically reviewed the manuscript, applied comments and finalized the manuscript. AKh and EG participated in the design of the study. All authors have read and approved the content of the manuscript.
References
- [1].Van Minh H, Giang KB, Ngoc NB, Hai PT, Huyen DTT, Khue LN, Lam NT, Nga PTQ, Xuyen NT. Prevalence of tobacco smoking in Vietnam: findings from the Global Adult Tobacco Survey 2015. J Public Health 2017;62:121-9. https://doi.org/10.1007/s00038-017-0955-8 10.1007/s00038-017-0955-8 [DOI] [PubMed] [Google Scholar]
- [2].Chen Z, Peto R, Zhou M, Iona A, Smith M, Yang L, Guo Y, Chen Y, Bian Z, Lancaster G. Contrasting male and female trends in tobacco-attributed mortality in China: evidence from successive nationwide prospective cohort studies. Lancet 2015;386:1447-56. https://doi.org/10.1016/S0140-6736(15)00340-2 10.1016/S0140-6736(15)00340-2 [DOI] [PMC free article] [PubMed] [Google Scholar]
- [3].Khazaei Z, Tosang MA, Zadeh SZM, Khazaei S, Goodarzi E, Asadi ZS. Prevalence of risky behaviors and related factors among students of Dezful University of Medical Sciences in 2014. Iran J Psychiatry 2017;12:188. http://eprints.gmu.ac.ir/id/eprint/223 [PMC free article] [PubMed] [Google Scholar]
- [4].Barik A, Rai RK, Gorain A, Majumdar S, Chowdhury A. Socio-economic disparities in tobacco consumption in rural India: evidence from a health and demographic surveillance system. Perspect Public Health 2016;136:278-87. https://doi.org/10.1177/1757913915609947 10.1177/1757913915609947 [DOI] [PubMed] [Google Scholar]
- [5].WHO Organization. WHO report on the global tobacco epidemic, 2013: enforcing bans on tobacco advertising, promotion and sponsorship: World Health Organization 2013. [Google Scholar]
- [6].Pirdehghan A, Vakili M, Arab M, Aghakoochak A. Smoking frequency and modeling the underlying predicting factors of tobacco smoking among high school students in Yazd city, 2012. J Shahrekord Univ Med Sci 2014;16. http://eprints.skums.ac.ir/id/eprint/3756 [Google Scholar]
- [7].Jafarabadi MA, Allahverdipour H, Bashirian S, Jannati A. Modeling the underlying predicting factors of tobacco smoking among adolescents. Iran J Public Health 2012;41:46. [PMC free article] [PubMed] [Google Scholar]
- [8].Kulkarni N, Shilpa K, Naik VA, Mallapur M. Epidemiological correlates of tobacco consumption among women in reproductive age group-a community based cross sectional study in the rural area of Belgaum District, Karnataka, South India. Int J Community Med Public Health 2016;3:3161-5. [Google Scholar]
- [9].Bosdriesz JR, Mehmedovic S, Witvliet MI, Kunst AE. Socioeconomic inequalities in smoking in low and mid income countries: positive gradients among women? Int J Equity Health 2014;13:14. https://doi.org/10.1186/1475-9276-13-14 10.1186/1475-9276-13-14 [DOI] [PMC free article] [PubMed] [Google Scholar]
- [10].Kiyohara C, Ohno Y. Sex differences in lung cancer susceptibility: a review. Gend Med 2010;7:381-401. https://doi.org/10.1016/j.genm.2010.10.002 10.1016/j.genm.2010.10.002 [DOI] [PubMed] [Google Scholar]
- [11].Schaefer DR, Haas SA, Bishop NJ. A dynamic model of US adolescents’ smoking and friendship networks. Am J Public Health 2012;102:e12-e8. https://doi.org/10.2105/AJPH.2012.300705 10.2105/AJPH.2012.300705 [DOI] [PMC free article] [PubMed] [Google Scholar]
- [12].Schnohr CW, Kreiner S, Rasmussen M, Due P, Diderichsen F. School-related mediators in social inequalities in smoking: a comparative cross-sectional study of 20,399 adolescents. Int J Equity Health 2009;8:17. https://doi.org/10.1186/1475-9276-8-17 10.1186/1475-9276-8-17 [DOI] [PMC free article] [PubMed] [Google Scholar]
- [13].Harper S, McKinnon B. Global socioeconomic inequalities in tobacco use: internationally comparable estimates from the World Health Surveys. Cancer Causes Control. 2012, 23:11-25. https://doi.org/10.1007/s10552-012-9901-5 10.1007/s10552-012-9901-5 [DOI] [PubMed] [Google Scholar]
- [14].Moor I, Rathmann K, Lenzi M, Pförtner T-K, Nagelhout GE, de Looze M, Bendtsen P, Willemsen M, Kannas L, Kunst AE. Socioeconomic inequalities in adolescent smoking across 35 countries: a multilevel analysis of the role of family, school and peers. Eur J Public Health 2015;25:457-63. https://doi.org/10.1093/eurpub/cku244 10.1093/eurpub/cku244 [DOI] [PubMed] [Google Scholar]
- [15].Emamian MH, Fateh M, Fotouhi A. Socioeconomic inequality in smoking and its determinants in the Islamic Republic of Iran. East Mediterr Health J 2020;26:29-38. https://doi.org/10.26719/2020.26.1.29 10.26719/2020.26.1.29 [DOI] [PubMed] [Google Scholar]
- [16].Palipudi KM, Gupta PC, Sinha DN, Andes LJ, Asma S, McAfee T, Group GC. Social determinants of health and tobacco use in thirteen low and middle income countries: evidence from Global Adult Tobacco Survey. PloS one 2012;7:e33466. [DOI] [PMC free article] [PubMed] [Google Scholar]
- [17].Tchicaya A, Lorentz N, Demarest S. Socioeconomic inequalities in smoking and smoking cessation due to a smoking ban: general population-based cross-sectional study in Luxembourg. PloS one 2016;11:e0153966. https://doi.org/10.1371/journal.pone.0153966 10.1371/journal.pone.0153966 [DOI] [PMC free article] [PubMed] [Google Scholar]
- [18].Kuipers MA, Monshouwer K, van Laar M, Kunst AE. Tobacco control and socioeconomic inequalities in adolescent smoking in Europe. Am J Prev Med 2015;49:e64-e72. https://doi.org/10.1016/j.amepre.2015.04.032 10.1016/j.amepre.2015.04.032 [DOI] [PubMed] [Google Scholar]
- [19].Tabuchi T, Kondo N. Educational inequalities in smoking among Japanese adults aged 25-94 years: nationally representative sex-and age-specific statistics. J Epidemiol. 2017, 27:186-92. https://doi.org/10.1016/j.je.2016.05.007 10.1016/j.je.2016.05.007 [DOI] [PMC free article] [PubMed] [Google Scholar]
- [20].Moser CA, Kalton G. Survey methods in social investigation. Routledge; 2017. [Google Scholar]
- [21].Mohammadbeigi A, Hassanzadeh J, Eshrati B, Rezaianzadeh A. Decomposition of inequity determinants of healthcare utilization. Iran Public Health 2013;127:661-7. https://doi.org/10.1016/j.puhe.2013.01.001 10.1016/j.puhe.2013.01.001 [DOI] [PubMed] [Google Scholar]
- [22].Moradi G, Mohammad K, Majdzadeh R, Ardakani HM, Naieni KH. Socioeconomic inequality of non-communicable risk factors among people living in Kurdistan Province, Islamic Republic of Iran. Int J Prev Med 2013;4:671. [PMC free article] [PubMed] [Google Scholar]
- [23].Moradi G, Moinafshar A, Adabi H, Sharafi M, Mostafavi F, Bolbanabad AM. Socioeconomic inequalities in the oral health of people aged 15-40 years in Kurdistan, Iran in 2015: a cross-sectional study. J Prev Med Public Health 2017;50:303. https://doi.org/10.3961/jpmph.17.035 10.3961/jpmph.17.035 [DOI] [PMC free article] [PubMed] [Google Scholar]
- [24].Moradi G, Majdzadeh R, Mohammad K, Malekafzali H, Jafari S, Holakouie-Naieni K. Is the status of diabetes socioeconomic inequality changing in Kurdistan province, west of Iran? A comparison of two surveys. MedJ Islam Repub Iran 2016;30:375. [PMC free article] [PubMed] [Google Scholar]
- [25].Luke DA. Multilevel modeling. Sage publications; 2019. [Google Scholar]
- [26].Pampel FC, Denney JT. Cross-national sources of health inequality: education and tobacco use in the World Health Survey. Demography 2011;48:653-74. https://doi.org/10.1007/s13524-011-0027-2 10.1007/s13524-011-0027-2 [DOI] [PMC free article] [PubMed] [Google Scholar]
- [27].Zhou J, Yang Y, Qiu X, Yang X, Pan H, Ban B, Qiao Z, Wang L, Wang W. Relationship between anxiety and burnout among Chinese physicians: a moderated mediation model. PloS one 2016;11:e0157013. https://doi.org/10.1371/journal.pone.0157013.s001 10.1371/journal.pone.0157013.s001 [DOI] [PMC free article] [PubMed] [Google Scholar]
- [28].Thakur JS, Prinja S, Bhatnagar N, Rana S, Sinha DN, Singh PK. Socioeconomic inequality in the prevalence of smoking and smokeless tobacco use in India. Asian Pac J Cancer Prev 2013;14:6965-9. https://doi.org/10.7314/apjcp.2013.14.11.6965. 10.7314/apjcp.2013.14.11.6965 [DOI] [PubMed] [Google Scholar]
- [29].Hosseinpoor AR, Parker LA, d’Espaignet ET, Chatterji S. Socioeconomic inequality in smoking in low-income and middle-income countries: results from the World Health Survey. PloS one 2012;7:e42843. https://doi.org/10.1371/journal.pone.0042843 10.1371/journal.pone.0042843 [DOI] [PMC free article] [PubMed] [Google Scholar]
- [30].Ayubi E, Sani M, Safiri S, Khedmati Morasae E, Almasi-Hashiani A, Nazarzadeh M. Socioeconomic determinants of inequality in smoking stages: a distributive analysis on a sample of male high school students. Am J Men’s Health 2017;11:1162-8. https://doi.org/10.1177/1557988315585822 10.1177/1557988315585822 [DOI] [PMC free article] [PubMed] [Google Scholar]
- [31].Johnson NW, Warnakulasuriya S, Gupta P, Dimba E, Chindia M, Otoh E, Sankaranarayanan R, Califano J, Kowalski L. Global oral health inequalities in incidence and outcomes for oral cancer: causes and solutions. Adv Dent Res 2011;23:237-46. https://doi.org/10.1177/0022034511402082 10.1177/0022034511402082 [DOI] [PubMed] [Google Scholar]
- [32].Wang Q, Shen JJ, Sotero M, Li CA, Hou Z. Income, occupation and education: Are they related to smoking behaviors in China? PloS one 2018;13:e0192571. https://doi.org/10.1371/journal.pone.0192571 10.1371/journal.pone.0192571 [DOI] [PMC free article] [PubMed] [Google Scholar]
- [33].Sarkar BK, Arora M, Gupta VK, Reddy KS. Determinants of tobacco cessation behaviour among smokers and smokeless tobacco users in the states of Gujarat and Andhra Pradesh, India. Asian Pac J Cancer Prev 2013;14:1931-5. https://doi.org/10.7314/APJCP.2013.14.3.1931 10.7314/APJCP.2013.14.3.1931 [DOI] [PubMed] [Google Scholar]
- [34].Hoebel J, Kuntz B, Kroll LE, Finger JD, Zeiher J, Lange C, Lampert T. Trends in absolute and relative educational inequalities in adult smoking since the early 2000s: the case of Germany. Nicotine Tob Res 2018;20:295-302. https://doi.org/10.1093/ntr/ntx087 10.1093/ntr/ntx087 [DOI] [PubMed] [Google Scholar]
- [35].Si Y, Zhou Z, Su M, Wang X, Li D, Wang D, He S, Hong Z, Chen X. Socio-economic inequalities in tobacco consumption of the older adults in China: a decomposition method. Int J Environ Res Public Health 2018;15:1466. https://doi.org/10.3390/ijerph15071466 10.3390/ijerph15071466 [DOI] [PMC free article] [PubMed] [Google Scholar]
- [36].Corsi DJ, Subramanian S, Lear SA, Teo KK, Boyle MH, Raju PK, Joshi R, Neal B, Chow CK. Tobacco use, smoking quit rates, and socioeconomic patterning among men and women: a cross-sectional survey in rural Andhra Pradesh, India. Eur J Prev Cardiol 2014;21:1308-18. https://doi.org/10.1177/2047487313491356 10.1177/2047487313491356 [DOI] [PubMed] [Google Scholar]
- [37].Hamrah MS, Harun-Or-Rashid M, Hirosawa T, Sakamoto J, Hashemi H, Emamian MH, Shariati M, Fotouhi A. Smoking and associated factors among the population aged 40-64 in Shahroud, Iran. Asian Pac J Cancer Prev 2013;14:1919-23. https://doi.org/10.7314/APJCP.2013.14.3.1919 10.7314/APJCP.2013.14.3.1919 [DOI] [PubMed] [Google Scholar]
- [38].Yang G, Fan L, Tan J, Qi G, Zhang Y, Samet JM, Taylor CE, Becker K, Xu J. Smoking in China: findings of the 1996 national prevalence survey. Jama 1999;282:1247-53. https://doi.org/10.1001/jama.282.13.1247 10.1001/jama.282.13.1247 [DOI] [PubMed] [Google Scholar]
- [39].Hosseinpoor AR, Schlotheuber A, Nambiar D, Ross Z. Health Equity Assessment Toolkit Plus (HEAT Plus): software for exploring and comparing health inequalities using uploaded datasets. Glob Health Action 2018;11:20-30. https://doi.org/10.1080/16549716.2018.1440783 10.1080/16549716.2018.1440783 [DOI] [PMC free article] [PubMed] [Google Scholar]
- [40].Marmot M. The health gap. Scand J Public Health Suppl 2017;45:686-93. https://doi.org/10.1177/1403494817717433 10.1177/1403494817717433 [DOI] [PubMed] [Google Scholar]
- [41].Hosseinpoor AR, Bergen N, Schlotheuber A, Boerma T. National health inequality monitoring: current challenges and opportunities. Glob Health Action 2018;11:70-4. https://doi.org/10.1080/16549716.2017.1392216 10.1080/16549716.2017.1392216 [DOI] [PMC free article] [PubMed] [Google Scholar]