

Abstract
Epigenetic changes are potentially important for the ontogeny and progression of tumors but are not usually studied because of the complexity of analyzing transcript regulation resulting from epigenetic alterations. Prostate cancer (PCa) is characterized by variable clinical manifestations and frequently unpredictable outcomes. We performed an expression quantitative trait loci (eQTL) analysis to identify the genomic regions that regulate gene expression in PCa and identified a relationship between DNA methylation and clinical information. Using multi-level information published in The Cancer Genome Atlas, we performed eQTL-based analyses on DNA methylation and gene expression. To better interpret these data, we correlated loci and clinical indexes to identify the important loci for both PCa development and progression. Our data demonstrated that although only a small proportion of genes are regulated via DNA methylation in PCa, these genes are enriched in important cancer-related groups. In addition, single nucleotide polymorphism analysis identified the locations of CpG sites and genes within at-risk loci, including the 19q13.2–q13.43 and 16q22.2–q23.1 loci. Further, an epigenetic association study of clinical indexes detected risk loci and pyrosequencing for site validation. Although DNA methylation-regulated genes across PCa samples are a small proportion, the associated genes play important roles in PCa carcinogenesis.
Keywords: CpG sites, DNA methylation, expression quantitative trait loci, genome-wide association study, prostate cancer
INTRODUCTION
Prostate cancer (PCa) is a common malignancy and leading cause of cancer death among men in the US where it is estimated that approximately 191 930 new PCa cases are expected to be diagnosed in 2020.1 Further, according to a Chinese statistical report, 60 300 PCa cases were confirmed in 72 population-based cancer registries in China from 2009 to 2011, with a mortality of 26 600, resulting in rankings of sixth and eleventh place, respectively, among all cancers affecting men, in China.2 As the Chinese population continues to age, both the incidence and mortality of PCa are expected to continue increasing over the next two decades. PCa cells are known to harbor a variety of genetic defects, including gene mutations and translocations, all of which provide the cells with new capabilities for dysregulated proliferation, immune system evasion, tissue invasion and destruction, inappropriate survival, and metastasis.3 Furthermore, there is abundant evidence that along with genetic changes,4 somatic epigenetic alterations also contribute to PCa carcinogenesis and metastasis.5,6,7,8 Epigenetic gene inactivation in cancer cells is largely based on transcriptional silencing mediated by the aberrant CpG methylation of CpG-rich promoter regions.6,9,10,11,12 DNA methylation is a widely recognized epigenetic marker associated with diagnosis and prognosis in many malignancies.6,13,14 Notably, abnormal DNA methylation has been reported to contribute to the occurrence and progression of PCa.15,16 Previous studies of DNA methylation and PCa risk have found that specific promoter sequences are hypermethylated at a higher frequency in PCa tumor tissues than those in nontumor tissues.4,6,10,17
Quantitative genetics has made a significant progress in revealing the genetic bases of complex traits, especially in developing sophisticated tools to identify the location of genes that impact complex traits. A region of the genome contributing to the variation in a quantitative trait, also known as quantitative trait loci (QTLs), has been used to study gene expression phenotypes (expression quantitative trait loci [eQTLs]) on a massive scale. DNA methylation quantitative trait loci (meQTLs) have been identified in pathological and physiological contexts. The genome-wide gene expression studies can provide information on genetic variation that affects gene expression levels.18 We can use linkage or association mapping to map cis- and trans-acting factors for many genes to explain the inheritance patterns. Previous reports showed that cis/trans-meQTLs could target different CpGs and clarified DNA methylation involvement in diseases and cancers.19,20,21,22,23 Thus, eQTL analysis is a straightforward and popular method for discovering regulatory genome sites24,25,26 and detecting underlying associations across the genome in PCa studies.27,28
The Cancer Genome Atlas (TCGA, http://cancergenome.nih.gov/) is a database that collects multiple types of “omics” from thousands of samples and provides public data access to researchers. Accordingly, modified eQTL methods involving calculations of correlations among gene expression, phenotype, DNA methylation, copy number variations, and single-nucleotide polymorphisms (SNPs) have proven to be a powerful tool.29,30,31 However, genome-wide correlations between gene expression, DNA methylation, and clinical phenotypes in PCa are not yet understood.
Therefore, we performed a meQTL analysis of PCa samples from the TCGA database. Although genes regulated via methylation comprise a minor proportion of the genome (0.8%), these genes are enriched in some gene ontology (GO) groups and in important canonical cancer-related pathways. In our study, we mainly identified meQTL pairs on chromosomes 16q and 19q, which have been reported as high-risk regions for PCa, using SNP analyses. We also identified DNA methylation regions and genes associated with clinical indexes at 11q13 and 16q13 and found several genes regulated by DNA methylation that are important for prognosis. According to our meQTL analyses, we selected some androgen receptor (AR) gene-related CpG sites and some sites that are altered during PCa genesis, and correlated them with Gleason score.
MATERIALS AND METHODS
Data preanalysis
A transcriptome of a prostate adenocarcinoma (PRAD) gene evaluation was downloaded with the TCGA dataset. The nonprimary PCa samples were discarded. Furthermore, the primary tumor samples not providing either gene expression (evaluated with RNA sequencing [RNA-seq]) or DNA methylation information also were excluded from later analysis. As result, a total of 419 samples were used for meQTL identification. Methylation data also were downloaded for the TCGA dataset and were correlated with expression data. Methylation levels at the evaluated sites were estimated using an Illumina Human Infilium 450k BeadChip (Illumina, San Diego, CA, USA). After sample normalization, samples were combined to a methylation matrix according to the gene ID.
meQTL analysis
We used R software MatrixeQTL package32 (version 2.15.1; R Project for Statistical Computing, Vienna, Austria) for eQTL analysis. Each methylated CpG level was regarded as a continuous variable rather than a discrete variable. Correlations between the methylation level of each CpG site and each gene were evaluated using MatrixeQTL. As DNA methylation mostly influences the expression of genes via promoter regions, we distinguished cis- and trans-regulation for further analysis. The gene and methylation CpG sites were extracted from Illumina Human Infilium 450k BeadChip annotation files and University of California, Santa Cruz (UCSC) reference gene list locations. For reference genes, the gene location was counted from the transcription start site to terminal site. We set a P value threshold of 1 × 10⁻⁵ for cis-regulated and 1 × 10⁻⁶ for trans-regulated eQTLs. Cis-regulated meQTLs were defined as interacting pairs with tested DNA methylation sites and genes <1 megabase (MB), whereas trans-regulated meQTLs were defined as pairs with genes >1 MB or located on other chromosomes.
Tissue specimens and bisulfite modification of DNA
A total of 70 PCa patients who underwent radical prostatectomy at Xinhua Hospital affiliated to Shanghai Jiao Tong University School of Medicine (Shanghai, China), between July 2014 and January 2017, were enrolled in this study. Informed consent was obtained from all subjects. All cases were histologically confirmed and had clinical stage II or III tumors, no clinical evidence of lymph node or distant metastasis, available pathology specimens, and complete clinical and serum prostate-specific antigen (PSA) data. Patients with missing any variable needed to accurately assign them to a risk group (PSA, tumor [T] stage, or Gleason score) were excluded. Patients with missing information on any available demographic variables were excluded. All samples were retrieved from the archive of the Institute of Pathology, Xinhua Hospital, and were anonymously analyzed in accordance with the guidelines of the Ethics Committee of Xinhua Hospital Affiliated to Shanghai Jiao Tong University School of Medicine. We confirm that all experimental protocols were approved by the local ethics committee (approval No. XHEC-D-2016-005).
Patients were categorized as low-, moderate-, or high-risk PCa based on the 2015 National Comprehensive Cancer Network guidelines (Table 1). All 70 cases included tumor tissues and adjacent nontumor tissues. Prostate tissue samples from these cases were obtained at the time of radical prostatectomy, and tumor cell contents were determined to exceed 70.0% of all tissues. Tissue microdissection yielded tumor and adjacent nontumor tissues from which DNA was extracted using an FFPE DNA Kit (Omega Bio-Tek, Norcross, GA, USA) according to the manufacturer's instructions. Extracted DNA concentrations were measured using a NanoDrop 2000 spectrophotometer (Thermo Fisher Scientific, Wilmington, DE, USA) and subsequently adjusted to approximately 40 ng ml−1. Prepared DNA was subjected to bisulfite treatment using the EZ DNA Methylation-Gold kit (ZYMO, Orange, CA, USA); converted DNA was dissolved in Tris-EDTA (TE) buffer and stored at or below −20°C for later use.
Table 1.
Patient baseline characteristics
| Variable | Low risk | Moderate risk | High risk | |
|---|---|---|---|---|
| Patient (n) | 10 | 34 | 14 | 12 |
| Age (year), mean±s.d. | 65.4±7.7 | 67.3±9.5 | 65.6±8.7 | 68.1±12.3 |
| PSA (ng ml-1), mean±s.d. | 8.6±1.2 | 15.4±2.4 | 17.2±1.7 | 32.7±10.5 |
| Gleason score | ≤ 6 (3+3) | 7 (3+4) | 7 (4+3) | ≥ 8 (4+4, 4+5, 5+3, 5+4) |
| Clinical T-stage | ≤ T2a | T2b | T2b | ≥ T2c |
| Clinical N-stage | N0 | N0 | N0 | N0 |
| Clinical M-stage | M0 | M0 | M0 | M0 |
Patients who met the study criteria with 14.3%, 68.6%, and 17.1% were classified as low, moderate, and high risk, respectively. PSA: prostate-specific antigen; T: tumor; N: node; M: metastasis; s.d.: standard deviation
Primer design and PCR
Specific primers were designed for 30 loci using the publicly available MethPrimer software package (http://www.urogene.org/methprimer/). A complete list of the primer pairs is available in Supplementary Table 1. Biotinylated reverse primers were substituted with 5′-tailed unlabeled reverse primers (aaccttcaacaccccaaccatata), allowing single (expansive) biotinylated primers to be used for subsequent pyrosequencing™. All primers and tag sequences were provided by Sangon (Shanghai, China).
Supplementary Table 1.
The primers of the polymerase chain reaction amplification and pyrosequencing
| Sites | F1 | F2 | |
|---|---|---|---|
| cg14338887, chr6:42928000,42929000 | ATTTGTTATTGGTTAGGTGGGGT | TTGTTAGTAGTGTTTATGTTTTAAGTG | |
| cg02213678, chr16:85112035,85113035 | TTGGTTATGGTTAGTAGAAAAGTTA | TTGGTTATGGTTAGTAGAAAAGTTA | |
| cg09207578, chr13:114781449,114782449 | GTTTTAGGTTTGGTTGAGATGTAGATT | GTTTTAGGTTTGGTTGAGATGTAGATT | |
| cg15492820, chr11:61322613,61323613 | TTTTTAAAGTTTTATTATATTTTTGGGT | TTTTTAAAGTTTTATTATATTTTTGGGT | |
| cg12918275, chr17:18150454,18151454 | GTTATAGGGGTTAGGGTATGTTAGG | GTTATAGGGGTTAGGGTATGTTAGG | |
| cg08170140, chr22:31090247,31091247 | GATTTAGGAAGGATTTAGGGTTTAAATATGG | GATTTAGGAAGGATTTAGGGTTTAAATATGG | |
| cg20664996, chr17:17359321,17360321 | TATAATGAAGTGTGTATTAYGGGAGYGT | TTTTAAGTTGATTTTTGGTTGTAGTG | |
| cg09093477, chr5:34838689,34839689 | GAGATATAATATGTAGAGGTTAGTTTTGGGG | TTTAATTTGYGGGGAAGGGAAAGYGGAG | |
| cg14927321, chr15:89491114,89492114 | GAAGTAATTAGTATATTAATGTGGTATTTTGGG | TGGGGGGTGATATTTTTTGGGT | |
| cg15854606, chr19:18654048,18655048 | TTGGTTTYGTTTTTGTYGTGTTTATTG | TTGGTTTATGTAGAYGTTYGTTTYGGG | |
| cg186688 36, chr2:113102684,113103684 | GTTAGTTTTTAATTTTTGGGTTTAGGGATT | GTATTGTATTAATTTTATTTATATATAGGTTTGTAT | |
| cg19283427, chr18:29522880,29523880 | GAGGTGTATAATTGTAGGTYGGGTTTTT | AAGTTYGTTTTTAGTAGAGTAGAGTTGAGAG | |
| cg06577658, chr19:46295770,46296770 | TTYGTTTATAGGTGTTGTTAGAGTTTT | GATTTAGGAAGGATTTAGGGTTTAAATATG | |
| cg23158051, chr2:65454192,65455192 | TTAGTTTTTTYGTTATATTTTATTGTYGTAGTAG | TGTTTGYGTTTTTTGTAGTTYGTTAAGTAG | |
| cg04744134, chr19:8407628,8408628 | ATTTTTAATGTGGGAGGGGTTT | GGTAGAGTTTTTAGTGGGGTTGGAAA | |
| cg18770350, chr1:236849466,236850466 | TGGGTTYGTTTGTTAGTTAGTTYGTG | TGGGTTYGTTTGTTAGTTAGTTYGTG | |
| cg23139584, chr8:56987006,56988006 | TTGAGTTTAGTTGATATGAGTATTGGTAG | TTGAGTTTAGTTGATATGAGTATTGGTAG | |
| cg05407490, chr7:23749167,23750167 | TTAAATTTAYGTGAATAGATTAGGAAAGATTA | TTAAATTTAYGTGAATAGATTAGGAAAGATTA | |
| cg23410069, chr22:20287122,20288122 | TAGTTTGTTGGTGTTGYGTTTTTG | TTGTTGGYGYGTTAYGAGTAGGTG | |
| cg05754508, chr12:65672031,65673031 | TTTTATGTTTATATTTGGATTYGGTTGTT | AGGAATTTTTYGTTATGTTTTTYGTYGT | |
| cg15850918, chr15:89900241,89901241 | TTTAGGTTAGATTAGGGATTAGTTTT | AAGGGAGGATGAAGGATATAGAAG | |
| cg25902616, chr11:47788693,47789693 | AAGGGTGAGAGTTTAGTTAATAGTG | AAGGGTGAGAGTTTAGTTAATAGTG | |
| cg23303108, chr8:23083078,23084078 | AAGAGTTTTGAAAGTTTTTAAATTA | GGGGATAGGTTTTTTTAGYGGT | |
| cg27069132, chrX: 135991043,135992043 | GAAATTTTTAGGATAGTTTTTTTT | AGGYGGGGAAGTTTGGGGAT | |
| cg09804858, chr6:42396621,42397621 | GAGTATTGGTGTTTGGAGAAATTTT | TGGATGGATTTTGYGAGGTTTGG | |
| cg14338887, chr6:42928000,42929000 | aaccttcaacaccccaaccatataCAACCCAAACAACCATACCTTATAC | aaccttcaacaccccaaccatata | AGTGTTTATGTTTTAAGTGYGG |
| cg02213678, chr16:85112035,85113035 | aaccttcaacaccccaaccatataATACAAATAAATCTTCTCCCCCTTC | aaccttcaacaccccaaccatata | AGTGGGTGYGTAATTAGAGTTGTTTTTAG |
| cg09207578, chr13:114781449,114782449 | aaccttcaacaccccaaccatataCCAAAATTACCCCCTTACAACTAA | aaccttcaacaccccaaccatata | TAYGGTGAGGTYGGATTGTAGGGTTAT |
| cg15492820, chr11:61322613,61323613 | aaccttcaacaccccaaccatataACCCAAAACCATACATCTAAAAACA | aaccttcaacaccccaaccatata | TTGGGYGGGGYGGYGYGATG |
| cg12918275, chr17:18150454,18151454 | aaccttcaacaccccaaccatataCCCTCAAACTAAATCAAAAACTATAC | aaccttcaacaccccaaccatata | AGGGTATGTTAGGGTGYGAAGGAT |
| cg08170140, chr22:31090247,31091247 | aaccttcaacaccccaaccatataCTTTCCCCATAAAACCRACCRACC | aaccttcaacaccccaaccatata | TATGGTTYGAGGTTGGTYGAGAG |
| cg20664996, chr17:17359321,17360321 | aaccttcaacaccccaaccatataATTTAAAATAAATACCCATCCAAAC | aaccttcaacaccccaaccatata | TGTAGTGGTTTGGGTTTGTGTGG |
| cg09093477, chr5:34838689,34839689 | aaccttcaacaccccaaccatataCAACCCAAATCCRACCAAAAAAACAATAC | aaccttcaacaccccaaccatata | AGGGTAAGGTAAGGGTTGTTGTAGG |
| cg14927321, chr15:89491114,89492114 | aaccttcaacaccccaaccatataACACCACCCTATAAAATTACTCATTAAC | aaccttcaacaccccaaccatata | GTTTGGTAGTTTAATTTTTTTATTGTA |
| cg15854606, chr19:18654048,18655048 | aaccttcaacaccccaaccatataTATTAAAATCCAACCCAAAATCCCC | aaccttcaacaccccaaccatata | TTAAAGGGATYGAAGTTTTTYGGTTG |
| cg186688 36, chr2:113102684,113103684 | aaccttcaacaccccaaccatataTATTTCCTCCAACTTTCTAATTATTTAAAAA | aaccttcaacaccccaaccatata | TATAGGTTTGTATTTTTTTGTTAAAATT |
| cg19283427, chr18:29522880,29523880 | aaccttcaacaccccaaccatataCCAAATCRATTACCCACAACAACCAAAAA | aaccttcaacaccccaaccatata | AGTAGAGTAGAGTTGAGAGTTATTTA |
| cg06577658, chr19:46295770,46296770 | aaccttcaacaccccaaccatataCTTTCCCCATAAAACCRACCRACC | aaccttcaacaccccaaccatata | GGGTTTAAATATGGTTYGAGGTTGGTYG |
| cg23158051, chr2:65454192,65455192 | aaccttcaacaccccaaccatataATAAACTCCAATAAAAAATAAAAAAAC | aaccttcaacaccccaaccatata | AGTTTTTGTGATATTTTAGGGAGAAAG |
| cg04744134, chr19:8407628,8408628 | aaccttcaacaccccaaccatataCAATCACCACCCCTACATTCCAAACCC | aaccttcaacaccccaaccatata | GTGYGTTTTYGAATTTATTTATTTAGGGG |
| cg18770350, chr1:236849466,236850466 | aaccttcaacaccccaaccatataTACTTCTCCCAAACTAAATCCAAAAAC | aaccttcaacaccccaaccatata | TTYGTGYGTTYGAGTTTTTYGYGTTT |
| cg23139584, chr8:56987006,56988006 | aaccttcaacaccccaaccatataCCTTTCCAAAAATAAATATAAATACTTCTACTAAAC | aaccttcaacaccccaaccatata | GTTGATATGAGTATTGGTAGAAATGTTT |
| cg05407490, chr7:23749167,23750167 | aaccttcaacaccccaaccatataCAAAAACCCCACACTACRCCTA | aaccttcaacaccccaaccatata | GTTTGAAGTTTTGYGAAAGGAATTGG |
| cg23410069, chr22:20287122,20288122 | aaccttcaacaccccaaccatataCCTCCCTTCCTAACTTCCCTTAC | aaccttcaacaccccaaccatata | GGGTTTTTGTTYGTTTYGGGAG |
| cg05754508, chr12:65672031,65673031 | aaccttcaacaccccaaccatataAACTACRCACTTCCCAAAAC | aaccttcaacaccccaaccatata | TTYGGAGTYGGGGAGGGAGGGAG |
| cg15850918, chr15:89900241,89901241 | aaccttcaacaccccaaccatataCCTCTAAAATATCTTTCAAATTCTC | aaccttcaacaccccaaccatata | GGTTAGTTAGGTTTATTTAGTTTTTAGG |
| cg25902616, chr11:47788693,47789693 | aaccttcaacaccccaaccatataAATAAAAAACAAATAAACAAAAAAAA | aaccttcaacaccccaaccatata | AGTGYGGTAGGGTTTGAATTAGAA |
| cg23303108, chr8:23083078,23084078 | aaccttcaacaccccaaccatataAAAAAAAATAAACATCAATCAAC | aaccttcaacaccccaaccatata | TTTGTATTTAGYGTTGTAYGGG |
| cg27069132, chrX: 135991043,135992043 | aaccttcaacaccccaaccatataACTAATAACACTATAACTCCCAAAAC | aaccttcaacaccccaaccatata | GTTYGGTTYGGYGGGGATTTTTA |
| cg09804858, chr6:42396621,42397621 | aaccttcaacaccccaaccatataAACAAAAAATACTTCCTTCCATTTC | aaccttcaacaccccaaccatata | GAGGTTTGGGAAGTTTTATTTATTTTA |
F: forward primer; R: reverse primer; SEQ: sequencing primer
PCR amplification of DNA was conducted using a nested-PCR protocol, using the primers shown in Supplementary Table 1. Two rounds of amplification reactions were performed. In the first round, a total reaction volume of 10 μl contains 1 mmol l−1 first primers (1 μl), bisulfite converted DNA (1 μl), ×2 PCR master mix (5 μl), and ddH2O (2 μl). In the second round, the total reaction volume was 30 μl: 4 μl of first-round PCR product as template, plus 10 mmol l−1 second primers (0.5 μl), ×2 PCR Master Mix (15 μl), and ddH2O (10 μl). PCR conditions were as follows: 94°C for 5 min, 30 cycles of denaturation at 94°C for 30 s, annealing at 55°C for 40 s, elongation at 72°C for 30 s, and an additional elongation step at 72°C for 7 min. Approximately 8 μl of each PCR product was separated by electrophoresis using a 3% agarose gel stained with GelRed (Invitrogen, Carlsbad, CA, USA) for 40 min at 120 V and visualized using a Gene Genius bio-imaging system (Syngene, Cambridge, UK).
Pyrosequencing™ methylation analysis
PCR products (20 μl) were added to a mix comprising Streptavidin Sepharose HP™ (3 μl; GE Healthcare, Dornstadt, Germany) and binding buffer (37 μl; Qiagen, Hilden, Germany). The contents were mixed at 2000g (Centrifuge 5810R, Eppendorf, Hamburg, Germany) for 10 min at room temperature. Using the Vacuum Prep Tool™ (Qiagen), according to the manufacturer's instructions, single-stranded PCR products were prepared. Sepharose beads with attached single-stranded templates were released into a PSQ 96 Plate Low™ (Qiagen) containing a mix of 40 μl annealing buffer (Qiagen) and the corresponding sequencing primer at 400 nmol l−1 (Supplementary Table 1). Pyrosequencing™ reactions were performed in a PyroMark ID System (Qiagen), according to the manufacturer's instructions, using the PyroMark Gold 96 Reagent Kit (Qiagen). CpG site quantification was performed using Pyro Q-CpG™ methylation software (Qiagen).
Statistical analyses
The cis- and trans-meQTL sites were identified using R package “MatrixeQTL”. The P values were adjusted using Bonferroni method, and cis-meQTLs with false discovery rate (FDR) <1 × 10⁻⁵ and trans-meQTLs with FDR <1 × 10⁻⁶ were identified as meQTLs. Association significance between clinical indexes and gene expression/methylation levels was identified using analysis of variance (ANOVA) test (P < 0.05 being considered as significant). Gene expression comparison between recurrence and nonrecurrence group was performed using Student's t-test, and P < 0.05 was considered as statistically significant.
RESULTS
Methylated meQTLs in PCa
We subjected PCa samples including 419 samples from TCGA to a meQTL analysis using expression levels evaluated via RNA-seq and CpG site methylation levels in CpG island (CGI) regions. Among 20 321 genes, the methylation levels of 485 513 CpG loci were used for meQTL identification. We identified 5852 cis-regulation and 5 156 662 trans-regulation meQTL pairs in our dataset. Cis-regulation pairs included 1717 genes (8.4% of all genes tested) and 4895 corresponding CpG sites, with an FDR (Bonferroni) of <0.01. Among these pairs, 784 genes (45.7%) were regulated by multiple CpG sites, and 1661 CpG sites (33.9%) regulated multiple genes. We noticed that adenosine triphosphate (ATP)-binding cassette subfamily A member 17, pseudogene (ABCA17P), chromosome 11 open reading frame 85 (C11orf85), and cyclic adenosine monophosphate (cAMP) responsive element binding protein 3 like 3 (CREB3L3) were regulated according to the methylation levels of 135, 95, and 93 nearby CpG sites, respectively, which are the top three CpG sites-related genes, suggesting the importance of DNA methylation on these genes. We also found that significantly high numbers of CpG sites in meQTLs were located on 19q13.2–q13.43 (P = 1 × 10⁻¹¹) and 16q22.2–q23.1 (P = 1 × 10⁻¹¹), as shown in Figure 1 and Supplementary Table 2, consistent with previous reports.33,34 According to GATHER (http://gather.genome.duke.edu/), the genes with significant involvement are located at 19q13, 16p13, 11q13, and 17q25 (Supplementary Table 3). Through a GO and pathway analysis using the database for annotation, visualization, and integration discovery (DAVID),35 we discovered that although most GO groups appeared stochastic, several signaling pathways associated with PCa, including the Janus kinase/signal transducer and activator of tran-ions (JAK/STAT), vascular endothelial growth factor (VEGF), and cytokine–cytokine interactions, also are involved (Supplementary Table 4 and 5). Finally, the analysis of trans-regulation pairs identified 18 999 genes (93.5% of tested genes) and 239 808 CpG sites, with an FDR of <1 × 10⁻⁶. In summary, SNP analysis identified the locations of CpG sites and genes within at-risk loci, including the 19q13.2–q13.43 and 16q22.2–q23.1 loci.
Figure 1.

Circos plot showing the CpG density of eQTLs. The density of CpG sites associated with eQTLs (from inside to outside) across the genome. Each wedge represents a chromosome and different colors show different cytobands. In the inner track, from inner to outer, the fold line represents the values. Higher values mean that more meQTL-related CpG sites are over-present in these regions. eQTLs: expression quantitative trait loci; meQTL: methylation quantitative trait loci.
Supplementary Table 2.
The CpG sites were significantly enriched on some cytobands
| Locus | Total genes with annotation | Genes involved | LOG10 P | Genes |
|---|---|---|---|---|
| 19q13 | 110 | 110 | 11.19 | A1BG APOC1 APOE ATP4A BCL2L12 CABP5 CAPN12 CEACAM4 CGB1 COX7A1 CPT1C CRX CYP2A13 CYP2B6 CYP2B7P1 CYP2F1 DBP DLL3 DMPK DPF1 EHD2 FLJ16165 FLJ23569 FLJ26850 FLJ32658 FLJ40125 FLJ40235 FLJ40321 FOSB FUT2 GIPR GPR32 GPR77 GRIN2D HSPB6 IGFL1 IL28B IL29 IL4I1 KCNA7 KCNJ14 KIR3DL3 KLC2L KLK12 KLK13 KLK14 KLK8 KLK9 LGALS14 LIG1 LMTK3 LOC112703 LOC126147 LOC147645 LOC199800 LOC342900 LOC388550 LOC440533 LRRC4B MAG MGC17986 MGC34799 MUC16 MYADM MYBPC2 NALP13 NALP4 NALP9 NANOS2 NAPSB NKG7 NKPD1 NPHS1 NUMBL NYD-SP11 PPP1R13L PPP1R15A PRKCG PRODH2 PSG1 PSG11 PSG3 PSG4 PSG7 R30953_1 RCN3 RPL18 RPS19 RSHL1 RUVBL2 SELV SIPA1L3 SLC6A16 SLC7A10 SPACA4 SPIB SYCN SYT3 TEX101 TIP39 TNNI3 TNNT1 UNQ467 VN1R4 ZFP36 ZNF30 ZNF331 ZNF342 ZNF473 ZNF541 |
| 16p13 | 47 | 47 | 11.19 | C16orf35 C16orf5 C1QTNF8 CASKIN1 DNASE1L2 EME2 FBXL16 FLJ32252 FLJ34512 GNG13 HAGH HAGHL HBA1 HBAP2 HBQ1 HBZ IGFALS IL32 KIAA1924 KREMEN2 LOC146562 LOC283951 LOC342346 LOC400500 MGC2494 MMP25 MPN Magmas NME4 NOD3 NOXO1 PAQR4 PDIP PRM1 PRM2 PRM3 PRSS21 RAB11FIP3 RAB40C RGS11 RNU64 RPL3L SOCS1 SYNGR3 TNP2 TPSD1 WFIKKN1 |
| 11q13 | 46 | 46 | 11.19 | ACY3 AIP B3GNT6 Bles03 CABP2 CABP4 CD5 CFL1 CST6 ESRRA FBXL11 FGF19 FGF3 FGF4 FIBP FLJ33790 FOLR1 FOSL1 GAL3ST3 GIF GPHA2 GPR152 HTATIP KIAA1394 LOC144097 LOC283129 LOC387778 MGC11102 MGC20410 MTL5 NXF OVOL1 SCGB1D1 SCGB1D2 SCYL1 SLC22A12 SLC29A2 SPTBN2 SSSCA1 SUV420H1 TNFRSF19L TSARG6 TSGA10IP TncRNA WNT11 YIF1 |
| 17q25 | 32 | 32 | 11.19 | ANAPC11 CARD14 CBX8 DKFZP434P0316 EVPL EXOC7 FADS6 FASN FLJ31882 FLJ35767 FSCN2 GCGR GRIN2C HCNGP IREM2 LOC147111 LOC255275 LOC284001 LOC92659 MGC29814 OTOP3 PDE6G RAC3 RFNG RNF157 SECTM1 SPHK1 SRP68 USP36 UTS2R WBP2 ZC3HDC5 |
| 17q21 | 37 | 37 | 9.24 | AOC2 C1QL1 CA10 CCR10 DLX3 DLX4 FLJ33318 FLJ40137 FLJ40342 G6PC GCN5L2 GIP GSDM1 HOXB1 HOXB2 HOXB7 HOXB8 IMP-1 IMP5 KRT20 LOC284067 LOC388389 LOC388394 MGC16309 MRPL10 NAGS PHOSPHO1 PLCD3 PNPO PPY PRAC PYY ProSAPiP2 SCAP1 TBX4 TREM4 ZNFN1A3 |
| 19p13 | 61 | 61 | 8.19 | ANKRD24 ANKRD25 APC2 BRUNOL5 C19orf23 C19orf30 CAPS CASP14 CD37 CREB3L3 DF DNAJB1 EMR2 EPOR FLJ11535 FLJ25758 FLJ32416 FLJ35784 FLJ39369 FLJ40365 FLJ45910 FUT5 FUT6 GRIN3B HCN2 IER2 IL27RA ISYNA1 KIAA1086 LOC126536 LOC199675 LOC255809 LOC390874 LRG1 MADCAM1 MBD3L1 MGC15631 MGC17791 MGC23244 MGC24975 MGC39581 NANOS3 NRTN OR10H4 OR1I1 OR1M1 OR7A17 OR7C2 OR7D4 PCP2 PKN1 RAB3A RPL36 SAFB2 SHD SIRT6 THSD6 TIMM13 TMPRSS9 UNC13A VMD2L1 |
| 1q21 | 37 | 37 | 7.18 | ANKRD34 ANXA9 APCS APOA2 AQP10 ATP8B2 C1orf45 CRP FCRH1 FCRH3 FLJ20519 FLJ37964 HAX1 IRTA1 IRTA2 KCNJ9 KCNN3 LCE1A LCE1D LCE2B LCE2C LCE3A LCE3E LCE4A LOC388698 LRRN6D MCSP MUC1 RHBG S100A2 S100A3 SH2D2A SPAP1 SPRR2A SPRR2B SV2A THHL1 |
| 12q13 | 33 | 33 | 5.95 | AMHR2 AQP6 CACNB3 CYP27B1 FMNL3 GEFT HNRPA1 HOXC11 HUMCYT2A IGFBP6 IL23A INHBC ITGB7 K6IRS4 KRT6E KRTHB3 KRTHB5 KRTHB6 LETMD1 MGC17301 MLC1SA NXPH 4 OR10P1 OR6C1 OR6C65 OR6C68 OR6C74 OR9K2 SLC4A8 STAT2 TAC3 WNT10B ZNFN1A4 |
| 11p15 | 43 | 43 | 5.67 | ASCL2 BRSK2 CALCA CNGA4 DKFZp761L1518 HBE1 HBG2 HCCA2 HSD-40 IFITM1 IFITM3 IGF2 IGF2AS KCNQ1DN KRTAP5-6 LDHA LOC387733 LOC439915 MRGX3 MRVI1 MUC2 MUCDHL NALP6 ODF3 OR51B4 OR51B5 OR51B6 OR51D1 OR51F2 OR51I2 OR52A1 OR52E6 OR52E8 OR52K1 OR52N1 OR52N2 OR56A4 OR56B1 SAA3P SYT9 TH USH1C ZDHHC13 |
| 20q13 | 29 | 29 | 5.14 | BHLHB4 C20orf111 C20orf166 C20orf58 C20orf59 C20orf67 CBLN4 DNTTIP1 EDN3 FLJ30313 GATA5 GPR8 HRH3 KCNG1 KCNQ2 LOC198437 MC3R MYT1 NTSR1 PHACTR3 PPGB RIMS4 SGK2 SLC35C2 STMN3 SYCP2 UBE2C WFDC10A WFDC5 |
Supplementary Table 3.
Gene cytogenetics band enrichment loci of methylation quantitative trait loci-related genes according to a gene annotation tool to help explain relationships (http://gather.genome.duke.edu/)
| Annotation | Total genes with annotation | Your genes (with annotation) | Your genes (no annotation) | Genome (with annotation) | Genome (no annotation) | Ln (Bayes factor) | Negative ln (P) | FE: negative ln (P) | FE: negative ln (FDR) |
|---|---|---|---|---|---|---|---|---|---|
| 19q13 | 110 | 110 | 1494 | 857 | 27869 | 24.38 | 11.19 | 31.16 | 25.64 |
| 16p13 | 47 | 47 | 1557 | 307 | 28419 | 11.95 | 11.19 | 18.82 | 13.99 |
| 11q13 | 46 | 46 | 1558 | 320 | 28406 | 9.91 | 11.19 | 16.76 | 12.34 |
| 17q25 | 32 | 32 | 1572 | 184 | 28542 | 8.85 | 11.19 | 15.8 | 11.67 |
| 17q21 | 37 | 37 | 1567 | 276 | 28450 | 5.53 | 9.24 | 12.33 | 8.42 |
| 19p13 | 61 | 61 | 1543 | 598 | 28128 | 4.39 | 8.19 | 10.96 | 7.23 |
| 1q21 | 37 | 37 | 1567 | 306 | 28420 | 3.57 | 7.18 | 10.28 | 6.71 |
| 12q13 | 33 | 33 | 1571 | 277 | 28449 | 2.35 | 5.95 | 9.08 | 5.64 |
| 11p15 | 43 | 43 | 1561 | 410 | 28316 | 2.09 | 5.67 | 8.7 | 5.38 |
| 20q13 | 29 | 29 | 1575 | 240 | 28486 | 1.64 | 5.14 | 8.37 | 5.15 |
FE: Fisher’s exact test; FDR: false discovery rate
Supplementary Table 4.
Methylation quantitative trait loci related gene-enriched gene ontology terms according to database for annotation, visualization, and integration discovery
| Term | Count | Percentage | P | List total | Pop hits | Pop total | Fold enrichment | Bonferroni | Benjamini | FDR |
|---|---|---|---|---|---|---|---|---|---|---|
| GO: 0007186~G-protein coupled receptor protein signaling pathway | 179 | 10.49853372 | 9.80E-19 | 1121 | 1123 | 13528 | 1.923540154 | 3.27E-15 | 3.27E-15 | 1.78E-15 |
| Signal peptide | 399 | 23.40175953 | 4.18E-18 | 1588 | 3250 | 19113 | 1.477637473 | 1.58E-14 | 5.28E-15 | 7.72E-15 |
| Topological domain: Extracellular | 330 | 19.35483871 | 9.83E-14 | 1588 | 2719 | 19113 | 1.460774214 | 3.73E-10 | 9.32E-11 | 1.82E-10 |
| Membrane | 599 | 35.13196481 | 5.76E-06 | 1594 | 6256 | 19235 | 1.155404237 | 0.003759097 | 2.90E-04 | 0.008605043 |
| Cytokine | 34 | 1.994134897 | 1.32E-05 | 1594 | 181 | 19235 | 2.266753087 | 0.008565601 | 6.14E-04 | 0.019654069 |
| GO: 0007267~cell–cell signaling | 76 | 4.457478006 | 1.92E-04 | 1121 | 600 | 13528 | 1.528587571 | 0.472641555 | 0.044676586 | 0.349044181 |
| GO: 0051302~regulation of cell division | 13 | 0.762463343 | 3.35E-04 | 1121 | 47 | 13528 | 3.33790119 | 0.672253793 | 0.063512001 | 0.607711083 |
| Growth factor | 24 | 1.407624633 | 4.48E-04 | 1594 | 131 | 19235 | 2.210771308 | 0.254263894 | 0.010807233 | 0.668115409 |
GO: gene ontology; FDR: false discovery rate
Supplementary Table 5.
Methylation quantitative trait loci-related gene-enriched signaling pathways
| Category | Term | Count | Percentage | P | List total | Pop hits | Pop total | Fold enrichment | Bonferroni | Benjamini | FDR |
|---|---|---|---|---|---|---|---|---|---|---|---|
| KEGG_PATHWAY | hsa04740:Olfactory transduction | 71 | 4.164222874 | 1.22E-09 | 458 | 379 | 5085 | 2.079910359 | 2.14E-07 | 2.14E-07 | 1.49E-06 |
| KEGG_PATHWAY | hsa04080:Neuroactive ligand-receptor interaction | 44 | 2.580645161 | 3.13E-05 | 458 | 256 | 5085 | 1.908262828 | 0.005497044 | 0.00275231 | 0.038425378 |
| KEGG_PATHWAY | hsa04060:Cytokine-cytokine receptor interaction | 44 | 2.580645161 | 5.55E-05 | 458 | 262 | 5085 | 1.864562152 | 0.009719381 | 0.003250347 | 0.068074717 |
| KEGG_PATHWAY | hsa05320:Autoimmune thyroid disease | 12 | 0.703812317 | 0.004747675 | 458 | 51 | 5085 | 2.612381197 | 0.56724373 | 0.188925323 | 5.672613309 |
| KEGG_PATHWAY | hsa00590:Arachidonic acid metabolism | 12 | 0.703812317 | 0.009864494 | 458 | 56 | 5085 | 2.379132876 | 0.825314991 | 0.294574544 | 11.45423332 |
| KEGG_PATHWAY | hsa04610:Complement and coagulation cascades | 13 | 0.762463343 | 0.018625588 | 458 | 69 | 5085 | 2.091797987 | 0.963447888 | 0.423916532 | 20.60338795 |
| KEGG_PATHWAY | hsa04672:Intestinal immune network for IgA production | 10 | 0.586510264 | 0.028282991 | 458 | 49 | 5085 | 2.265840834 | 0.993587821 | 0.513911784 | 29.67691858 |
| KEGG_PATHWAY | hsa04630:Jak-STAT signaling pathway | 22 | 1.290322581 | 0.035933062 | 458 | 155 | 5085 | 1.575855754 | 0.998404616 | 0.552947878 | 36.17726313 |
| KEGG_PATHWAY | hsa05310:Asthma | 7 | 0.410557185 | 0.040786546 | 458 | 29 | 5085 | 2.67994278 | 0.999343725 | 0.557062045 | 40.01015413 |
| KEGG_PATHWAY | hsa04950:Maturity onset diabetes of the young | 6 | 0.351906158 | 0.06779727 | 458 | 25 | 5085 | 2.664628821 | 0.999995696 | 0.70934184 | 57.74731756 |
| KEGG_PATHWAY | hsa04370:VEGF signaling pathway | 12 | 0.703812317 | 0.07000343 | 458 | 75 | 5085 | 1.776419214 | 0.999997164 | 0.686886675 | 58.95815416 |
| KEGG_PATHWAY | hsa04640:Hematopoietic cell lineage | 13 | 0.762463343 | 0.081608456 | 458 | 86 | 5085 | 1.678303036 | 0.999999689 | 0.713092311 | 64.8191755 |
| KEGG_PATHWAY | hsa04664:Fc epsilon RI signaling pathway | 12 | 0.703812317 | 0.087535029 | 458 | 78 | 5085 | 1.708095398 | 0.9999999 | 0.710673264 | 67.50599408 |
FDR: false discovery rate; KEGG: Kyoto Encyclopedia of Genes and Genomes
Gene/CpG methylation and clinical information
To identify the mechanism by which these CpG sites affect carcinogenesis and development, we performed a correlation analysis and an ANOVA between gene expression levels and clinical indexes. The evaluated genes included 20 532 genes from the TCGA database that were evaluated via RNA-seq and correlated with clinical information, including primary and secondary Gleason score, node invasion stage, biochemical recurrence indicators, most recent PSA level, and clinical and pathological primary tumor stages. Each clinical index was associated with a number of genes, as shown in Table 2.
Table 2.
Number of genes identified significantly associated with clinical observations
| Clinical variable | Gene (n) |
|---|---|
| Primary Gleason score | 376 |
| Secondary Gleason score | 13 |
| Gleason score | 726 |
| Nodes examined (entered N stage) | 58 |
| Biochemical recurrence indicator | 14 |
| PSA level | 25 |
| Clinical T stage | 68 |
| Pathological T stage | 96 |
N: node; PSA: prostate-specific antigen; T: tumor
Genes associated with the same clinical information may affect each other. We further performed a similar analysis to compare methylation sites and clinical information and identified 57 719 CpG sites significantly correlated with the aforementioned clinical information (Table 3).
Table 3.
Number of CpG sites significantly associated with clinical observations
| Clinical variable | CpG sites (n) |
|---|---|
| Primary Gleason score | 4087 |
| Secondary Gleason score | 6518 |
| Gleason score | 11 321 |
| Nodes examined (entered N stage) | 2271 |
| Biochemical recurrence indicator | 7667 |
| PSA level | 5350 |
| Clinical T stage | 2583 |
| Pathological T stage | 11 615 |
N: node; PSA: prostate-specific antigen; T: tumor
Methylation sites influence clinical performance by regulating gene expression
A canonical function of DNA methylation is the blockade of transcription factors from binding gene regulatory elements, thus inhibiting gene expression. To reduce the FDR and determine causality, we sought CpG sites that were significantly correlated with gene expression via cis-regulation according to methylated QTLs. These genes were positively correlated further with clinical information (Supplementary Table 6), and the CpG sites also were positively correlated with the same clinical indexes. We identified 92 paired methylated QTLs that fulfilled the aforementioned criteria. Most methylated QTLs were associated with Gleason score; a DAVID-based GO analysis36 revealed that these genes were significantly enriched for DNA repair and cell cytoskeleton. Most of the sites associated with Gleason score were located in 11q13 and 16q13, and their correlated genes included essential meiotic structure-specific endonuclease subunit 2 (EME2), potassium channel tetramerization domain containing 13 (KCTD13), kelch like family member 17 (KLHL17), and WD repeat domain 90 (WDR90). Of these, EME2 is associated with genomic stability maintenance, whereas reports of the other genes in the context of all types of cancer are scarce.
Supplementary Table 6.
CpG sites and gene expression significantly associated with clinical information
| SNPs | Gene | Statistic | P | FDR | Beta | CHR | MAPINFO | Strand | PSA_most_recent_results | P of methyl-clinical | Clinical Type 1 | P gene_exp-clinical | Clinical Type 2 |
|---|---|---|---|---|---|---|---|---|---|---|---|---|---|
| cg09906402 | 8519 | −7.909108707 | 2.35E-14 | 1.99E-10 | −0.002515419 | 11 | 1033236 | R | 2.77E-06 | 0.917349226 | PSA_recent_methyl | 0.917349226 | PSA_recent |
| cg00027499 | 253980 | 4.429630563 | 1.21E-05 | 0.0170886 | 0.000321812 | 16 | 30759507 | F | 0.002535845 | 0.02366169 | gleason_methyl | 0.02366169 | gleason |
| cg00086266 | 339451 | 4.122329189 | 4.53E-05 | 0.048383444 | 0.00021161 | 1 | 1242895 | R | 0.000152682 | 0.128466513 | gleason_methyl | 0.128466513 | gleason |
| cg00112517 | 7153 | 4.263246691 | 2.49E-05 | 0.030359331 | 3.74E-05 | 17 | 37783011 | R | 0.00374 | 0.973106811 | pathological_T_methyl | 0.287392771 | clinical_T.x |
| cg00112517 | 7153 | 4.263246691 | 2.49E-05 | 0.030359331 | 3.74E-05 | 17 | 37783011 | R | 1.15E-05 | 0.620386184 | gleason_methyl | 0.620386184 | gleason |
| cg00112517 | 7153 | 4.263246691 | 2.49E-05 | 0.030359331 | 3.74E-05 | 17 | 37783011 | R | 2.46E-06 | 0.591742547 | primary_gleason_methyl | 0.591742547 | primary_gleason |
| cg00139807 | 253980 | 5.567943716 | 4.62E-08 | 0.000144184 | 5.38E-05 | 16 | 29874869 | F | 0.002535845 | 0.002673337 | gleason_methyl | 0.002673337 | gleason |
| cg00905951 | 5347 | 11.21066444 | 1.13E-25 | 2.40E-21 | 0.000148888 | 16 | 23652875 | F | 0.00174 | 0.189760603 | pathological_T_methyl | 0.130660172 | clinical_T.x |
| cg00905951 | 5347 | 11.21066444 | 1.13E-25 | 2.40E-21 | 0.000148888 | 16 | 23652875 | F | 3.28E-06 | 0.211537011 | gleason_methyl | 0.211537011 | gleason |
| cg00905951 | 5347 | 11.21066444 | 1.13E-25 | 2.40E-21 | 0.000148888 | 16 | 23652875 | F | 6.80E-08 | 0.441059277 | primary_gleason_methyl | 0.441059277 | primary_gleason |
| cg00981594 | 23204 | 4.019791988 | 6.91E-05 | 0.066194509 | 0.000530386 | 16 | 18813271 | R | 0.000118541 | 0.004915781 | gleason_methyl | 0.004915781 | gleason |
| cg00981594 | 23204 | 4.019791988 | 6.91E-05 | 0.066194509 | 0.000530386 | 16 | 18813271 | R | 0.002053963 | 0.010918013 | primary_gleason_methyl | 0.010918013 | primary_gleason |
| cg01110955 | 57524 | −4.866450486 | 1.61E-06 | 0.003217512 | −1.34E-05 | 16 | 1706924 | F | 0.001185047 | 0.765035156 | biochemical_recurrence_methyl | 0.765035156 | biochemical_recurrence |
| cg01110955 | 146330 | −5.156566599 | 3.89E-07 | 0.000937772 | −0.00011792 | 16 | 1706924 | F | 0.000607564 | 0.004459742 | gleason_methyl | 0.004459742 | gleason |
| cg01110955 | 197342 | −5.228939751 | 2.70E-07 | 0.000684276 | −4.10E-05 | 16 | 1706924 | F | 0.000164007 | 0.004459742 | gleason_methyl | 0.004459742 | gleason |
| cg01113246 | 57007 | −3.988105148 | 7.86E-05 | 0.073139644 | −2.10E-05 | 2 | 237033449 | F | 0.005941232 | 0.506264545 | node_methyl | 0.506264545 | node.x |
| cg03054303 | 146330 | 4.233731796 | 2.83E-05 | 0.033499333 | 0.000419375 | 16 | 1662301 | R | 0.000607564 | 0.013219481 | gleason_methyl | 0.013219481 | gleason |
| cg03054303 | 197335 | 4.141616607 | 4.18E-05 | 0.045480898 | 0.000450108 | 16 | 1662301 | R | 3.86E-07 | 0.013219481 | gleason_methyl | 0.013219481 | gleason |
| cg03054303 | 197335 | 4.141616607 | 4.18E-05 | 0.045480898 | 0.000450108 | 16 | 1662301 | R | 0.00121 | 0.205222679 | primary_gleason_methyl | 0.205222679 | primary_gleason |
| cg03228985 | 339451 | −8.097854516 | 6.22E-15 | 5.63E-11 | −8.10E-05 | 1 | 1083642 | F | 0.000152682 | 0.319957573 | gleason_methyl | 0.319957573 | gleason |
| cg03588007 | 10541 | −4.177780095 | 3.59E-05 | 0.040550739 | −0.000156142 | 9 | 100849274 | R | 2.46E-05 | 0.049332958 | gleason_methyl | 0.049332958 | gleason |
| cg03588007 | 10541 | −4.177780095 | 3.59E-05 | 0.040550739 | −0.000156142 | 9 | 100849274 | R | 0.000399 | 0.007561488 | primary_gleason_methyl | 0.007561488 | primary_gleason |
| cg03588007 | 10541 | −4.177780095 | 3.59E-05 | 0.040550739 | −0.000156142 | 9 | 100849274 | R | 0.00478 | 0.461942007 | pathological_T_methyl | 0.461942007 | pathological_T |
| cg03780338 | 2259 | 4.934626959 | 1.16E-06 | 0.002420551 | 1.39E-05 | 13 | 103244558 | F | 2.49E-06 | 0.958792934 | gleason_methyl | 0.958792934 | gleason |
| cg03780338 | 2259 | 4.934626959 | 1.16E-06 | 0.002420551 | 1.39E-05 | 13 | 103244558 | F | 0.00709 | 0.550619929 | primary_gleason_methyl | 0.550619929 | primary_gleason |
| cg04007841 | 283131 | −4.945989784 | 1.10E-06 | 0.002305322 | −0.001312476 | 11 | 65307006 | F | 0.001181542 | 0.300259221 | node_methyl | 0.300259221 | node.x |
| cg04125223 | 9319 | 4.414024306 | 1.29E-05 | 0.018086909 | 1.57E-05 | 5 | 218200 | R | 1.22E-08 | 0.006144373 | gleason_methyl | 0.006144373 | gleason |
| cg04125223 | 9319 | 4.414024306 | 1.29E-05 | 0.018086909 | 1.57E-05 | 5 | 218200 | R | 1.77E-06 | 0.099088812 | primary_gleason_methyl | 0.099088812 | primary_gleason |
| cg04588774 | 57524 | 4.510523012 | 8.42E-06 | 0.012694387 | 7.04E-06 | 16 | 3207967 | R | 0.001185047 | 0.000893246 | biochemical_recurrence_methyl | 0.000893246 | biochemical_recurrence |
| cg04738496 | 57524 | 5.196395311 | 3.19E-07 | 0.000788403 | 1.18E-05 | 16 | 2021690 | R | 0.001185047 | 0.067732981 | biochemical_recurrence_methyl | 0.067732981 | biochemical_recurrence |
| cg04738496 | 197342 | 5.526480395 | 5.77E-08 | 0.00017534 | 3.60E-05 | 16 | 2021690 | R | 0.000164007 | 0.454694526 | gleason_methyl | 0.454694526 | gleason |
| cg04977610 | 253980 | 5.192466243 | 3.25E-07 | 0.000802703 | 8.05E-05 | 16 | 30366665 | R | 0.002535845 | 0.814245385 | gleason_methyl | 0.814245385 | gleason |
| cg05065926 | 286076 | 4.01583131 | 7.03E-05 | 0.067012266 | 1.08E-06 | 8 | 144329806 | F | 0.003055894 | 0.000258271 | gleason_methyl | 0.000258271 | gleason |
| cg05177437 | 7058 | −4.949962791 | 1.08E-06 | 0.002267946 | −5.02E-05 | 6 | 170582289 | F | 5.26E-05 | 0.060200416 | gleason_methyl | 0.060200416 | gleason |
| cg05317498 | 57524 | −4.69690954 | 3.59E-06 | 0.006257313 | −1.21E-05 | 16 | 1425256 | F | 0.001185047 | 0.592952261 | biochemical_recurrence_methyl | 0.592952261 | biochemical_recurrence |
| cg05317498 | 146330 | −5.773151395 | 1.52E-08 | 5.30E-05 | −0.000122313 | 16 | 1425256 | F | 0.000607564 | 0.651898021 | gleason_methyl | 0.651898021 | gleason |
| cg05317498 | 197335 | −5.863174643 | 9.25E-09 | 3.39E-05 | −0.00013601 | 16 | 1425256 | F | 3.86E-07 | 0.651898021 | gleason_methyl | 0.651898021 | gleason |
| cg05317498 | 197342 | −5.323550283 | 1.67E-07 | 0.000447261 | −3.89E-05 | 16 | 1425256 | F | 0.000164007 | 0.651898021 | gleason_methyl | 0.651898021 | gleason |
| cg05317498 | 197335 | −5.863174643 | 9.25E-09 | 3.39E-05 | −0.00013601 | 16 | 1425256 | F | 0.00121 | 0.380661447 | primary_gleason_methyl | 0.380661447 | primary_gleason |
| cg05970437 | 399664 | 4.11905522 | 4.59E-05 | 0.048902771 | 7.31E-05 | 19 | 1864622 | R | 0.001667999 | 0.008596126 | gleason_methyl | 0.008596126 | gleason |
| cg06758143 | 79000 | 4.814460112 | 2.07E-06 | 0.003967388 | 2.90E-06 | 1 | 26798177 | R | 0.00131 | 0.391977245 | pathological_T_methyl | 0.085384829 | clinical_T.x |
| cg06758143 | 79000 | 4.814460112 | 2.07E-06 | 0.003967388 | 2.90E-06 | 1 | 26798177 | R | 4.95E-05 | 0.012484752 | gleason_methyl | 0.012484752 | gleason |
| cg06758143 | 79000 | 4.814460112 | 2.07E-06 | 0.003967388 | 2.90E-06 | 1 | 26798177 | R | 5.34E-09 | 0.912885436 | primary_gleason_methyl | 0.912885436 | primary_gleason |
| cg07008945 | 339451 | 3.952807907 | 9.07E-05 | 0.080922794 | 0.00028418 | 1 | 955720 | F | 0.000152682 | 0.205918508 | gleason_methyl | 0.205918508 | gleason |
| cg08861556 | 197335 | 4.176276659 | 3.61E-05 | 0.040719792 | 0.000175177 | 16 | 850614 | R | 3.86E-07 | 0.007086157 | gleason_methyl | 0.007086157 | gleason |
| cg08861556 | 9727 | 4.578985236 | 6.18E-06 | 0.009861319 | 0.000240103 | 16 | 850614 | R | 4.31E-07 | 0.007086157 | gleason_methyl | 0.007086157 | gleason |
| cg08861556 | 8786 | 4.711802234 | 3.35E-06 | 0.005932623 | 0.000258129 | 16 | 850614 | R | 0.000382769 | 0.007086157 | gleason_methyl | 0.007086157 | gleason |
| cg08861556 | 197335 | 4.176276659 | 3.61E-05 | 0.040719792 | 0.000175177 | 16 | 850614 | R | 0.00121 | 0.266894552 | primary_gleason_methyl | 0.266894552 | primary_gleason |
| cg10286829 | 2491 | 4.705099824 | 3.46E-06 | 0.006074553 | 1.66E-06 | X | 100913838 | F | 5.02E-06 | 0.590714131 | gleason_methyl | 0.590714131 | gleason |
| cg10286829 | 2491 | 4.705099824 | 3.46E-06 | 0.006074553 | 1.66E-06 | X | 100913838 | F | 0.000107 | 0.685867114 | primary_gleason_methyl | 0.685867114 | primary_gleason |
| cg10498434 | 7153 | 4.56601381 | 6.55E-06 | 0.010356325 | 2.83E-05 | 17 | 37783488 | F | 0.00374 | 0.029055459 | pathological_T_methyl | 0.088721131 | clinical_T.x |
| cg10498434 | 7153 | 4.56601381 | 6.55E-06 | 0.010356325 | 2.83E-05 | 17 | 37783488 | F | 1.15E-05 | 0.970155723 | gleason_methyl | 0.970155723 | gleason |
| cg10498434 | 7153 | 4.56601381 | 6.55E-06 | 0.010356325 | 2.83E-05 | 17 | 37783488 | F | 2.46E-06 | 0.72449589 | primary_gleason_methyl | 0.72449589 | primary_gleason |
| cg10705488 | 339451 | 6.488035843 | 2.47E-10 | 1.22E-06 | 0.000446796 | 1 | 1550648 | R | 0.000152682 | 0.039983988 | gleason_methyl | 0.039983988 | gleason |
| cg11574970 | 4053 | 4.23776505 | 2.78E-05 | 0.03309595 | 9.23E-05 | 14 | 75469471 | F | 0.003138501 | 0.051219574 | gleason_methyl | 0.051219574 | gleason |
| cg11847126 | 339451 | −8.156421723 | 4.10E-15 | 3.77E-11 | −4.28E-05 | 1 | 1248233 | F | 0.000152682 | 0.985911022 | gleason_methyl | 0.985911022 | gleason |
| cg11855022 | 57047 | 4.473969431 | 9.92E-06 | 0.014580089 | 5.27E-07 | 3 | 145968700 | F | 0.0039 | 0.539977096 | node_methyl | 0.539977096 | node.x |
| cg12431977 | 643866 | 5.689476523 | 2.40E-08 | 7.99E-05 | 2.52E-05 | 14 | 24769227 | R | 0.002053472 | 0.001252535 | gleason_methyl | 0.001252535 | gleason |
| cg13444392 | 677770 | −5.585073988 | 4.22E-08 | 0.000132899 | −6.71E-06 | 4 | 1608283 | R | 7.19E-09 | 0.003853796 | node_methyl | 0.003853796 | node.x |
| cg13508391 | 2305 | 4.351759854 | 1.70E-05 | 0.022508505 | 0.000516527 | 12 | 3068378 | R | 0.000484124 | 0.097979899 | primary_gleason_methyl | 0.097979899 | primary_gleason |
| cg13917964 | 222161 | 4.47316485 | 9.95E-06 | 0.014614108 | 3.78E-05 | 7 | 30635712 | F | 4.45E-05 | 0.955004144 | gleason_methyl | 0.955004144 | gleason |
| cg13917964 | 222161 | 4.47316485 | 9.95E-06 | 0.014614108 | 3.78E-05 | 7 | 30635712 | F | 0.00731 | 0.239622641 | primary_gleason_methyl | 0.239622641 | primary_gleason |
| cg14820176 | 80198 | 4.480408126 | 9.64E-06 | 0.014229571 | 6.00E-05 | 11 | 66346739 | FALSE | 0.00373 | 0.621062934 | secondary_gleason_methyl | 0.621062934 | secondary_gleason |
| cg14820176 | 1072 | 4.873586553 | 1.56E-06 | 0.003120113 | 0.002576989 | 11 | 66346739 | F | 0.005005142 | 0.700418497 | gleason_methyl | 0.700418497 | gleason |
| cg14820176 | 80198 | 4.480408126 | 9.64E-06 | 0.014229571 | 6.00E-05 | 11 | 66346739 | F | 7.30E-10 | 0.700418497 | gleason_methyl | 0.700418497 | gleason |
| cg14820176 | 80198 | 4.480408126 | 9.64E-06 | 0.014229571 | 6.00E-05 | 11 | 66346739 | F | 0.00108 | 0.990656757 | primary_gleason_methyl | 0.990656757 | primary_gleason |
| cg15968307 | 784 | 4.81358966 | 2.08E-06 | 0.003981341 | 1.54E-05 | 12 | 48577213 | R | 1.51E-05 | 0.103009304 | gleason_methyl | 0.103009304 | gleason |
| cg16638425 | 57524 | −4.095229532 | 5.07E-05 | 0.052583939 | −1.11E-05 | 16 | 2946805 | F | 0.001185047 | 0.394681318 | biochemical_recurrence_methyl | 0.394681318 | biochemical_recurrence |
| cg16712664 | 253980 | 4.586041366 | 5.98E-06 | 0.009598823 | 0.000347931 | 16 | 30787355 | F | 0.002535845 | 0.815286106 | gleason_methyl | 0.815286106 | gleason |
| cg17398515 | 25897 | 4.180309201 | 3.55E-05 | 0.040217881 | 1.34E-05 | 8 | 102092795 | R | 0.000304168 | 0.378109272 | gleason_methyl | 0.378109272 | gleason |
| cg17696563 | 50636 | −4.584466672 | 6.02E-06 | 0.009657957 | −0.000113607 | 2 | 242756362 | R | 0.000184501 | 0.082855296 | primary_gleason_methyl | 0.082855296 | primary_gleason |
| cg18123911 | 339451 | 10.89872597 | 1.66E-24 | 3.32E-20 | 0.000298968 | 1 | 1550773 | F | 0.000152682 | 0.670851582 | gleason_methyl | 0.670851582 | gleason |
| cg18225536 | 643866 | 4.89908745 | 1.38E-06 | 0.002805114 | 0.000126544 | 14 | 24658182 | F | 0.002053472 | 0.493252557 | gleason_methyl | 0.493252557 | gleason |
| cg19092396 | 339451 | 3.930642765 | 9.92E-05 | 0.086345169 | 7.16E-06 | 1 | 1143751 | F | 0.000152682 | 0.059898103 | gleason_methyl | 0.059898103 | gleason |
| cg19165854 | 23251 | 4.18198955 | 3.52E-05 | 0.03999685 | 3.99E-06 | 15 | 79725126 | R | 0.004028996 | 0.17701659 | biochemical_recurrence_methyl | 0.17701659 | biochemical_recurrence |
| cg19414302 | 339451 | −4.48755798 | 9.33E-06 | 0.01387107 | −2.41E-05 | 1 | 1234354 | F | 0.000152682 | 0.07787519 | gleason_methyl | 0.07787519 | gleason |
| cg19901381 | 1609 | 4.267056743 | 2.45E-05 | 0.029992356 | 6.86E-06 | 4 | 1577971 | F | 0.002992571 | 0.147706171 | gleason_methyl | 0.147706171 | gleason |
| cg21908287 | 57657 | 4.06324886 | 5.78E-05 | 0.0579969 | 1.14E-05 | 1 | 155225385 | R | 2.61E-06 | 0.867305735 | gleason_methyl | 0.867305735 | gleason |
| cg21908287 | 57657 | 4.06324886 | 5.78E-05 | 0.0579969 | 1.14E-05 | 1 | 155225385 | R | 0.00255 | 0.954639475 | primary_gleason_methyl | 0.954639475 | primary_gleason |
| cg22062432 | 2324 | 5.217476829 | 2.86E-07 | 0.000720528 | 1.36E-05 | 5 | 180634502 | F | 0.009901839 | 0.402124768 | gleason_methyl | 0.402124768 | gleason |
| cg23058863 | 643866 | 5.449034648 | 8.68E-08 | 0.000250473 | 3.73E-05 | 14 | 24610866 | F | 0.002053472 | 0.005346928 | gleason_methyl | 0.005346928 | gleason |
| cg24378253 | 339451 | −8.425695272 | 5.87E-16 | 5.91E-12 | −0.000298151 | 1 | 1017383 | R | 0.000152682 | 0.046752456 | gleason_methyl | 0.046752456 | gleason |
SNP: single nucleotide polymorphism; FDR: false discovery rate; CHR: chromosome; PSA: prostate-specific antigen
We identified that calcium/calmodulin-dependent serine protein kinase interacting protein 1 (CASKIN1) was enriched with CpGs and CASKIN1 itself was also significantly associated with genes related to biochemical cancer recurrence (P = 0.001; Figure 2). According to the methylated QTL algorithm, these CpG sites’ methylation levels may act as cis-regulators of CASKIN1, suggesting that the methylation of nearby CpG sites probably influences the expression of CASKIN1 and thus affects the recurrence in these cases.
Figure 2.
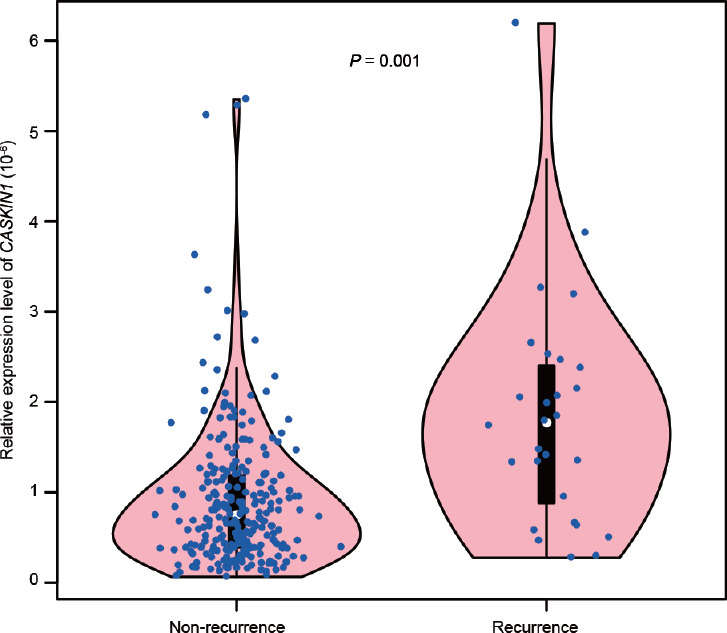
The violin plot of relative expression of CASKIN1 between biomedical recurrence and nonrecurrence subgroup evaluated by TCGA. The expression of CASKIN1 is significantly different between recurrence and nonrecurrence group (P = 0.001). CASKIN1: calcium/calmodulin-dependent serine protein kinase interacting protein 1; TCGA: The Cancer Genome Atlas.
Methylated QTLs in PCa-related genes
An analysis of these regulation pairs should include the regulatory status in both prostate and PCa cells. To extract useful information for later analysis, we selected meQTLs concerning genes associated with PCa genesis and metastasis.37,38,39,40,41,42 Ninety-two genes were used for meQTL selection. In our meQTL dataset, 38 cis-regulated meQTLs existed near these sites, and 1753 trans-regulated eQTLs were identified. Genes of interest among cis-eQTLs included alanyl aminopeptidase, membrane (ANPEP), activating transcription factor 3 (ATF3), B cell leukemia/lymphoma 2 (BCL2) associated X (BAX), and early growth response 1/3 (EGR1/3), suggesting that the expression levels of these PCa-related genes are regulated by the methylation levels of nearby CpG sites. For further analysis, these gene and methylation findings were validated in 70 pairs of clinical tumorous and nontumorous tissue samples. The patients from whom samples were collected were classified as low, moderate, and high risk according to Gleason score, mean PSA, and tumor/node/metastasis (TNM) clinical staging; a variety of tissues from different risk levels were subjected to methylation quantification via pyrosequencing™.
In our results, the false discovery rate was relatively high because we did not detect the expression levels of the selected meQTL-related genes. However, we still detected several differences in methylation sites between normal and tumorous samples (Figure 3). These sites included meQTL pairs involving FosB proto-oncogene, activator protein-1 (AP-1) transcription factor subunit (FOSB), ANPEP, and ras-related dexamethasone-induced 1 (RASD1). In tumorous samples, the methylation levels at these sites, particularly cg20664996 near RASD1, were low. We also noticed that in high- and moderate-risk samples, the methylation levels at this site reached 0. RASD1 has been reported as an apoptosis- and ras-related gene that prevents aberrant cell growth in several cell lines.43 In short, an epigenetic association study of clinical indexes detected risk loci and pyrosequencing for site validation. Although the number of DNA methylation-regulated genes across PCa samples is a small proportion, the associated genes play essential roles in PCa carcinogenesis.
Figure 3.

Four CpG loci that were significantly differently methylated according to the validated dataset. In each CpG locus, the left dots indicate the relative methylation level of the normal tissues and the right is the corresponding cancerous tissues, the P values between the normal tissues and cancerous tissues are shown from left to right.
DISCUSSION
DNA methylation is one among the most common and well-characterized epigenetic changes in PCa.5,6,7,8,9,10,11 The importance of large-scale methylome studies has increased in biomedical fields, and high-throughput sequencing technologies promise sensitive, quantitative, and high-resolution large-scale DNA methylation analyses. A genome-wide association study (GWAS) based on QTL analysis is an effective method with which cancer-related genes and risk loci throughout the genome can be studied;14,15,44 similarly, the usefulness of methylation-based GWAS has been reported.45 However, despite reports on the association of DNA methylation with carcinogenesis and development in the prostate,46,47,48,49 genome-wide analyses of the associations between gene expression, DNA methylation, and clinical information related to PCa continue to yield vague results. Here, we utilized TCGA to obtain DNA methylation data from more than 400 000 CpG sites, expression levels of over 20 000 genes, and clinical indexes for 419 PCa samples, to perform a methylated QTL analysis in which we identified 5852 cis-regulating pairs comprising 1712 genes. Compared with previous breast cancer studies, only 0.8% of genes associated with PCa are affected by DNA methylation, and these genes exhibit significant involvement in several pathways that previously have been reported to play important roles in PCa genesis, including the JAK/STAT and VEGF pathways.50,51 We also noticed that the associated genes and locations were significantly enriched at several genome locations, including 19q13.2–q13.43 and 16q22.2–q23.1. As these are cis-interactions within 1 MB, the regulated genes also are enriched at these sites. Previous reports of SNPs and PCa noted an association between SNPs at 19q13 and PCa risk.52 Another GWAS of a Chinese population demonstrated 19q13 as a novel risk locus for PCa,33 and a decade-long study detected chromosomal deletion and gene suppression at 16q22 in PCa.53 It was worth noting that this region was reported to show a loss of heterogeneity in breast cancer.54 In addition to somatic mutations, SNPs, and copy number variations, our data suggest that DNA methylation may also influence PCa genesis and probably plays important roles in this process by regulating the transcription of this gene nexus.
Although a previous study based on eQTL algorithms aimed to define the relationships between genomic, epigenomic, and transcriptomic changes,26,31 the link between the data obtained and clinical information remains unclear. Heyn et al.55 reported a TCGA QTL analysis using 13 tumor types from TCGA, including PCa, but their study lacks correlations to PCa-specific clinical variables such as Gleason score and PSA. Their data sets (cancer samples and adjacent normal tissues) did not include control subjects without the disease; future studies are needed to determine if GWAS risk alleles exhibit similar relationships in cancer-unrelated donors.
To further investigate the relationships of DNA methylation and gene expression with clinical information, we performed an association study between the three pairs (expression-methylation, methylation-clinical information, and clinical information-expression) and identified 92 genes regulated by CpG site methylation. Furthermore, we associated the expression levels of these genes with clinical information, particularly the Gleason score. GO analysis revealed that these 92 genes were significantly enriched with respect to DNA repair and cell cytoskeleton, suggesting that the genes probably direct the development and prognosis of PCa. Of these genes, we noted that EME2 previously was reported to maintain genomic stability,56 whereas the roles of the other genes were poorly elucidated. A locus analysis of these 92 genes demonstrated significant enrichment at 11q13 (P = 0.008, 3 genes) and 16q13 (P < 0.0001, 6 genes). The genes identified were enriched according to an in-house R script of the hypergeometric distribution, using the genes assayed for meQTLs as background. Enriched genomic loci with P < 0.01 were identified, and some genes associated with the mQTL were significantly enriched for DNA repair and cell cytoskeleton. Most of the sites associated with Gleason score were in 11q13 and 16q13, and their correlated genes included EME2,56 KCTD13,57 KLHL17,58 and WDR90.59 These special genes played critical roles in the biological and pathological characteristics of an organism.
Studies based on SNPs or somatic mutation profiling have shown that 11q13 and 16q13 loci are associated with aggressiveness, invasion, and poor prognosis of PCa. Our results show that epigenetic alterations in these regions are associated with genes considered necessary for the progression of PCa and suggest that methylation at 11q13 and 16q13 loci is essential to PCa progression. We were the first to prove that CASKIN1 was enriched with CpGs, and CASKIN1 itself was also significantly associated with genes related to biochemical cancer recurrence. Although the mechanism of how CASKIN1 affects PCa is unclear, its interacting protein, CASK has been associated with survival of patients with colorectal cancer.60
For validation, we collected 70 clinical tissue samples from 2014 to 2017. Although these patients are Asian, we used the 2020 National Comprehensive Cancer Network (NCCN) guidelines as a criterion to classify distinct groups. Some studies suggested racial differences in PCa. Non-Whites were associated with a significantly higher likelihood of presenting with high-risk PCa (22.9% of Hispanics, 23.8% of Blacks, and 23.3% of those of other races compared with 19.0% of Whites; all P < 0.001).61 Age-adjusted PCa mortality in black men was more than double that of white men (42.0/100 000 vs 18.7/100 000). Asian men had a lower incidence of PCa and death than white men. Chinese and Japanese men have a relatively low risk of PCa than their European and North American counterparts.62
The method we describe is based on detecting methylation and expression differences between samples of PCa. Therefore, it aims to identify correlations that occur within particular subsets of cases. For example, we found that some genes of interest among cis-eQTLs have played essential roles in PCa, including ANPEP,63,64 ATF3,65,66 BAX,67 and EGR1/3.68 These genes are involved in tumorigenesis, metastasis, and recurrence of PCa.
We selected 30 high-confidence CpG sites that have been reported to associate with PCa-related genes and evaluated methylation at related CpG sites (Supplementary Table 7). Despite a relatively high FDR, we determined differences in the methylation levels of several CpG sites between cancerous and noncancerous tissues (associated genes included ANPEP and FOSB). FDR is a tremendous concern for this study. To reduce FDR, we first enrolled the samples using the inclusion criteria described in the methods part. Second, we selected the P-value of meQTL pairs as 1 × 10⁻⁵ instead of 0.01/0.05. Last, the FDR values were calculated using Bonferroni, which is the most rigorous method available, and 0.01 was used for cutoff.
Supplementary Table 7.
The details of selected 30 high-confidence CpG sites via methylation quantitative trait loci reported to associate with prostate cancer-related genes
| Gene | Symbol | Chromosome | SNPs | Position | FDR | P | References |
|---|---|---|---|---|---|---|---|
| 2354 | FOSB | chr16 | cg02213678 | 85112535 | 3.03E-44 | 3.66E-49 | 1, 2 |
| 7356 | SCGB1A1 | chr11 | cg02950427 | 61323284 | 7.99E-03 | 4.82E-06 | 3, 4 |
| 94025 | MUC16 | chr19 | cg04744134 | 8408128 | 1.72E-14 | 1.36E-18 | 5, 6 |
| 3569 | IL-6 | chr7 | cg05407490 | 23749667 | 4.35E-05 | 1.22E-08 | 7 8 9 |
| 11197 | WIF1 | chr12 | cg05754508 | 65672531 | 5.10E-04 | 1.94E-07 | 10 11 12 13 |
| 2354 | FOSB | chr19 | cg06577658 | 46296270 | 9.10E-03 | 5.62E-06 | 1, 2 |
| 7273 | TTN | chr22 | cg08170140 | 31090747 | 1.62E-32 | 3.26E-37 | 14 15 16 |
| 94025 | MUC16 | chr19 | cg08341673 | 8408202 | 1.28E-03 | 5.56E-07 | 5, 6 |
| 7356 | SCGB1A1 | chr11 | cg08360511 | 61322922 | 9.72E-04 | 4.06E-07 | 3, 4 |
| 23600 | AMACR | chr5 | cg09093477 | 34839189 | 4.50E-02 | 4.11E-05 | 17 18 19 |
| 7356 | SCGB1A1 | chr13 | cg09207578 | 114781949 | 5.43E-21 | 2.09E-25 | 3, 4 |
| 27232 | GNMT | chr6 | cg09804858 | 42397121 | 7.66E-04 | 3.08E-07 | 20 21 22 23 |
| 51655 | RASD1 | chr17 | cg12918275 | 18150954 | 2.28E-04 | 7.79E-08 | 24, 25 |
| 27232 | GNMT | chr6 | cg14338887 | 42928500 | 1.69E-08 | 2.57E-12 | 20,21,2223 |
| 290 | ANPEP | chr15 | cg14927321 | 89491614 | 8.79E-03 | 5.40E-06 | 26 27 28 |
| 7356 | SCGB1A1 | chr11 | cg15492820 | 61323113 | 6.78E-06 | 1.60E-09 | 3, 4 |
| 290 | ANPEP | chr15 | cg15850918 | 89900741 | 1.28E-02 | 8.47E-06 | 26 27 28 |
| 4852 | NPY | chr19 | cg15854606 | 18654548 | 8.51E-22 | 3.09E-26 | 29 30 31 32 |
| 3552 | IL-1A | chr2 | cg18668836 | 113103184 | 1.79E-03 | 8.22E-07 | 33, 34 |
| 6262 | RYR2 | chr1 | cg18770350 | 236849966 | 4.31E-02 | 3.90E-05 | 35, 36 |
| 2354 | FOSB | chr18 | cg19283427 | 29523380 | 6.27E-38 | 9.96E-43 | 1, 2 |
| 51655 | RASD1 | chr17 | cg20664996 | 17359821 | 2.22E-02 | 1.67E-05 | 24, 25 |
| 94025 | MUC16 | chr19 | cg22886512 | 8408083 | 7.60E-09 | 1.10E-12 | 5, 6 |
| 5179 | PENK | chr8 | cg23139584 | 56987506 | 1.56E-03 | 6.98E-07 | 37 38 39 |
| 2354 | FOSB | chr2 | cg23158051 | 65454692 | 4.02E-39 | 6.05E-44 | 1, 2 |
| 1960 | EGR3 | chr8 | cg23303108 | 23083578 | 1.26E-02 | 8.31E-06 | 8, 40 |
| 2354 | FOSB | chr22 | cg23410069 | 20287622 | 2.15E-39 | 3.20E-44 | 1, 2 |
| 1960 | EGR3 | chr8 | cg24278165 | 23083551 | 1.83E-02 | 1.31E-05 | 8, 40 |
| 84419 | C15orf48 | chr11 | cg25902616 | 47789193 | 3.59E-16 | 2.02E-20 | 41 42 43 |
| 7356 | SCGB1A1 | chrX | cg27069132 | 135991543 | 3.93E-21 | 1.50E-25 | 3, 4 |
PCa: prostate cancer; SNP: single nucleotide polymorphism; FDR: false discovery rate; FOSB: FosB proto-oncogene, activator protein-1 (AP-1) transcription factor subunit; SCGB1A1: secretoglobin family 1A member 1; MUC16: mucin 16; IL-6: interleukin 6; WIF1: Wnt inhibitory factor 1; TTN: titin; AMACR: alpha-methylacyl-coenzyme A racemase; GNMT: glycine N-methyltransferase; RASD1: ras-related dexamethasone induced 1; ANPEP: alanyl aminopeptidase, membrane; NPY: neuropeptide Y; IL-1A: interleukin 1A; RYR2: ryanodine receptor 2; PENK: proenkephalin; EGR3: early growth response 3; C15orf48: chromosome 15 open reading frame 48
We further identified a correlation between the Gleason score and methylation level at cg20664996, a CpG location associated with RASD1 expression, according to an eQTL analysis. RASD1 is a 30 kDa G-protein that belongs to the Ras superfamily of small GTPases. Several robustly upregulated bicalutamide-dependent genes were identified by micro-array in LNCaP-ARW741L cells that were not significantly enhanced by dihydrotestosterone (DHT) in the LNCaP-LacZ line, including RASD1.69 Liu et al.70 showed that formononetin inhibited cell proliferation and induced apoptosis in DU-145 cells throughout the RASD1/mitogen-activated protein kinase (MAPK)/BAX pathway in PCa. The selected high-confidence CpG sites are reported to associate with some PCa-related genes, including FOSB,71 secretoglobin family 1A member 1 (SCGB1A1),72 mucin 16 (MUC16),73 alpha-methylacyl-coenzyme A racemase (AMACR),74 and glycine N-methyltransferase (GNMT).75 Emerging evidence has shown that these genes may be useful diagnostic and prognostic biomarkers for PCa.
CONCLUSIONS
We demonstrated that novel meQTL pairs were associated with PCa, and for the first time, we identified the locations of CpG sites and genes within at-risk loci, including the 19q13.2–q13.43 and 16q22.2–q23.1 loci. We further used pyrosequencing™ for validation and identified several genes that may impact the development and prognosis of PCa.
AUTHOR CONTRIBUTIONS
QL conceived and participated in its design, searched databases, and extracted and assessed studies. QL and GL carried out the statistical analysis and interpretation of data and drafted the main manuscript. QL and DTM prepared the tables and figures. QL, YTX, and RMW prepared the figures and supplementary tables. QL, JK, and JQ participated in the conceptualization and design of the manuscript, performed the selection of studies, and drafted the manuscript. All authors reviewed and approved the final manuscript.
COMPETING INTERESTS
All authors declare no competing interests.
ACKNOWLEDGMENTS
We thank all the study participants. This study was supported by the Projects of National Science Foundation of China (No. 81070600 and 81570684) and Projects of the Shanghai Committee of Science and Technology, China (No. 14430720800, 134119a0600, and 11ZR1424100).
Supplementary Information is linked to the online version of the paper on the Asian Journal of Andrology website.
REFERENCES
- 1.Siegel RL, Miller KD, Jemal A. Cancer statistics, 2020. CA Cancer J Clin. 2020;70:7–30. doi: 10.3322/caac.21590. [DOI] [PubMed] [Google Scholar]
- 2.Chen W, Zheng R, Baade PD, Zhang S, Zeng H, et al. Cancer statistics in China, 2015. CA Cancer J Clin. 2016;66:115–32. doi: 10.3322/caac.21338. [DOI] [PubMed] [Google Scholar]
- 3.Hanahan D, Weinberg RA. The hallmarks of cancer. Cell. 2000;100:57–70. doi: 10.1016/s0092-8674(00)81683-9. [DOI] [PubMed] [Google Scholar]
- 4.Nelson WG, Yegnasubramanian S, Agoston AT, Bastian PJ, Lee BH, et al. Abnormal DNA methylation, epigenetics, and prostate cancer. Front Biosci. 2007;12:4254–66. doi: 10.2741/2385. [DOI] [PubMed] [Google Scholar]
- 5.Aryee MJ, Liu W, Engelmann JC, Nuhn P, Gurel M, et al. DNA methylation alterations exhibit intraindividual stability and interindividual heterogeneity in prostate cancer metastases. Sci Transl Med. 2013;5:169ra10. doi: 10.1126/scitranslmed.3005211. [DOI] [PMC free article] [PubMed] [Google Scholar]
- 6.Yang M, Park JY. DNA methylation in promoter region as biomarkers in prostate cancer. Methods Mol Biol. 2012;863:67–109. doi: 10.1007/978-1-61779-612-8_5. [DOI] [PMC free article] [PubMed] [Google Scholar]
- 7.Li LC, Okino ST, Dahiya R. DNA methylation in prostate cancer. Biochim Biophys Acta. 2004;1704:87–102. doi: 10.1016/j.bbcan.2004.06.001. [DOI] [PubMed] [Google Scholar]
- 8.Formosa A, Lena AM, Markert EK, Cortelli S, Miano R, et al. DNA methylation silences miR-132 in prostate cancer. Oncogene. 2013;32:127–34. doi: 10.1038/onc.2012.14. [DOI] [PubMed] [Google Scholar]
- 9.Albany C, Alva AS, Aparicio AM, Singal R, Yellapragada S, et al. Epigenetics in prostate cancer. Prostate Cancer 2011. 2011 doi: 10.1155/2011/580318. 580318. [DOI] [PMC free article] [PubMed] [Google Scholar]
- 10.Truong M, Yang B, Wagner J, Desotelle J, Jarrard DF. Analysis of promoter non-CG methylation in prostate cancer. Epigenomics. 2013;5:65–71. doi: 10.2217/epi.12.67. [DOI] [PMC free article] [PubMed] [Google Scholar]
- 11.Feinberg AP, Tycko B. The history of cancer epigenetics. Nat Rev Cancer. 2004;4:143–53. doi: 10.1038/nrc1279. [DOI] [PubMed] [Google Scholar]
- 12.Jones PA, Baylin SB. The fundamental role of epigenetic events in cancer. Nat Rev Genet. 2002;3:415–28. doi: 10.1038/nrg816. [DOI] [PubMed] [Google Scholar]
- 13.Mah WC, Lee CG. DNA methylation: potential biomarker in hepatocellular carcinoma. Biomark Res. 2014;2:5. doi: 10.1186/2050-7771-2-5. [DOI] [PMC free article] [PubMed] [Google Scholar]
- 14.Wei SH, Balch C, Paik HH, Kim YS, Baldwin RL, et al. Prognostic DNA methylation biomarkers in ovarian cancer. Clin Cancer Res. 2006;12:2788–94. doi: 10.1158/1078-0432.CCR-05-1551. [DOI] [PubMed] [Google Scholar]
- 15.Liao Y, Xu K. Epigenetic regulation of prostate cancer: the theories and the clinical implications. Asian J Androl. 2019;21:279–90. doi: 10.4103/aja.aja_53_18. [DOI] [PMC free article] [PubMed] [Google Scholar]
- 16.Rodriguez-Paredes M, Esteller M. Cancer epigenetics reaches mainstream oncology. Nat Med. 2011;17:330–9. doi: 10.1038/nm.2305. [DOI] [PubMed] [Google Scholar]
- 17.Wang Y, Jadhav RR, Liu J, Wilson D, Chen Y, et al. Roles of distal and genic methylation in the development of prostate tumorigenesis revealed by genome-wide DNA methylation analysis. Sci Rep. 2016;6:22051. doi: 10.1038/srep22051. [DOI] [PMC free article] [PubMed] [Google Scholar]
- 18.Gilad Y, Rifkin SA, Pritchard JK. Revealing the architecture of gene regulation: the promise of eQTL studies. Trends Genet. 2008;24:408–15. doi: 10.1016/j.tig.2008.06.001. [DOI] [PMC free article] [PubMed] [Google Scholar]
- 19.Bryois J, Buil A, Evans DM, Kemp JP, Montgomery SB, et al. Cis and trans effects of human genomic variants on gene expression. PLoS Genet. 2014;10:e1004461. doi: 10.1371/journal.pgen.1004461. [DOI] [PMC free article] [PubMed] [Google Scholar]
- 20.Westra H, Peters MJ, Esko T, Yaghootkar H, Schurmann C, et al. Systematic identification of trans eQTLs as putative drivers of known disease associations. Nat Genet. 2013;45:1238–43. doi: 10.1038/ng.2756. [DOI] [PMC free article] [PubMed] [Google Scholar]
- 21.Huan T, Joehanes R, Song C, Peng F, Guo Y, et al. Genome-wide identification of DNA methylation QTLs in whole blood highlights pathways for cardiovascular disease. Nat Commun. 2019;10:4267. doi: 10.1038/s41467-019-12228-z. [DOI] [PMC free article] [PubMed] [Google Scholar]
- 22.Gupta R, van Dongen J, Fu Y, Abdellaoui A, Tyndale RF, et al. Epigenome-wide association study of serum cotinine in current smokers reveals novel genetically driven loci. Clin Epigenetics. 2019;11:1. doi: 10.1186/s13148-018-0606-9. [DOI] [PMC free article] [PubMed] [Google Scholar]
- 23.Gong J, Wan H, Mei S, Ruan H, Zhang Z, et al. Pancan-meQTL: a database to systematically evaluate the effects of genetic variants on methylation in human cancer. Nucleic Acids Res. 2019;47:D1066–72. doi: 10.1093/nar/gky814. [DOI] [PMC free article] [PubMed] [Google Scholar]
- 24.Li Q, Seo JH, Stranger B, McKenna A, Pe’Er I, et al. Integrative eQTL-based analyses reveal the biology of breast cancer risk loci. Cell. 2013;152:633–41. doi: 10.1016/j.cell.2012.12.034. [DOI] [PMC free article] [PubMed] [Google Scholar]
- 25.Thibodeau SN, French AJ, McDonnell SK, Cheville J, Middha S, et al. Identification of candidate genes for prostate cancer-risk SNPs utilizing a normal prostate tissue eQTL data set. Nat Commun. 2015;6:8653. doi: 10.1038/ncomms9653. [DOI] [PMC free article] [PubMed] [Google Scholar]
- 26.Che J, Shin M. A meta-analysis strategy for gene prioritization using gene expression, SNP genotype, and eQTL data. Biomed Res Int. 2015;2015:576349. doi: 10.1155/2015/576349. [DOI] [PMC free article] [PubMed] [Google Scholar]
- 27.Li Q, Stram A, Chen C, Kar S, Gayther S, et al. Expression QTL-based analyses reveal candidate causal genes and loci across five tumor types. Hum Mol Genet. 2014;23:5294–302. doi: 10.1093/hmg/ddu228. [DOI] [PMC free article] [PubMed] [Google Scholar]
- 28.Jiang J, Cui W, Vongsangnak W, Hu G, Shen B. Post genome-wide association studies functional characterization of prostate cancer risk loci. BMC Genomics. 2013;14(Suppl 8):S9. doi: 10.1186/1471-2164-14-S8-S9. [DOI] [PMC free article] [PubMed] [Google Scholar]
- 29.Orozco LD, Cokus SJ, Ghazalpour A, Ingram-Drake L, Wang S, et al. Copy number variation influences gene expression and metabolic traits in mice. Hum Mol Genet. 2009;18:4118–29. doi: 10.1093/hmg/ddp360. [DOI] [PMC free article] [PubMed] [Google Scholar]
- 30.Wagner JR, Busche S, Ge B, Kwan T, Pastinen T, et al. The relationship between DNA methylation, genetic and expression inter-individual variation in untransformed human fibroblasts. Genome Biol. 2014;15:R37. doi: 10.1186/gb-2014-15-2-r37. [DOI] [PMC free article] [PubMed] [Google Scholar]
- 31.Yang IV, Pedersen BS, Rabinovich E, Hennessy CE, Davidson EJ, et al. Relationship of DNA methylation and gene expression in idiopathic pulmonary fibrosis. Am J Respir Crit Care Med. 2014;190:1263–72. doi: 10.1164/rccm.201408-1452OC. [DOI] [PMC free article] [PubMed] [Google Scholar]
- 32.Kendziorski C, Wang P. A review of statistical methods for expression quantitative trait loci mapping. Mamm Genome. 2006;17:509–17. doi: 10.1007/s00335-005-0189-6. [DOI] [PubMed] [Google Scholar]
- 33.Xu J, Mo Z, Ye D, Wang M, Liu F, et al. Genome-wide association study in Chinese men identifies two new prostate cancer risk loci at 9q31.2 and 19q13.4. Nat Genet. 2012;44:1231–5. doi: 10.1038/ng.2424. [DOI] [PMC free article] [PubMed] [Google Scholar]
- 34.Ishkanian AS, Mallof CA, Ho J, Meng A, Albert M, et al. High-resolution array CGH identifies novel regions of genomic alteration in intermediate-risk prostate cancer. Prostate. 2009;69:1091–100. doi: 10.1002/pros.20959. [DOI] [PubMed] [Google Scholar]
- 35.Huang DW, Sherman BT, Lempicki RA. Systematic and integrative analysis of large gene lists using DAVID bioinformatics resources. Nat Protoc. 2009;4:44–57. doi: 10.1038/nprot.2008.211. [DOI] [PubMed] [Google Scholar]
- 36.Ashburner M, Ball CA, Blake JA, Botstein D, Butler H, et al. Gene ontology: tool for the unification of biology. Nat Genet. 2000;25:25–9. doi: 10.1038/75556. [DOI] [PMC free article] [PubMed] [Google Scholar]
- 37.Majumdar S, Buckles E, Estrada J, Koochekpour S. Aberrant DNA methylation and prostate cancer. Curr Genomics. 2011;12:486–505. doi: 10.2174/138920211797904061. [DOI] [PMC free article] [PubMed] [Google Scholar]
- 38.Jeronimo C, Henrique R. Epigenetic biomarkers in urological tumors: a systematic review. Cancer Lett. 2014;342:264–74. doi: 10.1016/j.canlet.2011.12.026. [DOI] [PubMed] [Google Scholar]
- 39.Jeronimo C, Bastian PJ, Bjartell A, Carbone GM, Catto JW, et al. Epigenetics in prostate cancer: biologic and clinical relevance. Eur Urol. 2011;60:753–66. doi: 10.1016/j.eururo.2011.06.035. [DOI] [PubMed] [Google Scholar]
- 40.Ngollo M, Dagdemir A, Karsli-Ceppioglu S, Judes G, Pajon A, et al. Epigenetic modifications in prostate cancer. Epigenomics. 2014;6:415–26. doi: 10.2217/epi.14.34. [DOI] [PubMed] [Google Scholar]
- 41.Wu P, Cao Z, Wu S. New progress of epigenetic biomarkers in urological cancer. Dis Markers. 2016;2016:9864047. doi: 10.1155/2016/9864047. [DOI] [PMC free article] [PubMed] [Google Scholar]
- 42.Cucchiara V, Yang JC, Mirone V, Gao AC, Rosenfeld MG, et al. Epigenomic regulation of androgen receptor signaling: potential role in prostate cancer therapy. Cancers (Basel) 2017;9:9. doi: 10.3390/cancers9010009. [DOI] [PMC free article] [PubMed] [Google Scholar]
- 43.Vaidyanathan G, Cismowski MJ, Wang G, Vincent TS, Brown KD, et al. The Ras-related protein AGS1/RASD1 suppresses cell growth. Oncogene. 2004;23:5858–63. doi: 10.1038/sj.onc.1207774. [DOI] [PubMed] [Google Scholar]
- 44.Hannon E, Spiers H, Viana J, Pidsley R, Burrage J, et al. Methylation QTLs in the developing brain and their enrichment in schizophrenia risk loci. Nat Neurosci. 2016;19:48–54. doi: 10.1038/nn.4182. [DOI] [PMC free article] [PubMed] [Google Scholar]
- 45.Kato N, Loh M, Takeuchi F, Verweij N, Wang X, et al. Trans-ancestry genome-wide association study identifies 12 genetic loci influencing blood pressure and implicates a role for DNA methylation. Nat Genet. 2015;47:1282–93. doi: 10.1038/ng.3405. [DOI] [PMC free article] [PubMed] [Google Scholar]
- 46.Keil KP, Vezina CM. DNA methylation as a dynamic regulator of development and disease processes: spotlight on the prostate. Epigenomics. 2015;7:413–25. doi: 10.2217/epi.15.8. [DOI] [PMC free article] [PubMed] [Google Scholar]
- 47.Geybels MS, Zhao S, Wong CJ, Bibikova M, Klotzle B, et al. Epigenomic profiling of DNA methylation in paired prostate cancer versus adjacent benign tissue. Prostate. 2015;75:1941–50. doi: 10.1002/pros.23093. [DOI] [PMC free article] [PubMed] [Google Scholar]
- 48.Barry KH, Moore LE, Sampson JN, Koutros S, Yan L, et al. Prospective study of DNA methylation at chromosome 8q24 in peripheral blood and prostate cancer risk. Br J Cancer. 2017;116:1470–9. doi: 10.1038/bjc.2017.104. [DOI] [PMC free article] [PubMed] [Google Scholar]
- 49.FitzGerald LM, Naeem H, Makalic E, Schmidt DF, Dowty JG, et al. Genome-wide measures of peripheral blood DNA methylation and prostate cancer risk in a prospective nested case-control study. Prostate. 2017;77:471–8. doi: 10.1002/pros.23289. [DOI] [PubMed] [Google Scholar]
- 50.Tam L, McGlynn LM, Traynor P, Mukherjee R, Bartlett JM, et al. Expression levels of the JAK/STAT pathway in the transition from hormone-sensitive to hormone-refractory prostate cancer. Br J Cancer. 2007;97:378–83. doi: 10.1038/sj.bjc.6603871. [DOI] [PMC free article] [PubMed] [Google Scholar]
- 51.Amankwah EK, Sellers TA, Park JY. Gene variants in the angiogenesis pathway and prostate cancer. Carcinogenesis. 2012;33:1259–69. doi: 10.1093/carcin/bgs150. [DOI] [PMC free article] [PubMed] [Google Scholar]
- 52.Hsu FC, Sun J, Wiklund F, Isaacs SD, Wiley KE, et al. A novel prostate cancer susceptibility locus at 19q13. Cancer Res. 2009;69:2720–3. doi: 10.1158/0008-5472.CAN-08-3347. [DOI] [PMC free article] [PubMed] [Google Scholar]
- 53.Dong JT. Chromosomal deletions and tumor suppressor genes in prostate cancer. Cancer Metastasis Rev. 2001;20:173–93. doi: 10.1023/a:1015575125780. [DOI] [PubMed] [Google Scholar]
- 54.Kai K, Zhang Z, Yamashita H, Yamamoto Y, Miura Y, et al. Loss of heterozygosity at the ATBF1-A locus located in the 16q22 minimal region in breast cancer. BMC Cancer. 2008;8:262. doi: 10.1186/1471-2407-8-262. [DOI] [PMC free article] [PubMed] [Google Scholar]
- 55.Heyn H, Sayols S, Moutinho C, Vidal E, Sanchez-Mut JV, et al. Linkage of DNA methylation quantitative trait loci to human cancer risk. Cell Rep. 2014;7:331–8. doi: 10.1016/j.celrep.2014.03.016. [DOI] [PubMed] [Google Scholar]
- 56.Amangyeld T, Shin YK, Lee M, Kwon B, Seo YS. Human MUS81-EME2 can cleave a variety of DNA structures including intact Holliday junction and nicked duplex. Nucleic Acids Res. 2014;42:5846–62. doi: 10.1093/nar/gku237. [DOI] [PMC free article] [PubMed] [Google Scholar]
- 57.Golzio C, Willer J, Talkowski ME, Oh EC, Taniguchi Y, et al. KCTD13 is a major driver of mirrored neuroanatomical phenotypes of the 16p11.2 copy number variant. Nature. 2012;485:363–7. doi: 10.1038/nature11091. [DOI] [PMC free article] [PubMed] [Google Scholar]
- 58.Titus AJ, Way GP, Johnson KC, Christensen BC. Deconvolution of DNA methylation identifies differentially methylated gene regions on 1p36 across breast cancer subtypes. Sci Rep. 2017;7:11594. doi: 10.1038/s41598-017-10199-z. [DOI] [PMC free article] [PubMed] [Google Scholar]
- 59.Li D, Roberts R. WD-repeat proteins: structure characteristics, biological function, and their involvement in human diseases. Cell Mol Life Sci. 2001;58:2085–97. doi: 10.1007/PL00000838. [DOI] [PMC free article] [PubMed] [Google Scholar]
- 60.Wei JL, Fu ZX, Fang M, Zhou QY, Zhao QN, et al. High expression of CASK correlates with progression and poor prognosis of colorectal cancer. Tumour Biol. 2014;35:9185–94. doi: 10.1007/s13277-014-2179-3. [DOI] [PubMed] [Google Scholar]
- 61.Gray PJ, Lin CC, Cooperberg MR, Jemal A, Efstathiou JA. Temporal trends and the impact of race, insurance, and socioeconomic status in the management of localized prostate cancer. Eur Urol. 2017;71:729–37. doi: 10.1016/j.eururo.2016.08.047. [DOI] [PubMed] [Google Scholar]
- 62.Lamb AD, Bryant RJ, Camilleri P, Hamdy FC. Orient expression: solving the mystery of Asian prostate cancer? Eur Urol. 2018;73:340–2. doi: 10.1016/j.eururo.2017.10.030. [DOI] [PubMed] [Google Scholar]
- 63.Shim JS, Park HM, Lee J, Kwon HJ. Global and focused transcriptional profiling of small molecule aminopeptidase N inhibitor reveals its mechanism of angiogenesis inhibition. Biochem Biophys Res Commun. 2008;371:99–103. doi: 10.1016/j.bbrc.2008.04.023. [DOI] [PubMed] [Google Scholar]
- 64.Dall’Era MA, True LD, Siegel AF, Porter MP, Sherertz TM, et al. Differential expression of CD10 in prostate cancer and its clinical implication. BMC Urol. 2007;7:3. doi: 10.1186/1471-2490-7-3. [DOI] [PMC free article] [PubMed] [Google Scholar]
- 65.Yan C, Boyd DD. ATF3 regulates the stability of p53: a link to cancer. Cell Cycle. 2006;5:926–9. doi: 10.4161/cc.5.9.2714. [DOI] [PubMed] [Google Scholar]
- 66.Pelzer AE, Bektic J, Haag P, Berger AP, Pycha A, et al. The expression of transcription factor activating transcription factor 3 in the human prostate and its regulation by androgen in prostate cancer. J Urol. 2006;175:1517–22. doi: 10.1016/S0022-5347(05)00651-8. [DOI] [PubMed] [Google Scholar]
- 67.Krajewska M, Krajewski S, Epstein JI, Shabaik A, Sauvageot J, et al. Immunohistochemical analysis of bcl-2, bax, bcl-X, and mcl-1 expression in prostate cancers. Am J Pathol. 1996;148:1567–76. [PMC free article] [PubMed] [Google Scholar]
- 68.O’Donovan KJ, Tourtellotte WG, Millbrandt J, Baraban JM. The EGR family of transcription-regulatory factors: progress at the interface of molecular and systems neuroscience. Trends Neurosci. 1999;22:167–73. doi: 10.1016/s0166-2236(98)01343-5. [DOI] [PubMed] [Google Scholar]
- 69.O’Neill D, Jones D, Wade M, Grey J, Nakjang S, et al. Development and exploitation of a novel mutant androgen receptor modelling strategy to identify new targets for advanced prostate cancer therapy. Oncotarget. 2015;6:26029–40. doi: 10.18632/oncotarget.4347. [DOI] [PMC free article] [PubMed] [Google Scholar]
- 70.Liu XJ, Li YQ, Chen QY, Xiao SJ, Zeng SE. Up-regulating of RASD1 and apoptosis of DU-145 human prostate cancer cells induced by formononetin in vitro. Asian Pac J Cancer Prev. 2014;15:2835–9. doi: 10.7314/apjcp.2014.15.6.2835. [DOI] [PubMed] [Google Scholar]
- 71.Febbo PG, Mulligan MG, Slonina DA, Stegmaier K, Di Vizio D, et al. Literature Lab: a method of automated literature interrogation to infer biology from microarray analysis. BMC Genomics. 2007;8:461. doi: 10.1186/1471-2164-8-461. [DOI] [PMC free article] [PubMed] [Google Scholar]
- 72.Shijubo N, Kawabata I, Sato N, Itoh Y. Clinical aspects of Clara cell 10-kDa protein/uteroglobin (secretoglobin 1A1) Curr Pharm Des. 2003;9:1139–49. doi: 10.2174/1381612033455026. [DOI] [PubMed] [Google Scholar]
- 73.Bilen MA, Reyes A, Bhowmick D, Maa A, Bast RJ, et al. Variant prostate carcinoma and elevated serum CA-125. Can J Urol. 2014;21:7442–8. [PMC free article] [PubMed] [Google Scholar]
- 74.Hessels D, Schalken JA. Urinary biomarkers for prostate cancer: a review. Asian J Androl. 2013;15:333–9. doi: 10.1038/aja.2013.6. [DOI] [PMC free article] [PubMed] [Google Scholar]
- 75.Song YH, Shiota M, Kuroiwa K, Naito S, Oda Y. The important role of glycine N-methyltransferase in the carcinogenesis and progression of prostate cancer. Mod Pathol. 2011;24:1272–80. doi: 10.1038/modpathol.2011.76. [DOI] [PubMed] [Google Scholar]
- 1.Barrett CS, Millena AC, Khan SA. TGF-β effects on prostate cancer cell migration and invasion require FosB. Prostate. 2017;77:72–81. doi: 10.1002/pros.23250. [DOI] [PMC free article] [PubMed] [Google Scholar]
- 2.Febbo PG, Mulligan MG, Slonina DA, Stegmaier K, Di Vizio D, et al. Literature Lab: a method of automated literature interrogation to infer biology from microarray analysis. BMC Genomics. 2007;8:461. doi: 10.1186/1471-2164-8-461. [DOI] [PMC free article] [PubMed] [Google Scholar]
- 3.Shijubo N, Kawabata I, Sato N, Itoh Y. Clinical aspects of Clara cell 10-kDa protein/uteroglobin (secretoglobin 1A1) Curr Pharm Des. 2003;9:1139–49. doi: 10.2174/1381612033455026. [DOI] [PubMed] [Google Scholar]
- 4.Ernst T, Hergenhahn M, Kenzelmann M, Cohen CD, Bonrouhi M, et al. Decrease and gain of gene expression are equally discriminatory markers for prostate carcinoma: a gene expression analysis on total and microdissected prostate tissue. Am J Pathol. 2002;160:2169–80. doi: 10.1016/S0002-9440(10)61165-0. [DOI] [PMC free article] [PubMed] [Google Scholar]
- 5.Aithal A, Rauth S, Kshirsagar P, Shah A, Lakshmanan I, et al. MUC16 as a novel target for cancer therapy. Expert Opin Ther Targets. 2018;22:675–86. doi: 10.1080/14728222.2018.1498845. [DOI] [PMC free article] [PubMed] [Google Scholar]
- 6.Dharma Rao T, Park KJ, Smith-Jones P, Iasonos A, Linkov I, et al. Novel monoclonal antibodies against the proximal (carboxy-terminal) portions of MUC16. Appl Immunohistochem Mol Morphol. 2010;18:462–72. doi: 10.1097/PAI.0b013e3181dbfcd2. [DOI] [PMC free article] [PubMed] [Google Scholar]
- 7.Culig Z, Puhr M. Interleukin-6 and prostate cancer: current developments and unsolved questions. Mol Cell Endocrinol. 2018;462:25–30. doi: 10.1016/j.mce.2017.03.012. [DOI] [PubMed] [Google Scholar]
- 8.Baron VT, Pio R, Jia Z, Mercola D. Early Growth Response 3 regulates genes of inflammation and directly activates IL6 and IL8 expression in prostate cancer. Br J Cancer. 2015;112:755–64. doi: 10.1038/bjc.2014.622. [DOI] [PMC free article] [PubMed] [Google Scholar]
- 9.Qiu Y, Ravi L, Kung HJ. Requirement of ErbB2 for signalling by interleukin-6 in prostate carcinoma cells. Nature. 1998;393:83–5. doi: 10.1038/30012. [DOI] [PubMed] [Google Scholar]
- 10.Vinarskaja A, Yamanaka M, Ingenwerth M, Schulz WA. DNA methylation and the HOXC6 paradox in prostate cancer. Cancers (Basel) 2011;3:3714–25. doi: 10.3390/cancers3043714. [DOI] [PMC free article] [PubMed] [Google Scholar]
- 11.Costa VL, Henrique R, Ribeiro FR, Carvalho JR, Oliveira J, et al. Epigenetic regulation of Wnt signaling pathway in urological cancer. Epigenetics. 2010;5:343–51. doi: 10.4161/epi.5.4.11749. [DOI] [PubMed] [Google Scholar]
- 12.Yee DS, Tang Y, Li X, Liu Z, Guo Y, et al. The Wnt inhibitory factor 1 restoration in prostate cancer cells was associated with reduced tumor growth, decreased capacity of cell migration and invasion and a reversal of epithelial to mesenchymal transition. Mol Cancer. 2010;9:162. doi: 10.1186/1476-4598-9-162. [DOI] [PMC free article] [PubMed] [Google Scholar]
- 13.Wissmann C, Wild PJ, Kaiser S, Roepcke S, Stoehr R, et al. WIF1, a component of the Wnt pathway, is down-regulated in prostate, breast, lung, and bladder cancer. J Pathol. 2003;201:204–12. doi: 10.1002/path.1449. [DOI] [PubMed] [Google Scholar]
- 14.Göhler S, Da Silva Filho MI, Johansson R, Enquist-Olsson K, Henriksson R, et al. Functional germline variants in driver genes of breast cancer. Cancer Causes Control. 2017;28:259–71. doi: 10.1007/s10552-017-0849-3. [DOI] [PubMed] [Google Scholar]
- 15.Farkas SA, Vymetalkova V, Vodickova L, Vodicka P, Nilsson TK. DNA methylation changes in genes frequently mutated in sporadic colorectal cancer and in the DNA repair and Wnt/β-catenin signaling pathway genes. Epigenomics. 2014;6:179–91. doi: 10.2217/epi.14.7. [DOI] [PubMed] [Google Scholar]
- 16.Kim N, Hong Y, Kwon D, Yoon S. Somatic mutaome profile in human cancer tissues. Genomics Inform. 2013;11:239–44. doi: 10.5808/GI.2013.11.4.239. [DOI] [PMC free article] [PubMed] [Google Scholar]
- 17.Unno K, Roh M, Yoo YA, Al-Shraideh Y, Wang L, et al. Modeling African American prostate adenocarcinoma by inducing defined genetic alterations in organoids. Oncotarget. 2017;8:51264–76. doi: 10.18632/oncotarget.17230. [DOI] [PMC free article] [PubMed] [Google Scholar]
- 18.Rastogi A, Ali A, Tan SH, Banerjee S, Chen Y, et al. Autoantibodies against oncogenic ERG protein in prostate cancer: potential use in diagnosis and prognosis in a panel with C-MYC, AMACR and HERV-K Gag. Genes Cancer. 2016;7:394–413. doi: 10.18632/genesandcancer.126. [DOI] [PMC free article] [PubMed] [Google Scholar]
- 19.Hessels D, Schalken JA. Urinary biomarkers for prostate cancer: a review. Asian J Androl. 2013;15:333–9. doi: 10.1038/aja.2013.6. [DOI] [PMC free article] [PubMed] [Google Scholar]
- 20.Chen M, Huang YL, Huang YC, Shui IM, Giovannucci E, et al. Genetic polymorphisms of the glycine N-methyltransferase and prostate cancer risk in the health professionals follow-up study. PLoS One. 2014;9:e94683. doi: 10.1371/journal.pone.0094683. [DOI] [PMC free article] [PubMed] [Google Scholar]
- 21.Ianni M, Porcellini E, Carbone I, Potenzoni M, Pieri AM, et al. Genetic factors regulating inflammation and DNA methylation associated with prostate cancer. Prostate Cancer Prostatic Dis. 2013;16:56–61. doi: 10.1038/pcan.2012.30. [DOI] [PubMed] [Google Scholar]
- 22.Ottaviani S, Brooke GN, O’Hanlon-Brown C, Waxman J, Ali S, et al. Characterisation of the androgen regulation of glycine N-methyltransferase in prostate cancer cells. J Mol Endocrinol. 2013;51:301–12. doi: 10.1530/JME-13-0169. [DOI] [PMC free article] [PubMed] [Google Scholar]
- 23.Song YH, Shiota M, Kuroiwa K, Naito S, Oda Y. The important role of glycine N-methyltransferase in the carcinogenesis and progression of prostate cancer. Mod Pathol. 2011;24:1272–80. doi: 10.1038/modpathol.2011.76. [DOI] [PubMed] [Google Scholar]
- 24.O’Neill D, Jones D, Wade M, Grey J, Nakjang S, et al. Development and exploitation of a novel mutant androgen receptor modelling strategy to identify new targets for advanced prostate cancer therapy. Oncotarget. 2015;6:26029–40. doi: 10.18632/oncotarget.4347. [DOI] [PMC free article] [PubMed] [Google Scholar]
- 25.Liu XJ, Li YQ, Chen QY, Xiao SJ, Zeng SE. Up-regulating of RASD1 and apoptosis of DU-145 human prostate cancer cells induced by formononetin in vitro. Asian Pac J Cancer Prev. 2014;15:2835–9. doi: 10.7314/apjcp.2014.15.6.2835. [DOI] [PubMed] [Google Scholar]
- 26.Sørensen KD, Abildgaard MO, Haldrup C, Ulhøi BP, Kristensen H, et al. Prognostic significance of aberrantly silenced ANPEP expression in prostate cancer. Br J Cancer. 2013;108:420–8. doi: 10.1038/bjc.2012.549. [DOI] [PMC free article] [PubMed] [Google Scholar]
- 27.Larkin SE, Holmes S, Cree IA, Walker T, Basketter V, et al. Identification of markers of prostate cancer progression using candidate gene expression. Br J Cancer. 2012;106:157–65. doi: 10.1038/bjc.2011.490. [DOI] [PMC free article] [PubMed] [Google Scholar]
- 28.Sharad S, Srivastava A, Ravulapalli S, Parker P, Chen Y, et al. Prostate cancer gene expression signature of patients with high body mass index. Prostate Cancer Prostatic Dis. 2011;14:22–9. doi: 10.1038/pcan.2010.44. [DOI] [PMC free article] [PubMed] [Google Scholar]
- 29.Avvakumova S, Galbiati E, Sironi L, Locarno SA, Gambini L, et al. Theranostic nanocages for imaging and photothermal therapy of prostate cancer cells by active targeting of neuropeptide-Y receptor. Bioconjug Chem. 2016;27:2911–22. doi: 10.1021/acs.bioconjchem.6b00568. [DOI] [PubMed] [Google Scholar]
- 30.Ueda K, Tatsuguchi A, Saichi N, Toyama A, Tamura K, et al. Plasma low-molecular-weight proteome profiling identified neuropeptide-Y as a prostate cancer biomarker polypeptide. J Proteome Res. 2013;12:4497–506. doi: 10.1021/pr400547s. [DOI] [PubMed] [Google Scholar]
- 31.Ruscica M, Dozio E, Boghossian S, Bovo G, Martos Riaño V, et al. Activation of the Y1 receptor by neuropeptide Y regulates the growth of prostate cancer cells. Endocrinology. 2006;147:1466–73. doi: 10.1210/en.2005-0925. [DOI] [PubMed] [Google Scholar]
- 32.Magni P, Motta M. Expression of neuropeptide Y receptors in human prostate cancer cells. Ann Oncol. 2001;12(Suppl 2):S27–9. doi: 10.1093/annonc/12.suppl_2.s27. [DOI] [PubMed] [Google Scholar]
- 33.Torrealba N, Rodríguez-Berriguete G, Fraile B, Olmedilla G, Martínez-Onsurbe P, et al. Expression of several cytokines in prostate cancer: Correlation with clinical variables of patients. Relationship with biochemical progression of the malignance. Cytokine. 2017;89:105–15. doi: 10.1016/j.cyto.2016.08.008. [DOI] [PubMed] [Google Scholar]
- 34.Laberge RM, Sun Y, Orjalo AV, Patil CK, Freund A, et al. MTOR regulates the pro-tumorigenic senescence-associated secretory phenotype by promoting IL1A translation. Nat Cell Biol. 2015;17:1049–61. doi: 10.1038/ncb3195. [DOI] [PMC free article] [PubMed] [Google Scholar]
- 35.Kobylewski SE, Henderson KA, Eckhert CD. Identification of ryanodine receptor isoforms in prostate DU-145, LNCaP, and PWR-1E cells. Biochem Biophys Res Commun. 2012;425:431–5. doi: 10.1016/j.bbrc.2012.07.119. [DOI] [PubMed] [Google Scholar]
- 36.Mariot P, Prevarskaya N, Roudbaraki MM, Le Bourhis X, Van Coppenolle F, et al. Evidence of functional ryanodine receptor involved in apoptosis of prostate cancer (LNCaP) cells. Prostate. 2000;43:205–14. doi: 10.1002/(sici)1097-0045(20000515)43:3<205::aid-pros6>3.0.co;2-m. [DOI] [PubMed] [Google Scholar]
- 37.Bettin A, Reyes I, Reyes N. Gene expression profiling of prostate cancer-associated genes identifies fibromodulin as potential novel biomarker for prostate cancer. Int J Biol Markers. 2016;31:153–62. doi: 10.5301/jbm.5000184. [DOI] [PubMed] [Google Scholar]
- 38.Ashour N, Angulo JC, Andrés G, Alelú R, González-Corpas A, et al. A DNA hypermethylation profile reveals new potential biomarkers for prostate cancer diagnosis and prognosis. Prostate. 2014;74:1171–82. doi: 10.1002/pros.22833. [DOI] [PubMed] [Google Scholar]
- 39.Goo YA, Goodlett DR, Pascal LE, Worthington KD, Vessella RL, et al. Stromal mesenchyme cell genes of the human prostate and bladder. BMC Urol. 2005;5:17. doi: 10.1186/1471-2490-5-17. [DOI] [PMC free article] [PubMed] [Google Scholar]
- 40.Pio R, Jia Z, Baron VT, Mercola D. UCI NCI SPECS Consortium of the Strategic Partners for the Evaluation of Cancer Signatures-Prostate Cancer. Early growth response 3 (Egr3) is highly over-expressed in non-relapsing prostate cancer but not in relapsing prostate cancer. PLoS One. 2013;8:e54096. doi: 10.1371/journal.pone.0054096. [DOI] [PMC free article] [PubMed] [Google Scholar]
- 41.Floyd BJ, Wilkerson EM, Veling MT, Minogue CE, Xia C, et al. Mitochondrial protein interaction mapping identifies regulators of respiratory chain function. Mol Cell. 2016;63:621–32. doi: 10.1016/j.molcel.2016.06.033. [DOI] [PMC free article] [PubMed] [Google Scholar]
- 42.Fang TT, Sun XJ, Chen J, Zhao Y, Sun RX, et al. Long non-coding RNAs are differentially expressed in hepatocellular carcinoma cell lines with differing metastatic potential. Asian Pac J Cancer Prev. 2014;15:10513–24. doi: 10.7314/apjcp.2014.15.23.10513. [DOI] [PubMed] [Google Scholar]
- 43.Su A, Ra S, Li X, Zhou J, Binder S. Differentiating cutaneous squamous cell carcinoma and pseudoepitheliomatous hyperplasia by multiplex qRT-PCR. Mod Pathol. 2013;26:1433–7. doi: 10.1038/modpathol.2013.82. [DOI] [PubMed] [Google Scholar]