Correction to: De Economist 10.1007/s10645-021-09389-y
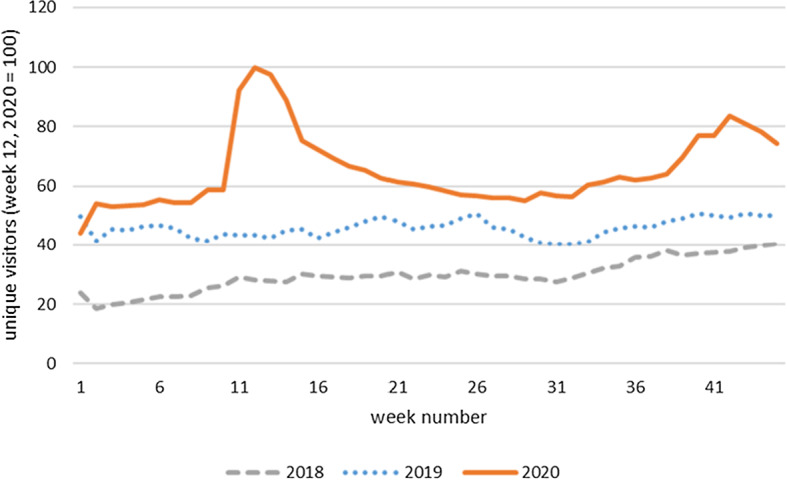
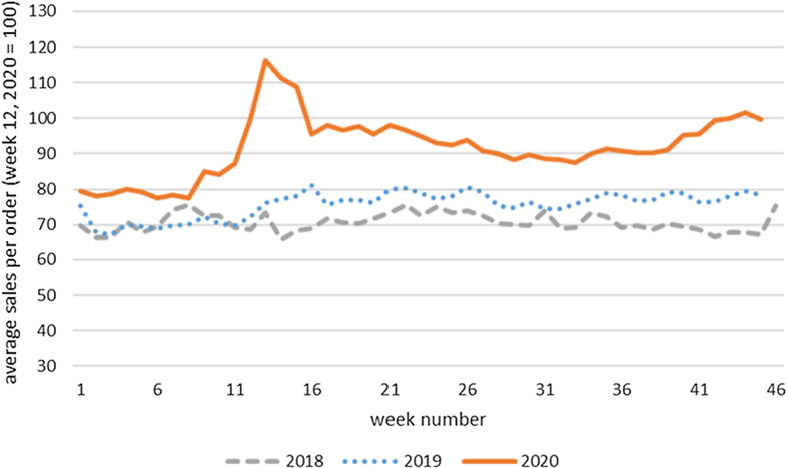
In the original publication of the article, the data in Figs. 1 and 2 were published incorrectly. The corrected figures are given in below.
Fig. 1.

Demand for online groceries, measured by number of unique visitors
Fig. 2.

Demand for online groceries, measured by average sales per order
Additionally, in the online version there is an appendix that contains Table 3, which is not in pdf format. Rows 1 and 2 therein (“Unique visitors” and “Sales per order”) should be removed. The original article has been corrected.
Table 3.
Descriptive statistics
| Sample | Full sample | Treated sample (COVID-19 period) | Control sample (non-COVID-19 period) | |||||||
|---|---|---|---|---|---|---|---|---|---|---|
| Variable | Definition | Mean | SD | N × T | Mean | SD | N × T | Mean | SD | N × T |
| Commonality | Average of grocery items divided by unique grocery items per order | 1.289 | 0.177 | 11,100 | 1.281 | 0.051 | 3069 | 1.292 | 0.206 | 8031 |
| Local hospital admissions | Number of municipality-level hospital admissions | 0.640 | 4.267 | 11,205 | 2.335 | 7.905 | 3071 | 0 | 0 | 8134 |
| Keyword searches | Search index value where value = 100 at peak | 8.119 | 16.05 | 11,205 | 29.30 | 17.91 | 3071 | 0.122 | 0.576 | 8134 |
Footnotes
Publisher's Note
Springer Nature remains neutral with regard to jurisdictional claims in published maps and institutional affiliations.
Contributor Information
Barbara Baarsma, Email: b.e.baarsma@uva.nl.
Jesse Groenewegen, Email: j.t.groenewegen@uu.nl.


