

Abstract
Introduction
Gait impairment is common in neurodegenerative disorders. Specifically, gait variability—the stride‐to‐stride fluctuations in distance and time—has been associated with neurodegeneration and cognitive impairment. However, quantitative comparisons of gait impairments across the cognitive spectrum of dementias have not been systematically investigated.
Methods
Older adults (N = 500) with subjective cognitive impairment, Parkinson disease (PD), mild cognitive impairment (MCI), PD‐MCI, Alzheimer's disease (AD), PD‐dementia, Lewy body dementia, and frontotemporal dementia, as well cognitive normal controls, who were assessed for their gait and cognitive performance.
Results
Factor analyses grouped 11 quantitative gait parameters and identified four independent gait domains: rhythm, pace, variability, and postural control, for group comparisons and classification analysis. Among these domains, only high gait variability was associated with lower cognitive performance and accurately discriminated AD from other neurodegenerative and cognitive conditions.
Discussion
Our findings indicate that high gait variability is a marker of cognitive‐cortical dysfunction, which can help to identify Alzheimer's disease dementia.
Keywords: biomarker, cognition, dementia, gait variability, neurodegenerative diseases
1. INTRODUCTION
Abnormal gait is prevalent in established dementia,1 and can also predict progression from normal cognition, cognitive complaints, and mild cognitive impairment (MCI) to dementia syndromes.2, 3, 4, 5, 6, 7 Quantitative gait parameters, particularly the variability in the stride‐to‐stride fluctuations, have been shown to be a sensitive marker of neurological dysfunction8, 9, 10, 11, 12 and associated with future mobility disability13 and incident dementia. 14, 15 Increased gait variability has been seen especially in neurodegenerative diseases that affect cognition, whereas not in those without cognitive involvement, suggesting that the cortical networks involved in gait control are shared with cognitive processes.16 For instance, gait variability increases from early (ie, MCI)17, 18 throughout all the stages of Alzheimer's disease (AD) dementia,19, 20 where mesial‐temporal structures are mainly affected, among other areas. High gait variability is also observed in Lewy body dementia (LBD), where posterior cortical areas and basal ganglia are predominantly affected21, 22; and behavioral variant frontal temporal dementia (FTD), where anterior and subcortical regions are mostly affected compared with other regions.23 In Parkinson disease (PD), there have been reports showing that gait variability increases with disease progression24 when cognitive decline appears.25
Although previous studies consistently show associations between increased gait variability with virtually all neurodegenerative conditions, there is a lack of systematic comparisons across the spectrum of neurodegenerative diseases that eventually affect cognition, including pre‐dementia stages.26 Moreover, it remains uncertain if gait variability is associated with severity of cognitive dysfunction in neurodegenerative diseases across dementia subtypes.26
We hypothesized that among all gait parameters, gait variability would be abnormally higher in neurodegenerative conditions with cognitive involvement, and further would accurately identify dementia subtypes, specifically AD and FTD. We used data from two large cohorts in Canada: (1) the Comprehensive Assessment of Neurodegeneration and Dementia (COMPASS‐ND; assembled by the Canadian Consortium for Neurodegeneration in Aging [CCNA]27) and (2) the Gait and Brain Study,28 which include a range of neurodegenerative diseases affecting cognition.
2. METHODS
2.1. Participant selection
Participants were draw from the COMPASS‐ND Cohort and the Gait and Brain Study Cohort (NCT03020381). Details on design and recruitment of the COMPASS‐ND Cohort from the CCNA27 and from the Gait and Brain Study have been published elsewhere.28 Both databases were merged, since both studies have harmonized research protocols and assessment, including gait assessments. This resulted in 500 eligible participants with gait assessment compiled from four different sites across Canada including University of Western Ontario‐Parkwood Institute and Gait & Brain Lab, University of Alberta‐University Hospital, University of Calgary‐Hotchkiss Brain Institute, and University of Toronto‐Sunnybrook Institute. Participants were recruited from clinics associated with these university sites described and all were community‐dwelling older adults. This research study was approved by the local ethics committee and followed the ethical code for research with humans as stated by the Declaration of Helsinki. All participants provided written informed consent to participate in this study.
2.2. General exclusion criteria
Exclusion criteria can be found in greater detail elsewhere for COMPASS‐ND and the Gait and Brain Study,27 and can be summarized as follows: the presence of significant known chronic brain disease (eg, moderate to severe chronic static leukoencephalopathy and/or previous traumatic injury), multiple sclerosis, developmental disorders, malignant tumors, Huntington disease, and other rarer brain illnesses; ongoing alcohol or drug abuse; lack of a study partner; insufficient proficiency in English or French; total score on the Montreal Cognitive Assessment (MoCA) <13; or incapable of comprehending test instructions unassisted. Participants incapable of walking more than 10 meters unassisted were excluded for this study.
2.3. Clinical group ascertainment
2.3.1. Controls with normal cognition
Participants were considered controls with normal cognition if they fulfilled the following criteria: (1) 60 years of age or older; MoCA score >26,29 (2) Verbal learning performance >5 words on Consortium to Establish a Registry for Alzheimer's Disease (CERAD) or Logical memory II >2, 4 ,or 8 correct responses depending on years of education (0‐7, 8‐15, 16+ years), or Normal Rey Auditory Verbal Learning delayed recall by age.30 Executive function MoCA sub‐score >8, 10, 11 points depending on participant's years of education (<10, 10‐14, 16+ years). (3) Lawton & Brody Instrumental Activities of Daily Lliving (IADL) = 21 points.31 (4) Controlled depressive symptoms objectively assessed with the Geriatric Depression Scale32 and normal neurological exam.
2.3.2. Subjective cognitive impairment (SCI)
The criteria for SCI were from Jessen et al:33 (1) participants had to have Global Clinical Dementia Rating (CDR) equal to 0 (ie, no signs of objective cognitive impairment);34 (2) answered “yes” for the question: “Do you think you have memory or thinking problems?” 34 Addionally, no objective cognitive impairment should be present, operationalized as: verbal memory‐ assessed with Logical Memory 2 above Alzheimer's Disease Neuroimaging Initiative (ADNI) education‐adjusted cut‐offs,35 Consortium to Establish a Registry for Alzheimer's Disease (or CERAD)36 word list recall score (>5 words (0‐10)) or Rey Auditory Verbal Learning‐trial 7 (>6 words); and MoCA (0‐30) total score >24.
2.3.3. MCI
The National Institute on Aging—Alzheimer's Association (NIA‐AA) Clinical Criteria for MCI37 was operationalized as self‐reported concern regarding a change in cognition and impairment in 1 or more of the following neuropsychological tests: (1) Logical memory below ADNI cut‐offs, or CERAD word list recall or MoCA score <25, or Global CDR 0.5. Participants also had to present preserved independence in activities of daily living, based on Lawton & Brody scale score >14(0‐23); and absence of dementia based on Global CDR <1 .
2.3.4. PD
PD was diagnosed using the International Parkinson and Movement Disorder Society (MDS) clinical diagnosis criteria.38 The MDS‐Unified Parkinson's Disease Rating Scale‐Motor section (MDS‐UPDRS‐III)39 was used to determine the severity of cardinal motor symptoms in our patients (ie, tremor, bradykinesia, and rigidity).
2.3.5. AD
Participants were diagnosed with AD based on the NIA‐AA criteria,40 as follows: (1) gradual progressive change in memory and/or other cognitive function over more than 6 months; (2) MoCA score <25; (2) objective evidence of significant decline in at least two of the following cognitive/behavioral domains: (a) episodic memory, (b) reasoning, problem solving, (c) visuospatial abilities, (d) language; (4) CERAD word list recall <7 (0‐10); (5) change in personality/behavior; (6) impairment of functional abilities. All test thresholds for cognitive and functional impairment aforementioned can be accessed elsewhere.27
HIGHLIGHT
Gait and cognitive performance are strongly linked in neurodegenerative diseases.
Gait variability (stride to stride changes) relies on higher cortical brain control.
High gait variability is associated with cognitive dysfunction in Alzheimer and Lewy body disorders.
High gait variability discriminates Alzheimer's disease from age‐related neurodegenerative disorders.
High gait variability indicates cognitive‐cortical dysfunction in neurodegeneration.
RESEARCH IN CONTEXT
Systematic review: We searched the literature and through a consensus methodology6 identified that gait impairments have been found to be strongly associated with cognitive decline and dementia. Here, we tested the hypothesis that, among all gait parameters, variability would best describe individuals with more advanced cognitive impairments including Alzheimer's disease (AD) dementia.
Interpretation: We found that among all gait parameters that only gait variability is associated with dementias and worse global cognitive performance. This association is stronger in patients with AD compared with other dementias. And it suggests that gait variability is mostly regulated by neural substrates at cortical level.
Future directions: To add to our understanding of the association between gait variability and the AD spectrum, future studies should investigate whether the neuropathological substrates contributing to dementias and specifically AD dementia correlate with gait variability changes during the course of the disease.
2.3.6. PD‐MCI
Participants were diagnosed with mild cognitive impairment in PD based on the criteria of Litvan et al.(2012).41 The core criteria for PD‐MCI were as follows: (1) diagnosis of PD as based on the International Parkinson Disease and Movement Disorder Society (IP‐MDS) Criteria; (2) gradual decline in cognitive ability, in the context of established PD, reported by either the patient or informant, or observed by the clinician; (3) cognitive deficits on either formal neuropsychological testing or a scale of global cognitive abilities. MoCA <25 inclusive for PD‐MCI; (4) cognitive deficits not sufficient to interfere significantly with functional independence, although subtle difficulties on complex functional tasks may be present.
2.3.7. Parkinson disease dementia (PDD)
Criteria for Diagnosis of probable PDD were from Emre et al., 200742 and Dubois et al., 2007.43 Patients were required to meet the IP‐MDS clinical diagnostic criteria for PD with subsequent impairment in more than one cognitive domain assessed with MoCA subscores (Serial 7s subtraction, Lexical Memory or Clock drawing, Figure copy, <3 words in five‐word recall)—representing a decline from premorbid level—with deficits severe enough to impair functional abilities, independent of the impairment ascribable to motor or autonomic symptoms.44
2.3.8. Lewy body dementia (LBD)
The clinical diagnosis of dementia with Lewy bodies was based on McKeith criteria.45 Participants were diagnosed with LBD as follows: (1) dementia defined as progressive cognitive decline of sufficient magnitude to interfere with normal social or occupational function, reported by patient and/or informant over the course of at least one year; (2) prominent or persistent memory impairment that was not necessarily occurring in the early stages but typically evident with progression; prominent deficits on specific tests of attention, executive function, and visuospatial ability; MoCA score <25 inclusive on testing within the last year; (3) two or more of the following core features by themselves, or one or more if at least one suggestive feature (criteria below) present: Fluctuating cognition with pronounced variations in attention and alertness; recurrent visual hallucinations that are typically well formed and detailed; spontaneous features of parkinsonism; (4) and one or both of the following suggestive features: rapid eye movement sleep behavior disorder; severe neuroleptic sensitivity.
2.3.9. Frontotemporal dementia (FTD)
Possible behavioral variant frontotemporal dementia (bvFTD) diagnosis was obtained as follows:46 (1) At least three of six diagnostic features: disinhibition, apathy/inertia, loss of sympathy/empathy, perseverative/compulsive behavior, hyperorality, and frontal neuropsychological profile operationalized with a positive answer to impaired functioning on the NACC‐FTLD module bvFTD features checklist; (2) frontal lobe atrophy or reduced frontal lobe metabolism for confirmatory diagnosis.
2.4. Gait assessment and ascertainment of gait parameters
Gait assessments occurred close to the clinical and cognitive assessment, on the same day when possible or within 6 days, on average. The quantitative gait assessment protocol used has been described elsewhere.47 In brief, participants were required to walk on a 6 meter electronic walkway (GaitRite or Zeno‐ Protokinetics depending on the assessment site). Both systems use similar pressure sensors embedded in the rubber mat to record spatial‐temporal gait parameters at a sampling frequency of 120 Hz with a spatial resolution of 1.27 cm (0.5˝) and have shown excellent reproducibility and high inter‐correlation.48 Participants were instructed to walk three times at their self‐selected speed, and started 1 meter before the walkway and stopped 1 meter after the walkway to prevent acceleration and deceleration effects on gait performance. A total of three trials were performed to warrant the minimum number of steps for reliable gait variability measurements.49 Gait speed was calculated using the distance from the first to last heel contact divided by the time elapsed between them; double support was calculated as the average time in which both feet spent touching the floor within each stride; stride time and length were calculated as the mean of all durations and distances (respectively) of subsequent heel contacts from the same foot of each leg during a gait trial; temporal and spatial variability parameters were calculated using the mean and SDs from stride time and length values (respectively), and are both reported as coefficient of variation (CV) (CV = [Standard deviation/mean] x 100).50 The CV has advantages over SD as a variability metric, because it removes the influence of absolute values, thereby preventing unwanted influence of non‐variability parameters in the emerging factors. The swing phase was calculated as the average time in which only one foot was touching the floor within each stride, during a gait trial; cadence (steps/min) is calculated by multiplying the number of steps of one trial by 60 seconds (ie, 1 minute), divided by trial duration in seconds. These calculations resulted in 11 gait parameters: gait speed, stride length, stride time, double support time, cadence, swing time, stride width, stride time variability, stride length variability, double support time variability, and stride width variability. These gait parameters were selected to harmonize our analysis with previous published studies, thus facilitating interpretations.
2.5. Data analyses
Our statistical analysis included the following: (1) data reduction and identification of gait domains; (2) associations among gait domain performance and cognitive performance across groups; and (3) clinical group classification through gait domain performance.
We first reduced the 11 gait parameters selected for this study into 4 major gait domains by applying factor analysis using the principal components method to extract independent factors. To verify and extract independent/uncorrelated gait factors, all gait parameters were orthogonally rotated using the “Varimax” rotation method.51, 52 Only factors with an eigenvalue >1.0 were rotated. Factor scores yielded by the analysis were calculated with the Bartlett test.53 The factor score represents the performance of aggregated gait parameters that obtained membership to its respective factor/domain. All calculated factor scores were then adjusted by age, sex, years of education, gait speed (only for factors loaded with variability parameters), and the participant's number of co‐morbidities. Co‐morbidities recorded included hypertension, chronic heart failure, atrial, fibrillation, and angina diabetes, anemia, osteoporosis, lung disease osteoarthritis, cancer, hearing problems, dyslipidemia, depression, stroke, transient ischemic attack, cataracts, glaucoma, and macular degeneration. Gait speed was added as covariate to control for the influence of very slow or very fast speed on variability parameters.54 Adjustment of gait domains was performed by extracting the residuals of the association between the factor score (dependent variable) and the covariates (independent variables) entered in a linear regression model.
Residuals for each linear regression model (ie, for each gait domain) were then transformed into Z‐scores and entered as dependent variables into a multivariate analysis of variance (MANOVA) for group comparisons. The Pillai trace test was used to reveal potential linear differences in the combined gait domains performance (ie, gait pattern) across groups. If the multivariate test was statistically significant, then we looked for statistically significant between‐subject effects for each gait domain, using univariate tests. If the between‐subject effect was significant, then contrast tests were applied to determine significant differences between controls and other groups. The Bonferroni method was applied to adjust P‐values from contrast tests. This allowed us to identify not only the between‐subject effects for each gait domain, but also which clinical group presented with abnormal gait performance, by comparing them with all clinical groups.
To verify whether associations between gait variability and cognitive impairment were not biased by clinical groups, all participants were entered in a multivariable linear regression model with gait domains as predictors of MoCA scores. Another multivariable linear regression model investigated the association between gait variability and MoCA score within the normal aging to AD spectrum55 (Controls+SCI+MCI+AD participants); and another linear regression model for the PD spectrum (PD+PD‐MCI+PDD participants) adjusted for the severity of parkinsonian signs. Only gait domains with significant between‐subject effects in the MANOVA were entered in the multivariable regression models.
Finally, to test identification capabilities of gait performance, gait domains that obtained significant between‐subject effects were then entered together in the multilevel receiver‐operating characteristic (ROC) analysis. The area under the curve (AUC), calculated with multilevel ROC analysis determined the accuracy estimate of each parameter to classify a specific group from the others. This allowed us to determine the gait domains with the best group classification capabilities in terms of sensitivity and specificity. An AUC value of 1.0 indicates the highest sensitivity of a test to classify a specific group without having false positives. In our study an AUC >.70 was accepted as reliable diagnostic index56 but only after correcting the AUC's P‐value for multiple comparisons (ie, abnormal gait domains entered in the ROC analysis). To improve the clinical applicability of our results, untransformed gait parameters were entered into the ROC analyses to generate cut‐off values for specificity and sensitivity to classify neurodegenerative diseases and cognitive disorders. The alpha level for statistical significance was set at P < 0.05 and corrected for multiple comparisons when appropriate. Statistical analyses were conducted using Statistical Package for the Social Sciences (v.26.0, IBM Corporation, Chicago, IL). Missing values were replaced with group's mean of its respective variable following standardized procedures.57
3. RESULTS
3.1. Participant characteristics across clinical groups
Table 1 summarizes participants’ characteristics and whether they were different from controls. For easier visualization regarding their cognitive spectrum in Table 1, groups were clustered into three sub‐groups as follows: normal global cognition, MCI, and dementia. Participants differed in age, sex, years of education, co‐morbidities, and global cognition (MoCA score). Overall, MCI and AD participants were older than controls. There was a significantly lower proportion of female participants in PD, MCI, PD‐MCI, AD, PDD, and LBD compared with the control group. Participants in the MCI group had significantly fewer years of education than controls. By definition, MCI, PD‐MCI, AD, PDD, LBD, and FTD had significantly worse global cognition compared with controls. The MDS‐UPDRS‐III score and the levodopa dose (mg/d) were not compared between the groups because not all groups had this assessment available; however, the PDD group had minimally clinically meaningful higher parkinsonian signs assessed with MDS‐UPDRS‐III score (>4 point difference)58 compared to other PD groups. All PD groups were tested while in the ‘on’ medication state. The PD‐MCI group took the highest levodopa dose followed by PDD, PD, FTD (only one participant taking levodopa), and LBD. Demographic and clinical differences between the groups mentioned above were accounted in our statistical analysis to avoid misinterpretation of findings. Only three participants with MCI had missing values for the number of years of education; and only one participant with FTD had a missing value for number of co‐morbidities. These missing values were replaced using the group's means. Missing data occurred due to different reasons including administrative errors, participant's verbal refusal, time constraints, and/or technical problems.
TABLE 1.
Participants’ demographics and clinical characteristics across the nine clinical conditions grouped by dementia status
| Absence of dementia/normal global cognition | MCI | Dementia | Group effect | ||||||||
|---|---|---|---|---|---|---|---|---|---|---|---|
| Participants characteristics | All (N = 500) |
Control (n = 91) |
PD (n = 41) |
SCI (n = 33) |
MCI (n = 214) | PD‐MCI (n = 19) | FTD (n = 10) | LBD (n = 11) | AD (n = 72) | PDD (n = 9) | P‐values |
| Age in years, mean ± SD | 71.99 ± 7.51 | 69.46 ± 6.26 | 66.07 ± 6.94 | 70.58 ± 5.24 | 74.0 ± 6.94 | 69.79 ± 7.76 | 64.4 ± 8.31 | 69.36 ± 8.64 | 74.44 ± 7.73 | 76.67 ± 6.801 | <.0001 |
| Sex, N, %female | 244, 48.8 | 61, 67 | 19, 46.3 | 25, 75.8 | 93, 43.5 | 2, 10.5 | 5, 50 | 2, 18.2 | 37, 51.4 | 0, 0 | <.0001 |
| Years of education, mean ± SD | 14.69 ± 3.42 | 16.14 ± 3.32 | 15.79 ± 3.00 | 14.56 ± 2.82 | 14.16 ± 3.16 | 15.34 ± 3.26 | 15.45 ± 3.35 | 15.18 ± 5.49 | 13.23 ± 3.491 | 17.78 ± 4.41 | <.0001 |
| Number of co‐morbidities, mean ± SD | 4.37 ± 2.62 | 3.89 ± 2.11 | 3.29 ± 1.97 | 4.64 ± 2.10 | 5.39 ± 2.94 | 3.89 ± 1.91 | 1.70 ± 1.33 | 4.82 ± 2.48 | 2.83 ± 1.73 | 4.56 ± 1.42 | <.0001 |
| MoCA (0‐30), mean ± SD | 23.63 ± 4.32 | 27.82 ± 1.48 | 27.76 ± 1.33 | 27.42 ± 1.60 | 22.71 ± 3.06 | 22.47 ± 4.06 | 20.8 ± 3.61 | 19.73 ± 3.92 | 18.94 ± 4.05 | 18.22 ± 4.76 | <.0001 |
| Gait speed (cm/s), mean ± SD | 116.82 ± 22.87 | 126.47 ± 22.8 | 128.81 ± 20.54 | 120.23 ± 19.59 | 111 ± 21.34 | 121.95 ± 29.55 | 134.06 ± 21.58 | 123.42 ± 24.1 | 110.67 ± 19.58 | 101.37 ± 22.97 | .001 |
| Stride time variability (CV%), mean ± SD | 2.41 ± 1.44 | 1.91 ± 0.73 | 2.1 ± 1.15 | 1.94 ± 0.73 | 2.38 ± 1.27 | 2.09 ± 1.04 | 2.22 ± 0.79 | 2.38 ± 1.28 | 3.42 ± 1.5 | 4.3 ± 5.46 | <.0001 |
| MDS‐UPDRS‐III, mean ± SD | 24.98 ± 13.61 | NA | 21.50 ± 10.59 | NA | NA | 25.63 ± 11.81 | NA | 22.70 ± 14.92 | NA | 41.66 ± 17.06 | – |
| LDE (mg/d), mean ± SD | 742.61 ± 400.45 | NA | 673.15 ± 319.85 | NA | NA | 937.05 ± 443.35 | 450.00Ψ | 380.30 ± 130.38 | NA | 865.52 ± 539.69 | – |
Note ‐ Significant differences between the groups were tested using one‐way ANOVA or chi‐square when applicable (see P‐values).
CV, coefficient of variation; LDE, levodopa dose equivalent; MCI, mild cognitive impairment; MDS‐UPDRS‐III, MDS‐Unified Parkinson's Disease Rating Scale part III (motor symptoms); MoCA, Montreal Cognitive Assessment; NA, not applicable.
ΨOnly one participant with FTD taking levodopa equivalent medication; bold P‐values indicate between‐group effects identified by one‐way ANOVA. Groups are ordered from higher to lower MoCA scores (normal cognition to dementia).
3.2. Identifying gait domains with factor analysis
Crude (unadjusted) means and SDs of gait parameters (supplementary material) were entered in the factor analysis. Table S2 shows the loading scores for each gait parameter in its respective factor that emerged from the factor analysis. Four independent factors emerged from the analysis after orthogonal rotation. Higher loading scores inform how strongly other gait parameters within a factor are correlated with that specific gait parameter (see Table S2). Gait parameters with the highest loading scores in each factor have the ability to predict the variance of other gait parameters within the factor where it obtained its membership. Overall, most of the variance observed in gait performance was explained by the rhythm factor (38.37%), followed by pace (19.22%), variability (13.17%), and postural control (10.70%). The Bartlett test was used to extract a single score for each factor, for each participant. The factor score reflects the individual's gait performance in a specific gait domain. The factor score for each gait domain was compared between the groups.
3.3. Association between gait domains and clinical groups
The MANOVA revealed a statistically significant difference between the groups for the linear combination of all gait domains or the overall gait performance (Pillai trace < .0001; Eta2 = .06). Figure 1 is a graphical representation of the overall gait performance of each group. Univariate tests revealed that the difference in overall gait performance detected by the Pillai Trace test (MANOVA), was driven by significant differences between the groups (between‐subject effect) in specific domains including rhythm (F8,491 = 3.08, P = .002; Eta2 = .04), variability (F8,491 = 8.50, P < .0001; Eta2 = .12), and postural control (F8,491 = 5.36, P < .0001; Eta2 = .08) (Table 2). The between‐subject effect for the pace domain was not statistically significant (F8,491 = 1.23, P = .27; Eta2 = .02), and therefore this domain did not contribute significantly to overall gait performance difference between the groups. Contrast tests adjusted for multiple comparisons (Bonferroni) identified significant differences in gait performance between controls and other groups, only for variability and postural control domains, as shown in Table 2.
FIGURE 1.
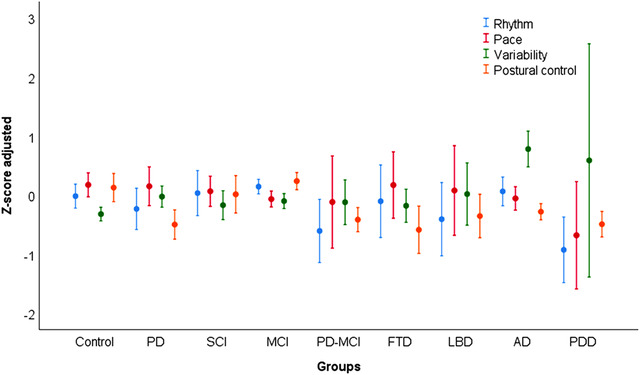
Gait domains performance as factors scores (Z‐scores) for each clinical group adjusted for covariates. Circles represent means and error bars represent 95% confidence interval. Positive scores for variability relate to high gait variability or worse variability performance. Negative values for other domains relate to worse gait performance
TABLE 2.
Associations between standardized gait domains (Z‐Score, mean ± SD) and group membership stratified by dementia status, adjusted for covariates
| Normal global cognition | MCI | Dementia | Group effect | |||||||
|---|---|---|---|---|---|---|---|---|---|---|
| Factors, mean ± SD | Control (n = 91) | PD (n = 41) | SCI (n = 33) | MCI (n = 214) | PD‐MCI (n = 19) | FTD (n = 10) | LBD (n = 11) | AD (n = 72) | PDD (n = 9) | P values/Eta2 |
| Rhythm | −0.01 ± 0.97 | −0.23 ± 1.11 | 0.03 ± 1.07 | 0.14 ± 0.92 | −0.6 ± 1.11 | −0.1 ± 0.85 | −0.4 ± 0.92 | 0.06 ± 1.03 | −0.92 ± 0.72 | .002/.048 |
| Pace | 0.17 ± 0.97 | 0.14 ± 1.03 | 0.06 ± 0.72 | −0.06 ± 0.99 | −0.11 ± 1.61 | 0.17 ± 0.78 | 0.07 ± 1.12 | −0.05 ± 0.84 | −0.67 ± 1.18 | .277/.020 |
| Variability | −0.32 ± 0.55 | −0.02 ± 0.56 | −0.17 ± 0.68 | −0.1 ± 0.94 | −0.12 ± 0.78 | −0.18 ± 0.39 | 0.01 ± 0.78 | 0.78 ± 1.28a | 0.58 ± 2.56a | < .0001/.134 |
| Postural control | 0.12 ± 1.14 | −0.49 ± 0.78a | 0.004 ± 0.89 | 0.23 ± 1.08 | −0.41 ± 0.42 | −0.58 ± 0.55 | −0.35 ± 0.54 | −0.28 ± 0.58a | −0.49 ± 0.28 | < .0001/.077 |
Note ‐ Between‐group effects identified with univariate tests in the MANOVA. Factor scores were adjusted for age, sex, number of co‐morbidities, and gait speed (for variability and postural control only).
Bold P‐values indicate between‐group effects identified by univariate tests.
aDifferent from controls at P < .006.
Only PD, AD, and PDD groups showed differences in gait compared with controls (Table 2). Compared with controls, PD had higher (ie, worse) variability and lower (ie, worse) postural control (P < 0.006), AD had worse variability (P < 0.006) and postural control (P < 0.006), and PDD had worse variability (P < 0.006). Additional analysis revealed that each covariate entered in the model provoked attenuation in group effect of more than 10% for at least one gait domain. Age entered as the only covariate that strongly attenuated the group effect for pace (P < .0001, eta2 = .68 to P = .058, eta2 = .30), being the strongest covariate in the model. Comparisons of untransformed/unadjusted gait values between the groups using a MANOVA model are found in supplemental material (Table S1). Groups differed significantly in all untransformed/unadjusted gait parameters except for double support time.
3.4. Association between gait domain and global cognitive performance
Gait domains that differed significantly between groups (rhythm, variability, and postural control), were included as predictors of MoCA scores (global cognition) in a linear regression model to test their association with progressive cognitive impairment. Among all affected gait domains, only gait variability was significantly associated with MoCA score in the whole sample (unstandardized Beta = −0.852, 95% CI ‐1.229 to ‐0.474; P < .0001). Gait variability was also independently associated with MoCA score in the AD spectrum55 (Controls+SCI+MCI+AD participants) (P < .0001). In another linear regression model in the PD spectrum of cognitive decline (PD+PD‐MCI+PDD) the association between gait variability and MoCA score was also significant (unstandardized Beta, ‐1.569, P = .001) (see Tables S3 to S5). This association, however, was attenuated by 33.6% when we included the parkinsonism severity (UPDRS‐III score) as a covariate in the model, but remained statistically significant (unstandardized Beta, ‐1.042, P = .02). There was a weak but significant association between parkinsonian signs and gait variability in the PD cohort (unstandardized Beta, .025, P = .01). When MoCA and UPDRS‐III score were included as predictors of gait variability, only MoCA was significantly associated with gait variability (unstandardized Beta, ‐.066, P = .04). To test whether gait variability better explained cognitive performance compared with a clinical motor scale, we modeled another linear regression having UPDRS‐III and gait variability as predictors of MoCA scores. The results showed that gait variability (Beta, .30, P = .009) significantly explained MoCA scores better than UPDRS‐III (Beta, .16, P = .156). Overall, high gait variability was significantly associated with low global cognition in AD and PD classes. ROC analysis showed that variability could not significantly classify or discriminate AD from the PD group (AUC = .48, P = .62).
3.5. Classifying accuracy of clinical groups of the spectrum of neurodegenerative conditions through gait domains (ROC analysis)
Because between‐subject effects were revealed for rhythm, variability, and postural control, these gait domains were entered in the ROC analysis to test their capability to accurately identify clinical groups. We first entered the unadjusted rhythm, variability, and postural control domains together; then, after removing the unadjusted domains, we entered the adjusted domains together. This allowed us to check whether potential confounders biased classification capabilities of gait domains. Table 3 shows the classification accuracy of the gait domains for each clinical group based on ROC analysis, unadjusted and adjusted for covariates. Gait variability emerged as the only domain with a high accuracy (AUC = .82; P < .0001, and AUC fully adjusted = 0.77, P < 0.0001; Figure 2) to identify AD group membership. To provide clinical validity of these findings we modeled in a separate ROC analysis with unadjusted gait variability parameters composed of the gait variability domain measures (Table S6). Stride time variability detected AD group membership (AUC = 0.80, P‐value < .0001) with a specificity of 70%, sensitivity of 80%, and variability = 2.3%. Stride length variability detected AD group membership (AUC = 0.72, P‐value < .0001) with a specificity of 54%, sensitivity of 80%, variability = 2.58%. Double support time variability detected AD group membership (AUC = 0.79, P‐value < .0001) with a specificity of 70%, sensitivity of 75%, and variability = 6.2%.
TABLE 3.
Classification accuracy for each clinical group based on ROC analysis, unadjusted and adjusted for covariates
| Rhythm | Variability | Postural control | ||||
|---|---|---|---|---|---|---|
| Groups classified | AUC (unadjusted/adjusted) | P‐value (unadjusted/adjusted) |
AUC (unadjusted/adjusted) |
P value (unadjusted/adjusted) |
AUC (unadjusted/adjusted) |
P‐value (unadjusted/adjusted) |
| SCI | 0.478/0.539 | 0.677/0.456 | 0.421/0.452 | 0.13/0.352 | 0.574/0.518 | 0.153/0.73 |
| PD | 0.416/0.409 | 0.076/0.054 | 0.497/0.541 | 0.946/0.38 | 0.296/0.307 | 0.0001/0.00004 |
| MCI | 0.615/0.58 | 0.00001/0.002 | 0.463/0.439 | 0.153/0.019 | 0.634/0.64 | <.0001/<.0001 |
| PD‐MCI | 0.411/0.337 | 0.19/0.016 | 0.46/0.461 | 0.55/0.564 | 0.249/0.358 | 0.0002/0.035 |
| FTD | 0.438/0.483 | 0.499/0.856 | 0.438/0.478 | 0.504/0.813 | 0.24/0.284 | 0.005/0.02 |
| LBD | 0.453/0.381 | 0.597/0.176 | 0.492/0.525 | 0.927/0.775 | 0.336/0.397 | 0.063/0.243 |
| AD | 0.487/0.51 | 0.719/0.791 | 0.824/0.766 | <0.0001*/< 0.0001* | 0.402/0.409 | 0.008/0.014 |
| PDD | 0.327/0.21 | 0.076/0.003 | 0.64/0.507 | 0.151/0.943 | 0.193/0.305 | 0.002/0.045 |
Note – Bold values indicated significant classification accuracy (AUC >.70), and their respective significant P‐values. Significant P‐values adjusted for multiple comparisons at P < 0.016 (α/3 domains).
AUC, area under the curve; ROC, receiver‐operating characteristic.
*P = 1.22 x 10‐18/= 4.76 x 10‐13.
FIGURE 2.

Compared with rhythm and postural control domains, gait variability accurately classified individuals with Alzheimer's disease (AD) from other clinical groups in both receiver‐operating characteristic (ROC) curves. Covariates (ie, age, sex, years of education, number of co‐morbidities, and gait speed) were used to adjust ROCs (graph on the right). ROC curves representing the true positive fraction (sensitivity) and false positive fraction (1‐specificity) of gait domains that were significantly different between all clinical groups (see Table 2). Black straight diagonal line (reference line) indicates area under the curves (AUCs) = .50, the point where variables are nonvalid/non‐accurate as classifiers. The higher the AUC, the better is the gait parameter to classify a neurodegenerative condition
4. DISCUSSION
In this multisite study with 500 older adults across neurodegenerative conditions we found that increased gait variability was associated with dementia, particularly with AD dementia and PD dementia. Rhythm and postural control domains were also associated with dementias and MCI; however, only gait variability was able to accurately discriminate and classify individuals with AD.
We observed that only gait variability was significantly associated with dementia and cognitive impairment compared with the other gait domains. Stride time and length variabilities have been linked previously to gait performance in older adults in contexts that require increased cognitive functioning.59, 60, 61 Our results of gait variability performance in AD and PDD align with those of previous studies19, 20, 24 that have shown higher gait variability in advanced stages of these diseases compared with earlier stages, thus reflecting cognitive and cortical deterioration. This was corroborated by negative associations between gait variability and global cognitive performance within the cognitive spectrum of AD and PD. Our study, therefore, supports previous assumptions that cognitive performance is strongly associated with gait variability, compared with other gait parameters, independently of disease subtype.
In the PD samples, we found that global cognitive performance was negatively and more strongly associated with gait variability than with the MDS‐UPDRS‐III, suggesting that gait variability is a better motor marker of cognitive performance than severity of parkinsonism. A recent study62 found that gait performance of individuals with dementia, particularly those with FTD and LBD, was significantly influenced by age and age of onset, both relevant aspects given the fast progression of disability in dementias. The impact of this particular caveat on gait and cognitive decline is still unclear and should be explored further in future studies. Although LBD and FTD show higher gait variability compared with controls, as shown previously,21, 23 this was not significant. A potential reason for such dissonance could be related to the limited sample size in these clinical groups and the fact that individuals with LBD and FTD in our study were on average younger than controls and patients from previous studies.
The gait variability domain that emerged in our factor analyses includes the same gait parameters found in previous studies51, 63 that assessed gait and cognitive relationships, which strengthens the growing theoretical framework11, 64 that postulates the existence of shared brain networks for gait control and cognition.65 Specifically, recent evidence shows that gait variability in individuals with dementia is structurally and functionally associated with the primary motor cortex, hippocampus, prefrontal cortex, and basal ganglia—the same areas most affected by AD and PDD pathology.11 Compared with pace, rhythm, and postural control, we found that gait variability was strongly associated with cognitive dysfunction, which suggests that increased variability expresses damage on brain areas and networks critical to stabilizing gait performance.66 Moreover, variability provides real‐time information (ie, stride‐to‐stride) of subtle changes from one stride to the next, that seems not to be well captured by other gait domains thought to strongly depend on conscious or cortical control.60 Noteworthy, as in previous studies,17, 59 gait variability trended to differ between controls and MCI in the expected direction but lacked statistical significance (P = .06), probably due to statistical control for multiple factors or degrees of freedom in our analysis. Finally, among all gait domains, gait variability had the highest accuracy to discriminate individuals with AD, when compared with cognitive healthy controls or other neurodegenerative conditions, with a high specificity, which makes it potentially usable in the clinical setting. Confirming this important finding in a validation cohort and establishing valid cut‐offs for gait variability is required to support potential applicability.
Our study has several strengths, including one of the largest data set of older adults with neurodegenerative conditions affecting cognition that received comprehensive clinical, cognitive, and motor evaluations with state‐of‐the‐art quantitative gait analysis. Our analyses used robust methodology controlling for multicollinearity, correcting for multiple comparisons, and controlling for important confounders. We should also acknowledge some limitations, including the cross‐sectional design that precludes us to perform cause‐effect inferences. Residual confounding can still exist, and matching would have strengthened our models; however, due to the small sample size in some of the clinical groups, matching and subgroup analyses were not feasible to perform. Although we have adjusted for several covariates including co‐morbidities, we were not able to adjust our analyses for medications taken, such as sedatives, that might affect gait performance. Participants with PD were tested during the ON state of anti‐parkinsonism medication effect, which can mask gait pathology.67 Our LBD and FTD samples are smaller compared with previous studies, which may have restricted the statistical power in our analysis. Moreover, unlike that in PDD and AD, we did not include prodromal phases for LBD and FTD.
5. CONCLUSIONS
Increased gait variability may reflect the progression of cognitive impairment in neurodegenerative diseases, and potentially with specificity for Alzheimer's disease dementia, which is the archetypal cortical cognitive disorder. Our study, therefore, supports the notion that, compared with other gait parameters, gait variability may be a putative marker of cognitive‐cortical deterioration in neurodegenerative disorders. A future study using a validation cohort is required to confirm our findings.
CONFLICT OF INTEREST
The authors have declared no conflict of interest.
AUTHOR CONTRIBUTION
FPF: Formal analysis, writing original draft, review and editing. SB: Review and editing, resources. MM: Review and editing, resources. ES: Review and editing, resources. QA: Review and editing. KZHL: Review and editing. LB: Review and editing. RC: Funding acquisition, resources, review and editing, methodology, project administration, supervision. MMO: Funding acquisition, resources, study concept, writing original draft, review and editing, methodology, project administration, supervision.
Supporting information
Supporting Information
ACKNOWLEDGMENTS
The authors would like to thank Myrlene Gee, Jacqueline Burt, Krista Nelles, Einat (Natalie) Ravid, Michael Comishen, Priyanga Jeyarathnarajah, Breni Sharma, Angela Zwiers, Abbie Barron, Alanna Black, Nellie Kamkar, Yanina Sarquis‐Adamson, Teran Nieman, and Emily Cox for their contributions to participant recruitment, data recordings, and data entry.
Pieruccini‐Faria F, Black SE, Masellis M, et al. Gait variability across neurodegenerative and cognitive disorders: Results from the Canadian Consortium of Neurodegeneration in Aging (CCNA) and the Gait and Brain Study. Alzheimer's Dement. 2021;17:1317–1328. 10.1002/alz.12298
Funding information
The Canadian Consortium on Neurodegeneration in Aging (CCNA) is supported by a grant from the Canadian Institutes of Health Research with funding from several partners. Dr Montero‐Odasso's program in Gait and Brain Health and the “Gait and Brain Study” are supported by grants from the Canadian Institutes of Health Research (CIHR; MOP 211220, PJT 153100), the Ontario Ministry of Research and Innovation (ER11–08‐101), the Ontario Neurodegenerative Diseases Research Initiative (OBI 34739), the CCNA (FRN CNA 137794) and the Department of Medicine Program of Experimental Medicine Research Award (POEM 768915), University of Western Ontario. He is the first recipient of the Schulich Clinician–Scientist Award.
REFERENCES
- 1.Allan LM, Ballard CG, Burn DJ, Kenny RA. Prevalence and severity of gait disorders in Alzheimer's and non‐Alzheimer's dementias. J Am Geriatr Soc. 2005. [DOI] [PubMed] [Google Scholar]
- 2.Verghese J, Lipton RB, Hall CB, Kuslansky G, Katz MJ, Buschke H. Abnormality of gait as a predictor of non‐Alzheimer's dementia. N Engl J Med. 2002;347(22):1761‐1768. [DOI] [PubMed] [Google Scholar]
- 3.Kueper JK, Speechley M, Lingum NR, Montero‐Odasso M. Motor function and incident dementia: a systematic review and meta‐analysis. Age Ageing. 2017. [DOI] [PubMed] [Google Scholar]
- 4.Verghese J, Annweiler C, Ayers E, et al. Motoric cognitive risk syndrome: multicountry prevalence and dementia risk. Neurology. 2014;83(8):718‐726. [DOI] [PMC free article] [PubMed] [Google Scholar]
- 5.Savica R, Wennberg AM V, Hagen C, et al. Comparison of gait parameters for predicting cognitive decline: the mayo clinic study of aging. J Alzheimers Dis. 2017:55(2):559‐567. [DOI] [PMC free article] [PubMed] [Google Scholar]
- 6.Montero‐Odasso M, Pieruccini‐Faria F, Ismail Z, et al. CCCDTD5 recommendations on early non cognitive markers of dementia: a Canadian consensus. Alzheimer's DementiaTranslational Res Clin Interv. 2020;1(1):e12068. [DOI] [PMC free article] [PubMed] [Google Scholar]
- 7.Montero‐Odasso MM, Sarquis‐Adamson Y, Speechley M, et al. Association of dual‐task gait with incident dementia in mild cognitive impairment: results from the gait and brain study. JAMA Neurol. 2017;74(7):857‐865. [DOI] [PMC free article] [PubMed] [Google Scholar]
- 8.Hausdorff JM. Gait variability: methods, modeling and meaning. J Neuroengeneering Rehabil. 2005;2:19. [DOI] [PMC free article] [PubMed] [Google Scholar]
- 9.Montero‐Odasso M, Verghese J, Beauchet O, Hausdorff JM. Gait and cognition: a complementary approach to understanding brain function and the risk of falling. J Am Geriatr Soc. 2012;60(11):2127‐2136. [DOI] [PMC free article] [PubMed] [Google Scholar]
- 10.Moon Y, Sung JH, An R, Hernandez ME, Sosnoff JJ. Gait variability in people with neurological disorders: a systematic review and meta‐analysis. Hum Mov Sci. 2016;47:197‐208. [DOI] [PubMed] [Google Scholar]
- 11.Tian Q, Chastan N, Bair WN, Resnick SM, Ferrucci L, Studenski SA. The brain map of gait variability in aging, cognitive impairment and dementia—A systematic review. Neurosci Biobehav Rev. 2017;74:149‐162. [DOI] [PMC free article] [PubMed] [Google Scholar]
- 12.Pieruccini‐Faria F, Montero‐Odasso M, Hausdorff JM, Gait variability and fall risk in older adults: the role of cognitive function. In Montero‐Odasso M, Camicioli R, eds. Falls and Cognition in Older Persons: Fundamentals, Assessment and Therapeutic Options. Cham: Springer International Publishing; 2020:107‐138.
- 13.Hausdorff JM, Rios DA, Edelberg HK. Gait variability and fall risk in community‐living older adults: a 1‐year prospective study. Arch Phys Med Rehabil. 2001;82(8):1050‐1056. [DOI] [PubMed] [Google Scholar]
- 14.Darweesh SKL, Licher S, Wolters FJ, Koudstaal PJ, Ikram MK, Ikram MA. Quantitative gait, cognitive decline, and incident dementia: the Rotterdam Study. Alzheimer's Dement. 2019;15(10):1264‐1273. [DOI] [PubMed] [Google Scholar]
- 15.Ceïde ME, Ayers EI, Lipton R, Verghese J. Walking while talking and risk of incident dementia. Am J Geriatr Psychiatry. 2018;26(5):580‐588. [DOI] [PMC free article] [PubMed] [Google Scholar]
- 16.Montero‐Odasso M, Verghese J, Beauchet O, Hausdorff JM. Gait and cognition: a complementary approach to understanding brain function and the risk of falling. J Am Geriatr Soc. 2012;60(11):2127‐2136. [DOI] [PMC free article] [PubMed] [Google Scholar]
- 17.Montero‐Odasso M, Oteng‐Amoako A, Speechley M, et al. The motor signature of mild cognitive impairment: results from the gait and brain study. J Gerontol A Biol Sci Med Sci. 2014;69(11):1415‐1421. [DOI] [PMC free article] [PubMed] [Google Scholar]
- 18.Montero‐Odasso M, Muir SW, Speechley M. Dual‐task complexity affects gait in people with mild cognitive impairment: the interplay between gait variability, dual tasking, and risk of falls. Arch Phys Med Rehabil. 2012;93(2):293‐299. [DOI] [PubMed] [Google Scholar]
- 19.Nakamura T, Meguro K, Sasaki H. Relationship between falls and stride length variability in senile dementia of the alzheimer type. Gerontology. 1996;42(2):108‐113. [DOI] [PubMed] [Google Scholar]
- 20.Allali G, Annweiler C, Blumen HM, et al. Gait phenotype from mild cognitive impairment to moderate dementia: results from the GOOD initiative. Eur J Neurol. 2016;23(3):527‐541. [DOI] [PMC free article] [PubMed] [Google Scholar]
- 21.Mc Ardle R, Galna B, Donaghy P, Thomas A, Rochester L. Do Alzheimer's and Lewy body disease have discrete pathological signatures of gait? Alzheimer's Dement. 2019;15(10):1367‐1377. [DOI] [PubMed] [Google Scholar]
- 22.Fritz NE, Kegelmeyer DA, Kloos AD, et al. Motor performance differentiates individuals with Lewy body dementia, Parkinson's and Alzheimer's disease. Gait Posture. 2016;50:1‐7. [DOI] [PubMed] [Google Scholar]
- 23.Allali G, Dubois B, Assal F, et al. Frontotemporal dementia: pathology of gait? Mov Disord. 2010;25(6):731‐737. [DOI] [PubMed] [Google Scholar]
- 24.Galna B, Lord S, Burn DJ, Rochester L. Progression of gait dysfunction in incident Parkinson's disease: impact of medication and phenotype. Mov Disord. 2015;30(3):359‐367. [DOI] [PubMed] [Google Scholar]
- 25.Morris R, Lord S, Lawson RA, et al. Gait rather than cognition predicts decline in specific cognitive domains in early Parkinson's disease. Journals Gerontol ‐ Ser A Biol Sci Med Sci. 2017;72(12):1656‐1662. [DOI] [PMC free article] [PubMed] [Google Scholar]
- 26.Montero‐Odasso M. Gait as a biomarker of cognitive impairment and dementia syndromes. Quo Vadis? Eur J Neurol. 2016;23(3):527‐541. [DOI] [PubMed] [Google Scholar]
- 27.Chertkow H, Borrie M, Whitehead V, et al. The comprehensive assessment of neurodegeneration and dementia: Canadian cohort study. Can J Neurol Sci. 2019;46(5):499‐511. [DOI] [PubMed] [Google Scholar]
- 28.Annweiler C, Beauchet O, Bartha R, Montero‐Odasso M. Knowledge WT‐W group A‐L for. Slow gait in MCI is associated with ventricular enlargement: results from the gait and brain study. J Neural Transm. 2013;120(7):1083‐1092. [DOI] [PubMed] [Google Scholar]
- 29.Nasreddine ZS, Phillips N, Chertkow H. Normative data for the montreal cognitive assessment (MoCA) in a population‐based sample. Neurology. 2012;78(10):765‐766.author reply 766. [DOI] [PubMed] [Google Scholar]
- 30.Van Der Elst WIM, Van Boxtel MP, Van Breukelen GJ, Jolles J. Rey's verbal learning test: normative data for 1855 healthy participants aged 24–81 years and the influence of age, sex, education, and mode of presentation. J Int Neuropsychol Soc. 2005;11(3):290‐302. [DOI] [PubMed] [Google Scholar]
- 31.Lawton MP, Brody EM. Assessment of older people: self‐maintaining and instrumental activities of daily living. Gerontologist. 1969;9(3):179‐186. [PubMed] [Google Scholar]
- 32.Yesavage JA. Geriatric Depression Scale. Psychopharmacol Bull. 1988;24(4):709‐711. [PubMed] [Google Scholar]
- 33.Jessen F, Amariglio RE, Van Boxtel M, et al. A conceptual framework for research on subjective cognitive decline in preclinical Alzheimer's disease. 2014;. 10(6):844‐852. [DOI] [PMC free article] [PubMed] [Google Scholar]
- 34.Morris JC, Ernesto C, Schafer K, et al. Clinical dementia rating training and reliability in multicenter studies: the Alzheimer's Disease Cooperative Study experience. Neurology. 1997;48(6):1508‐1510. [DOI] [PubMed] [Google Scholar]
- 35.Mormino EC, Kluth JT, Madison CM, et al. Episodic memory loss is related to hippocampal‐mediated β‐amyloid deposition in elderly subjects. Brain. 2009;132(Pt 5):1310‐1323. [DOI] [PMC free article] [PubMed] [Google Scholar]
- 36.Beeri MS, Schmeidler J, Sano M, et al. Age, gender, and education norms on the CERAD neuropsychological battery in the oldest old. Neurology. 2006;67(6):1006‐1010. [DOI] [PMC free article] [PubMed] [Google Scholar]
- 37.Albert MS, DeKosky ST, Dickson D, et al. The diagnosis of mild cognitive impairment due to Alzheimer's disease: recommendations from the National Institute on Aging‐Alzheimer's Association workgroups on diagnostic guidelines for Alzheimer's disease. 2011;7(3):270‐279. [DOI] [PMC free article] [PubMed] [Google Scholar]
- 38.Postuma RB, Poewe W, Litvan I, et al. Validation of the MDS clinical diagnostic criteria for Parkinson's disease. Mov Disord. 2018;33(10):1601‐1608. [DOI] [PubMed] [Google Scholar]
- 39.Goetz CG, Tilley BC, Shaftman SR, et al. Movement Disorder Society‐sponsored revision of the Unified Parkinson's Disease Rating Scale (MDS‐UPDRS): scale presentation and clinimetric testing results. Mov Disord. 2008;23(15):2129‐2170. [DOI] [PubMed] [Google Scholar]
- 40.McKhann GM, Knopman DS, Chertkow H, et al. The diagnosis of dementia due to Alzheimer's disease: recommendations from the National Institute on Aging‐Alzheimer's Association workgroups on diagnostic guidelines for Alzheimer's disease. Alzheimer's Dement. 2011;7(3):263‐269. [DOI] [PMC free article] [PubMed] [Google Scholar]
- 41.Litvan I, Goldman JG, Tröster AI, et al. Diagnostic criteria for mild cognitive impairment in Parkinson's disease: movement Disorder Society Task Force guidelines. Mov Disord. 2012;27(3):349‐356. [DOI] [PMC free article] [PubMed] [Google Scholar]
- 42.Emre M, Aarsland D, Brown R, et al. Clinical diagnostic criteria for dementia associated with Parkinson's disease. 2007;22(12):1689‐1707. [DOI] [PubMed] [Google Scholar]
- 43.Dubois B, Burn D, Goetz C, et al. Diagnostic procedures for Parkinson's disease dementia: recommendations from the Movement Disorder Society Task Force. Mov Disord. 2007;22(16):2314‐2324. [DOI] [PubMed] [Google Scholar]
- 44.Schwab RS & England, AC. Projection techniques for evaluating surgery in Parkinson's Disease. IN: Third Symposium on Parkinson's Disease, Royal College of Surgeons in Edinburgh, May 20‐22, 1968. E.& S. Livingstone Ltd. 1969. (Table 1, page 153). 2010;152–157. [Google Scholar]
- 45.McKeith IG, Boeve BF, DIckson DW, et al. Diagnosis and management of dementia with Lewy bodies. Neurology. 2017;89:88‐100. [DOI] [PMC free article] [PubMed] [Google Scholar]
- 46.Rascovsky K, Hodges JR, Knopman D, et al. Sensitivity of revised diagnostic criteria for the behavioural variant of frontotemporal dementia. Brain. 2011;134:2456‐2477. [DOI] [PMC free article] [PubMed] [Google Scholar]
- 47.Cullen S, Montero‐Odasso M, Bherer L, et al. Guidelines for gait assessments in the Canadian consortium on neurodegeneration in aging (CCNA). Can Geriatr J. 2018;21(2):157‐165. [DOI] [PMC free article] [PubMed] [Google Scholar]
- 48.Vallabhajosula S, Humphrey SK, Cook AJ, Freund JE. Concurrent validity of the zeno walkway for measuring spatiotemporal gait parameters in older adults. J Geriatr Phys Ther. 2019) 42E42–E50. [DOI] [PubMed] [Google Scholar]
- 49.Lord S, Howe T, Greenland J, Simpson L, Rochester L. Gait variability in older adults: a structured review of testing protocol and clinimetric properties. Gait Posture. 2011;34(4):443‐450. [DOI] [PubMed] [Google Scholar]
- 50.Gabell A, Nayak USL. The effect of age on variability in gait. J Gerontol. 1984;39(6):662‐666. [DOI] [PubMed] [Google Scholar]
- 51.Verghese J, Holtzer R, Lipton RB, Wang C. Quantitative gait markers and incident fall risk in older adults. J Gerontol ‐ Ser A Biol Sci Med Sci. 2009);64(8):896–901. [DOI] [PMC free article] [PubMed] [Google Scholar]
- 52.Verghese J, Wang C, Lipton RB, Holtzer R, Xue X. Quantitative gait dysfunction and risk of cognitive decline and dementia. J Neurol Neurosurg Psychiatry. 2007);78(9):929–935. [DOI] [PMC free article] [PubMed] [Google Scholar]
- 53.Field A. Exploratory factor analysis (Chapter 17). Discovering Statistics using SPSS, 3rd Edition. 2009:627–685. [Google Scholar]
- 54.Kang HG, Dingwell JB. Separating the effects of age and walking speed on gait variability. Gait Posture. 2008;27(4):572‐577. [DOI] [PubMed] [Google Scholar]
- 55.Jack CR, Knopman DS, Jagust WJ, et al. Hypothetical model of dynamic biomarkers of the Alzheimer's pathological cascade. Lancet Neurol. 2010;9(1):119‐128. [DOI] [PMC free article] [PubMed] [Google Scholar]
- 56.Akobeng AK. Understanding diagnostic tests 3: receiver operating characteristic curves. Acta Paediatr Int J Paediatr. 2007;96(5):644‐647. [DOI] [PubMed] [Google Scholar]
- 57.Murray JS. Multiple imputation: a review of practical and theoretical findings. Stat Sci. 2018;33(2):142‐159. [Google Scholar]
- 58.Sánchez‐Ferro Á, Matarazzo M, Martínez‐Martín P, et al. Minimal clinically important difference for UPDRS‐III in daily practice. Mov Disord Clin Pract. 2018;5(4):448‐450. [DOI] [PMC free article] [PubMed] [Google Scholar]
- 59.Muir SW, Speechley M, Wells J, Borrie M, Gopaul K, Montero‐Odasso M. Gait assessment in mild cognitive impairment and Alzheimer's disease: the effect of dual‐task challenges across the cognitive spectrum. Gait Posture. 2012;35(1):96‐100. [DOI] [PubMed] [Google Scholar]
- 60.Pieruccini‐Faria F, Montero‐Odasso M. Obstacle negotiation, gait variability, and risk of falling: results from the “Gait and Brain Study”. J Gerontol ‐ Ser A Biol Sci Med Sci. 2019;74(9):1422‐1428. [DOI] [PubMed] [Google Scholar]
- 61.Maidan I, Shustak S, Sharon T, et al. Prefrontal cortex activation during obstacle negotiation: what's the effect size and timing? Brain Cogn. 2018;122:45‐51. [DOI] [PubMed] [Google Scholar]
- 62.De Cock AM, Fransen E, Perkisas S, et al. Comprehensive quantitative spatiotemporal gait analysis identifies gait characteristics for early dementia subtyping in community dwelling older adults. Front Neurol. 2019;10:313. [DOI] [PMC free article] [PubMed] [Google Scholar]
- 63.Pieruccini‐Faria F, Sarquis‐Adamson Y, Anton‐Rodrigo I, et al. Mapping associations between gait decline and fall risk in mild cognitive impairment. J Am Geriatr Soc. 2020;68(3):576‐584. [DOI] [PubMed] [Google Scholar]
- 64.McArdle R, Morris R, Wilson J, Galna B, Thomas AJ, Rochester L. What can quantitative gait analysis tell us about dementia and its subtypes? A structured review. J Alzheimer's Dis. 2017;60(4):1295‐1312. [DOI] [PubMed] [Google Scholar]
- 65.Morris R, Lord S, Bunce J, Burn D, Rochester L. Gait and cognition: mapping the global and discrete relationships in ageing and neurodegenerative disease. Neurosci Biobehav Rev. 2016;64:326‐345. [DOI] [PubMed] [Google Scholar]
- 66.Lo O‐Y, Halko MA, Zhou J, Harrison R, Lipsitz LA, Manor B. Gait speed and gait variability are associated with different functional brain networks. Front Aging Neurosci . 2017;9:390. [DOI] [PMC free article] [PubMed] [Google Scholar]
- 67.Smulders K, Dale ML, Carlson‐Kuhta P, Nutt JG, Horak FB. Pharmacological treatment in Parkinson's disease: effects on gait. Park Relat Disord. 2016;31:3‐13. [DOI] [PMC free article] [PubMed] [Google Scholar]
Associated Data
This section collects any data citations, data availability statements, or supplementary materials included in this article.
Supplementary Materials
Supporting Information