

Abstract
Electromagnetic fields (EMFs) are widely used in a number of cell therapies and bone disorder treatments, and nanomagnetic particles (NMPs) also promote cell activity. In this study, we investigated the synergistic effects of EMFs and NMPs on the osteogenesis of the human Saos‐2 osteoblast cell line and in a rat calvarial defect model. The Saos‐2 cells and critical‐size calvarial defects of the rats were exposed to EMF (1 mT, 45 Hz, 8 h/day) with or without Fe3O4 NMPs. Biocompatibility was evaluated with MTT (3‐(4,5‐dimethylthiazol‐2‐yl)‐2,5‐diphenyltetrazolium bromide) and LDH (lactate dehydrogenase) assays. This analysis showed that NMP and EMF did not induce cell toxicity. Quantitative reverse‐transcription polymerase chain reaction indicated that the osteogenesis‐related markers were highly expressed in the NMP‐incorporated Saos‐2 cells after exposure to EMF. Also, the expression of gene‐encoding proteins involved in calcium channels was activated and the calcium concentration of the NMP‐incorporated + EMF‐exposed group was increased compared with the control group. In particular, in the NMP‐incorporated + EMF‐exposed group, all osteogenic proteins were more abundantly expressed than in the control group. This indicated that the NMP incorporation + EMF exposure induced a signaling pathway through activation of p‐ERK and calcium channels. Also, in vivo evaluation revealed that rat calvarial defects treated with EMFs and NMPs had good regeneration results with new bone formation and increased mineral density after 6 weeks. Altogether, these results suggest that NMP treatment or EMF exposure of Saos‐2 cells can increase osteogenic activity and NMP incorporation following EMF exposure which is synergistically efficient for osteogenesis.
Keywords: calcium channel, calvarial defect model, electromagnetic fields, nanomagnetic particle, osteogenesis
1. INTRODUCTION
Electromagnetic fields (EMFs) have been widely used in the stimulation of wound healing and for relieving pain. Numerous attempts have been made to evaluate the effects of EMFs on cellular activity and proliferation.1, 2 Especially, electromagnetic stimulation has been studied for applications in treating bone disorders and regenerating bone. Several studies have reported that EMFs increase the proliferation of human osteoblasts and osteosarcoma cell lines in vitro.3, 4, 5 Also, it has been reported that exposure to various EMFs (7.5–75 Hz) plays a modulatory role in the osteogenic differentiation of human bone marrow‐derived mesenchymal stem cells with an increase in alkaline phosphatase and osteogenesis‐related genes.6, 7, 8 EMFs have been reported to stimulate healing in disconnected fractures of the tibia, induce bone repair,9 and to reduce the healing time following fresh fractures.10 This knowledge is based on the discovery of the electromechanical properties of bone,11, 12 which raised the possibility that electric energy may stimulate bone formation and modify the behavior of bone cells.13, 14
Also, nanoparticles (NPs) have been widely used in biomedical applications such as drug delivery, biological labels, and the detection of proteins, and many studies have shown that NPs promote the migration and differentiation of cells, thereby inducing stem cell differentiation and stimulating wound healing.15, 16, 17 Kim et al.18 showed that Fe3O4 nanomagnetic particles (NMPs) could affect cell–substrate interactions and enhance neurite outgrowth of PC12 cells.17 Especially, surface‐modified NMPs are expected to increase their circulation time, aqueous solubility, biocompatibility, and nonspecific cellular uptake and to decrease immunogenicity.19 Zhang et al.20 reported that PEGylated MNPs not only facilitated cellular uptake into cancer cells but also increased the yield of cell internalization. Additionally, it has been reported that PEGylated NMP increased the wound‐healing effect upon incorporation into human bone marrow‐derived mesenchymal stem cells in injured rat spinal cord.21
Recently, synergistic effect studies on cell proliferation and differentiation have been reported using combinations of magnetic NPs and magnetic fields. Researchers manufactured porous hydroxyapatite, poly(ε‐caprolactone) (PCL), and polylactic acid scaffolds containing or coated with iron oxide magnetic NPs (20–40 nm). Then, various cells were inoculated on the scaffold, and exposed to a magnetic field, followed by an evaluation of osteogenesis. The results of these studies showed that osteogenesis efficacy was increased in the scaffolds with a magnetic field relative to the only‐scaffolds groups.22, 23, 24 Also, another study adhered osteoblasts on RGD‐coated magnetic (4.5 µm ferromagnetic) particles and then exposed them to a magnetic field, thus applying direct mechanical stimulation to the cells (B max approximately 60 mT). Their Von Kossa staining was strong and their messenger RNA (mRNA) expression levels of osteopontin were high.25
However, all of the previous studies evaluated the effect of cell adhesion on NMPs, not the phagocytosis efficacy of NP into the cytosol. We wanted to study the bone regeneration effect after the NMPs were injected directly into the bone defect area, following which the NMPs would be phagocytosed into the surrounding cells, but this method proved to be impossible. Therefore, we manufactured rapidly degradable collagen sponges and inoculated the NMPs just before transplantation because we wanted them to be taken up by the cells.
In the present study, we investigated the synergistic effects of EMF and Fe3O4 NMP treatment on osteogenic activity. We applied EMFs and NMPs to the Saos‐2 osteoblast cell line and a rat calvarial defect model. The Saos2 cells and the rat calvarial defect model were treated with 50 μg/ml of Fe3O4 MPs or exposed to a frequency of 45 Hz at an intensity of 1‐mT EMF for 8 h/day and examined whether treatment with Fe3O4 NMPs in conjunction with exposure to EMFs is more effective in enhancing osteogenic activity.
2. MATERIALS AND METHODS
2.1. Saos‐2 cell culture
The human osteosarcoma cell line Saos‐2 was cultured with RPMI‐1640 media (Welgene) containing 10% fetal bovine serum (Lonza) and 1% penicillin/streptomycin (Welgene). The cells were cultured at 37°C in a 5% humidified CO2 atmosphere in 100‐mm dishes.
2.2. EMF exposure
In this study, continuous sinusoidal EMFs (B m = 1 mT, F = 45 Hz sinusoidal) were used for the experiments (Figure 1). All experimental groups were kept in a cell culture incubator at 37 ± 0.1°C and 5% CO2 concentration.
Figure 1.

(A) Schematic representation of the sinusoidal electromagnetic field (EMF) device. Simulated magnetic flux density distribution at 45 Hz by COMSOL 3.4. (B) Simulation model and simulated magnetic flux density (I ¼ 200 mA). (C) Schematic diagram of the EMF device and distribution of EMF. The sinusoidal EMF device was placed in an incubator with 5% CO₂ maintained at 37°C [Color figure can be viewed at wileyonlinelibrary.com]
Figure 1B shows the simulated magnetic flux density distribution at 45 Hz by COMSOL 3.4 (magnetic flux density: I ¼ 200 mA), and Figure 1C is a schematic diagram of the EMF device and the distribution of the EMF. The stimulation unit was designed to handle a pair of identical coils measuring 40 cm in diameter assembled in a Helmholtz configuration. The pair of coils operated on alternating current, generating EMF, and the current in the coil was controlled by a function generator (FG‐7020A) and power source (Professional Amplifiers, XLS, Crown Audio Inc.). The cells and experimental rats were applied EMF consisting of 45‐Hz frequency and an intensity of 1 mT for 8 h/day.
2.3. Preparation of the Fe3O4 NMPs
Water‐dispersible and biocompatible Fe3O4 NMPs were prepared using a method described previously.20, 25 The monodispersed Fe3O4 NMPs were dispersed in a nonpolar organic solvent and synthesized using a high‐temperature organic solution phase reaction. Iron(III) acetylacetonate (Fe(acac)3, 2 mmol, 99.9%; Sigma‐Aldrich), 1,2‐hexadecanediol (10 mmol, 90%; Sigma‐Aldrich), oleic acid (6 mmol, 99%; Sigma‐Aldrich), oleylamine (6 mmol, 70%; Sigma‐Aldrich), and 1‐octadecene (20 ml, 90%; Sigma‐Aldrich) were mixed and magnetically stirred in a nitrogen atmosphere. The mixture was heated to 200°C for 2 h and then heated to reflux (~300°C) for an additional hour. Ethanol (40 ml) was added to the mixture under ambient conditions, and a black material was precipitated and separated via centrifugation (12,000 rpm, 30 min). The black product was redispersed in hexane in the presence of oleic acid (~0.05 ml) and oleylamine (~0.05 ml). The resulting Fe3O4 NMPs dispersed in chloroform were encapsulated with a polyethylene glycol (PEG)‐phospholipid shell to make them biocompatible. Typically, 2 ml of the organic dispersible 12‐nm Fe3O4 NMPs in chloroform (5 mg/ml) was mixed with 1 ml of chloroform solution containing 10 mg 1,2‐distearoyl‐sn‐glycero‐3‐phosphoethanolamine‐N‐(methoxy(PEG)‐2000; mPEG‐2000 PE; Avanti Polar Lipids Inc.) at a ratio of 5:1. After complete evaporation of the chloroform, the residue was incubated at 80°C in vacuum for 1 h. Then, 5 ml of water was added, which produced a clear and dark‐brown suspension containing the PEG–PE micelles. In this study, 50 µg/ml of Fe3O4 NMPs were added to the medium.
2.4. Characterization of Fe3O4 NMPs
The crystal structures of the obtained Fe3O4 NMPs were studied by powder X‐ray diffraction (XRD) measurements using Ni‐filtered Cu Kα radiation (λ = 1.5418 Å, D/MAX 2000 vk/pc; Rigaku) with a graphite‐diffracted beam monochromator. The patterns were recorded at an operating voltage of 40 kV and a current of 20 mA. The morphology and size of the obtained Fe3O4 NMPs were examined using a JEOL JEM‐3010 high‐resolution transmission electron microscope (HR‐TEM) at an operating voltage of 300 kV (Figure 2A,D).25
Figure 2.

High‐resolution transmission electron microscopy images of (A) the pristine Fe3O4 nanomagnetic particles (NMPs) deposited from chloroform dispersion on an amorphous carbon‐coated copper grid, and (D) polyethylene glycol (PEG)‐encapsulated Fe3O4 NMPs deposited from a phosphate‐buffered saline (PBS) dispersion on an amorphous carbon‐coated copper grid. (B,E) The particle size distribution curves and (C,F) dispersions of the pristine Fe3O4 and PEG‐encapsulated Fe3O4 NMPs, respectively. X‐ray diffraction patterns of (G) the pristine Fe3O4 NMPs, and (H) PEG‐encapsulated Fe3O4 NMPs [Color figure can be viewed at wileyonlinelibrary.com]
2.5. Proliferation and activity assay of Saos‐2
Cell proliferation was measured with a 3‐(4,5‐dimethylthiazol‐2‐yl)‐2,5‐diphenyltetrazolium bromide (MTT; Sigma‐Aldrich) assay. For the MTT assay, the cells were cultured in a six‐well plate, and each well was supplemented with MTT (3 mg/ml; n = 4). The plates were then incubated in the dark at 37°C in an atmosphere containing 5% CO2 for 2 h, and the supernatant was aspirated. Dimethyl sulfoxide was added, and the six‐well plate was shaken slowly for 5 min. The absorption was measured at 570 nm.
2.6. Lactate dehydrogenase (LDH) assay
LDH activity was measured using an LDH‐LQ kit (Asan Pharmaceutical Inc.). Briefly, after 7 days of culture, 20‐μl culture medium and 50 μl of working solution were mixed and incubated in darkness at room temperature for 30 min. The reaction was terminated by adding 1‐N HCl, and the absorbance was measured at 570 nm.
2.7. Reverse‐transcription polymerase chain reaction (RT‐PCR) analysis
The total RNA of the cells was isolated using 500‐μl TRIzol (Sigma‐Aldrich). Subsequently, 100 μl of chloroform was added, and the solution was mixed and incubated for 3 min. After centrifugation (12,000 rpm, 4°C for 15 min), the upper phase was transferred into a new tube, and 500 μl of isopropanol was added. After a 10‐min incubation period and another centrifugation step (14,000 rpm, 4°C for 10 min), the supernatant was discarded. The pellet was washed with 1 ml of 70% ethanol and centrifuged (9500 rpm, 4°C for 5 min). The supernatant was discardedand the pellet was dried. The pellet was dissolved in 20 μl of diethyl pyrocarbonate‐water. Reverse transcriptase reactions were used to synthesize complementary DNA from 1 μg of total RNA using an Advantage RT‐PCR Kit (Clontech). RT‐PCR was routinely performed. The primer sequences used for the RT‐PCR are listed in Table 1, and ImageJ software (National Institutes of Health) was used for the quantitative analysis of RT‐PCR amplicons on the digitized gel images.
Table 1.
Primers sequences used for reverse‐transcription polymerase chain reaction experiments
| Genes | Upstream primer sequence | Downstream primer sequence |
|---|---|---|
| GAPDH | 5ʹ‐ACCACAGTCCATGCCATCAC‐3ʹ | 5ʹ‐TCCACCACCCTGTTGCTGTA‐3ʹ |
| Collagen1 | 5ʹ‐GAAAACATCCCAGCCAAGAA‐3ʹ | 5ʹ‐CAGGTTGCCAGTCTCCTCAT‐3ʹ |
| Collagen3 | 5ʹ‐CAGGTGAACGTGGAGCTG C‐3ʹ | 5ʹ‐TGCCACACGTGTTTCCGTGG‐3ʹ |
| Osteonectin | 5ʹ‐CCAGAACCACCACTGCAAAC‐3ʹ | 5ʹ‐GGCAGGAAGAGTCGAAGGTC‐3ʹ |
| Osteocalcin | 5ʹ‐AGGGGAAGAGGAAAGAAGGG‐3ʹ | 5ʹ‐CCAGGCGCTACCTGTATCAA‐3ʹ |
| Osteopontin | 5ʹ‐TCGCAGACCTGACATCCAGT‐3ʹ | 5ʹ‐TCGGAATGCTCATTGCTCTC‐3ʹ |
| BMP2 | 5ʹ‐GTCCAGCTGTAAGAGACACC‐3ʹ | 5ʹ‐GTACTAGCGACACCCACAAC‐3ʹ |
| Runx‐2 | 5ʹ‐CTCACTACCACACCTACCTG‐3ʹ | 5ʹ‐TCAATATGGTCGCCAAACAGATTC‐3ʹ |
| BSP | 5ʹ‐CACAGCCTCATCTTCATGG‐3ʹ | 5ʹ‐GCATCTCATAGTGCATCTGG‐3ʹ |
| OPG | 5ʹ‐AAAACGGCAACACAGCTCAC‐3ʹ | 5ʹ‐AGGGGAAGAGGAAAGAAGGG‐3ʹ |
| CACNA1G | 5ʹ‐CGGCAACTACGTGCTCTTC A‐3ʹ | 5ʹ‐GTGACTTCATCTCGTGGGCC‐3ʹ |
| CACNA1I | 5ʹ‐CGTTGTCATAGCGACCCAGTT‐3ʹ | 5ʹ‐CACAGCTCTCTTCCCCGAGTGA‐3ʹ |
Abbreviations: BMP‐2, bone morphogenic protein‐2; BSP, bone sialoprotein; CACNA1G, alpha 1G subunit of the T‐type voltage‐dependent calcium channel; CACNA1I, alpha 1I subunit of T‐type voltage‐dependent calcium channel; OPG, osteoprotegerin; Runx‐2, Runt‐related transcription factor 2.
2.8. Western blot analysis
After 10 days of culture, the cells were collected, washed with phosphate‐buffered saline (PBS) and lysed with using radioimmunoprecipitation assay buffer containing 50‐mM Tris‐HCl, pH 8.0, 150‐mM NaCl, 1% NP‐40, 0.5% sodium deoxycholate, 0.1% SDS (Sigma‐Aldrich), and protease inhibitors (Complete™; Roche Diagnostics) for 10 min at 4°C. The cell lysates were then denatured at 100°C for 5 min. The protein content of the cell lysates was quantified by the bicinchoninic acid assay, and equal amounts of protein per sample were separated by 10% sodium dodecyl sulfate‐polyacrylamide gel electrophoresis and electrotransferred onto a nitrocellulose membrane (Millipore Co.). The membranes were blocked in 5% fat‐free skim milk dissolved in Tris‐buffered saline (TBS) containing 0.1% Tween‐20 (TBS‐T buffer) at room temperature for 1 h. After washing with TBS‐T, the membrane was incubated for 1 h in 10% bovine serum albumin containing the indicated primary antibodies: anti‐BSP, anti‐osteopontin, anti‐osteonectin, anti‐osteocalcin, anti‐versican, anti‐ERK, anti‐p‐ERK, anti‐p38, anti‐p‐p38, and anti‐β‐actin. The blots were incubated with the primary antibodies at a dilution of 1:5000 and then further incubated with horseradish peroxidase‐conjugated secondary antibody for 2 h at room temperature. The membrane was washed in TBS‐T; the blot was visualized with enhanced chemiluminescence reagent (Thermo Fisher Scientific) and photographed using a gel imaging system, ChemiDoc XRS+ (Bio‐Rad). The results were quantified using ImageJ software (National Institutes of Health).
2.9. Immunocytochemical analysis
The cells grown on coverslips were fixed using 4% paraformaldehyde for 20 min at 4°C and then washed with 10‐mM Tris‐HCl buffer. Then, they were incubated with the indicated primary antibodies: anti‐osteocalcin (predilution, AM 386; BioGenex), anti‐osteopontin (1:1000 dilution), and anti‐osteonectin (1:500 dilution, AB 1858; Chemicon) for 24 h, followed by development using EnVision Plus Reagent (Dako), diaminobenzidine as a chromogen, and Mayer's hematoxylin as a counterstain. Microscopic images were captured with a Nikon digital camera attached to a Nikon Optiphot‐2 microscope.
2.10. Von Kossa staining
The mineralized matrix of the cells was assessed using 5% silver nitrate (Sigma‐Aldrich) under ultraviolet light for 60 min, followed by 3% sodium thiosulphate (Sigma‐Aldrich) for 5 min, and then counterstained with Van Gieson (Sigma‐Aldrich) for 5 min. The mineral was stained black and the osteoid was stained red by this method.
2.11. Immunofluorescence
For staining of the intracellular proteins, the cells were fixed and then permeabilized with 0.1% Triton X‐100 (Sigma‐Aldrich) for 5 min on ice. They were incubated with mouse primary antibodies against human osteopontin (1:1000) for 1 h, followed by a fluorescein‐coupled anti‐rabbit IgG secondary antibody for 1 h.
2.12. Quantitative colorimetric calcium assay
Colorimetric calcium was measured using a QuantiChrom™ Calcium Assay Kit (Bioassay Systems). Briefly, samples were lysed with Pro‐prep lysis buffer. Following preparation of the samples, they were mixed with working reagent by combining equal volumes of Reagent A and Reagent B. These reagents were equilibrated to room temperature before use. The mixtures were incubated for 3 min at room temperature. The amount of calcium was quantified by absorbance at 570 nm.
2.13. In vivo critical‐sized calvarial bone defect model in the Lewis rat
The experiment was approved by the Institutional Animal Care Use Committee (IACUC Approval No. 2019‐023‐1) and performed according to the NIH Guidelines for the Care and Use of Laboratory Animals. Twenty‐five male Lewis rats (10 weeks old) were used for scaffold implantation and EMF exposure in the calvarial defect. The animals were anesthetized with sevoflurane (SevoFlo; Aesica Queenborough Limited) in combination with air and O2. A saline‐cooled trephine drill was used to create two defects of 4‐mm diameter in each parietal bone, carefully protecting the dura mater. The rats were randomly allocated into the following groups, and the defects were filled with collagen sponge scaffolds as indicated: (i) sham surgery, (ii) collagen sponge, (iii) collagen sponge soaked in NMP‐incorporated, (iv) collagen sponge + EMF‐exposed, (v) collagen sponge soaked in NMP‐incorporated + EMF‐exposed. The incisions were closed with 4–0 vicryl sutures. The animals were given a subcutaneous analgesic dose of buprenorphine (temgesic, 0.3 mg/kg). The animals were monitored daily for the condition of the surgical wound, animal activity, food intake, and any signs of infection. Animals were euthanized with CO2 inhalation at 6 weeks.
2.14. Microcomputed tomographic (micro‐CT) analysis
The rats were killed 40 days after surgery, and the specimens were fixed in 10% formalin for 1 week. Micro‐CT scans were taken and analyzed as previously described.26 In brief, micro‐CT scans were taken using the Quantum FX micro‐CT X‐ray system (PerkinElmer). Source voltage and current were set at 90 kV and 180 µA, respectively. The exposure time was 316 ms for optimized clearness. An optimized three‐dimensional (3D) cone beam reconstruction algorithm with a cluster volumetric reconstruction (Feldkamp algorithm) was used. A CT‐analyzing program used two‐dimensional (2D)‐cut images to build a 3D model. The scan parameters were 20–100 kV, 10 W with rotation. Full 3D images of the whole calvarial bone were obtained with a cubic size of 34.58 µm. Reconstruction and analyses were performed using NRecon reconstruction® (SkyScanVR) and CTAn 1.8® software (SkyScanVR), respectively. To measure the newly formed bone, the volume of interest was demarcated in each 2D image. Then, microarchitecture parameters, including bone volume (BV), were obtained using CTAn 1.8 software, according to the manufacturer's instructions. To measure bone mineral density (BMD), the attenuation data for the volume of interest was converted into Hounsfield units and expressed as a value of BMD using phantom scans (QRM). BMD values were expressed in terms of grams per cubic centimeter of calcium hydroxyapatite in distilled water.
2.15. Statistical analysis
Data were analyzed using one‐way analysis of variance and Student's t test. When the p value was <.05 or <.01, the difference between means was considered significant (*p < .05, **p < .01). Graphical representations were produced using Sigmaplot 2001.
3. RESULTS
3.1. HR‐TEM and X‐ray diffraction analysis of NMP
Figure 2A shows an HR‐TEM image of the spherical and uniform pristine Fe3O4 NMPs with a high degree of crystallinity, in addition to a nonaggregated form. These Fe3O4 NPs self‐assemble in a hexagonal close‐packed superlattice due to their high degree of uniformity in diameter. The presence of the residual surfactants (oleic acid and oleylamine) on the NP surface keeps them isolated from each other by a coating layer of about 2 nm, which acts as an ideal system for their encapsulation with PEG.
Figure 2D presents an HR‐TEM image of the PEG‐encapsulated Fe3O4 NMPs that shows no obvious change in core size after PEG encapsulation.27 Even though it is hard to identify the PEG encapsulation by HR‐TEM measurements due to it being organic materials, the PEG‐encapsulated Fe3O4 NMPs were well dispersed in the PBS media without any aggregation.
Figures 2B and 2E demonstrate the particle size distribution (PSD) of the pristine Fe3O4 NMPs and PEG‐encapsulated Fe3O4 NMPs. The PSD calculated on about 100 NPs in different images in the bright field mode led to a measured mean diameter of 12.1 ± 0.8 and 12.0 ± 0.8 nm, respectively.
Also, Figures 2C and 2F shows the dispersibility of the pristine Fe3O4 NMPs and PEG‐encapsulated Fe3O4 NMPs. The pristine Fe3O4 NMPs (Figure 2C) can be dispersed in an organic solvent such as chloroform, but after PEG encapsulation (Figure 2F), these NMPs were well dispersed in aqueous media such as PBS for biological applications.
The XRD patterns of the dry powders of the Fe3O4 NMPs are shown in Figure 2G,H. The position and relative intensity of all diffraction peaks can be indexed to a pure fcc phase [space group: Fd3m (227)] of Fe3O4 with cell constants a = 8.394 Å, which match well with that of Fe3O4 (JCPDS No. 89‐3854). After PEG encapsulation occurs on the surface of the Fe3O4 NMPs, all of the diffraction peaks related to the pristine Fe3O4 NMPs clearly remain without any distinctive change (Figure 2G,H).27 These results support the conclusion that the crystal structure of the Fe3O4 NMPs does not change after PEG encapsulation.
3.2. Morphology of Saos‐2
Figure 3 shows the morphology of the Saos‐2 cells under different culture conditions. The Saos‐2 cells were observed to have a small and polygonal morphology, and morphological changes or necrosis were not observed in any of the experimental groups. Therefore, NMP incorporation, EMF exposure, and NMP incorporation with EMF exposure were not found to induce cytotoxicity.
Figure 3.

Morphology of the Saos‐2 after electromagnetic field (EMF) treatment. Cultured in maintenance medium (A), magnetic nanoparticle (NMP)‐incorporated (B), exposed to EMF (C), and NMP‐incorporated with exposed EMF (NMP + EMF) (D) for 7 days. Original magnification: (A–D) ×100, scale bar = 100 μm
3.3. Effects on proliferation and cytotoxicity assays
Biocompatibility of the EMFs and NMPs was evaluated by MTT and LDH assays. The initial seeding cell number in each subculture was the same in each group. Saos‐2 cell proliferation was measured by MTT assays at Days 3 and 7. The level of cell mitochondrial activity of the four experimental groups was similar (Figure 4A). So, these results showed that the NMP treatment and/or the EMF exposure did not have an adverse effect on proliferation or mitochondrial activity († p > .05, †† p > .05).
Figure 4.

Effect of NMPs and EMF on the proliferation of Saos‐2. (A) MTT assay was performed to evaluate cell viability of Saos‐2 under different conditions (control, NMP, EMF, NMP/EMF) after 7 days. (B) Effect of culture conditions on the cytotoxicity of Saos‐2 after culture for 7 days. Their cytotoxicity was measured by an LDH Assay Kit. EMF, electromagnetic field; LDH, lactate dehydrogenase; MTT, 3‐(4,5‐dimethylthiazol‐2‐yl)‐2,5‐diphenyltetrazolium bromide; NMP, nanomagnetic particle. † p > .05
For examination of the membrane damage of Saos‐2 cells under different culture conditions, we performed LDH assays. The media was collected at Day 7 and analyzed. The NMP‐incorporated, EMF‐exposed, and NMP‐incorporated + EMF‐exposed groups did not have increased levels of LDH secretion (Figure 4B). No groups displayed a prominent difference in LDH († p > .05). Therefore, the LDH activity of the four experimental groups was similar, and it is believed that NMP and EMF did not induce cellular membrane damage.
3.4. Expression of osteogenic‐related genes
For evaluation of the effect of NMP treatment and EMF exposure on Saos‐2 gene expression, total RNA was isolated from the cells of all groups, and RT‐PCR was carried out (Figure 5A). We examined the expression of each gene after normalizing it to that of GAPDH, and we reported the difference as the fold change (Figure 5B).
Figure 5.

Level of gene expression detected by reverse‐transcription polymerase chain reaction (RT‐PCR) on Saos‐2 after culture for 7 days. (A) Electrophoretic RT‐PCR analysis of osteogenesis‐related genes and (B) quantitative analysis of messenger RNA (mRNA) levels of osteogenic markers in Saos‐2 cultures relative to GAPDH. (C) Electrophoretic RT‐PCR analysis of calcium channel‐related genes and (D) quantitative analysis of mRNA levels of osteogenic markers in Saos‐2 cultures relative to GAPDH. (E) The calcium concentration of Saos‐2 was detected by a Calcium Assay Kit. The calcium concentration of the nanomagnetic particle (NMP)‐incorporated + electromagnetic field (EMF)‐exposed group has increased about 10% compared with the control group (*p < .05, **p < 0.05)
The major osteogenesis markers, collagen I, osteocalcin, and bone morphogenetic protein 2 (BMP‐2) were enhanced by more than 1.5‐fold, and osteopontin and osteoprotegerin (OPG) were highly expressed at the transcript level by more than threefold in the NMP‐incorporated + EMF‐exposed group compared with the control. The expression of the major bone matrix protein markers collagen I, collagen III, and osteocalcin were increased by 20%, and osteopontin, osteonectin. In the case of NMP‐incorporated + EMF‐exposed group, collagen I, osteocalcin, osteopontin, osteonectin, BMP‐2, OPG were highly expressed, and the expression levels of the bone matrix protein genes were significantly increased.
Also, the mRNA expression level of the transcription factor Runx‐2 was measured. Runx‐2 expression was enhanced in the NMP‐incorporated, EMF‐exposed, and NMP‐incorporated + EMF‐exposed groups by over twofold compared with the control groups. As shown in Figure 5B, the expression level of the osteogenic‐related genes was enhanced in the NMP‐incorporated + EMF‐exposed group compared with the other groups.
3.5. Evaluation of calcium channels
Calcium activation affects bone formation and osteogenic differentiation. Thus, calcium channel activation was measured by RT‐PCR. After 3 days of osteogenesis with NMP‐incorporation and/or EMF exposure, the mRNA levels of CACNA1G and CACNA1I were significantly increased (Figure 5C,D). This showed that NMP plus EMF exposure induced the activation of calcium channels.
To examine the mineralization of the Saos‐2 cells, a quantitative colorimetric calcium assay was performed on Day 7 (Figure 5E). The EMF‐exposed and NMP‐incorporated + EMF‐exposed groups exhibited higher calcium concentrations relative to the control group. Especially, the calcium concentration of the NMP‐incorporated + EMF‐exposed group increased by about 10% compared with the control group (*p < .05).
3.6. EMF and NMPs increase osteogenic protein expression in Saos‐2 cells
We evaluated the expression of osteogenesis‐related proteins by Western blot analysis of Saos‐2 cells after culture for 7 days, using β‐actin as an internal control. The results shown in Figure 6A indicate that the expression of osteogenic proteins increased after NMP treatment and EMF exposure compared with the control group. In particular, in the NMP‐incorporated + EMF‐exposed group, all osteogenic proteins (including osteopontin, osteonectin, osteocalcin, and versican) were more abundantly expressed than in the control group.
Figure 6.

Western blot analysis of Saos‐2 after culture of 7 days. Whole cell lysates were immunoblotted with antibodies against (A) osteogenesis‐related proteins (bone sialoprotein, osteopontin, osteonectin, versican, osteocalcin), (B) ERK and p‐ERK, (C) p38 and p‐p38. EMF, electromagnetic field; NMP, nanomagnetic particle
To assess the mechanism involved in the osteogenesis of Saos‐2 cells, we evaluate the activation of p‐ERK and p‐p38 signaling. Western blot analysis revealed that the levels of phosphorylated ERK and phosphorylated p38 increased in the EMF‐exposed and NMP‐incorporated + EMF‐exposed group (Figure 6B,C).
3.7. Immunocytochemistry and immunofluorescence
To further evaluate the protein expression of osteogenesis‐related proteins and mineralization, immunocytochemical staining was performed. We applied Von Kossa staining for the investigation of the mineralization of the Saos‐2 cells during osteogenesis (Figure 7A–D). The EMF‐exposed group exhibited a small amount of matrix mineralization, while the NMP‐incorporated + EMF‐exposed Saos‐2 cells exhibited stronger matrix mineralization compared with the other groups on Day 7. Osteocalcin was expressed in the NMP‐incorporated, EMF‐exposed, and NMP‐incorporated + EMF‐exposed groups compared with the control group (Figure 7E–H). The other osteogenesis markers (osteonectin, osteopontin) were more highly expressed in the NMP‐incorporated, EMF‐exposed, and NMP‐incorporated + EMF‐exposed groups compared with the control group (Figure 7I–P). The related staging intensity was scored as follows (Table 2): no or weak staining (−), low intensity (+), moderate intensity (++), and strong intensity (+++).
Figure 7.

Immunocytochemical and Von Kossa staining of the Saos‐2 after culture for 7 days. (A–D) Von Kossa, (E–H) ostoecalcin, (I–L) osteonectin, (M–P) osteopontin; original magnification: ×100, scale bar = 100 μm. EMF, electromagnetic field; NMP, nanomagnetic particle [Color figure can be viewed at wileyonlinelibrary.com]
Table 2.
Staining results of the osteogenic markers
| Control | MP | EMF | MP + EMF | |
|---|---|---|---|---|
| Von Kossa | − | − | + | +++ |
| Osteocalcin | − | + | + | ++ |
| Osteonectin | − | + | + | ++ |
| Osteopontin | + | +++ | ++ | +++ |
Abbreviations: EMF, electromagnetic field; MP, magnetic particle.
Immunofluorescence staining of the Saos‐2 cells indicated the expression of the osteogenic‐related protein, osteopontin (Figure 8). Saos‐2 cells were fixed and labeled with anti‐osteopontin and DAPI (4′,6‐diamidino‐2‐phenylindole). Very weak signals were detected in the control group, while bright signals were observed in the NMP‐incorporated, EMF‐exposed, and NMP‐incorporated + EMF‐exposed group. Especially, many of the cells were strongly labeled in the NMP‐incorporated + EMF‐exposed group.
Figure 8.
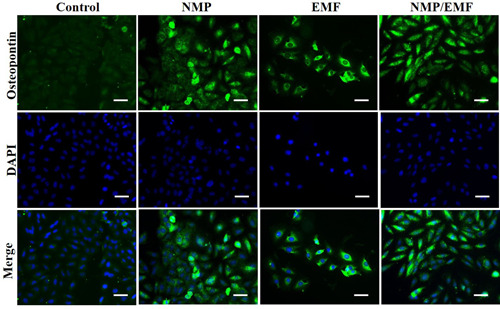
Immunofluorescence staining of Saos‐2 after culture for 7 days. Cells were fixed and labeled with anti‐osteopontin (green); original magnification: ×200, scale bar = 50 μm. EMF, electromagnetic field; NMP, nanomagnetic particle [Color figure can be viewed at wileyonlinelibrary.com]
3.8. Micro‐CT 3D analysis
In the micro‐CT 3D images, new bone was observed at the margin of the defect in all groups. However, the bone density was higher in the NMP‐incorporated + EMF‐exposed group than in the NMP‐incorporated and EMF‐exposed groups at 6 weeks (Figure 9A). BV was significantly higher in the NMP‐incorporated + EMF‐exposed group than in the NMP‐incorporated and EMF‐exposed groups at 6 weeks (Figure 9B). The BV of the NMP‐incorporated + EMF‐exposed group at 6 weeks was 60.24 ± 4.9375%, which was higher than that of the NMP‐incorporated group (39.224 ± 3.94%) and the EMF‐exposed group (43.964 ± 5.50%) at 6 weeks. Also, the BMDs of the NMP‐incorporated + EMF‐exposed group were higher than in the NMP‐incorporated and EMF‐exposed groups at 6 weeks (Figure 9C).
Figure 9.

Micro‐computed tomography evaluation of bone regeneration in the rat calvarial defects at 6 weeks post‐experiment. (A) Top views of the reconstructed images; (B) bone volume/total volume in the defects; (C) bone mineral density in the defects. EMF, electromagnetic field; NMP, nanomagnetic particle. Mean ± SD; n = 3. *Significant difference between groups (*p < .05, **p < .01)
4. DISCUSSION
The aim of this study was to investigate the osteogenic co‐effect of EMF and NMPs on Saos‐2 cells and a rat calvarial defects model. We evaluated the combination of these two parameters to induce synergic efficiency of osteogenesis in vitro and in vivo.
In this study, our data showed that no morphological changes of the Saos‐2 cells were observed, such as vacuole or signs of apoptosis, after EMF exposure (45 Hz, 1 mT, 8 h/day) and NMP treatment. Also, the LDH activity of the four experimental groups was similar. LDH is a cytoplasmic catalytic enzyme related to the reversible conversion of pyruvic acid to lactic acid, and it is released through the cell membrane when it is damaged.28
Many researchers have reported that radiofrequency exposure (RF, 900–1800 MHz) can induce mitochondrial DNA damage, reactive oxygen species (ROS), and apoptosis of cells. Other researchers have reported that exposure to more than 2 mT between 50 and 120 Hz or for a long time could induce an increase of mitochondrial damage or ROS.29 This is the result of cell damage and death caused by high frequency, high‐intensity magnetic fields, and long‐term exposure.
Some investigators reported that NPs can reduce cell viability and activity or did not have a positive effect on a dose, size, and surface character‐dependent manner.30, 31, 32, 33 Hou et al. showed that TiO2 NPs (size: 14–196 nm, dose: 0.05–0.2 mg/ml) decreased the migration and osteogenic differentiation of mesenchymal stromal cell (MSC),32 and Jiráková et al.33 reported that silica‐coated cobalt zinc ferrite NPs decreased cell proliferation of induced pluripotent stem cell cultures.
Our Fe3O4 NMPs were encapsulated with a PEG‐phospholipid shell to make them biocompatible, and the NMPs were inoculated at a concentration (50 µg/ml) that did not cause toxicity after cytotoxicity evaluation. Our results confirmed they were not cytotoxic to Saos‐2 cells and neither was the EMF exposure at 45 Hz, 1 mT, and 8 h/day during osteogenesis (Figure 4B).
Also, we examined the effects of EMF and NMPs on the expression of specific osteogenesis markers, such as BSP, osteocalcin, osteopontin, osteonectin, and osteoprotegerin. The gene expression and protein levels of these markers were all increased in the NMP‐incorporated + EMF‐exposed Saos‐2 cells (Figures 5 and 6). The osteogenesis markers of osteocalcin, osteopontin, osteonectin, and BSP were particularly highly expressed in the NMP‐incorporated + EMF‐exposed group. Osteocalcin and osteonectin are expressed in the earlier mineralization process, and osteopontin is an important marker of post‐mitotic osteoblasts.34, 35, 36 Also, BSP is expressed in osteoblasts37 and can function as a nucleator of mineralization in vitro and in vivo.38 In addition, the expression levels of major bone formation genes, collagen I, collagen III, Runx‐2, and bone morphogenetic protein 2 (BMP‐2), were increased in the NMP‐incorporated + EMF‐exposed groups. It is well known that BMP‐2 can induce the formation of bone39, 40 and it stimulates the expression of other osteogenic markers, such as osteopontin, osteocalcin, BSP, and alkaline phosphatase.41, 42 In our results, in the NMP‐incorporated + EMF‐exposed group, there was increased osteogenic‐related marker expression compared with the control and the other groups.
EMF effects have been previously investigated with osteoblasts and MSC. Martino et al. showed that EMF increased the ALP activity of Saos‐2 cells and mineral nodule formation at 0.9 mT, 15 Hz.8 Other studies have reported using EMF to induce the differentiation of stem cells into osteoblast‐like cells. Jazayeri et al.16 showed that EMF increased proliferation, Runx‐2 and OCN expression of rat MSC at 0.2 mT, 15 Hz. Kang et al.43 reported that EMFs at 30/45 Hz, 1 mT increased ALP, collagen I, and Runx‐2 expression when adipocyte stem cells were differentiated into osteoblasts. Furthermore, Lim et al. showed that exposure of alveolar bone‐derived MSC to various frequencies (10, 50, 100 Hz) of EMF (0.6 mT) strongly increased proliferation, mineralization, ALP, and calmodulin expression at 50 Hz.22
However, in every study, EMF did not increase the activity of osteoblasts. Chang et al. reported that low intensity (15 Hz, 0.1 mT) EMF decreased ALP activity and RANKL expression of mouse osteoblasts.9 Although the exact cause is unknown, the differences in these experimental results are expected to be due to the differences in the equipment, as all of the electromagnetic equipment applied were not off‐the‐shelf devices.
As well, research using NPs has been carried out in all areas of bio‐ and medical fields,44, 45 especially on the proliferation and differentiation of cells and wound healing using magnetic NPs.30 Choi et al. reported that 40 nm of chitosan‐conjugated gold NPs increased ALP, BSP, and OCN expression and enhanced the osteogenic differentiation of human adipose‐derived mesenchymal stem cells through Wnt/β‐catenin activation.46 Also, Zhang et al.47 showed that 45‐nm gold NPs induced ALP activity, mineralized nodule formation, and osteogenic‐related gene expression, but 5‐nm gold NPs reduced osteogenesis. Also, the effect of osteogenic differentiation using magnetic particles has been studied. Wang et al.17 reported that 30 nm of iron oxide NPs increased Runx‐2, BMP‐2, OMD, and ENG expression during induced osteogenic differentiation of human bone‐derived mesenchymal stem cells (hBMSCs).
Recently, the combined effects of magnetic NPs and magnetic fields have been studied for increasing cell proliferation and differentiation efficacy. Huang et al. manufactured hydroxyapatite scaffolds containing magnetic NPs and exposed the cells on them to EMFs to compare the osteogenic differentiation efficiency of MSC. In that study, there was no difference in cell proliferation or the expression of osteocalcin, only a slight increase in the expression of ALP and collagen.23 However, Paun et al. coated iron oxide NPs (20 nm) on a 3D scaffold and exposed cells on the scaffold to a magnetic field, then evaluated the osteogenesis of the MG‐63 osteoblast‐like cells. They reported that the amount of APL activity, osteocalcin, and Alizarin Red was increased in the magnetic field exposure group.24 Also, Russo et al. manufactured a PCL scaffold containing 20% of 25 nm of iron oxide (Fe3O4) and exposed cells on the scaffold to a magnetic field, and then analyzed the osteogenesis efficacy of MSC. Although there was no significant difference in cell proliferation, the expression of ALP and p‐ERK increased in cells exposed to the field but not NMPs compared with cells only exposed to NMPs. Also, the expression of ALP and p‐ERK increased strongly when the cells were exposed to both NMPs and EMFs. This can be interpreted to mean the osteogenic differentiation effect of EMFs is greater than that of magnetic NPs.22
The results of the above report are similar to our findings, and together they can be interpreted to have confirmed that a combination of magnetic NPs and magnetic fields has a synergistic effect on osteogenesis.
This result is also related to calcium channels and calcium concentrations. The mRNA expression of CACNA1G and CACNA1I in the NMP‐incorporated + EMF‐exposed group was higher than that of the other groups (Figure 5D). So, NMP‐incorporated + EMF‐exposed groups exhibited an increased calcium concentration. Many other investigators have reported that magnetic fields increase the intracellular Ca2+ concentration in lymphocytes, osteoblasts, neural stem cells, pituitary cells, and Jurkat cells.36 Also, 50 Hz of EMFs enhanced the expression of voltage‐gated calcium channels in the membrane of neuroendocrine cells.48, 49 Calcium is an important regulator of cellular activity, and enhanced calcium levels have important regulatory consequences in bone cells.50, 51 The calcium channels play fundamental roles in cellular responses to external stimuli in bone cells and activation of calcium channel signals is a key early feature of osteoblastic activation.52, 53 This means that the Saos‐2 cells' calcium channels were activated, indicating that osteogenesis and bone formation were upregulated.
NMP incorporation + EMF exposure induces signaling pathways through activation of p‐ERK, p‐p38, and Runx‐2. Several studies have mentioned that p‐ERK activation is an essential mediator of growth factor‐induced cell behavior and differentiation in various cell types, including osteoblasts.54, 55, 56, 57, 58, 59 The p38 signaling pathway plays an important role in the regulation of osteogenesis and osteogenic differentiation.46, 60 Also, Runx‐2 is involved in the production of bone matrix proteins, as it is able to promote the expression of major bone matrix protein genes, leading to an increase in immature osteoblasts differentiating from pluripotent stem cells; the immature osteoblasts then form immature bone.61, 62, 63 A related study reported that osteogenic differentiation of hBMSCs using 30 nm of iron oxide NPs was induced by the Runx‐2, ERK, and MAPK signaling pathways.17 In our study, we detected increased levels of phosphorylated ERK and phosphorylated p38 after 7 days of osteogenesis in the NMP‐incorporated + EMF‐exposed group.
We have confirmed the above results through immunocytochemical analysis. The NMP‐incorporated + EMF‐exposed group showed enhanced Von Kossa staining of Saos‐2 cells. Von Kossa staining is generally used to quantify mineralization.64, 65 Additionally, the results showed that exposure to EMFs and NMP treatments has the potential to facilitate osteogenesis based on the results of immunocytochemical staining and immunofluorescence (Figures 7 and 8). Saos‐2 cells more strongly expressed osteocalcin, osteopontin, and osteonectin in the NMP‐incorporated + EMF‐exposed group than the control group by immunocytochemical staining. In addition, in the immunofluorescence staining, we detected strong signals in the NMP‐incorporated, EMF‐exposed, and NMP‐incorporated + EMF‐exposed groups and weak signals in the control group. This means that NMPs and EMFs promote the mineralization of Saos‐2 cells.
To evaluate the bone regeneration efficacy of animals based on the in vitro results, the regeneration efficacy of NMPs and EMF were assessed using a rat calvarial defect model, and it was confirmed that there was a synergy effect of a combination of NMPs and EMF as shown in Figure 9.
Bone regeneration showed similar results to the in vitro analysis. We predicted that NMPs contained in a collagen scaffold would be phagocytosed by migrating osteoblasts or MSCs after transplantation, inducing cell activity or promoting their differentiation. Also, EMF exposure highly increased the osteogenic effect of NMP for bone regeneration. A previous study has reported that EMF exposure with MSCs containing NMP implanted in a spinal cord injury increased nerve regeneration compared with EMF exposure with only MSCs.
Taken together, these results suggest that treatment with NMPs or exposure to EMFs increases osteogenesis, and NMP incorporation in conjunction with EMFs exposure is more effective in enhancing osteogenesis. The results of this study demonstrated that NMPs can potentially be used on medical devices or scaffold materials, and that EMFs can be used for the rehabilitation of osteogenic wounds.
5. CONCLUSION
In this study, we have demonstrated that combined NMP treatment and EMF stimulation have a positive synergic effect on osteogenesis in vitro and in vivo. Also, NMP incorporation with EMF exposure was found to accelerate the expression of osteogenic markers and bone regeneration through calcium channel and p‐ERK activation. The results of our study demonstrated that these combined effects of EMFs and NMP have the potential to be used in clinical applications on bone disease and fractures.
CONFLICT OF INTERESTS
The authors declare that there are no conflict of interests.
ACKNOWLEDGMENT
This study was supported by the Basic Science Research Program through the National Research Foundation of Korea (NRF) funded by the Ministry of Education (NRF‐2019R1I1A2A01063305).
Kim Y‐M, Lim H‐M, Lee E‐C, Ki G‐E, Seo Y‐K. Synergistic effect of electromagnetic fields and nanomagnetic particles on osteogenesis through calcium channels and p‐ERK signaling. J Orthop Res. 2021;39:1633–1646. 10.1002/jor.24905
REFERENCES
- 1.Martino CF, Belchenko D, Ferguson V, Nielsen‐Preiss S, Qi HJ. The effects of pulsed electromagnetic fields on the cellular activity of SaOS‐2 cells. Bioelectromagnetics. 2008;29:125‐132. [DOI] [PubMed] [Google Scholar]
- 2.Chang WHS, Chen LT, Sun JS, Lin FH. Effect of pulse‐burst electromagnetic field stimulation on osteoblast cell activities. Bioelectromagnetics. 2004;25:457‐465. [DOI] [PubMed] [Google Scholar]
- 3.Luben RA. Effects of low‐energy electromagnetic fields (pulsed and DC) on membrane signal transduction processes in biological systems. Health Phys. 1991;61:15‐28. [DOI] [PubMed] [Google Scholar]
- 4.De Mattei M, Caruso A, Traina GC, Pezzetti F, Baroni T, Sollazzo V. Correlation between pulsed electromagnetic fields exposure time and cell proliferation increase in human osteosarcoma cell lines and human normal osteoblast cells in vitro. Bioelectromagnetics. 1999;20:177‐182. [DOI] [PubMed] [Google Scholar]
- 5.Diniz P, Shomura K, Soejima K, Ito G. Effects of pulsed electromagnetic field (PEMF) stimulation on bone tissue like formation are dependent on the maturation stages of the osteoblasts. Bioelectromagnetics. 2002;23:398‐405. [DOI] [PubMed] [Google Scholar]
- 6.Pilla AA. Low‐intensity electromagnetic and mechanical modulation of bone growth and repair: are they equivalent? J Orthop Sci. 2002;7:420‐428. [DOI] [PubMed] [Google Scholar]
- 7.Tsai MT, Li WJ, Tuan RS, Chang WH. Modulation of osteogenesis in human mesenchymal stem cells by specific pulsed electromagnetic field stimulation. J Orthop Res. 2009;27:1169‐1174. [DOI] [PMC free article] [PubMed] [Google Scholar]
- 8.Sun W, Tan Q, Pan Y, Fu Y, Sun H, Chiang H. Pulsed electromagnetic fields accelerate proliferation and osteogenic gene expression in human bone marrow mesenchymal stem cells during osteogenic differentiation. Bioelectromagnetics. 2010;31:209‐219. [DOI] [PubMed] [Google Scholar]
- 9.Andrew C, Bassett L, Pawluk RJ, Pilla AA. Augmentation of bone repair by inductively coupled electromagnetic fields. Science. 1974;184:575‐577. [DOI] [PubMed] [Google Scholar]
- 10.Grace KL, Revell WJ, Brookes M. The effects of pulsed electromagnetism on fresh fracture healing: osteochondral repair in the rat femoral groove. Orthopedics. 1998;21:297‐302. [DOI] [PubMed] [Google Scholar]
- 11.Fukada E, Yasuda I. On the piezoelectric effect of bone. J Phys Soc Jpn. 1957;12:1158‐1162. [Google Scholar]
- 12.Bassett CAL, Becker RO. Generation of electric potentials by bone in response to mechanical stress. Science. 1962;137:1063‐1064. [DOI] [PubMed] [Google Scholar]
- 13.Spadaro JA. Mechanical and electrical interactions in bone remodeling. Bioelectromagnetics. 1997;18:193‐202. [PubMed] [Google Scholar]
- 14.Bassett CAL, Pawluk RJ, Becker RO. Effects of electric currents on bone in vivo. Nature. 1964;204:652‐654. [DOI] [PubMed] [Google Scholar]
- 15.Pankhurst QA, Connolly J, Jones SK, Dobson J. Applications of magnetic nanoparticles in biomedicine. J Phys D Appl Phys. 2003;36:R167‐R181. [Google Scholar]
- 16.Jazayeri M, Shokrgozar MA, Haghighipour N, et al. Effects of electromagnetic stimulation on gene expression of mesenchymal stem cells and repair of bone lesions. Cell Journal (Yakhteh). 2017; 1:3. [DOI] [PMC free article] [PubMed] [Google Scholar]
- 17.Wang Q, Chen B, Cao M, et al. Response of MAPK pathway to iron oxide nanoparticles in vitro treatment promotes osteogenic differentiation of hBMSCs. Biomaterials. 2016;86:11‐20. [DOI] [PubMed] [Google Scholar]
- 18.Kim JA, Lee N, Kim BH, et al. Enhancement of neurite outgrowth in PC12 cells by iron oxide nanoparticles. Biomaterials. 2011;32:2871‐2877. [DOI] [PubMed] [Google Scholar]
- 19.Greenwald RB, Choe YH, McGuire J, Conover CD. Effective drug delivery by PEGylated drug conjugates. Adv Drug Deliv Rev. 2003;55:217‐250. [DOI] [PubMed] [Google Scholar]
- 20.Zhang Y, Kohler N, Zhang M. Surface modification of superparamagnetic magnetite nanoparticles and their intracellular uptake. Biomaterials. 2002;23:1553‐1561. [DOI] [PubMed] [Google Scholar]
- 21.Cho H, Choi YK, Lee DH, et al. Effects of magnetic nanoparticle‐incorporated human bone marrow‐derived mesenchymal stem cells exposed to pulsed electromagnetic fields on injured rat spinal cord. Biotechnol Appl Biochem. 2013;60:596‐602. [DOI] [PubMed] [Google Scholar]
- 22.Russo T, Peluso V, Gloria A, et al. Combination design of time‐dependent magnetic field and magnetic nanocomposites to guide cell behavior. Nanomaterials. 2020;10:577. [DOI] [PMC free article] [PubMed] [Google Scholar]
- 23.Huang J, Wang D, Chen J, et al. Osteogenic differentiation of bone marrow mesenchymal stem cells by magnetic nanoparticle composite scaffolds under a pulsed electromagnetic field. Saudi Pharm J. 2017;25:575‐579. [DOI] [PMC free article] [PubMed] [Google Scholar]
- 24.Paun I, Popescu R, Calin B, Mustaciosu C, Dinescu M, Luculescu C. 3D biomimetic magnetic structures for static magnetic field stimulation of osteogenesis. Int J Mol Sci. 2018;19:495. [DOI] [PMC free article] [PubMed] [Google Scholar]
- 25.Cartmell SH, Dobson J, Verschueren SB, El Haj AJ. Development of magnetic particle techniques for long‐term culture of bone cells with intermittent mechanical activation. IEEE Trans Nanobioscience. 2002;99:92‐97. [DOI] [PubMed] [Google Scholar]
- 26.Kim IS, Lee EN, Cho TH, et al. Promising efficacy of Escherichia coli recombinant human bone morphogenetic protein‐2 in collagen sponge for ectopic and orthotopic bone formation and comparison with mammalian cell recombinant human bone morphogenetic protein‐2. Tissue Eng Part A. 2011;17:337‐348. [DOI] [PubMed] [Google Scholar]
- 27.Lee DH, Kang M, Lee HJ, et al. Enhanced cellular uptake of silica‐coated magnetite nanoparticles compared with PEG‐coated ones in stem cells. J Nanosci Nanotechnol. 2015;15:5512‐5519. [DOI] [PubMed] [Google Scholar]
- 28.Mitchell DB, Santone KS, Acosta D. Evaluation of cytotoxicity in cultured cells by enzyme leakage. J Tissue Cult Methods. 1980;6:113‐116. [Google Scholar]
- 29.Santini SJ, Cordone V, Falone S, et al. Role of mitochondria in the oxidative stress induced by electromagnetic fields: focus on reproductive systems. Oxid Med Cell Longevity. 2018;2018:18. [DOI] [PMC free article] [PubMed] [Google Scholar]
- 30.Wei M, Li S, Le W. Nanomaterials modulate stem cell differentiation: biological interaction and underlying mechanisms. J Nanobiotechnol. 2017;15:1‐13. [DOI] [PMC free article] [PubMed] [Google Scholar]
- 31.Abdal Dayem A, Lee SB, Cho S‐G. The impact of metallic nanoparticles on stem cell proliferation and differentiation. Nanomaterials. 2018;8:761. [DOI] [PMC free article] [PubMed] [Google Scholar]
- 32.Cai K, Hou Y, Li J, et al. Effects of titanium nanoparticles on adhesion, migration, proliferation, and differentiation of mesenchymal stem cells. Int J Nanomedicine. 2013;8:3619. [DOI] [PMC free article] [PubMed] [Google Scholar]
- 33.Jiráková K, Seneklova M, Jirak D, et al. The effect of magnetic nanoparticles on neuronal differentiation of induced pluripotent stem cell‐derived neural precursors. Int J Nanomedicine. 2016;11:6267‐6281. [DOI] [PMC free article] [PubMed] [Google Scholar]
- 34.Harmand M‐F. Molecular interface characterization in human bone matrix: I. Biochemical and IR spectroscopic studies. Biomaterials. 1993;14:978‐984. [DOI] [PubMed] [Google Scholar]
- 35.Termine JD, Kleinman HK, Whitson SW, Conn KM, McGarvey ML, Martin GR. Osteonectin, a bone‐specific protein linking mineral to collagen. Cell. 1981;26:99‐105. [DOI] [PubMed] [Google Scholar]
- 36.Raouf A, Seth A. Discovery of osteoblast‐associated genes using cDNA microarrays. Bone. 2002;30:463‐471. [DOI] [PubMed] [Google Scholar]
- 37.Chen J, Shapiro HS, Wrana JL, Reimers S, Heersche JNM, Sodek J. Localization of bone sialoprotein (BSP) expression to sites of mineralized tissue formation in fetal rat tissues by in situ hybridization. Matrix. 1991;11:133‐143. [DOI] [PubMed] [Google Scholar]
- 38.Hunter GK, Goldberg HA. Nucleation of hydroxyapatite by bone sialoprotein. Proc Natl Acad Sci USA. 1993;90:8562‐8565. [DOI] [PMC free article] [PubMed] [Google Scholar]
- 39.Wozney JM, Rosen V. Bone morphogenetic protein and bone morphogenetic protein gene family in bone formation and repair. Clin Orthop Relat Res. 1998;346:26‐37. [PubMed] [Google Scholar]
- 40.Seeherman H, Wozney JM. Delivery of bone morphogenetic proteins for orthopedic tissue regeneration. Cytokine Growth Factor Rev. 2005;16:329‐345. [DOI] [PubMed] [Google Scholar]
- 41.Kim SE, Yun Y‐P, Park K, et al. The effects of functionalized titanium with alendronate and bone morphogenic protein‐2 for improving osteoblast activity. Tissue Eng Regener Med. 2013;10:353‐361. [Google Scholar]
- 42.Yoon M‐Y, Choo J‐H, Yoon H‐H, et al. Effect of millimeter wave for differentiation of bone marrow stromal cells to osteoblasts‐like cell. Tissue Eng Regener Med. 2014;11:230‐238. [Google Scholar]
- 43.Kang KS, Hong JM, Kang JA, Rhie JW, Jeong YH, Cho DW. Regulation of osteogenic differentiation of human adipose‐derived stem cells by controlling electromagnetic field conditions. Exp Mol Med. 2013;45:e6. [DOI] [PMC free article] [PubMed] [Google Scholar]
- 44.Pillarisetti S, Uthaman S, Huh KM, Koh YS, Lee S, Park IK. Multimodal composite iron oxide nanoparticles for biomedical applications. Tissue Eng Regener Med. 2019;16:1‐15. [DOI] [PMC free article] [PubMed] [Google Scholar]
- 45.Goodarzi H, Hashemi‐Najafabadi S, Baheiraei N, Bagheri F. Preparation and characterization of nanocomposite scaffolds (collagen/β‐TCP/SrO) for bone tissue engineering. Tissue Eng Regener Med. 2019;16:237‐251. [DOI] [PMC free article] [PubMed] [Google Scholar]
- 46.Yi C, Liu D, Fong C‐C, Zhang J, Yang M. Gold nanoparticles promote osteogenic differentiation of mesenchymal stem cells through p38 MAPK pathway. ACS Nano. 2010;4:6439‐6448. [DOI] [PubMed] [Google Scholar]
- 47.Zhang Y, Kong N, Zhang Y, Yang W, Yan F. Size‐dependent effects of gold nanoparticles on osteogenic differentiation of human periodontal ligament progenitor cells. Theranostics. 2017;7:1214‐1224. [DOI] [PMC free article] [PubMed] [Google Scholar]
- 48.Grassi C, D′Ascenzo M, Torsello A, et al. Effects of 50 Hz electromagnetic fields on voltage‐gated Ca2+ channels and their role in modulation of neuroendocrine cell proliferation and death. Cell Calcium. 2004;35:307‐315. [DOI] [PubMed] [Google Scholar]
- 49.Pall ML. Electromagnetic field activation of voltage‐gated calcium channels: role in therapeutic effects. Electromagn Biol Med. 2014;33:251. [DOI] [PubMed] [Google Scholar]
- 50.Berride M. A tale of two messengers. Nature. 1993;365:388‐389. [DOI] [PubMed] [Google Scholar]
- 51.Farley JR, Hall SL, Herring S. Calcitonin acutely increases net 45Ca uptake and alters alkaline phosphatase specific activity in human osteosarcoma cells. Metabolism. 1993;42:97‐104. [DOI] [PubMed] [Google Scholar]
- 52.Duncan RL, Akanbi KA, Farach‐Carson MC. Calcium signals and calcium channels in osteoblastic cells. Semin Nephrol. 1998;18:178‐190. [PubMed] [Google Scholar]
- 53.Yamaguchi D, Hahn T, Iida‐Klein A, et al. Parathyroid hormone‐activated calcium channels in an osteoblast‐like clonal osteosarcoma cell line. cAMP‐dependent and cAMP‐independent calcium channels. J Biol Chem. 1987;262:7711‐7718. [PubMed] [Google Scholar]
- 54.Lai C‐F, Chaudhary L, Fausto A, et al. Erk is essential for growth, differentiation, integrin expression, and cell function in human osteoblastic cells. J Biol Chem. 2001;276:14443‐14450. [DOI] [PubMed] [Google Scholar]
- 55.Azuma N, Duzgun SA, Ikeda M, et al. Endothelial cell response to different mechanical forces. J Vasc Surg. 2000;32:789‐794. [DOI] [PubMed] [Google Scholar]
- 56.Oldenhof AD, Shynlova OP, Liu M, Langille BL, Lye SJ. Mitogen‐activated protein kinases mediate stretch‐induced c‐fos mRNA expression in myometrial smooth muscle cells. Am J Physiol Cell Physiol. 2002;283:C1530‐C1539. [DOI] [PubMed] [Google Scholar]
- 57.Yong Y, Ming ZD, Feng L, Chun ZW, Hua W. Electromagnetic fields promote osteogenesis of rat mesenchymal stem cells through the PKA and ERK1/2 pathways. J Tissue Eng Regener Med. 2016;10:E537‐E545. [DOI] [PubMed] [Google Scholar]
- 58.Klees RF, Salasznyk RM, Kingsley K, Williams WA, Boskey A, Plopper GE. Laminin‐5 induces osteogenic gene expression in human mesenchymal stem cells through an ERK‐dependent pathway. Mol Biol Cell. 2005;16:881‐890. [DOI] [PMC free article] [PubMed] [Google Scholar]
- 59.Salasznyk RM, Klees RF, Hughlock MK, Plopper GE. ERK signaling pathways regulate the osteogenic differentiation of human mesenchymal stem cells on collagen I and vitronectin. Cell Commun Adhes. 2004;11:137‐153. [DOI] [PubMed] [Google Scholar]
- 60.Zhang X, Zhou C, Zha X, et al. Apigenin promotes osteogenic differentiation of human mesenchymal stem cells through JNK and p38 MAPK pathways. Mol Cell Biochem. 2015;407:41‐50. [DOI] [PubMed] [Google Scholar]
- 61.Komori T, Yagi H, Nomura S, et al. Targeted disruption of Cbfa1 results in a complete lack of bone formation owing to maturational arrest of osteoblasts. Cell. 1997;89:755‐764. [DOI] [PubMed] [Google Scholar]
- 62.Ducy P, Zhang R, Geoffroy V, Ridall AL, Karsenty G. Osf2/Cbfa1: a transcriptional activator of osteoblast differentiation. Cell. 1997;89:747‐754. [DOI] [PubMed] [Google Scholar]
- 63.Jeong HM, Choi YH, Jeong HG, Jeong TC, Lee KY. Bromopropane compounds inhibit osteogenesis by ERK‐dependent Runx2 inhibition in C2C12 cells. Arch Pharmacal Res. 2014;37:276‐283. [DOI] [PubMed] [Google Scholar]
- 64.Kóssa G. Über die im Organismus künstlich erzeugbaren Verkalkungen. Beitr Pathol Anat. 1901;29:163‐202. [Google Scholar]
- 65.Bills C, Eisenberg H, Pallante SL. Complexes of organic acids with calcium phosphate: the von Kossa stain as a clue to the composition of bone mineral. Johns Hopkins Med J. 1971;128:194. [PubMed] [Google Scholar]