

Abstract
Buprenorphine extended‐release (BUP‐XR) formulation is a once‐monthly subcutaneous injection for the treatment of opioid use disorder (OUD). Buprenorphine undergoes extensive cytochrome P450 (CYP) 3A4 metabolism, leading to potential drug‐drug interactions (DDIs) as reported for sublingual buprenorphine. Sublingual buprenorphine is subject to first‐pass extraction, as a significant proportion of the dose is swallowed. Because subcutaneous administration avoids first‐pass extraction, the DDI with CYP3A4 inhibitors is expected to be less than the 2‐fold increase reported for the sublingual route. The objective of this analysis was to predict the magnitude of DDI following coadministration of BUP‐XR with a strong CYP3A4 inhibitor or inducer using physiologically based pharmacokinetic (PBPK) modeling. Models were developed and verified by comparing predicted and observed data for buprenorphine following intravenous and sublingual dosing. Comparison of predicted and observed pharmacokinetic (PK) profiles and PK parameters demonstrated acceptable predictive performance of the models (within 1.5‐fold). Buprenorphine plasma concentrations following administration of a single dose of BUP‐XR (300 mg) were simulated using a series of intravenous infusions. Daily coadministration of strong CYP3A4 inhibitors with BUP‐XR predicted mild increases in buprenorphine exposures (AUC, 33%‐44%; Cmax, 17‐28%). Daily coadministration of a strong CYP3A4 inducer was also associated with mild decreases in buprenorphine AUC (28%) and Cmax (22%). In addition, the model predicted minimal increases in buprenorphine AUC (8%‐11%) under clinical conditions of 2 weeks’ treatment with CYP3A4 inhibitors administered after initiation of BUP‐XR. In conclusion, the PBPK predictions indicate that coadministration of BUP‐XR with strong CYP3A4 inhibitors or inducers would not result in clinically meaningful interactions.
Keywords: buprenorphine extended release, CYP3A4, drug‐drug interaction, opioid use disorder, physiologically based pharmacokinetic model
BUP‐XR (also known as RBP‐6000 or SUBLOCADE) is an extended‐release formulation of buprenorphine, a mu‐opioid receptor partial agonist. BUP‐XR was designed as a once‐monthly subcutaneous formulation to maintain therapeutic levels over the entire monthly period and has been shown to be safe and effective in the treatment of opioid use disorder (OUD).1, 2 Other formulations of buprenorphine for the treatment of OUD are also approved and administered via the transmucosal route (sublingual, buccal), the subcutaneous route, or as a 6‐month subdermal implant.
The pharmacokinetics (PK) of buprenorphine has been well characterized for different routes (intravenous, oral, transmucosal) of administration.3, 4, 5, 6, 7, 8, 9 Oral buprenorphine has a low bioavailability as it undergoes extensive first‐pass metabolism by cytochrome P450 (CYP) 3A4 and uridine diphosphate glucuronosyltransferase (UGT).10 Bioavailability is improved by sublingual dosing because the drug absorbed via the sublingual mucosa enters systemic circulation directly, avoiding first‐pass extraction. However, incomplete bioavailability of buprenorphine with sublingual dosing indicates that a significant proportion of the dose is also swallowed. The existence of a first‐pass extraction for the sublingual route is evidenced by the observation of much higher levels of norbuprenorphine, a major metabolite of buprenorphine formed by CYP3A4, after sublingual dosing compared with intravenous dosing of buprenorphine. The drug‐drug interactions (DDIs) between buprenorphine and CYP3A4 inhibitors and inducers have been evaluated following sublingual dosing,11, 12 and a moderate impact (up to 2‐fold change) of strong CYP3A4 inhibition on buprenorphine plasma exposure was observed.9 As subcutaneous administration avoids first‐pass extraction completely, it is expected that the DDI liability will be less than for the sublingual route.
In recent years, physiologically based pharmacokinetic (PBPK) modeling has proven extremely useful for the prediction of DDIs and has become an integral component of regulatory submissions to support label claims.13, 14 The Simcyp Simulator is a PBPK modeling and simulation platform that links in vitro and in silico data to in vivo PK data and that can be used for prediction of first‐in‐human doses, DDI liabilities, and PK outcomes in different populations.15 The aim of the present analysis was to assess the impact of daily coadministration of strong CYP3A4 inhibitors or inducers on the PK of BUP‐XR via PBPK modeling within the Simcyp Simulator. The specific objectives were (1) to develop a PBPK model for buprenorphine that incorporated the relevant metabolic pathways, (2) to verify the model via prediction of buprenorphine PK after intravenous administration and DDIs between sublingual buprenorphine and CYP3A4 inhibitors/inducers, and (3) to assess the DDI liability of BUP‐XR with respect to CYP3A4 inhibitors/inducers under clinical conditions at the highest approved dose of BUP‐XR (300 mg).
Methods
Clinical Studies
Buprenorphine clinical studies utilized in this analysis for the development and verification of PBPK models were all approved by the appropriate institutional review boards, and all subjects provided informed consent prior to entering the studies. Clinical data utilized in the model development and verification are briefly summarized in Supplementary Table S1.
Computer Software
All simulations were performed using the Simcyp Simulator (version 16; Certara UK Limited, Sheffield, UK), with the default “Sim‐Healthy Volunteers” population. DDI effects were simulated using the default perpetrator PBPK model files “Sim‐Ketoconazole‐400mg QD,” “Sim‐Ketoconazole‐200mg BID,” “SV‐Itraconazole‐Fed Capsule,” “SV‐Itraconazole‐Fasting Solution,” and “SV‐Rifampicin‐MD” with the addition of UGT1A1 inhibition and induction parameters for ketoconazole and rifampicin, respectively. The UGT1A1 estimates for inhibition (Ki = 3.3 μM) and induction (Imax = 3.16 μM, IC50 = 0.39 μM) were adopted from the literature.16, 17, 18
General Simulation Design
Model development and verification simulations were run using virtual subjects matched as closely as possible with respect to age and sex to those in the corresponding clinical studies and according to the same trial design. Simulated concentration‐time profiles and PK parameters were compared with observed data to assess prediction accuracy. For model application to BUP‐XR, simulations were run in a population of 100 individuals, aged 20‐50 years, 50% female. For all simulations, virtual trials (n = 10 unless otherwise stated) were generated to assess variability across groups.
Physiologically Based Pharmacokinetic Modeling Strategy
The overall modeling approach of this PBPK analysis is summarized in Figure 1. BUP‐XR is a subcutaneous formulation, and the Simcyp Simulator (version 16) does not contain an option for this route of administration. Therefore, a series of 4 intravenous infusions were required to mimic the clinically observed plasma concentrations following administration of BUP‐XR. In addition, clinical DDI data for the interaction between buprenorphine and CYP3A4 perpetrators, required for verification of the fraction metabolized via CYP3A4, were only available for the sublingual route. For these reasons, the key steps in this PBPK analysis were to
Figure 1.

Overall PBPK modeling approach.
develop a model that successfully described buprenorphine PK following intravenous administration.
modify the model for sublingual administration and verify the model using existing DDI data.
identify the infusion regimen that successfully described buprenorphine plasma concentrations following administration of BUP‐XR and assess the DDI liability for BUP‐XR.
The development, verification, and application of the model are summarized in detail in the following section.
Model Development
The buprenorphine PBPK model was built by incorporating physiochemical, in vitro, and in vivo PK data following intravenous and sublingual administration. Input parameters for the final model are presented in Table 1.
Table 1.
Input Parameter Values Used for Buprenorphine
| Parameter | Valuea | Method/Comment | Reference |
|---|---|---|---|
| Physicochemical parameters | |||
| Molecular weight | 467.64 | ||
| log P | 4.82 | Avdeef, 200322 | |
| pKa1 (acidic) | 9.62 | ||
| pKa2 (basic) | 8.31 | ||
| Blood‐binding parameters | |||
| fu | 0.04 | Elkader and Sproule, 20059 | |
| B:P ratio | 1 | Bullingham et al, 198039 | |
| Absorption parameters | |||
| Papp A‐B (10−6 cm/s) | 44.7 | Caco‐2 pH 7.4:7.4 | Hassan et al, 200926 |
| fa1 | 1 | Assumed | |
| fa2 | 1 | Predicted from Caco‐2 data | Hassan et al, 200926 |
| ka1 (h−1) | 1 | Optimized | |
| ka2 (h−1) | 0.5 | Optimized | |
| Tlag (h) | 0.25 | Optimized | |
| F1 (%; dose dependent) | 8 – 20 | Calculated | |
| F2 (%; dose dependent) | 80 ‐ 92 | ||
| Distribution parameters | |||
| Vss (L/kg) | 13.32 | Full PBPK using method 3 for Kp prediction | |
| Elimination parameters | |||
| CLiv (L/h) | 54 | Huestis et al, 201319 | |
| CLint,u (μL/min/mg protein) | 889 | Retrograde model | |
| CYP3A4 CLint,u (μL/min/mg protein) | 472 | HLM | Kilford et al, 200910 |
| UGT1A1 CLint,u (μL/min/mg protein) | 341 | Corrected for EMs | |
| CLbile (μL/min/106 cells) | 51 | Corrected units | |
B:P, blood‐to‐plasma ratio; CLiv, systemic plasma clearance; CLint,u, unbound intrinsic metabolic clearance; CYP, cytochrome P450; EM, extensive metabolizers; fu, unbound fraction in plasma; fa1, fraction absorbed from the sublingual mucosa; fa2, fraction absorbed from the gut; F1, fraction of a sublingual dose passed to the sublingual mucosa; F2, fraction of a sublingual dose passed to the gut after swallowing; HLM, human liver microsomes; Log P, lipophilicity; ka1, first‐order rate constant for absorption from the sublingual mucosa; ka2, first‐order rate constant for absorption from the gut; pKa1, ionization constant (acidic); pKa2, ionization constant (basic); Papp A‐B, apparent in vitro transcellular permeability coefficient; Tlag, lag time; Vss, volume of distribution at steady state; UGT, uridine diphosphate glucuronosyltransferase.
aDirect entries to the simulator are in bold.
Intravenous Buprenorphine
Intravenous model development was based on a published study in which subjects received a single 8‐mg dose of buprenorphine via an intravenous bolus (see Supplementary Table S1).19 The full (whole‐body) PBPK distribution model (Supplementary Figure S1) best described the observed triphasic buprenorphine plasma concentration‐time profile. The volume of distribution at steady state (Vss) was estimated using tissue‐specific partition coefficients (Kp), tissue volumes, and in vitro blood‐binding data. Kp values for all major tissues were predicted from reported buprenorphine physicochemical properties using an extension of the Rodgers and Rowland method20 that accounts for the impact of membrane potential (method 3 in Simcyp Simulator).21 The predicted Vss and Kp were found to be within 1.25‐fold of the values reported in the literature.19, 22, 23, 24
Following intravenous administration of radiolabeled buprenorphine (99% recovery), the major metabolites identified in urine and feces were norbuprenorphine (and its glucuronide) and a direct glucuronide conjugate.25 Based on the work of Kilford et al,10 the major enzymes involved in the formation of these metabolites are CYP3A4 and UGT1A1, respectively. In vitro intrinsic clearance (CLint,u) values for CYP3A4 (472 μL/min/mg protein) and UGT1A1 (279 μL/min/mg protein) were measured in human liver microsomes.10 In addition to the major metabolites, free buprenorphine was found in feces (33%) and urine (1%) following intravenous administration.25 The 33% free buprenorphine found in feces could be accounted for by biliary clearance and/or deconjugation of glucuronidated parent drug. To ensure accurate prediction of clearance (CL) and inclusion of all routes of elimination, a retrograde approach (using a reverse “well‐stirred” liver model) was used to estimate hepatic CLint,u from the in vivo clearance data reported by Huestis et al19 (CL, 54 L/h; CLH, 53.46 L/h after subtraction of renal clearance; CLR, 54 × 0.01 = 0.54 L/h, based on 1% unchanged in urine). The buprenorphine hepatic CLint,u value of 3321 L/h was adjusted by liver weight and milligrams of microsomal protein per gram of liver to obtain a value of 889 μL/min/mg protein. Following subtraction of the in vitro CLint,u values for CYP3A4 and UGT1A1,10 biliary clearance was estimated to be 138 μL/min/mg protein.
Sublingual Buprenorphine
Sublingual model development was based on 4 clinical trials in which subjects received a single dose of buprenorphine ranging from 2 to 16 mg (see Supplementary Table S1). The intravenous model was adapted for sublingual administration via the addition of relevant absorption parameters. The sublingual route is not currently available in the Simcyp Simulator; therefore, the nonmechanistic inhalation model was used to mimic the sublingual route. This model (Supplementary Figure S2) allows for the absorption of sublingual buprenorphine at 2 sites: from the sublingual mucosa and from the gut (fraction swallowed). The bioavailability of sublingual buprenorphine is then expressed as follows (equation 1):
where F1 is the fraction of the sublingual dose passed to the sublingual mucosa, fa1 is the fraction absorbed from the sublingual mucosa, F2 is the fraction of sublingual dose passed to the gut after swallowing, fa2 is the fraction absorbed from the gut, and FG and FH are the fractions escaping first‐pass metabolism in the gut and the liver, respectively. In the current analysis, fa1 was assumed to be 1, fa2 was set to 1 based on Caco‐2 permeability data,26 FH was estimated to 0.4 based on the “well‐stirred” model of hepatic clearance, and FG was set to 0.2 based on oral buprenorphine bioavailability (Foral) of 8% (data on file). The observed bioavailability of sublingual buprenorphine (calculated using equation 2 below) appeared to be dose dependent.
Thus, for each relevant dose, values for F1 and F2 (=1 − F1) were derived from observed bioavailability data using equation 1 with = 0.08 and = 1 (see Table 1).
The values of ka1 and ka2 were optimized based on observed sublingual data. Parameters related to distribution and elimination remained unchanged.
Model Verification
Intravenous Buprenorphine
Three clinical studies conducted either in healthy subjects or opioid users were used for model verification of buprenorphine PK after single intravenous administration of 0.3‐2 mg buprenorphine (see Supplementary Table S1).
Sublingual Buprenorphine
Data from 2 DDI studies were used to verify the fraction metabolized by CYP3A4 following sublingual administration: (1) a ketoconazole‐buprenorphine DDI study, and (2) a rifampicin‐buprenorphine DDI study (see Supplementary Table S1). The first study was a phase 1 open‐label, fixed‐sequence drug interaction study of ketoconazole in 12 opioid‐dependent subjects.9 Subjects underwent a dose titration period of up to 6 weeks, followed by a 2‐week stabilization phase on sublingual buprenorphine (doses of 8, 12, and 16 mg). Subjects then received sublingual buprenorphine and ketoconazole 400 mg once a day for 6 days. In the second study, 12 healthy subjects received a single 0.6‐mg sublingual dose of buprenorphine and on a separate occasion, an 0.8‐mg sublingual dose of buprenorphine following 6 days of rifampicin dosing (600 mg once a day).12 Simulations were performed to predict the effect of ketoconazole (strong CYP3A4 inhibitor) and rifampicin (strong CYP3A4 inducer) on buprenorphine PK following sublingual dosing using the relevant study design as described above. For the ketoconazole simulation, 20 clinical trials were simulated, and the buprenorphine sublingual dose was 16 mg. For the rifampicin simulation, the F1 value obtained for the 2‐mg dose was applied for the 0.6‐ and 0.8‐mg sublingual doses, as these low doses were not assessed during model development.
Model Application
BUP‐XR
The final PBPK model was used to simulate the PK profile for a single dose (300 mg) of BUP‐XR via a series of 4 intravenous infusions. The infusion dosing and duration were optimized to match closely the buprenorphine plasma concentration profiles observed in a clinical study in which patients with opioid use disorder (OUD) received a single 300‐mg dose of BUP‐XR. Concentrations were simulated over 56 days, given the slow release of buprenorphine from the subcutaneous depot. The apparent terminal plasma half‐life of buprenorphine following subcutaneous injection of BUP‐XR ranges from 43 to 60 days. A comparison of observed and predicted plasma concentrations was performed.
Prediction of the DDI Liability of BUP‐XR
The PBPK model was subsequently applied to predict DDI liability following coadministration of BUP‐XR and CYP3A4 inhibitors or inducers, specifically:
Ketoconazole (strong CYP3A4 inhibitor).
Itraconazole (strong CYP3A4 inhibitor).
Rifampicin (strong CYP3A4 inducer).
For all simulations, the plasma concentration‐time profiles of buprenorphine were simulated over 56 days in the absence and presence of multiple doses of perpetrator compound. For the first DDI simulations, ketoconazole was administered as either 400 mg once a day or 200 mg twice a day for 58 days, with a single dose of 300 mg of BUP‐XR coadministered on the morning of day 3. The second DDI simulations consisted of multiple oral doses of itraconazole 200 mg twice a day (2 dosing scenarios: capsules in the fed state and solution in the fasted state) for 59 days, with a single dose of 300 mg BUP‐XR coadministered on the morning of day 4.27, 28 The third DDI simulation was a single dose of 300 mg of BUP‐XR coadministered on day 8 with rifampicin 600 mg once a day given orally from days 1 to 63.
The PBPK model also assessed the potential interaction of BUP‐XR with CYP3A4 inhibitors in likely clinical scenarios of administration of CYP3A4 inhibitors for a short period following dosing with BUP‐XR. For this simulation, a single dose of 300 mg BUP‐XR was administered on day 1 with daily coadministration of ketoconazole (400 mg once a day or 200 mg twice a day) or itraconazole (200 mg twice a day) on days 8 to 21.
Results
Predicted Buprenorphine Pharmacokinetics Following Intravenous and Sublingual Administration
The PBPK modeling indicated that the full (whole‐body) model (Supplementary Figure S1) was suitable to predict the triphasic kinetics of buprenorphine after intravenous administration, as shown in Supplementary Figure S3 for an 8‐mg dose. Mean values for predicted CL and plasma terminal half‐life (t1/2) were within 1.5‐fold of the observed values (Supplementary Table S2). This model was also verified by comparing simulated and observed PK parameters following single intravenous doses of 0.3, 1, and 2 mg (Supplementary Table S3).
The nonmechanistic inhalation PBPK model (Supplementary Figure S2) was able to adequately describe the PK of buprenorphine after sublingual administration. After accounting for dose dependence in plasma exposure following sublingual dosing, comparison of simulated and observed plasma concentration‐time profiles and PK parameters demonstrated acceptable predictive performance of the model (simulations within 1.5‐fold of observed; see Supplementary Table S4). Simulated plasma concentration‐time profiles following sublingual administration of buprenorphine with and without coadministration of ketoconazole (16 mg for sublingual dosing of buprenorphine and 400 mg/day for ketoconazole) and rifampicin (0.6 mg for sublingual buprenorphine alone and 0.8 mg for sublingual buprenorphine dosed with 600 mg ketoconazole once a day) are shown in Figure 2. The prediction of the observed DDIs of sublingual buprenorphine with ketoconazole and rifampicin were within 1.5‐fold of the observed DDIs after inclusion of inhibition and induction parameters for UGT1A1 (Table 2).
Figure 2.
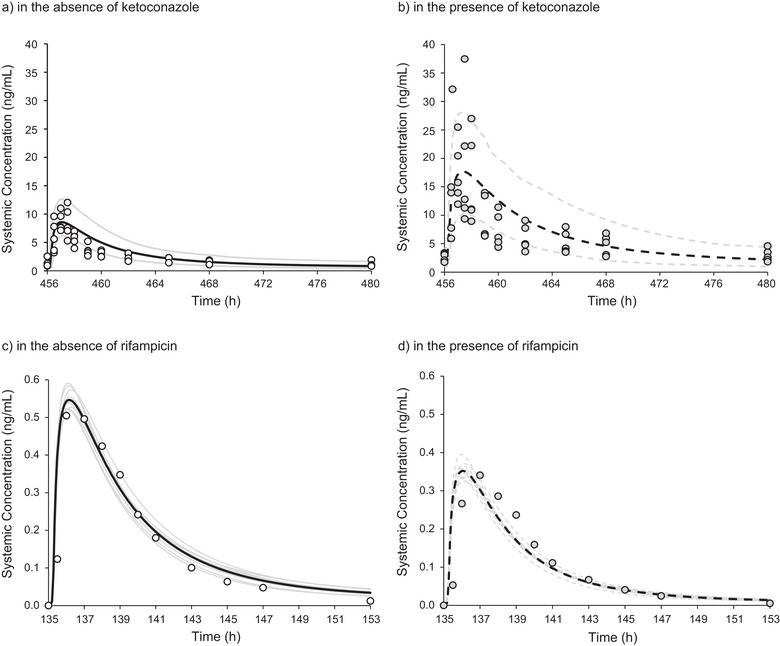
Simulated and observed plasma concentration‐time profiles of sublingual buprenorphine in the presence/absence of ketoconazole and rifampicin. Upper: Observed individual plasma concentrations of buprenorphine (circles, n = 5) compared with simulated data (n = 100) after multiple dosing with 16 mg sublingual buprenorphine once a day in the absence (a) or presence (b) of ketoconazole (400 mg once a day for 6 days). Simulated data are summarized using the mean (black line) and 5th and 95th percentile (gray lines). Lower: Observed mean plasma concentrations of buprenorphine (circles, n = 12) compared with simulated data (10 trials of n = 12) after a single sublingual buprenorphine dose of 0.6 mg in the absence of rifampicin (c) and 0.8 mg in the presence of rifampicin—600 mg once a day for 6 days (d). Mean buprenorphine concentrations were normalized to the dose of 1 mg. Mean profiles are shown for each simulated trial (gray lines) with the overall mean simulated profile displayed as a black curve.
Table 2.
Geometric Mean Ratios (GMRs) of Sublingual Buprenorphine Pharmacokinetics in the Presence/Absence of Ketoconazole or Rifampicin
| Intervention | Cmax GMRa | AUC GMRa | |
|---|---|---|---|
| Ketoconazole 400 mg QD | Observed | 1.98 | 2.46 |
| Predicted | 2.01 | 2.49 | |
| (Trial range) | (1.70‐2.41) | (2.06‐3.04) | |
| Rifampicin 600 mg QD | Observed | 0.58 | 0.56 |
| Predicted | 0.65 | 0.56 | |
| (Trial range) | (0.60‐0.69) | (0.53‐0.61) |
QD, once a day.
Values for rifampicin were recalculated for dose correction.
Model Application: Subcutaneous Administration and DDI Liability
Using a series of 4 intravenous infusions, the final PBPK model adequately described the buprenorphine concentration‐time profile following subcutaneous dosing with BUP‐XR (Figure 3). The model was then applied to predict the DDI liability with CYP3A4 inhibitors and inducers using the highest approved dose of BUP‐XR, 300 mg. The prediction of the DDI liability of BUP‐XR was assessed with respect to daily coadministration of ketoconazole, itraconazole, and rifampicin. The model predicted that under conditions of daily coadministration of strong CYP3A4 inhibitors with BUP‐XR, mild increases in buprenorphine exposure (AUC) of 33%‐44% and maximum concentration (Cmax) of 17%‐28% are expected (Table 3). Two dosing regimens (400 mg once a day and 200 mg twice a day) were assessed for ketoconazole, both of which were associated with a mild increase in exposure (35% and 44%, respectively). In addition, 2 dosing scenarios were considered for itraconazole (capsules in the fed state and solution in the fasted state) and were also associated with mild increases in exposure (33% and 40%, respectively). Coadministration of a strong inducer (rifampicin) was associated with mild decreases in buprenorphine AUC (28%) and Cmax (22%); see Table 3.
Figure 3.

Simulated and observed plasma concentration‐time profiles of buprenorphine following a single 300 mg subcutaneous dose of BUP‐XR. Lines represent simulated plasma concentrations and circles represent individual observed data. The black line represents the mean, and the gray lines represent the 5th and 95th percentiles for the simulated population (n = 100). The figure on the right shows the first 168 hours postdose.
Table 3.
Application of PBPK Model to Simulate Buprenorphine Pharmacokinetics Following a Single 300‐mg Subcutaneous Dose of BUP‐XR and Daily Coadministration of Ketoconazole, Itraconazole, or Rifampicin
| Intervention | Regimen | Effect on Cmax (%) | Effect on AUC (%) |
|---|---|---|---|
| Ketoconazole | 400 mg QD | +17 (12‐24) | +35 (28‐44) |
| 200 mg BID | +28 (24‐34) | +44 (38‐53) | |
| Itraconazole | 200 mg BID fed | +19 (11‐24) | +33 (22‐41) |
| 200 mg BID fasted | +25 (18‐32) | +40 (30‐50) | |
| Rifampicin | 600 mg QD | −22 (20‐25) | −28 (26‐32) |
BID, twice a day; QD, once a day.
The PBPK model was validated using clinical drug‐drug interaction data for ketoconazole and rifampicin; no such data were available for itraconazole.
This PBPK analysis also evaluated the potential interaction of BUP‐XR with CYP3A4 inhibitors in likely clinical scenarios in which ketoconazole or itraconazole is dosed for a short period after starting administration of BUP‐XR; see Figure 4a,b (ketoconazole 400 mg once a day and 200 mg twice a day, respectively). Under clinical conditions in which CYP3A4 inhibitors could be administered after initiation of BUP‐XR therapy, simulations indicated minimal increases in overall buprenorphine AUC following coadministration of strong CYP3A4 inhibitors (8%‐10% for ketoconazole once or twice a day and 8%‐11% for itraconazole).
Figure 4.

Simulated single‐dose plasma concentration‐time profiles for BUP‐XR 300 mg in the absence (solid lines) and presence (dashed lines) of ketoconazole (a) 400 mg once a day, and (b) 200 mg once a day, on days 8‐21. The gray lines represent the outcomes of simulated individual trials (10 trials of n =10), and the black lines are the means for the simulated population (n = 100) in the absence of ketoconazole. The red and yellow lines are the corresponding values in the presence of ketoconazole.
Discussion
In this analysis, a PBPK model for buprenorphine has been developed and verified for known routes of administration (intravenous, sublingual) to enable prediction of the DDI liability (as a CYP3A4 substrate) of a novel formulation (BUP‐XR) and route of administration (subcutaneous). The critical parameters for a PBPK model assessing DDI relate to the elimination pathways and most importantly the fraction metabolized (fm) by the major enzyme of interest (ie, CYP3A4). For buprenorphine, both in vitro metabolism data and in vivo mass balance and metabolite identification data (following administration of radiolabeled intravenous buprenorphine) were valuable for determining the contributions of various pathways to the overall elimination. Use of in vitro data alone would have not only led to underprediction of CL but also to overestimation of fm for CYP3A4 (and thus DDI liability). Following a best‐practices approach for PBPK modeling, the verification of the key parameters with clinical data is essential. There are limited data relating to the DDI liability of buprenorphine with strong CYP3A4 perpetrators. The most robust data were generated for the sublingual formulations—thus, the need to develop the model for this route of administration. However, the sublingual route brings other modeling complexities, with an additional key consideration of the proportion of drug swallowed (and thus subject to first‐pass metabolism in the gut and liver). The nonmechanistic inhalation model was a useful surrogate for the lack of sublingual model in the Simcyp Simulator, as the key swallowed proportion could be accounted for. The apparent dose‐dependent bioavailability for sublingual formulations led to the calculation of a dose‐dependent swallowed fraction. One of the limitations of the sublingual model, however, is that it cannot account for all possible scenarios that can affect absorption through the sublingual mucosa. This sublingual model is not mechanistic. Thus, it was not possible to account for all factors beyond modifying F1 and F2 fractions (F1, fraction of the dose passed to the sublingual mucosa; F2, remaining fraction of the dose that is swallowed).
Using the final PBPK model, predictions of buprenorphine plasma concentration‐time profiles and PK parameters after intravenous and sublingual administration were in agreement with the observed data (largely within 1.5‐fold or better). The shape of the concentration‐time profile following intravenous administration was well characterized by the full PBPK model. Most importantly, the model accurately predicted the 2.5‐fold and 2‐fold higher buprenorphine AUC and Cmax values, respectively, following coadministration of sublingual buprenorphine with ketoconazole, consistent with observed clinical study results.9 Although verification of the DDI with respect to CYP3A4 inhibition was of primary importance, inhibition by ketoconazole of the other main enzyme involved in buprenorphine metabolism, UGT1A1, was also examined. With CYP3A4 inhibition alone, there was a slight trend for underprediction; therefore, to ensure that the worst‐case scenario was predicted, a UGT1A1 Ki value for ketoconazole was derived from the literature and included in the model. It must be noted that this Ki value has not been independently verified with a UGT1A1 substrate; however, its inclusion had a minor impact on the overall prediction. The interaction between rifampicin and buprenorphine was also well predicted by the model. UGT1A1 induction data were included in the rifampicin model, and the impact on the prediction was also negligible.
There do not appear to be any selective strong CYP3A4 inhibitors for which clinical DDI studies with buprenorphine have been performed. However, published DDI investigations of buprenorphine with other strong CYP3A4/UGT1A1 inhibitors (such as efavirenz, ritonavir, and atazanavir) consistently report an approximate 2‐fold increase in buprenorphine exposure following sublingual dosing.29, 30, 31 In vitro data indicate that itraconazole is also an inhibitor of UGT1A1,32 although there do not appear to be any clinical DDI studies between itraconazole and any UGT1A1 substrates or any formulation of buprenorphine; as such, it was not incorporated into the model because no data for verification were available. Overall, it appears that inhibition of UGT1A1 has a minor impact on the DDI liability of buprenorphine and as expected, inhibition of CYP3A4 is the main concern.
For prediction of BUP‐XR DDIs, a series of 4 intravenous infusions was used to mimic BUP‐XR absorption by the subcutaneous route. The variability in the individual data observed after subcutaneous administration of BUP‐XR was well captured by the model. The final PBPK model was applied to evaluate the DDI liabilities of BUP‐XR, which involved simulation of a single 300‐mg dose of BUP‐XR (the highest dose approved for subjects with OUD) with daily coadministration of oral CYP3A4 inhibitors (ketoconazole and itraconazole) and a CYP3A4 inducer (rifampicin). Ketoconazole is a potent CYP3A4 inhibitor and, until recently, recommended by regulatory agencies for evaluation of DDI liabilities. However, because ketoconazole has been shown to cause liver injury or adrenal insufficiency, regulatory agencies recommended suspension of ketoconazole and proposed to use itraconazole as an alternative,33 although itraconazole may not be as strong an inhibitor as ketoconazole.34, 35 Itraconazole is available as an oral solution and capsule dosage formulations. Both formulations of itraconazole show a food effect, with the solution giving higher exposure in the fasted state, whereas the capsules result in higher exposure with food.27, 28 Therefore, the simulations employed DDI scenarios with both ketoconazole (2 dosing regimens: 400 mg once a day and 200 mg twice a day) and itraconazole (administration of the solution in the fasted state and capsules in the fed conditions). It should be noted that no clinical data were available to validate the PBPK model for prediction of buprenorphine‐itraconazole interaction. All 4 DDI scenarios were associated with mild increases in buprenorphine exposure (33%‐44%). These results were consistent with the previously reported PBPK analysis for another monthly injectable subcutaneous formulation of buprenorphine (CAM2038), for which a mild increase (34%) in buprenorphine plasma exposure following coadministration of ketoconazole (200 mg twice a day) was predicted.36 For CYP3A4 induction by rifampicin, both model predictions also align with a 28% decrease in AUC in the present analysis versus 26% with the previous PBPK model.36
The present findings illustrate how the buprenorphine route of administration impacts the magnitude of buprenorphine interaction with CYP3A4 inhibitors/inducers. Following oral administration, presystemic extraction of buprenorphine is so large that oral dosage is not clinically relevant with an oral bioavailability of only 8% (data on file). Coadministration of the CYP3A4 inhibitor voriconazole was reported to increase systemic exposure of oral buprenorphine by approximately 4‐fold.37 When buprenorphine is administered by the subcutaneous route, presystemic extraction is completely bypassed, and CYP3A4 inhibitors/inducers have minimal impact on buprenorphine systemic exposure, similar to what is observed for the intravenous and transdermal routes.12, 38 The sublingual route of administration falls between those extremes as a nonnegligible fraction of buprenorphine dose is swallowed and undergoes presystemic metabolism. Hence, coadministration of CYP3A4 inhibitors/inducers with sublingual buprenorphine lead to moderate changes (up to 2‐fold) in buprenorphine plasma exposure.
The DDI scenarios with ketoconazole, itraconazole, and rifampicin presented in this analysis represent the worst‐case scenario of maximum potential interaction that may be observed with BUP‐XR and CYP3A4 perpetrators. Therefore, this PBPK analysis also evaluated the potential interaction of BUP‐XR with CYP3A4 inhibitors in other likely clinical scenarios of dosing with CYP3A4 inhibitors for a shorter period (2 weeks) following dosing of BUP‐XR. The simulation results indicated minimal increases in buprenorphine exposure under those conditions (8%‐10% for ketoconazole, and 8%‐11% for itraconazole). The DDI predictions from the PBPK model are consistent with the results from 1 controlled phase 3 clinical study of BUP‐XR in which clinically relevant CYP3A4 inhibitors were prohibited as concomitant medications. However, some study participants receiving BUP‐XR were exposed to some form of CYP3A4 inhibition (n = 30). Overall, the clinical data showed no trends of an increase in plasma concentrations in those subjects compared with the rest of the population (data on file).
Conclusion
The current PBPK analysis indicated that that coadministration of strong CYP3A4 inhibitors or inducers with BUP‐XR would not result in clinically meaningful interactions. Administration of strong CYP3A4 inhibitors with BUP‐XR is associated with mild increases in buprenorphine exposure. Coadministration of a strong CYP3A4 inducer is associated with mild decreases in buprenorphine exposure. No dosing adjustment is necessary when dosing BUP‐XR with CYP3A4 inhibitors or inducers.
Conflicts of Interest
J.K., C.L., Y.L., and M.Y. are employees of Indivior Inc. E.H. is an employee of Certara.
Funding
This PBPK modeling was supported by Indivior Inc., North Chesterfield, Virginia.
Author Contributions
All authors were involved in the collection, analysis, or interpretation of data. All authors contributed to the development of the article.
Supporting information
Supplementary information
Acknowledgments
The authors acknowledge Dr. Weiyan Zhang for her assistance in optimizing the intravenous infusion dosing schedule for PBPK prediction of BUP‐XR PK profiles. Editorial assistance was provided by Peloton Advantage, an OPEN Health company, with financial support from Indivior Inc.
Jahnavi Kharidia is a Fellow of the American College of Clinical Pharmacology (FCP).
References
- 1.Andorn AC, Haight BR, Shinde S, et al. Treating opioid use disorder with a monthly subcutaneous buprenorphine depot injection: 12‐month safety, tolerability and efficacy analysis. J Clin Psychopharmacol. 2020;40(3):231‐239. [DOI] [PMC free article] [PubMed] [Google Scholar]
- 2.Haight BR, Learned SM, Laffont CM, et al. Efficacy and safety of a monthly buprenorphine depot injection for opioid use disorder: a multicentre, randomised, double‐blind, placebo‐controlled, phase 3 trial. Lancet. 2019;393(10173):778‐790. [DOI] [PubMed] [Google Scholar]
- 3.Kuhlman JJ Jr, Lalani S, MagluiloJ, Jr., Levine B, Darwin WD. Human pharmacokinetics of intravenous, sublingual, and buccal buprenorphine. J Anal Toxicol. 1996;20(6):369‐378. [DOI] [PubMed] [Google Scholar]
- 4.Mendelson J, Upton RA, Everhart ET, PJ III, Jones RT. Bioavailability of sublingual buprenorphine. J Clin Pharmacol. 1997;37(1):31‐37. [DOI] [PubMed] [Google Scholar]
- 5.Nath RP, Upton RA, Everhart ET, et al. Buprenorphine pharmacokinetics: relative bioavailability of sublingual tablet and liquid formulations. J Clin Pharmacol. 1999;39(6):619‐623. [DOI] [PubMed] [Google Scholar]
- 6.Ciraulo DA, Hitzemann RJ, Somoza E, et al. Pharmacokinetics and pharmacodynamics of multiple sublingual buprenorphine tablets in dose‐escalation trials. J Clin Pharmacol. 2006;46(2):179‐192. [DOI] [PubMed] [Google Scholar]
- 7.McAleer SD, Mills RJ, Polack T, et al. Pharmacokinetics of high‐dose buprenorphine following single administration of sublingual tablet formulations in opioid naive healthy male volunteers under a naltrexone block. Drug Alcohol Depend. 2003;72(1):75‐83. [DOI] [PubMed] [Google Scholar]
- 8.Strain EC, Moody DE, Stoller KB, Walsh SL, Bigelow GE. Relative bioavailability of different buprenorphine formulations under chronic dosing conditions. Drug Alcohol Depend. 2004;74(1):37‐43. [DOI] [PubMed] [Google Scholar]
- 9.Elkader A, Sproule B. Buprenorphine: clinical pharmacokinetics in the treatment of opioid dependence. Clin Pharmacokinet. 2005;44(7):661‐680. [DOI] [PubMed] [Google Scholar]
- 10.Kilford PJ, Stringer R, Sohal B, Houston JB, Galetin A.Prediction of drug clearance by glucuronidation from in vitro data: use of combined cytochrome P450 and UDP‐glucuronosyltransferase cofactors in alamethicin‐activated human liver microsomes. Drug Metab Dispos. 2009;37(1):82‐89. [DOI] [PubMed] [Google Scholar]
- 11.McCance‐Katz EF, Sullivan LE, Nallani S. Drug interactions of clinical importance among the opioids, methadone and buprenorphine, and other frequently prescribed medications: a review. Am J Addict. 2010;19(1):4‐16. [DOI] [PMC free article] [PubMed] [Google Scholar]
- 12.Hagelberg NM, Fihlman M, Hemmilä T, et al. Rifampicin decreases exposure to sublingual buprenorphine in healthy subjects. Pharmacol Res Perspect. 2016;4(6):e00271. [DOI] [PMC free article] [PubMed] [Google Scholar]
- 13.Wagner C, Zhao P, Pan Y, et al. Application of Physiologically Based Pharmacokinetic (PBPK) Modeling to Support Dose Selection: Report of an FDA Public Workshop on PBPK. CPT Pharmacometrics Syst Pharmacol. 2015;4(4):226‐230. [DOI] [PMC free article] [PubMed] [Google Scholar]
- 14.Jones HM, Chen Y, Gibson C, et al. Physiologically based pharmacokinetic modeling in drug discovery and development: a pharmaceutical industry perspective. Clin Pharmacol Ther. 2015;97(3):247‐262. [DOI] [PubMed] [Google Scholar]
- 15.Jamei M, Marciniak S, Feng K, Barnett A, Tucker G, Rostami‐Hodjegan A. The Simcyp population‐based ADME simulator. Expert Opin Drug Metab Toxicol. 2009;5(2):211‐223. [DOI] [PubMed] [Google Scholar]
- 16.Yong WP, Ramirez J, Innocenti F, Ratain MJ. Effects of ketoconazole on glucuronidation by UDP‐glucuronosyltransferase enzymes. Clin Cancer Res. 2005;11(18):6699‐6704. [DOI] [PubMed] [Google Scholar]
- 17.Tran TH, Von Moltke LL, Venkatakrishnan K, et al. Microsomal protein concentration modifies the apparent inhibitory potency of CYP3A inhibitors. Drug Metab Dispos. 2002;30(12):1441‐1445. [DOI] [PubMed] [Google Scholar]
- 18.Smith CM, Faucette SR, Wang H, LeCluyse EL. Modulation of UDP‐glucuronosyltransferase 1A1 in primary human hepatocytes by prototypical inducers. J Biochem Mol Toxicol. 2005;19(2):96‐108. [DOI] [PubMed] [Google Scholar]
- 19.Huestis MA, Cone EJ, Pirnay SO, Umbricht A, Preston KL. Intravenous buprenorphine and norbuprenorphine pharmacokinetics in humans. Drug Alcohol Depend. 2013;131(3):258‐262. [DOI] [PMC free article] [PubMed] [Google Scholar]
- 20.Rodgers T, Rowland M. Physiologically based pharmacokinetic modelling 2: predicting the tissue distribution of acids, very weak bases, neutrals and zwitterions. J Pharm Sci. 2006;95(6):1238‐1257. [DOI] [PubMed] [Google Scholar]
- 21.Lu G, Turner DB, Fisher C, et al. A novel mechanistic approach to predict the steady state volume of distribution (Vss) using the Fick‐Nernst‐Planck Equation [abstract 5709]. Presented at: Annual Meeting of the Population Approach Group in Europe; June 7‐10, 2016; Lisbon, Portugal.
- 22.Avdeef A. Absorption and Drug Development: Solubility, Permeability, and Charge State. 2nd ed.Hoboken, NJ: John Wiley & Sons, Inc.; 2012. [Google Scholar]
- 23.Pontani RB, Vadlamani NL, Misra AL. Disposition in the rat of buprenorphine administered parenterally and as a subcutaneous implant. Xenobiotica. 1985;15(4):287‐297. [DOI] [PubMed] [Google Scholar]
- 24.Tracqui A, Kintz P, Ludes B. Buprenorphine‐related deaths among drug addicts in France: a report on 20 fatalities. J Anal Toxicol. 1998;22(6):430‐434. [DOI] [PubMed] [Google Scholar]
- 25.Everhart ET, Cheung P, Mendelson J, Upton R, Jones RT. The mass balance of buprenorphine in humans [abstract]. Clin Pharmacol Ther. 1999;65(2):152. [Google Scholar]
- 26.Hassan HE, Myers AL, Coop A, Eddington ND. Differential involvement of P‐glycoprotein (ABCB1) in permeability, tissue distribution, and antinociceptive activity of methadone, buprenorphine, and diprenorphine: in vitro and in vivo evaluation. J Pharm Sci. 2009;98(12):4928‐4940. [DOI] [PMC free article] [PubMed] [Google Scholar]
- 27.Barone JA, Moskovitz BL, Guarnieri J, et al. Food interaction and steady‐state pharmacokinetics of itraconazole oral solution in healthy volunteers. Pharmacotherapy. 1998;18(2):295‐301. [PubMed] [Google Scholar]
- 28.Barone JA, Koh JG, Bierman RH, et al. Food interaction and steady‐state pharmacokinetics of itraconazole capsules in healthy male volunteers. Antimicrob Agents Chemother. 1993;37(4):778‐784. [DOI] [PMC free article] [PubMed] [Google Scholar]
- 29.McCance‐Katz EF, Moody DE, Morse GD, et al. Interactions between buprenorphine and antiretrovirals. I. The nonnucleoside reverse‐transcriptase inhibitors efavirenz and delavirdine. Clin Infect Dis. 2006;43(Suppl 4):S224‐234. [DOI] [PubMed] [Google Scholar]
- 30.McCance‐Katz EF, Moody DE, Smith PF, et al. Interactions between buprenorphine and antiretrovirals. II. The protease inhibitors nelfinavir, lopinavir/ritonavir, and ritonavir. Clin Infect Dis. 2006;43(Suppl 4):S235‐246. [DOI] [PubMed] [Google Scholar]
- 31.McCance‐Katz EF, Moody DE, Morse GD, et al. Interaction between buprenorphine and atazanavir or atazanavir/ritonavir. Drug Alcohol Depend. 2007;91(2‐3):269‐278. [DOI] [PMC free article] [PubMed] [Google Scholar]
- 32.Walsky RL, Bauman JN, Bourcier K, et al. Optimized assays for human UDP‐glucuronosyltransferase (UGT) activities: altered alamethicin concentration and utility to screen for UGT inhibitors. Drug Metab Dispos. 2012;40(5):1051‐1065. [DOI] [PubMed] [Google Scholar]
- 33.Liu L, Bello A, Dresser MJ, et al. Best practices for the use of itraconazole as a replacement for ketoconazole in drug‐drug interaction studies. J Clin Pharmacol. 2016;56(2):143‐151. [DOI] [PubMed] [Google Scholar]
- 34.Greenblatt DJ, Harmatz JS. Ritonavir is the best alternative to ketoconazole as an index inhibitor of cytochrome P450‐3A in drug–drug interaction studies. Br J Clin Pharmacol. 2015;80(3):342‐350. [DOI] [PMC free article] [PubMed] [Google Scholar]
- 35.Greenblatt DJ. Evidence‐based choice of ritonavir as index CYP3A inhibitor in drug‐drug interaction studies. J Clin Pharmacol. 2016;56(2):152‐156. [DOI] [PubMed] [Google Scholar]
- 36.Liu T, Gobburu JVS. A Physiologically Based Pharmacokinetic Modeling Approach to Predict Drug‐Drug Interactions of Buprenorphine After Subcutaneous Administration of CAM2038 With Perpetrators of CYP3A4. J Pharm Sci. 2018;107(3):942‐948. [DOI] [PubMed] [Google Scholar]
- 37.Fihlman M, Hemmilä T, Hagelberg NM, et al. Voriconazole greatly increases the exposure to oral buprenorphine. Eur J Clin Pharmacol. 2018;74(12):1615‐1622. [DOI] [PubMed] [Google Scholar]
- 38.Kapil RP, Cipriano A, Michels GH, et al. Effect of ketoconazole on the pharmacokinetic profile of buprenorphine following administration of a once‐weekly buprenorphine transdermal system. Clin Drug Investig. 2012;32(9):583‐592. [DOI] [PubMed] [Google Scholar]
- 39.Bullingham RE, McQuay HJ, Moore A, Bennett MR. Buprenorphine kinetics. Clin Pharmacol Ther. 1980;28(5):667‐672. [DOI] [PubMed] [Google Scholar]
Associated Data
This section collects any data citations, data availability statements, or supplementary materials included in this article.
Supplementary Materials
Supplementary information