Abstract
Background
Studies have shown that there is a high correlation between atopic dermatitis and decrease in ceramide content in the lipid bilayer of skin. Moreover, it has been shown that the reduction in ceramide content in the stratum corneum is unique to atopic dermatitis, indicating that there are particular structural differences between the lipid bilayers of normal and atopic skin.
Aim
This study aimed to compare the lipid bilayer of the atopic skin with that of the healthy skin and to establish a structural model of the lipid bilayer for atopy.
Methods
Molecular dynamics simulations were performed using NAMD 2.8. Models of lipid bilayers of normal skin and atopic skin, and a model of lipid bilayer containing only ceramide were built with CHARMM‐GUI. The thickness, area occupied per lipid, and alignment of lipids were compared among the three models. Potential mean force (PMF) of the sodium laureth sulfate (SLES) on lipid bilayers was calculated to predict the affinity between SLES and lipid bilayers.
Results
Potential mean force calculations showed that the lipid bilayer of atopic skin was able to absorb the surfactant more easily than that of normal skin.
Conclusions
When the ceramide ratio is low, the thickness of lipid bilayer is reduced and its structure is weakened. Other structural differences between the lipid layers of normal and atopic skin included increased area per lipid and poor alignment of lipids. Further, the atopy lipid bilayer model was found to absorb more SLES than the normal skin lipid bilayer model.
Keywords: atopic dermatitis, skin physiology, skin structure
1. INTRODUCTION
Atopic dermatitis is a chronic inflammatory skin disease caused by complex interactions among skin barrier defects and immunosuppressive disorders. The use of moisturizers in atopic dermatitis plays an important role in preserving and normalizing skin barrier functions and is the most basic approach for the treatment of atopic dermatitis. In particular, the use of proper moisturizers is known to reduce the degree of frequent relapses and deterioration of skin condition and is known to have steroid sparing effects.1 The discovery of pathological mechanisms of skin barrier defects in atopic dermatitis, such as filaggrin and ceramide, has led to the advancement of research on atopic dermatitis.2 Studies have shown that there is a high correlation between atopic dermatitis and decrease in the amount of ceramide, which forms the lipid layer of skin. After it was discovered that ceramide and natural moisturizer supplements were effective in the treatment of atopic dermatitis, moisturizers have been steadily developed. Compared with the classic moisturizers, moisturizing agents containing lipids, mainly ceramide, are known to enhance the barrier function as they pass through the stratum corneum and are absorbed into the keratinocytes for synthesis of the intercellular lamella lipid. Such moisturizers can improve the content and composition of moisture and lipid layers in the skin of patients with atopic dermatitis and can improve the barrier function of skin. Moisturization alone can improve the skin barrier function. Studies have also reported that consumption of foods such as probiotics leads to increase in moisture content in the skin, which has been effective in treatment of atopic skin.3, 4 This approach is applied to patients with side effects to percutaneous absorbents, and it is not as effective as the moisturizer, which is absorbed directly into the skin.4 To sum up, these studies showed that identifying and supplementing the structural features of atopic skin is effective in improving the atopic symptoms. Thus, using the moisturizers on the market is a way to improve the structural features of atopic dermatitis. The moisturizers are available in various forms considering the skin condition of the people. These moisturizers contain minimal cosmetic ingredients and often do not contain surfactants because surfactants can remove the moisture from the skin.
In this study, we aimed to unravel the structural abnormality of the lipid bilayers, which causes impairment of barrier function in atopic dermatitis.1, 2 Atopic dermatitis decreases the barrier function of the skin, which results in the skin becoming dry and refractory. The amount of water in the stratum corneum is one of the characteristic features of the skin barrier. In normal skin, the water content of the stratum corneum is in the range of 15%–40%,5 whereas in patients with atopic dermatitis, the moisture content of the dry skin lies below this range.6 Penetration of water into the stratum corneum is dependent on the capability of stratum corneum to attract and retain water.7 The water‐binding capacity of dry atopic skin was found to be reduced when measured with an in vitro microbalance technique.8 In patients with atopic dermatitis, the total lipid level, and in particular the ceramide level, is decreased in the stratum corneum. Studies on skin barrier deterioration show that the reduction in the total lipid level and ceramide content in the stratum corneum is unique to atopic dermatitis.9 Ceramide is the main component of intercellular keratin lipids in the stratum corneum of skin and accounts for about 50% of the total lipid content in the stratum corneum. As ceramides are arranged in a layered structure and the layered structure is energetically stabilized by water molecules filled between the layers, the stratum corneum has moisture retention capability. The ceramide bilayer is responsible for the overall skin barrier function.10, 11
Among the various types of ceramides, the fraction of ceramide type 1 is reduced remarkably in atopic dermatitis. Ceramide type 1 is believed to be a carrier of linoleate, which is responsible for water barrier function.12 However, lipids such as squalene, cholesterol ester, wax ester, triglyceride, free fatty acid, and cholesterol are not significantly altered in the stratum corneum of atopic dermatitis patients.9, 12, 13 It is also known that the efficiency of the barrier function is enhanced when ceramides are applied along with fatty acids and cholesterol rather than the application of ceramide alone.14, 15 When cholesterol and fatty acids are present in the stratum corneum, the lipid bilayer maintains its structure even at high temperatures. This phenomena was demonstrated using molecular dynamics (MD) simulations.16 Previous studies have shown that a solid lipid bilayer is formed when fatty acids, cholesterol, and ceramides are present and mixed in appropriate proportions.17
In this study, we have used MD simulations to identify the differences between the lipid layer with reduced ceramide content, as seen in atopic conditions, and the lipid layer of normal skin. Further, we aimed to examine the skin barrier function of the atopic lipid layer by calculating the potential mean force (PMF) between sodium laureth sulfate (SLES), a well‐studied skin irritant, and the lipid layer.18
2. METHODS
2.1. Description of Simulations
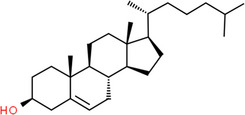
In this study, three models of the lipid bilayer of skin were made. The first model is a virtual lipid structure consisting of the only ceramide, which is modeled for comparison purposes with atopic skin model and normal skin model. The model of the lipid bilayer of atopic skin was composed of 58 sphingolipid ceramide d18:1/24:0 (CER240) molecules, 116 cholesterol (CHL) molecules, 116 lignoceric acid (LIGN) molecules, and 10 500 water molecules in a simulation box that was approximately 80 Å × 80 Å × 140 Å in size. The model consisted of CER240, CHL, and LIGN in the ratio of 1:2:2, respectively. And the lipid ratio of normal skin models is 1:1:1. Information on the molecules used for modeling is provided in Table 1.
Table 1.
Structural information of the molecules used in the calculation
| Molecule structure | Molecular formula | Name |
|---|---|---|

|
C16H33NaO6S | Sodium laureth sulfate |

|
C34H67NO3 | Ceramide (d18:1/24:0) |

|
C24H48O2 | Lignoceric acid |
|
C27H46O | Cholesterol |
All the simulations were carried out in the NPT ensemble with periodic boundary conditions applied in all directions. The system had to move along with the molecules. After 1 ns of calculation, it was observed that the box size converged to size (60,60,122). Simulation systems were fully equilibrated at 305 K and 1 bar using the Langevin thermostat and Nosé‐Hoover Langevin piston method. The electrostatic potential energy was calculated using the particle mesh Ewald method under conducting boundary conditions. The van der Waals interactions were truncated at 12 Å and were smoothly switched to 0 from 10 or 12 Å. CHARMM22 and CHARMM36 force field parameter sets were used for the lipid molecules, and TIP3P water model was used for explicit water MD simulations. The simulations were performed using NAMD 2.13, and the models were visualized using VMD 1.9.3.19, 20 CHARMM‐GUI was used to construct the initial lipid bilayer models.21
Initial equilibration runs consisted of steepest descent minimization with 50 000 steps, followed by heating at 305 K over 10 ns, and then equilibration via temperature coupling using sodium ion solution.
2.2. Calculating order parameters from simulations
The ordering of the alkyl chains in the lipids in the all‐atom membrane system can be described by a simple equation, Equation 1.22 The degree of alignment was calculated by considering the monomers that make up the lipid layer one by one. This equation describes the direction of the C‐H bond vector for the lipid layer over all lipids and all time. In Equation 1, θ is the angle between the C–H bond vector and the bilayer normal. The angular bracket represents molecular and temporal ensemble averages.
| (1) |
The S CD order parameter was calculated from the head to the median and tail of the lipids using the above equation. Order parameters depend not only on the (dis)order of the system, but also on orientation. If order parameter is nearly zero, then it can be considered an unordered system. If order parameter is near 0.5, it indicates a perfectly ordered acyl chain in all conformations, rapidly rotating around the bilayer. Generally, order parameters decrease from the interface region to the center of the bilayer.22
2.3. Construction of PMF and position dependent diffusion coefficient profiles for SLES
Symmetrized PMF profiles of SLES were calculated as a function of the z coordinate of the center of mass of SLES using adaptive biasing force and thermodynamic integration methods. The PMF was calculated by moving the SLES along the z‐axis, the reaction coordinates, corresponding to the perpendicular axis to the lipid bilayer and moving the interior of the lipid bilayer, −40.0 to +40.0 Å (with 0.5 Å steps), and over 130 000 calculations per atom's z‐axis position.
3. RESULTS
3.1. Visualization of the lipid bilayers
Figure 1 demonstrates this calculation in cross views. Oxygen is indicated by red balls, and nitrogen is indicated by blue in the head group of lipids. Pale blue represents a carbon chain. Water and hydrogen are not shown for effective visualization. Figure 1A shows the lipid layer composed only of CER240. Figure 1B corresponds to the lipid layer of healthy skin. Both of these lipid layers appeared to be well organized as bilayers, and the alignment of the lipids also appeared to be good. In contrast, in the lipid layer of atopic skin (CER240: CHL: LIGN = 1:2: 2), some of the cholesterol and lignoceric acid are upside down, which resulted in the head positioned in the middle of the bilayer. Moreover, unlike the CER240 and normal lipid layers, the alignment of lipids in atopy layer was visibly poor.
Figure 1.
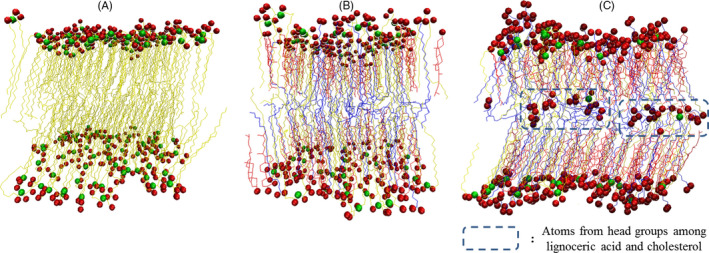
Configuration of a bilayer system from a well‐equilibrated, constant pressure molecular dynamics simulation performed at 305 K. Only the molecules in the simulation cell are shown. Carbon (canyon chain), nitrogen (red), and the oxygen (yellow) atoms of the lipid head groups are depicted in (A) CER240, (B) normal layer, and (C) atopy layer
3.2. Structural characteristics of the lipid bilayer
The thickness of the three types of lipid layers measured in z‐axis, which indicates their cross sections, was compared, which is shown in Figure 2. The thickest lipid layer was the normal lipid layer, which was followed by CER240 layer. The thinnest layer was the atopy lipid layer. Over time, a slight increase in the thickness of the lipid layer was observed in all the lipid layers. The linearity of the thickness variation of the three lipid layers over 2‐ to 10‐ns time was calculated. While the R 2 value of the atopy layer was the least at 0.0385, it was 0.8733 and 0.5202 for CER240 and normal layers (the values were the mean for the two lipid layers), respectively.
Figure 2.
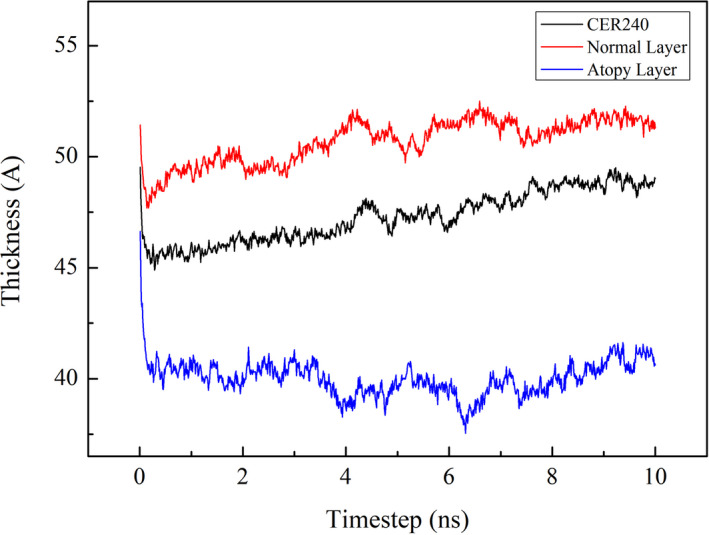
After equilibrium calculation at 305 K, the thickness change of each lipid layer was observed with time change. The bottom blue graph represents the lipid layer consisting of CER240 only, the middle black graph represents the normal lipid layer, and the top red graph represents the atopy lipid layer. The unit for lipid layer thickness is Ångström (Å), and the unit for time is nanosecond (10−9 s)
Order parameters were used to calculate the degree of alignment of the lipid layer.23 The calculation results are shown in Figure 3. The order parameter calculated from the head to the tail of each lipid showed a high degree of alignment in the middle of the lipid. The results showed that the S CD value decreased toward the tail. The highest S CD value was in the middle of the atopy lipid, but it was as low as 0.23. Conversely, high‐order parameter was observed for normal layer with an S CD of 0.43. In lipid layers composed of only CER240, the highest S CD of 0.31 was obtained. Relatively constant order parameter values ranging from 5 to 13 were observed. There are three possible arrangements of the lipids: a very dense, ordered orthorhombic organization; a less dense, ordered hexagonal organization; and a disordered liquid organization.17 The reduction in ceramide content increases the fluidity of the lipid bilayer.
Figure 3.
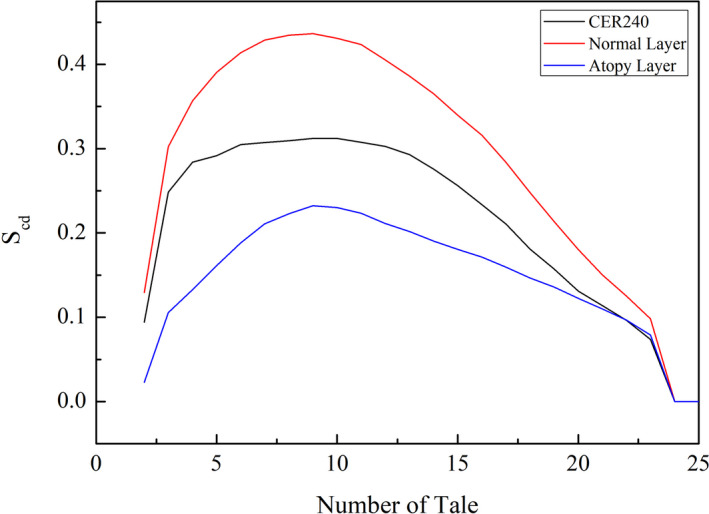
After each lipid layer reached a stabilization state, the degree of alignment of the lipids was calculated. Deuterium order parameters were used to graphically map the alignment of lipids in each lipid layer. In the graph, if the number of tail values is zero on the x‐axis, then it indicates that the carbon atom is in the head group. The centers of lipid molecules range from 5 to 15 number of tail values. The bottom blue graph represents the atopy layer, the middle black graph represents the lipid layer consisting of CER240 only, and the top red graph represents the normal lipid layer
The area occupied by the lipids in the geological layer was calculated. As seen in Figure 4, the lipids in CER240 layer occupied the smallest area (Å2), whereas the lipids in the atopy lipid bilayer occupied the largest area. The degree of variance in the change of lipid area was 2.59 in CER240 and 5.86 in normal lipid layer, while the degree of dispersion of atopy lipid was 38.99. Figure 5 is a graph of the density of atoms in each lipid layer along the z‐axis. As seen in Figure 5A, the thickness of the CER240 lipid layer appeared to be about 5 nm, with high density of oxygen and nitrogen on the surface of the lipid layer. The density of carbon was higher inside the lipid than on the surface of the lipid layer; the highest density was obtained at the absolute value Z = 10. The atomic density of the normal lipid layer showed similar results. However, the atomic density of the atopy lipid layer shown in Figure 5C was different from the previous lipid layers. As observed in Figure 1, the characteristics of the atopy lipid layer were shown in terms of atomic density. First, some oxygen and nitrogen atoms were observed in the middle of the lipid bilayer. The peaks of the distribution of oxygen and nitrogen atoms on the lipid surface were observed to be tailed, unlike the other two lipid layers. Because of the inverted head and tail positions of some lipids, carbon density was also reduced, but the boundaries were not easily distinguished. As observed in Figure 1, some of the lipids in the atopy lipid layer were partially reversed; some of the inverted lipids are shown in Figure 6. The normal lipid layer contained lignoceric acid at the outermost surface and was placed in the order of cholesterol in the lower graph of Figure 6. Cholesterol and fatty acids were not located in the center of the lipid layer. However, in the atopy lipid layer, some lignoceric acid was found in the center of the lipid layer, where a large amount of cholesterol was also located.
Figure 4.
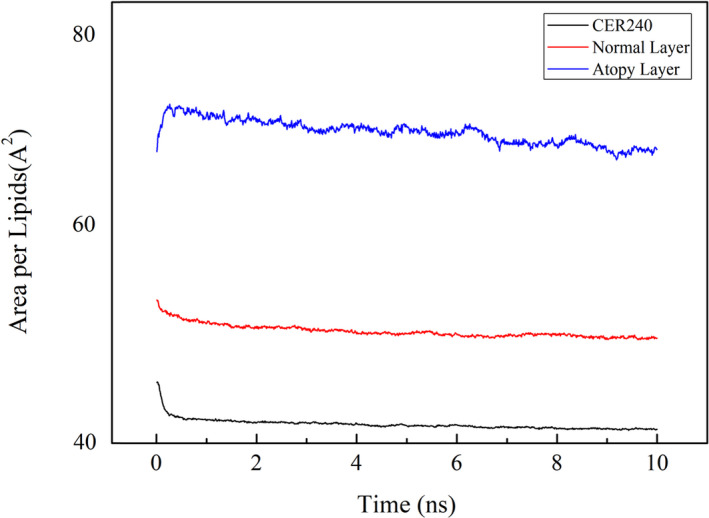
The stabilization calculation of each lipid layer at room temperature was completed, and the area occupied per lipid was calculated. The bottom black graph represents the lipid layer consisting of CER240 only, the middle red graph represents the normal lipid layer, and the top blue graph represents the atopy lipid layer. The area unit is Å2, and the time unit is nanosecond (10−9 s)
Figure 5.
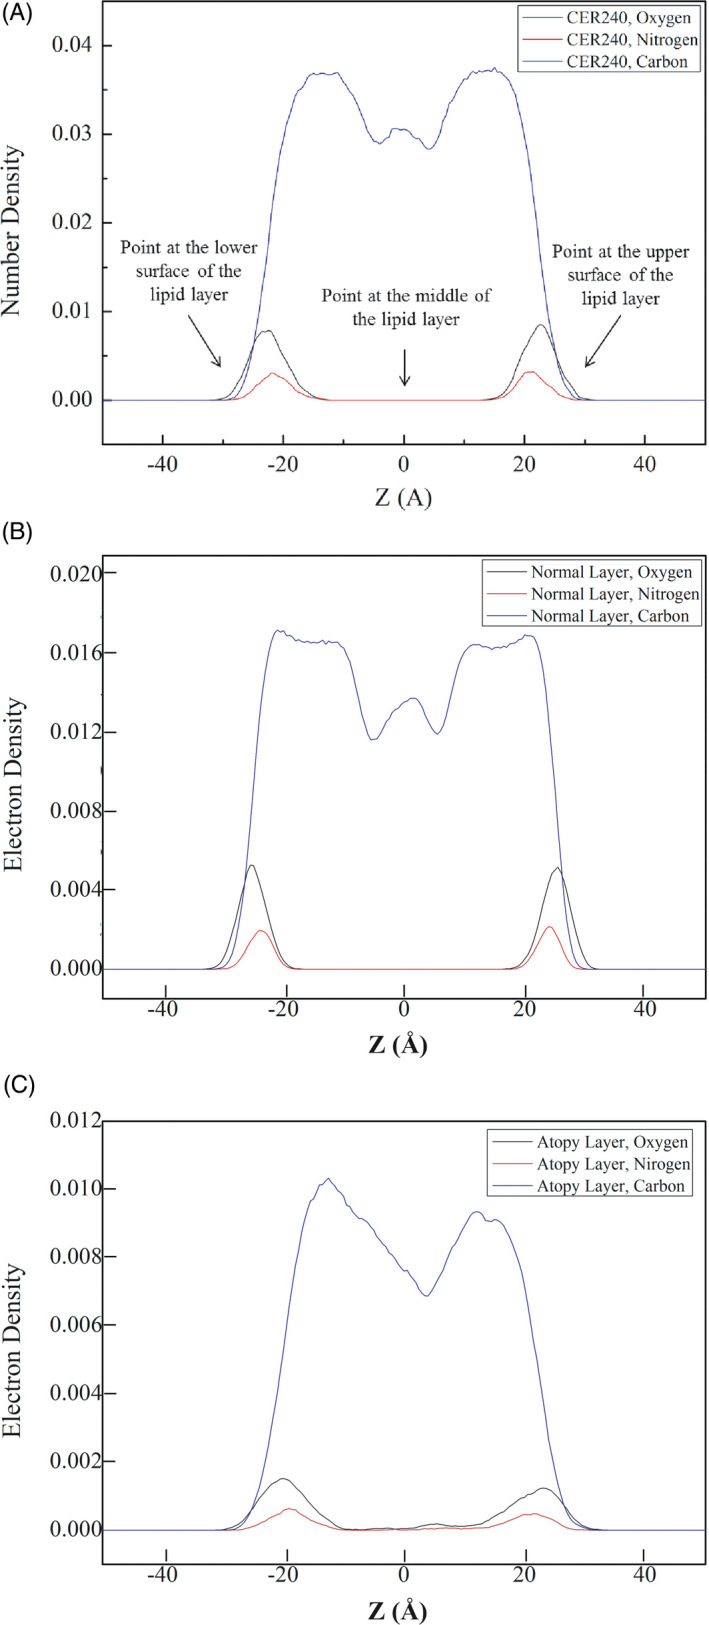
Electron density profiles of lipid bilayer simulations. A, CER240, B, Normal layer. C, Atopy layer
Figure 6.
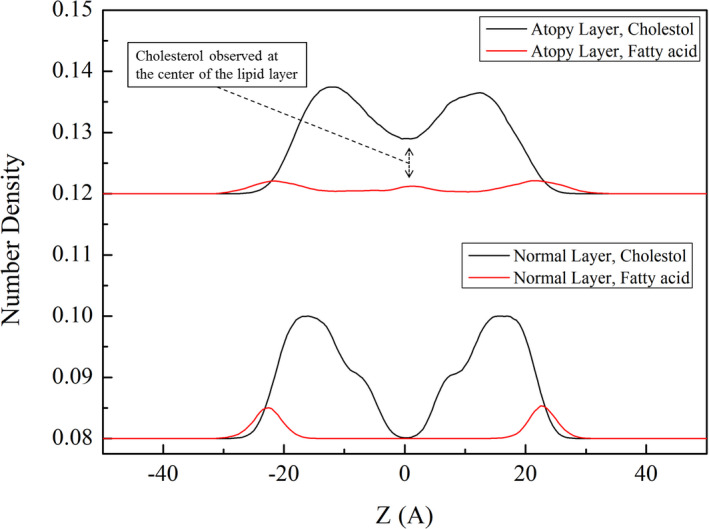
Comparison of the electron density of cholesterol and lignoceric acid in (below) normal and (above) atopy lipid bilayers
These results confirmed that the structural characteristics of the lipid layer are dependent on the ceramide content. In order to investigate whether the structural changes in the lipid layer affect the skin barrier function of the lipid layer, SLES was placed on the surface of normal and atopy lipid layer and the PMF between the lipid layer and SLES was calculated. The results are shown in Figure 7.
Figure 7.
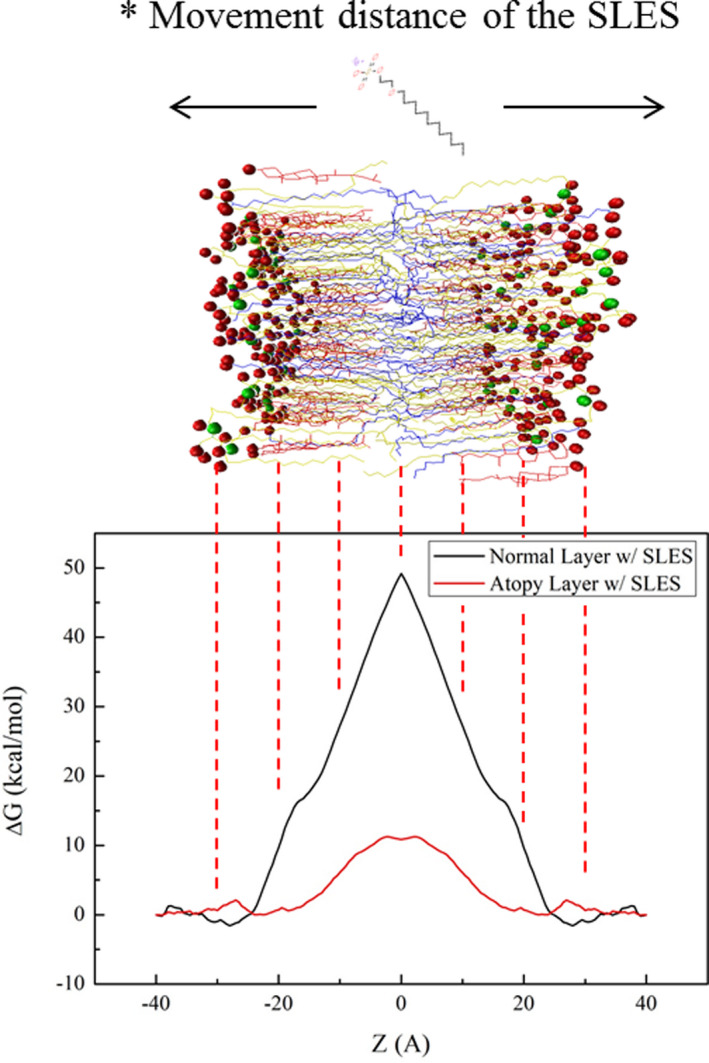
Symmetrized potential mean force (PMF) profiles of sodium laureth sulfate (SLES) through the (black solid line) normal lipid bilayer and (red solid line) atopy lipid bilayer obtained from the adaptive biasing force (ABF)
Sodium laureth sulfate was temporarily at the surface the normal lipid layer with ΔG < 0. While transferring it into the normal lipid bilayer, the ΔG of the SLES changed to a positive value, and the highest ΔG value was observed in the middle of the lipid bilayer. In case of atopy layer, the ΔG value of SLES was positive throughout the layer, with no significant difference between the values at the surface and the middle of the layer. However, it can be seen that the magnitude of the value was very small, compared to that for the normal lipid layer. The ΔG of SLES in the normal lipid layer was 48.9 kcal/mol, whereas the ΔG of SLES in the atopic lipid layer was about 20% lower at 10.9 kcal/mol. The alignment of the atopic lipids was degraded compared to that of the normal lipids. A small group of heads of cholesterol and fatty acids moved around the lipid rather than the lipid surface due to the increase in the flexibility of the lipid. According to the concept of PMF, if a force depending on some reaction coordinate can be extracted, then the constraint force can be known. The reason this may result in the difference between the ΔG values of the normal and atopic lipids is the presence or absence of water molecules within the lipids. The free energy between SLES and water molecules was added to reveal the difference in ΔG values between normal and atopic lipid levels.
4. DISCUSSION
As shown in Figure 1B, the lipids were well aligned in the normal lipid bilayer, and the boundary between the geological layers could be clearly seen. However, the lipid layers were not well aligned in the atopy lipid layer (Figure 1C). In particular, some lipids, such as cholesterol and lignoceric acid, had inverted. Perhaps this was because an increase in cholesterol level and decrease in ceramide content led to an increase in the fluidity of the lipid layer.16 The surface of the lipid layer should contain the head group, but in the atopy lipid layer, tails were seen on the surface. It can be inferred that this reduced the electrostatic barrier between the lipid layer surface and the lipid exterior. When a foreign material, particularly oil or surfactant, is adsorbed on the lipid layer, it could traverse across the atopy lipid layer more easily than other lipid layers, facilitated by the interactions between the tail portion of the inverted lipids and the hydrophobic part of the surfactant or other foreign material.24 Figures 2, 3, 4 compare the structural characteristics of the normal and atopy lipid bilayers. The normal layer was the thickest, and the atopy lipid bilayer was the thinnest. Considering the previous studies that have shown the lamellar structure to be well organized, the skin is well protected when it contains all the intercellular lipids (ceramides, fatty acids, and cholesterol) for moisturization and protective functions. Further, it is also known that the ratio of ceramide, cholesterol, and lignoceric acid is crucial in this context.14 Figure 3 shows the alignment of the lipids that make up CER240, normal lipid layer, and atopy lipid layer. As shown in Figure 1, the atopy lipid layer was poorly aligned. The alignment of the lipid layer with only CER240 was the highest at 0.3, and the alignment interval was longer than that of the other layers. This may be due to a homogenous environment in the layer with only CER240. The results suggest that if the CER content is higher than necessary, it appears to decrease the alignment of lipids. When cholesterol and lignoceric acid are in the same ratio as ceramide, the lipid structure is well aligned, indicating that the skin protection function of the lipid layer works effectively. The area occupied by lipids in Figure 4 was the highest in the lipids in the atopy lipid bilayer. This may be the consequence of decreased stability due to lack of alignment, as shown in Figure 3. The alignment of lipids in the atopy lipid layer was low, and thus, the area occupied per lipid was high, and the variance of the area was calculated to be 6.6 times more than that of the normal lipid layer. Taken together, the results of Figures 2, 3, 4 indicate that the most stable structure is obtained when the ratio of ceramide, lignoceric acid, and cholesterol is 1:1:1. This is why researchers maintain this ratio when they set up lipid layers to study their properties or conduct mass permeation experiments.25
In Figure 5, the density of atoms constituting the lipid layer is shown at specific locations. Typically, the head groups of lipids are found on the surface of the lipid layer. Thus, oxygen and nitrogen atoms are seen on the surface of the lipid layer, while carbon atoms are observed at a higher density in the middle of the lipid than on the surface. In CER240 and normal lipid layer, oxygen and nitrogen can be seen only on the surface of the lipid layer; however, in the atopy lipid bilayer, they were found in the middle of the bilayer. As shown in Figure 6, this phenomenon is due to the inversion of the cholesterol and lignoceric acid molecules in the atopy lipid bilayer.
Thus, the results suggest that the atopy lipid bilayer was structurally inferior to the normal lipid layer. The PMF between SLES and the lipid layer was calculated to determine the influence of poor structural integrity on the barrier function of the skin. As shown in Figure 7, it was thermodynamically disadvantageous for SLES to pass through normal lipid layers compared with the atopy layer. Although the atopy lipid layer showed a ΔG > 0, for translocation of SLES, the absolute value of ΔG was 20% less than that for the normal layer, indicating that the atopy layer was not as well equipped as the normal layer at preventing SLES from penetrating through the lipid bilayer. Thus, the normal lipid bilayer effectively protects the skin against SLES compared with the atopy layer. The atopy lipid bilayer may more readily absorb surfactants such as SLES. SLES is a commonly used inexpensive surfactant and an irritating substance. This might explain why atopic dermatitis patients are prone to skin irritation while using various cleaners or skin protection products containing SLES.
5. CONCLUSION
The normal lipid layer and the atopy lipid bilayer were modeled to compare the structural differences between them. The PMF between the SLES and lipid layers was calculated, and the results were compared to determine which lipid layer was more likely to absorb SLES, a common surfactant and a well‐known skin irritant. The results suggested that SLES could be absorbed by the lipid bilayer of atopic skin due to perturbations in the lipid layers. In the lipid bilayer of atopic skin, cholesterol and fatty acids were inverted, resulting in various characteristic structural features, which might eventually lead to deterioration of skin protection function. These included decreased thickness of the lipid layer, increased area occupied per lipid, and poor alignment of the lipids in the layers. Thus, in this study, using MD simulations, we demonstrated that changes in the composition of the lipid bilayers could lead to lowering of the electrostatic barrier between the outer layer and the lipid layer of the atopic skin. Consequently, this could lead to enhancement in the absorption of foreign materials such as SLES, causing the stratum corneum of atopic dermatitis patients to become easier to lose moisture in skin.
ACKNOWLEDGMENTS
This study was funded by a grant from AMOREPACIFIC. We would like to thank Editage (www.editage.co.kr) for English language editing.
Jung I‐K, Choi J, Nam J, No KT. Modeling lipid layers of atopic skin and observation of changes in lipid layer properties with changes in ceramide content. J Cosmet Dermatol.2021;20:2924–2931. 10.1111/jocd.13861
Contributor Information
In‐Keun Jung, Email: imw2008@amorepacific.com.
Kyoung Tai No, Email: ktno@yonsei.ac.kr.
REFERENCES
- 1.Grimalt R, Mengeaud V, Cambazard F. The steroid‐sparing effect of an emollient therapy in infants with atopic dermatitis: a randomized controlled study. Dermatology. 2007;214(1):61‐67. [DOI] [PubMed] [Google Scholar]
- 2.Palmer CNA, Irvine AD, Terron‐Kwiatkowski A, et al. Common loss‐of‐function variants of the epidermal barrier protein filaggrin are a major predisposing factor for atopic dermatitis. Nat Genet. 2006;38(4):441‐446. [DOI] [PubMed] [Google Scholar]
- 3.Ljungh A, Wadström T. Lactic acid bacteria as probiotics. Current Issues in Intestinal . Microbiology. 2006;7(1466–531X (Print)):73–89. [PubMed] [Google Scholar]
- 4.Kim Yeon‐Hui CC‐Y, Taehoon C. The preventive and therapeutic effects of probiotics in allergic diseases via immune modulation. J Food Hyg Safe. 2016;31(3):141‐152. [Google Scholar]
- 5.Warner RR, Myers MC, Taylor DA. Electron probe analysis of human skin: determination of the water concentration profile. J Invest Dermatol. 1988;90(2):218‐224. [DOI] [PubMed] [Google Scholar]
- 6.Blichmann C, Serup J. Hydration studies on scaly hand eczema. Contact Derm. 1987;16(3):155‐159. [DOI] [PubMed] [Google Scholar]
- 7.Tagami H, Iwase Y, Yoshikuni K, Inoue K, Yamada M. Water sorption‐desorption test of the stratum corneum of the skin surface in vivo. J Invest Dermatol. 1983;248–251. http://doi-org-443.webvpn.fjmu.edu.cn/10.1007/978-3-642-68682-5_33 [DOI] [PubMed] [Google Scholar]
- 8.Linde YW. Dry skin in atopic dermatitis. Acta Derm Venereol Suppl (Stockh). 1992;177:9‐13. [PubMed] [Google Scholar]
- 9.Melnik B, Hollmann J, Hofmann U, Yuh MS, Plewig G. Lipid composition of outer stratum corneum and nails in atopic and control subjects. Arch Dermatol Res. 1990;282(8):549‐551. [DOI] [PubMed] [Google Scholar]
- 10.Imokawa G, Hattori M. A Possible function of structural lipids in the water‐holding properties of the stratum corneum. J Invest Dermatol. 1985;84(4):282‐284. [DOI] [PubMed] [Google Scholar]
- 11.Imokawa G, Akasaki S, Hattori M, Yoshizuka N. Selective recovery of deranged water‐holding properties by stratum corneum lipids. J Invest Dermatol. 1986;87(6):758‐761. [DOI] [PubMed] [Google Scholar]
- 12.Yamamoto A, Serizawa S, Ito M, Sato Y. Stratum corneum lipid abnormalities in atopic dermatitis. Arch Dermatol Res. 1991;283(4):219‐223. [DOI] [PubMed] [Google Scholar]
- 13.Imokawa G, Abe A, Jin K, Higaki Y, Kawashima M, Hidano A. Decreased level of ceramides in stratum corneum of atopic dermatitis: an etiologic factor in atopic dry skin? J Invest Dermatol. 1991;96(4):523‐526. [DOI] [PubMed] [Google Scholar]
- 14.Man Mq M, Feingold KR, Thornfeldt CR, Elias PM. Optimization of physiological lipid mixtures for barrier repair. J Invest Dermatol. 1996;106(5):1096‐1101. [DOI] [PubMed] [Google Scholar]
- 15.Lintner K, Mondon P, Girard F, Gibaud C. The effect of a synthetic ceramide‐2 on transepidermal water loss after stripping or sodium lauryl sulfate treatment: an in vivo study. Int J Cosmet Sci. 1997;19(1):15‐25. [DOI] [PubMed] [Google Scholar]
- 16.Höltje M, Förster T, Brandt B, Engels T, von Rybinski W, Höltje H‐D. Molecular dynamics simulations of stratum corneum lipid models: fatty acids and cholesterol. Biochim Biophys Acta Biomembr. 2001;1511(1):156‐167. [DOI] [PubMed] [Google Scholar]
- 17.Janssens M, van Smeden J, Gooris GS, et al. Increase in short‐chain ceramides correlates with an altered lipid organization and decreased barrier function in atopic eczema patients. J Lipid Res. 2012;53(12):2755‐2766. [DOI] [PMC free article] [PubMed] [Google Scholar]
- 18.Jung IK, Park SC, Kim SH, et al. The analysis of scalp irritation by coacervates produced in hair shampoo via FTIR with focal plane array detector, X‐ray photoelectron microscopy and HaCaT cells. Int J Cosmet Sci. 2017;39(2):149‐155. [DOI] [PubMed] [Google Scholar]
- 19.Humphrey W, Dalke A, Schulten K. VMD: Visual molecular dynamics. J Mol Graph. 1996;14(1):33‐38. [DOI] [PubMed] [Google Scholar]
- 20.Phillips JC, Braun R, Wang W, et al. Scalable molecular dynamics with NAMD. J Comput Chem. 2005;26(16):1781‐1802. [DOI] [PMC free article] [PubMed] [Google Scholar]
- 21.Jo S, Kim T, Iyer VG, Im W. CHARMM‐GUI: A web‐based graphical user interface for CHARMM. J Comput Chem. 2008;29(11):1859‐1865. [DOI] [PubMed] [Google Scholar]
- 22.Vermeer LS, de Groot BL, Réat V, Milon A, Czaplicki J. Acyl chain order parameter profiles in phospholipid bilayers: computation from molecular dynamics simulations and comparison with 2H NMR experiments. Eur Biophys J. 2007;36(8):919‐931. [DOI] [PubMed] [Google Scholar]
- 23.Piggot TJ, Allison JR, Sessions RB, Essex JW. On the calculation of acyl chain order parameters from lipid simulations. J Chem Theory Comput. 2017;13(11):5683‐5696. [DOI] [PubMed] [Google Scholar]
- 24.Akinshina A, Das C, Noro MG. Effect of monoglycerides and fatty acids on a ceramide bilayer. Phys Chem Chem Phys. 2016;18(26):17446‐17460. [DOI] [PubMed] [Google Scholar]
- 25.Lee S‐W, Tettey KE, Yarovoy Y, Lee D. Effects of anionic surfactants on the water permeability of a model stratum corneum lipid membrane. Langmuir. 2014;30(1):220‐226. [DOI] [PubMed] [Google Scholar]


