

Abstract
Quantitative assessment of drug‐drug interactions (DDIs) involving breast cancer resistance protein (BCRP) inhibition is challenged by overlapping substrate/inhibitor specificity. This study used physiologically‐based pharmacokinetic (PBPK) modeling to delineate the effects of inhibitor drugs on BCRP‐ and organic anion transporting polypeptide (OATP)1B‐mediated disposition of rosuvastatin, which is a recommended BCRP clinical probe. Initial static model analysis using in vitro inhibition data suggested BCRP/OATP1B DDI risk while considering regulatory cutoff criteria for a majority of inhibitors assessed (25 of 27), which increased rosuvastatin plasma exposure to varying degree (~ 0–600%). However, rosuvastatin area under plasma concentration‐time curve (AUC) was minimally impacted by BCRP inhibitors with calculated G‐value (= gut concentration/inhibition potency) below 100. A comprehensive PBPK model accounting for intestinal (OATP2B1 and BCRP), hepatic (OATP1B, BCRP, and MRP4), and renal (OAT3) transport mechanisms was developed for rosuvastatin. Adopting in vitro inhibition data, rosuvastatin plasma AUC changes were predicted within 25% error for 9 of 12 inhibitors evaluated via PBPK modeling. This study illustrates the adequacy and utility of a mechanistic model‐informed approach in quantitatively assessing BCRP‐mediated DDIs.
Study Highlights.
WHAT IS THE CURRENT KNOWLEDGE ON THE TOPIC?
BCRP‐mediated intestinal efflux was shown to impact oral absorption of drugs; and thus, modulation of BCRP can lead to significant drug‐drug interactions (DDIs). Rosuvastatin is a recommended probe drug to assess BCRP‐mediated DDIs in clinic. However, the quantitative understanding and prospective prediction of such interactions has been a challenge in drug development.
WHAT QUESTION DID THIS STUDY ADDRESS?
Can multiple disposition mechanisms (OATPs/BCRP) of rosuvastatin be delineated using in vitro data informed mechanistic modeling, in order to quantitate BCRP‐mediated DDIs?
WHAT DOES THIS STUDY ADD TO OUR KNOWLEDGE?
In vitro data‐informed physiologically‐based pharmacokinetic (PBPK) approach can enable quantitative prediction of BCRP‐mediated DDIs. The PBPK analysis suggests that BCRP inhibition alone could increase rosuvastatin exposure by more than 5 times, and therefore needs to be carefully assessed. A DDI risk assessment strategy was defined based on the static and PBPK models.
HOW MIGHT THIS CHANGE DRUG DISCOVERY, DEVELOPMENT, AND/OR THERAPEUTICS?
Quantitative understanding of the effect of BCRP inhibition on pharmacokinetics (PKs) of victim drugs is important to inform the need to conduct clinical PK studies, and/or inform product label on drug interactions. A mechanistic PBPK modeling approach can be adequately used to predict or assess BCRP‐mediated DDI risk in drug development.
INTRODUCTION
Breast cancer resistance protein (BCRP; ABCG2) is an ATP‐binding cassette efflux transporter expressed in the apical membrane of the small intestine and liver canalicular membrane and plays a key role in the oral absorption and hepatic elimination of substrate drugs. Additionally, BCRP is also expressed in the blood‐brain barrier, testis, placenta, and mammary glands, and may functionally limit organ exposure of drugs and metabolites.1 Pharmacogenetic studies demonstrated the clinical relevance of BCRP in pharmacokinetics (PKs) of substrate drugs.2, 3 Several marketed drugs, including rosuvastatin, sulfasalazine, and atorvastatin, show increased systemic exposure due to impaired BCRP activity in carriers of ABCG2 c.421C>A genetic polymorphism.3 For example, rosuvastatin demonstrated 2.4‐fold higher exposure in homozygous BCRP c.421A/A individuals compared with wild‐type c.421C/C individuals.4 Homozygous carriers of the variant allele (c.421A/A) showed up to a 3.5‐fold increase in sulfasalazine oral exposure compared with the carriers of the reference allele (c.421C/C).5
Furthermore, BCRP was suggested to be an important loci of drug‐drug interactions (DDIs) in humans.6 Regulatory guidance from agencies, including the European Medical Agency (EMA), the Pharmaceuticals and Medical Devices Agency (PMDA, Japan), and US Food and Drug Administration (FDA), now recommend appropriate in vitro and/or in vivo assessment of investigational drugs for potential to inhibit several drug transporters, including BCRP.7, 8, 9 According to the recent FDA guidance, a new molecular entity (NME) with a potential to inhibit BCRP – where the gut concentration (Igut = dose/250 ml) at the clinical dose is more than 10 times the in vitro measured inhibition potency (half‐maximal inhibitory concentration [IC50] or inhibition constant [Ki]) (i.e., G value [= Igut/IC50] >10) – is likely to increase systemic exposure of substrate drugs (e.g., rosuvastatin and sulfasalazine).8 Likewise, organic anion transporting polypeptide (OATP)1B1/1B3 inhibitor drugs with unbound maximum plasma liver inlet concentration (Iin,max,u) more than 10% of IC50 values [i.e., R value [= 1 + Iin,max,u/IC50] >1.1] are likely to increase systemic exposure of OATP1B substrate drugs (e.g., statins, sartans, and glinides).8
Many drugs from various therapeutic areas have been identified as inhibitors of BCRP in vitro, yet, clinical DDIs attributed directly and specifically to BCRP are limited due to overlapping substrate activity of clinical probes (e.g., rosuvastatin and sulfasalazine) with other transporters and/or enzymes.6, 10 For example, a 5–7‐fold increase in rosuvastatin exposure during cyclosporine coadministration was attributed mechanistically to inhibition of BCRP and OATP1B1/1B311; however, quantification of the relative contribution of each of these pathways to the overall DDI is challenging. In spite of these limitations, rosuvastatin is a preferred probe drug to clinically assess BCRP modulation by investigational drugs. To this end, rosuvastatin clinical DDI studies are abundantly run with data available in public domain for more than 80 unique drugs/NMEs (University of Washington ‐ Drug Interaction Database, www.druginteractionsolutions.org). In comparison, DDI data are limited to only about five drugs using sulfasalazine, an alternate in vivo BCRP probe. Establishing a reliable physiologically‐based pharmacokinetic (PBPK) modeling approach can enable delineation of BCRP inhibition from other mechanisms and allow for quantitative DDI predictions.
Here, we evaluated rosuvastatin DDIs for a set of 27 inhibitor drugs using basic static model analysis as suggested in the regulatory guidance (FDA),8 and followed up with comprehensive PBPK modeling and simulations for a representative set of 12 inhibitor drugs. Selection criteria from the inhibitors included availability of clinical DDI data with rosuvastatin as the probe drug, compound accessibility for in vitro studies, and the availability of clinical input parameters for R value calculations or PBPK modeling. In vitro IC50 data against BCRP and OATP1B1/1B3 were generated using membrane vesicular and transfected cell systems, respectively. A rosuvastatin PBPK model accounting for its multiple transporter‐mediated disposition mechanisms was developed based on in‐house transport kinetics data, and previously established scalars. Subsequently, rosuvastatin DDIs with 12 inhibitors were simulated; and a strategy to enable DDI risk assessment in drug development is discussed.
METHODS
In vitro BCRP inhibition studies
BCRP inhibition was measured using membrane vesicles and rosuvastatin as probe substrate (Table 1). Concentration of rosuvastatin (0.2 µM) used in these studies are below its BCRP substrate affinity constant (Km; 3.2 µM). Detailed procedure is provided in Supplementary Methods.
TABLE 1.
Summary of static DDI risk assessment of 27 BCRP and/or OATP1B inhibitor drugs
| Inhibitor | Code | BCRP IC50 (µM)a | OATP1B1 IC50 (µM)b | OATP1B3 IC50 (µM)b | BCRP G‐valuec | 1B1 R‐Valuec | 1B3 R‐Valuec | Rosuvastatin AUC ratiod |
|---|---|---|---|---|---|---|---|---|
| Atorvastatin | Ato | 8.6 | 0.533 | 1 | 8 | 1.01 | 1.00 | 0.93 |
| Brexpiprazole | Bre | 100 | 13.21 | ‐ | 1 | 1.00 | ‐ | 1.12 |
| Capmatinib | Cap | 0.69 | 3.3 | 14.5 | 5628 | 1.35 | 1.08 | 2.03 |
| Clarithromcyin | Cla | 411 | 3.5 | 9.8 | 6 | 1.99 | 1.35 | 1.58 |
| Cyclosporine | Csa | 3.3 | 0.01445 | 0.062 | 202 | 9.71 | 2.97 | 6.20 |
| Daclatasvir | Dac | 1.1 | 1.546 | 3.346 | 295 | 1.18 | 1.08 | 1.47 |
| Darolutamidee | Dar | 0.09 | 3.8 | 20.2 | 66834 | 1.09 | 1.02 | 5.50 |
| Keto‐darolutamidee | ‐ | 0.56 | >10 | >10 | ‐ | ‐ | ‐ | ‐ |
| Elbasvir | Elb | 0.14 | 7.8 | >10 | 1620 | 1.00 | 1.00 | 1.42 |
| Eltrombopag | Elt | 0.95 | 27.3 | 3 | 714 | 1.01 | 1.10 | 1.55 |
| Enobosarm | Eno | 1.1 | NI | ‐ | 28 | 1.00 | ‐ | 1.18 |
| Fenebrutinib | Fen | 0.63 | 6.8 | 1.1 | 1910 | 1.46 | 3.86 | 2.48 |
| Fostamatinibe | Fos | 2 | 0.89 | 7.4 | 345 | ‐ | ‐ | 1.95 |
| R406e | ‐ | 0.065 | >50 | >50 | 10606 | 1.00 | 1.00 | ‐ |
| Gemfibrozile | Gem | 295 | 2.52 | 10 | 33 | 2.60 | 1.15 | 1.88 |
| Gemfibrozil 1‐O‐b‐glucuronidee | ‐ | ‐ | 7.9 | ‐ | ‐ | ‐ | ‐ | ‐ |
| Grazoprevir | Gra | 4.03 | 0.18 | 0.61 | 259 | 1.24 | 1.07 | 1.59 |
| Grazoprevir + Elbasvire | Zep | ‐ | ‐ | ‐ | 1879 | 1.24 | 1.07 | 2.26 |
| GSK1292263 | GSK | 3.0 | >30 | ‐ | 876 | 1.03 | ‐ | 1.39 |
| Idelalisib | Ide | 54.4 | 3.13 | 7 | 27 | 1.19 | ‐ | 1.11 |
| Itraconazolee | Itr | 3.2 | 12.9 | >20 | 354 | 1.01 | 1.00 | 1.26 |
| Hydroxy‐itraconazolee | ‐ | ‐ | 1.4 | ‐ | ‐ | ‐ | ‐ | ‐ |
| Obeticholic acid | Obe | 4.1 | 1.96 | 2.15 | 46 | 1.02 | 1.02 | 1.25 |
| Pantoprazole | Pan | 6.1 | >500 | NI | 68 | 1.01 | ‐ | 1.03 |
| Pradigastat | Pra | 0.71 | 1.48 | 3.3447 | 495 | 1.03 | 1.01 | 0.96 |
| Probenecid | Pro | 216 | 38.1 | 339 | 65 | 1.99 | 1.11 | 2.20 |
| Rifampicin | Rif | 14.9 | 0.29 | 0.73 | 196 | 10.20 | 4.65 | 4.60 |
| Rifampicin IVf | RifIV | 14.9 | 0.29 | 0.73 | 1 | 7.29 | 3.50 | 3.36 |
| Telmisartan | Tel | 0.61 | 3.06 | 0.9548 | 510 | 1.01 | 1.03 | 1.20 |
| Velpatasvir | Vel | 0.09 | 1.349 | 0.2349 | 5033 | 1.00 | 1.02 | 2.59 |
| Vercirnon | Ver | 3.3 | 2.1 | ‐ | 1362 | 2.02 | ‐ | 0.99 |
BCRP IC50 values are measured using membrane vesicle system with rosuvastatin as probe substrate (concentration below its Km, therefore, IC50 and Ki can be considered equal).
OATP IC50 values are measured using single‐transfected HEK293 cells with rosuvastatin as probe substrate (concentration below its Km, therefore, IC50 and Ki can be considered equal for static analysis). In few cases, IC50 data were taken from literature (references cited in those cases). NI, no inhibition.
Gut concentration (Igut), unbound maximum plasma concentration (Imax,u) and unbound liver inlet maximum concentration (Iin,max,u) used for R‐value calculations, and the corresponding input parameters are shown in Table S1.
References for observed rosuvastatin AUC ratio are provided in Table S1.
In case of darolutamide, fostamatinib, gemfibrozil, itraconazole and elbasvir + grazoprevir, metabolites or combination drug was accounted for in vivo inhibition potency assuming additive effect (e.g., R‐value = 1 + Parent Iin,max,u/IC50 + Metabolite Imax,u/IC50). OATP1B1 Ki for gemfibrozil and its glucuronide and their unbound Cmax were taken from Varma et al.43
IV represent intravenous administration of inhibitor drug. G‐value was assumed to be 1.00, and R‐value is calculated using Imax,u in this case. All other inhibitors are dosed oral.
In vitro OATP1B1 and OATP1B3 inhibition studies
Transporter‐transfected HEK293 cells were used to measure the OATP1B1 and OATP1B3 inhibition (Table 1). A 30‐min pre‐incubation with test compound or control inhibitor at 37°C, 5% CO2, and 90% relative humidity was done prior to the assay incubation. Rosuvastatin was used as the probe substrate, at a concentration (0.3 µM) below its OATP1B1 Km (3.8 µM) and OATP1B3 Km (28.3 µM). Detailed procedure is provided in Supplementary Methods.
PBPK modeling and simulations
Whole‐body PBPK modeling and simulations were performed using population‐based absorption, distribution, metabolism, and excretion (ADME) simulator, Simcyp (version 19.0; Certara, Sheffield, UK). Unless mentioned otherwise, the virtual populations of healthy subjects had a body weight of about 80 kg, with age ranging from 18 to 65 years, and included both sexes. Dosage regimen was matched to the clinical study design. Model for substrate compound, rosuvastatin, was built by adopting a similar approach described elsewhere.12, 13, 14, 15, 16, 17 Briefly, an initial model was developed using the physicochemical properties and the data from in vitro studies (Table 2). Advanced dissolution absorption and metabolism (ADAM) model was used to predict the oral absorption based on Caco‐2 permeability data. BCRP Km was obtained using membrane vesicle studies. Concentration‐dependent Caco‐2 studies did not yield adequate saturation kinetics likely due to competing OATP2B1 and BCRP kinetics (data not shown). Consequently, BCRP maximum flux (Jmax) and OATP2B1 uptake clearance (CLint) were optimized to recover ~ 40% Fa. The Roger and Rowland method (Method 2)16, 18 was used to capture the distribution of rosuvastatin assuming rapid equilibrium between blood and all organs, except the liver and kidneys.
TABLE 2.
Model input parameters for the full‐PBPK model of rosuvastatin, a probe substrate drug
| Model input parameters | Values | Source |
|---|---|---|
| Mol Weight (g/mol) | 481.5 | ‐ |
| log P | 2.4 | ‐a |
| pKa 1 (Monoprotic acid) | 4.33 | Measured |
| Blood‐to‐plasma ratio | 0.63 | ‐a |
| Fraction unbound in plasma | 0.12 (Binding to HSA) | In vitro data |
| Absorption Model | ADAM | |
| Unbound fraction in gut | 1.00 | ‐a |
| Caco−2 permeability (10−6 cm/s) | 1.20 | In vitro data |
| Permeability Scalar | 1.87 | Estimated (using multiple permeability calibrators in the same assay) |
| Colon absorption/basolateral scalar | 0.08 | Optimized to recover observed Fa |
| Intestinal OATP2B1 CLint,T (µl/min) | 0.002 | Estimated |
| Intestinal BCRP Jmax (pmol/min) | 380 | Estimated |
| BCRP Km (µM) | 10.8 | From membrane vesicle assay50 |
| Distribution Model | Full PBPK Model (Method 2) | |
| Steady‐state volume of distribution (L/kg) | 0.121 | Method 2 predicted |
| fu Kidney Cell/Urine | 0.98/1.0 | Model predicted |
| OAT3 CLint,T (µl/min/106cells) | 28 (RAF = 2.7) | RAF (=4.1) from Mathialagan et al.22 adjusted to recover observed renal clearanceb |
| Renal MRP4 CLint,T (µl/min/106cells) | 28 (RAF = 2.7) | Assumed to be same as renal uptake clearance |
| CLPD basal (hepatic and renal) (µl/min/106) | 1.1 | Measured using SCHH |
| Hepatocyte fuIW/ fuEW | 0.96/0.21 | Model predicted |
| Hepatic OATP2B1 CLint,T (µl/min/million cells) | 0.6 (RAF = 20) | |
| OATP1B1 CLint,T (µl/min/million cells) | 8.60 (RAF = 20) | RAF (=10.6) from Varma et al.20 was initially used. Value adjusted to recover IV clearanceb |
| OATP1B3 CLint,T (µl/min/million cells) | 1.10 (RAF =20) | Contribution of individual transporters was assigned based on ‘SLC‐phenotyping’ assay21 |
| Hepatic BCRP CLint,T (µl/min/million cells) | 3.10 (RAF =1) | SCHH biliary clearance data (RAF)51 |
| Hepatic MRP4 CLint,T (µl/min/million cells) | 3.10 (RAF =1) | Assumed to be same as BCRP CLint,T, as suggested by in vitro studies. |
Abbreviations: ADAM, advanced dissolution absorption and metabolism gut model; CLint,T, intrinsic transport clearance; CLPD, passive transport clearance; fu, fraction unbound; fuIW/ fuEW, fraction unbound in the intracellular and extracellular water; RAF, relative activity factor; SCHH, sandwich culture human hepatocytes.
Values similar to Simcyp V19 default file; all other parameters are derived based on inhouse data.
RAF values of hepatic active uptake and renal OAT3 are simultaneously refined to recover both observed plasma concentration‐time profiles and percent amount excretion (~25%) in urine data following IV dose.26
Permeability‐limited hepatic disposition of rosuvastatin was considered, for which, sinusoidal active and passive uptake and canalicular active efflux obtained from our sandwich culture human hepatocyte (SCHH) transport studies were incorporated. Recent SCHH studies suggest intrinsic biliary and basolateral (MRP4) efflux are similar, so basolateral efflux was accounted with CLint assuming to be similar to BCRP‐mediated biliary clearance obtained from SCHH studies.19 The geometric mean relative activity factor (RAF) for OATP1B (RAFOATP) of 10.6, previously established utilizing SCHH (3 hepatocyte lots) from 10 different OATP1B substrates, was initially applied.20 RAFOATP was further refined to a value of about 20 to better recover both the plasma concentration‐time profiles and urinary excretion data (~ 25% dose) from the intravenous study. Contribution from specific uptake transporters (OATP1B1, OATP1B3, OATP2B1, and NTCP) to the overall hepatic uptake were measured using “SLC‐phenotyping” methodology recently reported,21 which showed ~ 95% of active uptake is driven by OATP1B1, OATP1B3, and OATP2B1. Rosuvastatin metabolic clearance was assumed to be negligible based on its general enzymatic stability.
Transporter‐mediated renal secretion was built into the PBPK model. Uptake clearance via OAT3 was obtained from the rate studies using HEK293‐OATs cells, as previously described.22 RAFOAT3 of ~ 4.1, which we previously established based on the in vitro–in vivo extrapolation of OAT3‐mediated transport using static model,22 was initially applied. This value was further refined (final RAFOAT3 = 2.7) to recover the observed renal clearance. We assumed an apical efflux transporter on the proximal tubule cells mediate secretion from cells to urine compartment with similar transporter kinetics and RAF. Passive transport clearance was estimated from uptake rates in HEK293 wild type cells.
Model input parameters for 12 inhibitor drugs used in the PBPK evaluation, and their simulated plasma concentration‐time profiles are presented in Supplementary Material (Tables S2–S11, Figures S6–S11). Models were additionally verified for Fa, or F when possible. Inhibitors models for capmatinib, darolutamide, fostamatinib/metabolite‐R406, fenebrutinib, elbasvir, and grazoprevir were developed and verified as part of the current work. Cyclosporine PBPK model, previously developed and verified with several known OATP probe drugs, was applied without any modification.12, 13 Rifampicin, gemfibrozil/glucuronide parent‐metabolite pair, and itraconazole simulator default models are adopted with minor changes. Fenebrutinib and velpatasvir Simcyp models were previously described, and used here after minor modifications.23, 24 Inhibition potency against BCRP and OATP1B1/1B3 generated in the current study were used for all models. Rosuvastatin concentration used to measure BCRP IC50 and OATP1B1/1B3 IC50 is well below its corresponding Km. Therefore, IC50 and Ki values are assumed same for BCRP. However, Ki was assumed to be IC50/2 for OATP1B inhibition as a conservative measure. It is noteworthy that majority of inhibitor drugs (except rifampicin, cyclosporine, and gemfibrozil) did not inhibit OATPs at the clinically relevant concentrations.
Finally, PBPK model performance was evaluated by the ratio of predicted and observed area under the concentration‐time curve ratio (AUCR) values, and presented as R pred/obs. An R pred/obs value between 0.8 and 1.25 was assumed as acceptable model performance.25
RESULTS
Basic static DDI risk assessment
For a representative set of 27 drugs, with rosuvastatin clinical DDI data available in the public domain, in vitro inhibition potency (IC50) against BCRP and OATP1B1/1B3 were experimentally measured using membrane vesicle system and transporter‐transfected cells, respectively (Table 1). Static assessment based on IC50 values and unbound hepatic inlet concentration following oral dose (Iin,max,u) for OATP1B1 interactions, or gut concentration (Igut = dose/250 ml) for BCRP interactions, was conducted according to recent regulatory guidance.8 Considering the FDA cutoff criteria (G value [= Igut/IC50] >10), about 88% drugs (n = 23) showed potential for BCRP inhibition in vivo (Figure 1). In case of OATP1B1 inhibition, 13 drugs exceeded the R value (= 1 + Iin,max,u/IC50) cutoff of 1.1, implying in vivo inhibition risk. Consequently, a total of 25 drugs (92%) exceeded either the OATP1B1 or BCRP cutoff criteria, suggesting that a majority can potentially elevate rosuvastatin area under the plasma concentration‐time curve (AUC) according to current regulatory guidance.
FIGURE 1.
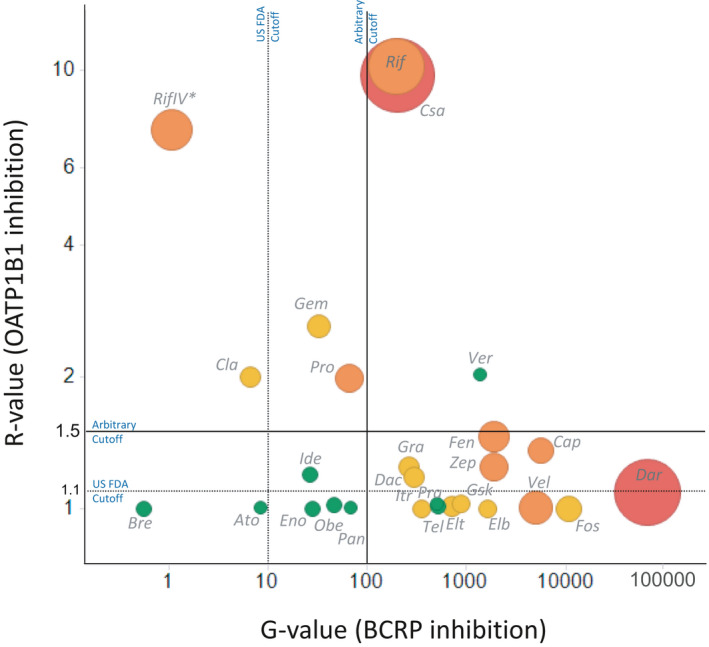
Static risk assessment of BCRP and OATP1B1 inhibition in vivo, and the observed effect on rosuvastatin pharmacokinetics. Rosuvastatin area under plasma concentration‐time curve (AUC) change when administered with these inhibitor drugs was binned as 1.25–2.0 (weak, green data points), 2.0–5.0 (moderate, orange datapoints) and greater than fivefold (high, red datapoints) drug‐drug interaction (DDI) categories. Size of each datapoint also depict magnitude of rosuvastatin AUC ratio (~ 1.26–7.1). Vertical and horizontal lines represent the US Food and Drug Administration (FDA) recommended cutoffs (G value >10, R value >1.1) or arbitrary cutoffs derived based on the current dataset (G value >100, R value >1.5). *IV represent intravenous administration of inhibitor drug. G‐value was assumed to be 1.00, and R value is calculated using Imax,u in this case. All other inhibitors are dosed oral
We further analyzed the static model output while binning rosuvastatin DDIs based on the magnitude of AUC change when co‐administered with inhibitor drugs (i.e., no DDI [AUCR <1.25, n = 9), weak (1.25–2.0, n = 9), moderate (2.0–5.0, n = 7), and strong DDI (>5.0, n = 2)]. Based on this dataset, BCRP‐mediated interactions are apparent only when the G value is considerably above 100, whereas moderate and strong DDI risk is seen for inhibitors with G values above 1000 (Figure 1). On the other hand, OATP1B1 interactions are more apparent when the R value greater than 1.5. It is noteworthy that darolutamide, which showed potent BCRP inhibition but minimal OATP1B1 inhibition (G value ~ 67,000; R value <1.1) produced a strong DDI (AUCR >5). Oral rifampicin and cyclosporine inhibited both BCRP and OATP1B1 and clearly elicited a moderate‐to‐strong effect on rosuvastatin PK (AUCR >2). Finally, vercirnon is a notable false positive with no change in rosuvastatin AUC in spite of the inhibition of both transporters (G value ~ 1400; R value ~2.0). Overall, rosuvastatin DDI risk is likely for BCRP and/or OATP1B1 inhibitors with G value greater than 100 and/or R value greater than 1.5; and simultaneous visualization of G value and R value (Figure 1) may enable approximation of DDI risk category (i.e., weak, moderate, and strong).
Rosuvastatin PBPK model development and verification
A full PBPK model for rosuvastatin—informed with in vitro and intravenous PK data—was developed in Simcyp version 19 (Certara, UK). The model accounts for transporter‐mediated intestinal (OATP2B1 and BCRP), hepatic (OATP1B, BCRP, multidrug resistance‐associated protein [MRP]4) and renal (OAT3) disposition mechanisms, with initial inputs obtained from in vitro transport studies conducted in our laboratory (Table 2). The model adequately described rosuvastatin plasma concentration‐time profiles across a range of oral doses (10–80 mg) from about 20 separate clinical studies (Figure 2). Fraction absorbed (Fa) was predicted to be about 0.4, which is in the range estimated using intravenous/oral PK.26 Rosuvastatin renal elimination, parameterized based on OAT3‐mediated secretion and glomerular filtration, showed about 25% dose in urine following i.v. dosing (and ~ 5% of oral dose), which is also consistent with clinical observations.26 Parameter sensitivity analyses of individual transport mechanisms suggested that abolishing intestinal OATP2B1 reduce rosuvastatin exposure by about fivefold. Assuming complete knockout of BCRP activity at intestine or liver elevated model simulated rosuvastatin exposure by about sixfold. Similar changes were noted with OATP1B activity in the liver. Rosuvastatin AUC is also sensitive to basolateral efflux transporter, MRP4. Although renal clearance accounts for ~ 25% of i.v. clearance, eliminating OAT3‐mediated renal secretion had only a marginal effect on rosuvastatin oral exposure as only ~ 5% oral dose is eliminated in urine.
FIGURE 2.
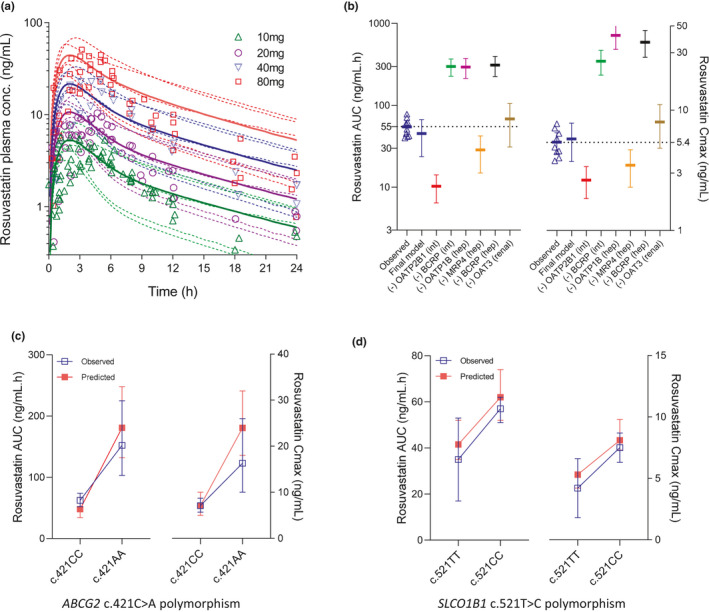
(a) A physiologically‐based pharmacokinetic (PBPK) model simulations of rosuvastatin plasma concentration‐time profiles following escalating oral doses. Data points represent observed plasma concentrations, and solid curves and dotted curves represent mean and individual trials of the model predictions. Observed datapoints are mean values from about 20 separate studies in White patients. (b) Parameter sensitivity analysis on the final rosuvastatin PBPK model, while assessing effect of “knocking‐out” individual disposition mechanisms on its area under plasma concentration‐time curve (AUC) and maximum plasma concentration (Cmax) following 10 mg oral dose. Mean with 95% confidence intervals (CIs) are presented for each scenario. Observed values from multiple clinical studies (10 mg dose) were also shown (tringles). (c) Observed and model predicted mean (± 95% CI or SD) values of rosuvastatin AUC and Cmax in carriers of ABCG2 c.421CC and c.421AA subjects. (d) Observed and model predicted mean (± 95% CI or SD) values of rosuvastatin AUC and Cmax in carriers of SLCO1B1 c.521TT and c.421CC subjects
Single‐nucleotide polymorphism (SNP) in ABCG2 (c.421C>A) and SLCO1B1 (c.521T>A) were shown to effect rosuvastatin PKs.2, 3 Carriers of ABCG2 c.421AA genotype show about 130–140% greater rosuvastatin AUC and Cmax than in those with the c.421CC genotype.4 The current PBPK model well recovered the observed impact of this ABCG2 polymorphism on rosuvastatin PK (Figure 2c). It is noteworthy that apparent Fa increased by about 110%, from 0.36 in c.421CC to 0.75 in c.421AA carriers. Similarly, the model also recovered a relatively smaller impact of SLCO1B1 c.521T>C polymorphism (Figure 2d).
PBPK modeling simulations of BCRP/OATP1B1 DDIs
The verified rosuvastatin model was further used to quantitively evaluate its clinical drug interactions with 12 inhibitors representing varying degrees of BCRP and/or OATP1B1 inhibition based on the basic static assessment. PBPK models with oral absorption predicted using an ADAM model were developed or adopted from previous reports. In vitro IC50 values experimentally measured using membrane vesicles were directly input for BCRP inhibition (i.e., Ki = IC50). In the case of OATP1B1/1B3 inhibition, Ki was assumed to be half the in vitro IC50 value (i.e., Ki = IC50/2), with the exception of cyclosporine and gemfibrozil, where previously verified PBPK models were adopted as is (see methods).12, 13, 27
Rosuvastatin DDIs primarily involving OATP1B inhibition were first evaluated using inhibitor drugs, including cyclosporine gemfibrozil and rifampicin (intravenous and oral; Figure 3). The increase in rosuvastatin exposure by up to twofold when co‐administered with gemfibrozil can be quantitatively recovered by OATP1B1 inhibition alone, while gemfibrozil did not meaningfully modulate other disposition mechanisms of rosuvastatin (e.g., oral absorption and renal clearance). Consistent to the clinical observations, the model predicted that a single dose intravenous rifampicin (600 mg) and oral rifampicin (600 mg) increase rosuvastatin oral exposure by about 3.2 and 4.2‐fold, respectively (Figure 3, Table 3). Rosuvastatin‐cyclosporine interaction was underpredicted, although the predicted AUC ratio is within twofold of observed value (3.85 vs. 7.10). A change in Fa was predicted to be minimal for oral rifampicin and cyclosporine. Collectively, rosuvastatin DDIs with these inhibitor drugs verify the PBPK model performance specifically involving OATP1B activity.
FIGURE 3.
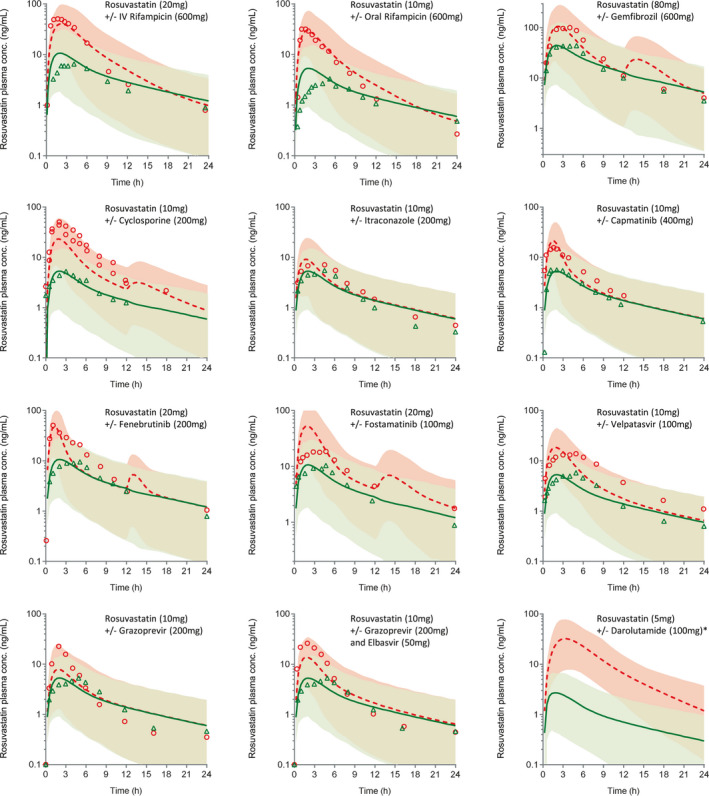
Physiologically‐based pharmacokinetic (PBPK) model simulations of rosuvastatin plasma concentration‐time profiles following oral dose without or with inhibitor drugs. Data points represent observed plasma concentrations in control (triangles) and treatment (circles) groups. Solid curves and dotted curves represent model predictions of mean rosuvastatin plasma concentrations of the when dosed alone or with inhibitor drugs. Shaded areas depict 95% confidence intervals (CIs) of model predictions. *Observed pharmacokinetic (PK) profiles not shown–for unknown reason, observed plasma exposure of rosuvastatin in this study is only about a third of the exposures reported in other clinical studies at this dose
TABLE 3.
Simulated and observed rosuvastatin DDIs with BCRP and OATP1B inhibitors
| Inhibitor drugs | Rosuvastatin oral dose | AUC ratio | Cmax ratio | |||||
|---|---|---|---|---|---|---|---|---|
| Predicted | Observed | R pred/obs | Predicted | Observed | R pred/obs | |||
| Rifampicin IV infusion (600 mg s.d., 30 min) | 5/20 mg | 3.24 | 3.03, 3.37 | 0.96–1.07 | 4.70 | 5.40, 8.50 | 0.55–0.87 | |
| Rifampicin oral (600 mg s.d.) | 5/10 mg | 4.18 | 3.48, 4.60, 4.67 | 0.89–1.20 | 7.11 | 9.40, 11.25, 11.50 | 0.62–0.76 | |
| Cyclosporine (200 mg b.i.d.) | 10 mg | 3.85 | 5.3, 7.1 | 0.73–0.55 | 5.40 | 9.1, 10.6 | 0.50–0.59 | |
| Gemfibrozil (600 mg b.i.d.) | 80 mg | 2.00 | 1.88 | 1.06 | 2.56 | 2.21 | 1.16 | |
| Fenebrutinib (200 mg b.i.d.) | 20 mg | 2.01 | 2.48 | 0.81 | 4.71 | 4.74 | 0.91 | |
| Fostamatinib (100 mg b.i.d.) | 20 mg | 3.70 | 1.95 | 1.90 | 5.54 | 1.90 | 2.99 | |
| Capmatinib (400 mg b.i.d.) | 10 mg | 2.13 | 2.03 | 1.05 | 4.49 | 3.05 | 1.47 | |
| Grazoprevir (200 mg q.d.) | 10 mg | 1.26 | 1.59 | 0.79 | 1.54 | 4.25 | 0.36 | |
| Grazoprevir (200 mg) + elbasvir (50 mg q.d.) | 10 mg | 2.08 | 2.26 | 0.92 | 3.04 | 5.51 | 0.56 | |
| Darolutamide (600 mg b.i.d.) | 5 mg | 14.80 | 5.50 | 2.70 | 12.90 | 5.50 | 2.35 | |
| Velpatasvir (100 mg q.d.) | 10 mg | 2.74 | 2.59 | 1.05 | 3.88 | 2.50 | 1.55 | |
| Itraconazole (200 mg q.d.) | 10 mg | 1.14 | 1.26 | 0.90 | 1.12 | 1.38 | 0.81 | |
All dose administration followed oral route unless mentioned otherwise. References for observed rosuvastatin AUC ratio and Cmax ratio are provided in Table S1.
Abbreviations: AUC, area under plasma concentration‐time curve; Cmax, maximum plasma concentration; DDI, drug‐drug interaction.
b.i.d., twice daily; q.d., once daily; s.d., single does.
Inhibitor drugs, including itraconazole and velpatasvir, with potent gut BCRP inhibition (i.e., G value >100) and no OATP1B1 inhibition (R value <1.1) showed rosuvastatin AUCRs in the range of ~1.25 and 2.5. These DDIs are well predicted by the developed PBPK models and the measured in vitro IC50 values (Figure 3, Table 3).
Rosuvastatin AUC changes with capmatinib, fenebrutinib, grazoprevir, and elbasvir/grazoprevir combination (Zepatier) were also well recovered with predicted‐to‐observed ratio (R pred/obs) of AUC ratio in the 0.8–1.25 limits (Figure 3, Table 3). In addition to the G value being well above 10, these inhibitors showed OATP1B1 R value marginally above the regulatory cutoff (R value ~ 1.1–1.5). However, PBPK simulations suggested that their DDIs are driven largely by BCRP inhibition in the gut (Figure S2). No change in rosuvastatin intrinsic uptake activity was noted when dosed with these four inhibitors (Figure S3). Nevertheless, consistent with their significant Cmax/IC50 values (Table 1) model simulations showed considerable effect on biliary clearance of rosuvastatin (Figure S4). That is, change in Fa and biliary clearance contributed to the predicted increase in rosuvastatin plasma exposure.
Finally, darolutamide with BCRP IC50 of 0.09 µM knocked down intestinal and biliary efflux activity of rosuvastatin by more than 80%, resulting in a large interaction. In this case, the model overpredicted AUC and Cmax changes. Of all the inhibitors modeled, only rifampicin, cyclosporine, and gemfibrozil showed meaningful inhibition (>20%) of rosuvastatin OATP1B‐mediated hepatic uptake (Figure S3), whereas BCRP inhibition is the primary interaction mechanism for the remaining inhibitors.
Overall, the developed PBPK approach predicted 9 of 12 DDIs involving BCRP and/or OATP1B1 within the set criteria (R pred/obs 0.8–1.25) for rosuvastatin AUC change (Table 3, Figure S5). In two cases (fostamatinib and darolutamide) there was a two‐ to threefold overprediction; whereas only cyclosporine was underpredicted and fell outside the predictive success criteria for AUCR (R pred/obs = 0.8–1.25).
DISCUSSION
Rosuvastatin is a widely prescribed drug and is also a recommended substrate drug to probe BCRP inhibition by investigational drugs.6, 8 Clinical PKs of rosuvastatin is determined by multiple disposition mechanisms involving various drug transporters (OATP2B1/BCRP/OATP1B/MRPs/OAT3) in the gut‐liver‐kidney axis. Here, we attempted to rationalize a wide array of its DDIs using basic static analysis and mechanistic PBPK modeling and simulations, so as to (i) understand the quantitative role of the gut/hepatic BCRP versus hepatic OATPs versus renal OAT3 in determining the magnitude of rosuvastatin DDIs, and (ii) implement the learnings for the prospective prediction of BCRP‐mediated DDIs early in the drug development. To our knowledge, this is the first comprehensive study demonstrating the adequacy of mechanistic PBPK modeling and simulations to quantitatively predict DDIs involving BCRP inhibition while adopting inhibition potency data (IC50 or Ki) obtained from in vitro studies.
Leveraging the collective learnings from the static analysis and PBPK modeling and simulations, we have articulated a strategy that could be used in BCRP DDI risk assessment in drug development (Figure 4). Based on the static analysis of 27 inhibitor drugs, we have defined arbitrary cutoff criteria for BCRP inhibition potential (G value > 100). Below this value, no meaningful change in rosuvastatin exposure was seen (AUCR < 1.25). From a drug development perspective, the proposed cutoff is still conservative as meaningful change in rosuvastatin AUC (>2‐fold), which may impact its dosing recommendations, is noted only for inhibitors with the G value well above 1000 (Figure 1). This cutoff differs from the current regulatory guidance, which is set as G value greater than 10.7, 8 Rosuvastatin product label (Crestor, FDA) recommend limiting dose to 5 mg or 10 mg once daily to mitigate its skeletal muscle effects (i.e., myopathy, which can progress to life‐threatening rhabdomyolysis) when combined with inhibitors, such as cyclosporine, gemfibrozil, and HIV drugs. Considerable interest is placed on understanding and appropriately managing BCRP/OATP1B in vivo inhibition risk in the drug development. In the absence of a reliable mechanistic model, deconvolution of gut versus systemic BCRP inhibition effects may require an elaborate clinical study, preferably a cross‐over design, including intravenous and oral arms for rosuvastatin without (control) and with the investigational drug.6 Additionally, intersubject variability in rosuvastatin PK due to ABCG2 (c.421C > A) and SLCO1B1 (c.521T > A) genetic polymorphisms should be carefully isolated. A translational PBPK model, such as the one presented here, can not only enable prospective predictions but offer insight into the contribution of individual mechanisms to the overall effect. Appropriate sensitivity analysis for the key input parameters (Ki) may be considered for prospective predictions. Finally, the “intended use” of this model is to predict the effect on rosuvastatin plasma exposure, but not to simulate or predict tissue exposure changes (e.g., the liver) as more work is needed to verify the later readouts.
FIGURE 4.
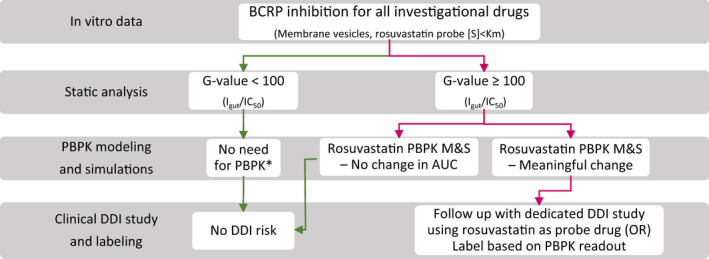
A schematic of BCRP DDI risk assessment based on the current learning from static and PBPK analyses. *Consider PBPK modeling and simulations when there is potential for multiple interaction mechanisms (e.g., OATP1B1 inhibition). AUC, area under plasma concentration‐time curve; DDI, drug‐drug interaction; IC50, half‐maximal inhibitory concentration; M&S, modeling and simulation; OR, odds ratio; PBPK, physiologically‐based pharmacokinetic
A rosuvastatin PBPK model was developed primarily using our in vitro transport data (obtained from established assays based on primary human hepatocytes, Caco‐2 studies and transfected cell lines)21, 22, 28 and previously derived empirical scalars for hepatic and renal transport.20, 22 These scalars were optimized within a range (± 2 times) to best recover i.v./oral PK of rosuvastatin, and its Fa, bioavailability (F), fraction excreted in urine (Fe) and renal clearance (Table 2).26 The final “middle‐out” model well‐described plasma concentration‐time profiles across a dose range of 10–80 mg primarily in the White population, and the effects of SLCO1B1 and ABCG2 functional polymorphisms (Figure 2). It is noteworthy that the clinical PK (plasma exposure) of rosuvastatin is highly variable across different studies in the White population (coefficient of variation [CV] of ~ 50%),29 and the PBPK simulated mean values may deviate from the observed mean data in a few cases (Figure 3). In addition, for reasons not completely understood, rosuvastatin oral clearance in the White population was shown to be about two times higher than in the Asian population,29, 30 therefore, DDI studies conducted in Asian population were excluded in this PBPK analysis.
Bowman et al. recently summarized the rosuvastatin PBPK models reported in the literature and reviewed the current gaps.31 These earlier studies evaluating rosuvastatin DDIs via PBPK primarily focused on hepatic OAT1B‐based interactions with inhibitors, such as rifampicin and cyclosporine31, 32; and we are not aware of any reports describing PBPK model performance for BCRP‐based interactions extensively. The rosuvastatin DDIs assessed here primarily involve BCRP inhibition (capmatinib, darolutamide, fenebrutinib, fostamatinib, elbasvir/grazoprevir, and velpatasvir). In this study, we adopted BCRP IC50 obtained using membrane vesicles as is, assuming nominal concentration in the in vitro assay represent the concentration at the site of interaction. The majority of in vitro IC50 values used in the current PBPK models are within the range of previously reported values (summarized in Table S12). Absorption of inhibitor drugs was modeled with ADAM model while using available permeability‐solubility information as inputs. Inhibitor gut concentrations cannot be verified, as such data is rarely available, but models were adequately verified with plasma concentration‐time profile data and other data, such as Fa and bioavailability where possible (Supplementary Material). This PBPK approach well described rosuvastatin oral PK in the absence and presence of several BCRP and/or OATP1B inhibitors, with AUCRs in 9 of 12 cases recovered within the set criteria (R pred/obs = 0.8–1.2), and thus, showing promise in quantitative risk assessment.
Hepatic uptake is generally considered as the rate‐determining step in the hepatic clearance of drugs that predominantly rely on OATP1B‐mediated transport into the liver prior to biliary excretion via efflux pumps such as BCRP (i.e., ECCS class 3B drugs).33, 34 However, when basolateral efflux mechanism is significant, attenuation of biliary efflux by inhibitors (or genetic polymorphism) can lead to increased systemic exposure of the substrate drugs.35 Previous in vitro studies using cultured human hepatocytes provided evidence for MRP4‐mediated basolateral efflux of rosuvastatin, which indeed was quantified to be operational at a rate similar to the biliary clearance rate.19 Accordingly, we captured this mechanistic disposition component in the rosuvastatin PBPK model. Therefore, the systemic clearance of rosuvastatin may decrease by inhibiting active uptake or biliary efflux, with a much larger impact caused by simultaneous inhibition of both processes. Although several inhibitor drugs modeled via the PBPK approach could not produce relevant systemic unbound concentrations at the given dose to inhibit hepatic BCRP, a few did show a considerable inhibition of biliary efflux (Figure S4). PBPK simulations suggested that hepatic BCRP inhibition contribute significantly to the observed rosuvastatin systemic AUC increase when co‐administered with capmatinib, darolutamide, fenebrutinib, fostamatinib, and rifampicin. Notably, effect size was largest with darolutamide, wherein greater than 80% biliary efflux activity was inhibited during a large portion of the dosing interval. Although the PBPK model overpredicted rosuvastatin‐darolutamide interaction (R pred/obs ~ 2.7), a fivefold increase in rosuvastatin AUC by darolutamide in a clinical DDI study confers to the significant contribution of hepatic BCRP inhibition to this interaction.36 Given rosuvastatin apparent Fa is about 40%, large increase in its plasma exposure cannot be explained by absorption enhancement alone. In case of hepatic mechanisms, conservative static assessment indicates that darolutamide strongly inhibit hepatic BCRP with high unbound Cmax/IC50 value (~ 3.6), but has a negligible effect on OATP1B1 (R value < 1.1; Table 1). For the other inhibitors (i.e., capmatinib, fenebrutinib, and fostamatinib), hepatic BCRP inhibition contributed to only less than 30% of the change noted in rosuvastatin systemic exposure. Overall, this study indicates rosuvastatin as a suitable probe drug to assess both gut and hepatic BCRP inhibition, and that potent inhibitors of BCRP alone can produce strong DDIs with drugs like rosuvastatin.
Although OATP1B1 R values are above the regulatory cutoff (>1.1) for fenebrutinib, capmatinib, and grazoprevir/elbasvir, PBPK modeling implied negligible effect on rosuvastatin uptake clearance (Figure S3). Lack of OATP1B1 inhibition in vivo can be substantiated by clinical observations. For instance, grazoprevir do not alter clinical PK of pitavastatin, which is an OATP1B1 probe substrate.37 Similarly, in the study where fenebrutinib increased rosuvastatin AUC by ~ 150%, no change was noted in the plasma exposure of a well‐established OATP1B1 biomarker, coproporphyrin I.38 In the absence of suitable BCRP biomarkers, it is envisioned that a rosuvastatin PBPK model like the one described can be used jointly with OATP1B1/3 (e.g., coproporphyrin I) and OAT3 (e.g., pyridoxic acid) biomarkers to deconvolute the role of BCRP in driving AUCRs greater than 1.25.
Rosuvastatin renal clearance (~ 2.6 ml/min/kg) is more than 10‐fold higher than its glomerular filtration rate (~ 0.22 ml/min/kg), suggesting OAT3‐medated active secretion contribute to greater than 90% of its renal clearance.22, 39 OAT1/3 index inhibitor, probenecid (1000 mg), reduce renal clearance of rosuvastatin by almost 80%.40 Similarly, probenecid also decrease renal clearance of OAT1/3 probe substrate, furosemide, to the same degree.40 Collectively, rosuvastatin renal clearance can be used as a sensitive end point to assess OAT3 inhibition in vivo. However, inhibition of renal secretion alone has a limited effect on its plasma exposure due to the minor contribution of renal clearance to the overall clearance following oral dosing (Figure 2b). It should be noted that only ~ 5% of oral dose is recovered as intact drug in the urine due to extensive presystemic disposition (oral bioavailability ~ 20%), which suggests that the maximum AUC increase is capped at only ~ 25% (Figure 2b). Therefore, rosuvastatin AUC increase (~ 2‐fold) with perpetrators, such as gemfibrozil and probenecid, is predominantly driven by OATP1B/BCRP inhibition with minimal contribution from OAT3 inhibition. This is corroborated by our previous observations based on rosuvastatin‐probenecid DDI in the cynomolgus monkey41; and a recent report demonstrating probenecid‐induced increase in systemic exposure of an OATP1B biomarker (coproporphyrin I) in humans.42
Parent‐metabolite pairs have been considered in the PBPK modeling (as well as static analysis) for itraconazole, gemfibrozil, and darolutamide. Only in case of gemfibrozil, major circulating metabolite (1‐O‐β‐glucuronide) had a meaningful effect in recovering observed DDI.43 On the other hand, fostamatinib is an oral phosphate prodrug that is cleaved by alkaline phosphatases on the apical brush‐boarder membranes of enterocytes to produce active metabolite (R406), which eventually permeate through the enterocytes and reach systemic circulation.44 Given the complexity in modeling intestinal dephosphorylation, we assumed fostamatinib is readily converted to R406, and thus dosed R406 directly for modeling purposes. R406 inhibits BCRP with 30 times more potency than the prodrug, whereas OATP1B inhibition is insignificant for both prodrug and active moiety (R value ~ 1.01). With these considerations, the PBPK approach overpredicted rosuvastatin AUC and Cmax changes (R pred/obs ~ 2). Further studies and case examples are needed to better understand the concentration profiles of prodrug‐active species at the interaction site in the gut, which play an important role in determining the magnitude of a DDI.
CONCLUSIONS
In summary, we mechanistically evaluated rosuvastatin DDIs with a wide range of inhibitor drugs to quantify the contribution of BCRP inhibition to the overall observed effect. Based on static analysis, the risk of gut BCRP inhibition can be considered for inhibitors with a G value greater than 100. PBPK modeling and simulations suggest that potent BCRP inhibitors can modulate intestinal efflux and biliary secretion leading to increased oral absorption as well as decreased systemic clearance for drugs like rosuvastatin. Finally, this study demonstrates the utility of a mechanistic PBPK approach to predict complex drug interactions involving interplay of multiple disposition mechanisms.
DISCLAIMER
All authors were employees of Pfizer when this work was conducted.
CONFLICT OF INTEREST
The authors declared no competing interests for this work.
AUTHOR CONTRIBUTIONS
C.C., J.L., E.K., S.Y., J.G., A.D.R., M.A.W., S.L., and M.V.V. wrote the manuscript. C.C., J.L., E.K., S.Y., and M.V.V. designed the research. M.A.W., S.L., and M.W. performed the research. C.C., J.L., E.K., S.Y., and M.V.V. analyzed the data.
Supporting information
Supplementary Material
Costales C, Lin J, Kimoto E, et al. Quantitative prediction of breast cancer resistant protein mediated drug‐drug interactions using physiologically‐based pharmacokinetic modeling. CPT Pharmacometrics Syst Pharmacol. 2021;10:1018–1031. 10.1002/psp4.12672
Funding information
No funding was received for this work. The study was supported by Pfizer, Inc.
[Corrections added on 17 September 2021, after first online publication: Supporting information has been updated in this version.]
REFERENCES
- 1.Endres CJ, Hsiao P, Chung FS, Unadkat JD. The role of transporters in drug interactions. Eur J Pharm Sci. 2006;27:501‐517. [DOI] [PubMed] [Google Scholar]
- 2.Giacomini KM, Balimane PV, Cho SK, et al. International Transporter Consortium commentary on clinically important transporter polymorphisms. Clin Pharmacol Ther. 2013;94:23‐26. [DOI] [PubMed] [Google Scholar]
- 3.Lai Y, Varma MA, Feng B, et al. Impact of drug transporter pharmacogenomics on pharmacokinetic and pharmacodynamic variability ‐ considerations for drug development. Expert Opin Drug Metab Toxicol. 2012;8:723‐743. [DOI] [PubMed] [Google Scholar]
- 4.Keskitalo JE, Zolk O, Fromm MF, Kurkinen KJ, Neuvonen PJ, Niemi M. ABCG2 polymorphism markedly affects the pharmacokinetics of atorvastatin and rosuvastatin. Clin Pharmacol Ther. 2009;86:197‐203. [DOI] [PubMed] [Google Scholar]
- 5.Yamasaki Y, Ieiri I, Kusuhara H, et al. Pharmacogenetic characterization of sulfasalazine disposition based on NAT2 and ABCG2 (BCRP) gene polymorphisms in humans. Clin Pharmacol Ther. 2008;84:95‐103. [DOI] [PubMed] [Google Scholar]
- 6.Lee CA, O’Connor MA, Ritchie TK, et al. Breast cancer resistance protein (ABCG2) in clinical pharmacokinetics and drug interactions: practical recommendations for clinical victim and perpetrator drug‐drug interaction study design. Drug Metab Dispos. 2015;43:490‐509. [DOI] [PubMed] [Google Scholar]
- 7.Agency, E.M . Guideline on the Investigation of Drug Interactions. European Medicines Agency Guidline Guideline on the Investigation of Drug Interactions European Medicines Agency Guidline Committee for Human Medicinal Products (CHMP). http://www.ema.europa.eu/docs/en_GB/document_library/Scientific_guideline/2012/07/WC500129606.pdf (2012).
- 8.US Food and Drug Administration (FDA) . In vitro drug interaction studies — cytochrome P450 enzyme‐ and transporter‐mediated drug interactions. Guidance for industry. Draft Guidance Center for Drug Evaluation and Research (CDER) Jan, https://www.fda.gov/media/134582/download (2020).
- 9.Saito Y, Maekawa K, Ohno Y. Novel draft guideline for drug interaction studies in the drug development and labeling recommendations. Regulatory Science of Medical Products. 2014;4:249‐255. [Google Scholar]
- 10.Poirier A, Portmann R, Cascais AC, et al. The need for human breast cancer resistance protein substrate and inhibition evaluation in drug discovery and development: why, when, and how? Drug Metab Dispos. 2014;42:1466‐1477. [DOI] [PubMed] [Google Scholar]
- 11.Simonson SG. Rosuvastatin pharmacokinetics in heart transplant recipients administered an antirejection regimen including cyclosporine. Clin Pharmacol Ther. 2004;76:167‐177. [DOI] [PubMed] [Google Scholar]
- 12.Bergman A, Bi Y‐A, Mathialagan S, et al. Effect of hepatic organic anion‐transporting polypeptide 1B inhibition and chronic kidney disease on the pharmacokinetics of a liver‐targeted glucokinase activator: a model‐based evaluation. Clin Pharmacol Ther. 2019;106:792‐802. [DOI] [PubMed] [Google Scholar]
- 13.Varma MV, Lai Y, Feng B, Litchfield J, Goosen TC, Bergman A. Physiologically based modeling of pravastatin transporter‐mediated hepatobiliary disposition and drug‐drug interactions. Pharm Res. 2012;29:2860‐2873. [DOI] [PubMed] [Google Scholar]
- 14.Varma MV, Lai Y, Kimoto E, Goosen TC, El‐Kattan AF, Kumar V. Mechanistic modeling to predict the transporter‐and enzyme‐mediated drug‐drug interactions of repaglinide. Pharm Res. 2013;30:1188‐1199. [DOI] [PubMed] [Google Scholar]
- 15.Vildhede A, Kimoto E, Pelis RM, Rodrigues AD, Varma MVS. Quantitative proteomics and mechanistic modeling of transporter‐mediated disposition in nonalcoholic fatty liver disease. Clin Pharmacol Ther. 2020;107:1128–1137. [DOI] [PubMed] [Google Scholar]
- 16.Jamei M, Bajot F, Neuhoff S, et al. A mechanistic framework for in vitro‐in vivo extrapolation of liver membrane transporters: prediction of drug‐drug interaction between rosuvastatin and cyclosporine. Clin Pharmacokinet. 2014;53:73‐87. [DOI] [PMC free article] [PubMed] [Google Scholar]
- 17.Kimoto E, Vourvahis M, Scialis RJ, Eng H, Rodrigues AD, Varma MVS. Mechanistic evaluation of the complex drug‐drug interactions of maraviroc: contribution of cytochrome P450 3A, P‐glycoprotein and organic anion transporting polypeptide 1B1. Drug Metab Dispos. 2019;47:493‐503. [DOI] [PubMed] [Google Scholar]
- 18.Rodgers T, Rowland M. Physiologically based pharmacokinetic modelling 2: predicting the tissue distribution of acids, very weak bases, neutrals and zwitterions. J Pharm Sci. 2006;95:1238‐1257. [DOI] [PubMed] [Google Scholar]
- 19.Pfeifer ND, Yang K, Brouwer KL. Hepatic basolateral efflux contributes significantly to rosuvastatin disposition I: Characterization of basolateral versus biliary clearance using a novel protocol in sandwich‐cultured hepatocytes. J Pharmacol Exp Ther. 2013;347:727‐736. [DOI] [PMC free article] [PubMed] [Google Scholar]
- 20.Varma MV, Bi YA, Kimoto E, Lin J. Quantitative prediction of transporter‐and enzyme‐mediated clinical drug‐drug interactions of organic anion‐transporting polypeptide 1B1 substrates using a mechanistic net‐effect model. J Pharmacol Exp Ther. 2014;351:214‐223. [DOI] [PubMed] [Google Scholar]
- 21.Bi Y, Costales C, Mathialagan S, et al. Quantitative contribution of six major transporters to the hepatic uptake of drugs: "SLC‐Phenotyping" using primary human hepatocytes. J Pharmacol Exp Ther. 2019;370:72‐83. [DOI] [PubMed] [Google Scholar]
- 22.Mathialagan S, Piotrowski MA, Tess DA, Feng B, Litchfield J, Varma MV. Quantitative prediction of human renal clearance and drug‐drug interactions of organic anion transporter substrates using in vitro transport data: a relative activity factor approach. Drug Metab Dispos. 2017;45:409‐417. [DOI] [PubMed] [Google Scholar]
- 23.Chen Y, Ma F, Jones NS, et al. Physiologically‐based pharmacokinetic model‐informed drug development for fenebrutinib: understanding complex drug‐drug interactions. CPT Pharmacometrics Syst Pharmacol. 2020;9:332‐341. [DOI] [PMC free article] [PubMed] [Google Scholar]
- 24.Sane R, Cheung KWK, Kovács P, et al. Calibrating the in vitro‐in vivo correlation for OATP‐mediated drug‐drug interactions with rosuvastatin using static and PBPK models. Drug Metab Dispos. 2020;48:1264‐1270. [DOI] [PubMed] [Google Scholar]
- 25.Wagner C, Pan Y, Hsu V, et al. Predicting the effect of cytochrome P450 inhibitors on substrate drugs: analysis of physiologically based pharmacokinetic modeling submissions to the US Food and Drug Administration. Clin Pharmacokinet. 2015;54:117‐127. [DOI] [PubMed] [Google Scholar]
- 26.Martin PD, Warwick MJ, Dane AL, Brindley C, Short T. Absolute oral bioavailability of rosuvastatin in healthy white adult male volunteers. Clin Ther. 2003;25:2553‐2563. [DOI] [PubMed] [Google Scholar]
- 27.Varma MV, Lai Y, Kimoto E, Goosen TC, El‐Kattan AF, Kumar V. Mechanistic modeling to predict the transporter‐ and enzyme‐mediated drug‐drug interactions of repaglinide. Pharm Res. 2013;30:1188‐1199. [DOI] [PubMed] [Google Scholar]
- 28.Kimoto E, Bi YA, Kosa RE, Tremaine LM, Varma MVS. Hepatobiliary clearance prediction: species scaling from monkey, dog, and rat, and in vitro‐in vivo extrapolation of sandwich‐cultured human hepatocytes using 17 drugs. J Pharm Sci. 2017;106:2795‐2804. [DOI] [PubMed] [Google Scholar]
- 29.Kanukula R, Salam A, Rodgers A, Kamel B. Pharmacokinetics of rosuvastatin: a systematic review of randomised controlled trials in healthy adults. Clin Pharmacokinet. 2021;60:165‐175. [DOI] [PubMed] [Google Scholar]
- 30.Tomita Y, Maeda K, Sugiyama Y. Ethnic variability in the plasma exposures of OATP1B1 substrates such as HMG‐CoA reductase inhibitors: a kinetic consideration of its mechanism. Clin Pharmacol Ther. 2013;94:37‐51. [DOI] [PubMed] [Google Scholar]
- 31.Bowman CM, Ma F, Mao J, Chen Y. Examination of physiologically‐based pharmacokinetic models of rosuvastatin. CPT Pharmacometrics Syst Pharmacol. 2021;10:5‐17. [DOI] [PMC free article] [PubMed] [Google Scholar]
- 32.Wang Q, Zheng M, Leil T. Investigating transporter‐mediated drug‐drug interactions using a physiologically based pharmacokinetic model of rosuvastatin. CPT Pharmacometrics Syst Pharmacol. 2017;6:228‐238. [DOI] [PMC free article] [PubMed] [Google Scholar]
- 33.Varma MV, El‐Kattan AF, Feng B, et al. Extended Clearance Classification System (ECCS) informed approach for evaluating investigational drugs as substrates of drug transporters. Clin Pharmacol Ther. 2017;102:33‐36. [DOI] [PubMed] [Google Scholar]
- 34.Varma MV, Steyn SJ, Allerton C, El‐Kattan AF. Predicting clearance mechanism in drug discovery: extended clearance classification system (ECCS). Pharm Res. 2015;32:3785‐3802. [DOI] [PubMed] [Google Scholar]
- 35.Patilea‐Vrana GI, Unadkat JD. When does the rate‐determining step in the hepatic clearance of a drug switch from sinusoidal uptake to all hepatobiliary clearances? Implications for predicting drug‐drug interactions. Drug Metab Dispos. 2018;46:1487‐1496. [DOI] [PMC free article] [PubMed] [Google Scholar]
- 36.Zurth C, Koskinen M, Fricke R, et al. Drug‐drug interaction potential of darolutamide. In vitro and clinical studies. Eur J Drug Metab Pharmacokinet. 2019;44:747‐759. [DOI] [PMC free article] [PubMed] [Google Scholar]
- 37.Caro L, Prueksaritanont T, Fandozzi CM, et al. Evaluation of pharmacokinetic drug interactions of the direct‐acting antiviral agents elbasvir and grazoprevir with pitavastatin, rosuvastatin, pravastatin, and atorvastatin in healthy adults. Clin Drug Investig. 2021;41:133‐147. [DOI] [PubMed] [Google Scholar]
- 38.Jones NS, Yoshida K, Salphati L, Kenny JR, Durk MR, Chinn LW. Complex DDI by fenebrutinib and the use of transporter endogenous biomarkers to elucidate the mechanism of DDI. Clin Pharmacol Ther. 2020;107:269‐277. [DOI] [PMC free article] [PubMed] [Google Scholar]
- 39.Windass AS, Lowes S, Wang Y, Brown CD. The contribution of organic anion transporters OAT1 and OAT3 to the renal uptake of rosuvastatin. J Pharmacol Exp Ther. 2007;322:1221‐1227. [DOI] [PubMed] [Google Scholar]
- 40.Wiebe ST, Giessmann T, Hohl K, et al. Validation of a drug transporter probe cocktail using the prototypical inhibitors rifampin, probenecid, verapamil, and cimetidine. Clin Pharmacokinet. 2020;59:1627‐1639. [DOI] [PMC free article] [PubMed] [Google Scholar]
- 41.Kosa RE, Lazzaro S, Bi Y‐A, et al. Simultaneous assessment of transporter‐mediated drug‐drug interactions using a probe drug cocktail in cynomolgus monkey. Drug Metab Dispos. 2018;46:1179‐1189. [DOI] [PubMed] [Google Scholar]
- 42.Zhang Y, Holenarsipur VK, Kandoussi H, et al. Detection of weak organic anion‐transporting polypeptide 1b inhibition by probenecid with plasma‐based coproporphyrin in humans. Drug Metab Dispos. 2020;48:841‐848. [DOI] [PubMed] [Google Scholar]
- 43.Varma MV, Lin J, Bi YA, Kimoto E, Rodrigues AD. Quantitative rationalization of gemfibrozil drug interactions: consideration of transporters‐enzyme interplay and the role of circulating metabolite gemfibrozil 1‐O‐β‐glucuronide. Drug Metab Dispos, 2015;115: 64303. [DOI] [PubMed] [Google Scholar]
- 44.Sweeny DJ, Li W, Clough J, et al. Metabolism of fostamatinib, the oral methylene phosphate prodrug of the spleen tyrosine kinase inhibitor R406 in humans: contribution of hepatic and gut bacterial processes to the overall biotransformation. Drug Metab Dispos. 2010;38:1166‐1176. [DOI] [PubMed] [Google Scholar]
- 45.Amundsen R, Christensen H, Zabihyan B, Asberg A. Cyclosporine A, but not tacrolimus, shows relevant inhibition of organic anion‐transporting protein 1B1‐mediated transport of atorvastatin. Drug Metab Dispos. 2010;38:1499‐1504. [DOI] [PubMed] [Google Scholar]
- 46.Furihata T, Matsumoto S, Fu Z, et al. Different interaction profiles of direct‐acting anti‐hepatitis C virus agents with human organic anion transporting polypeptides. Antimicrob Agents Chemother. 2014;58:4555‐4564. [DOI] [PMC free article] [PubMed] [Google Scholar]
- 47.Kulmatycki K, Hanna I, Meyers D, et al. Evaluation of a potential transporter‐mediated drug interaction between rosuvastatin and pradigastat, a novel DGAT‐1 inhibitor. Int J Clin Pharmacol Ther. 2015;53:345‐355. [DOI] [PubMed] [Google Scholar]
- 48.Wang C, Huo X, Wang C, et al. Organic anion‐transporting polypeptide and efflux transporter‐mediated hepatic uptake and biliary excretion of cilostazol and its metabolites in rats and humans. J Pharm Sci. 2017;106:2515‐2523. [DOI] [PubMed] [Google Scholar]
- 49.Mogalian E, German P, Kearney BP, et al. Use of multiple probes to assess transporter‐ and cytochrome P450‐mediated drug‐drug interaction potential of the pangenotypic HCV NS5A inhibitor velpatasvir. Clin Pharmacokinet. 2016;55:605‐613. [DOI] [PubMed] [Google Scholar]
- 50.Huang L, Wang Y, Grimm S. ATP‐dependent transport of rosuvastatin in membrane vesicles expressing breast cancer resistance protein. Drug Metab Dispos. 2006;34:738‐742. [DOI] [PubMed] [Google Scholar]
- 51.Kimoto E, Bi Y‐A, Kosa RE, Tremaine LM, Varma MV. Hepatobiliary clearance prediction: species scaling from monkey, dog and rat, and in vitro‐in vivo extrapolation of sandwich cultured human hepatocytes using 17 drugs. J Pharm Sci. 2017;106:2795‐2804. [DOI] [PubMed] [Google Scholar]
Associated Data
This section collects any data citations, data availability statements, or supplementary materials included in this article.
Supplementary Materials
Supplementary Material