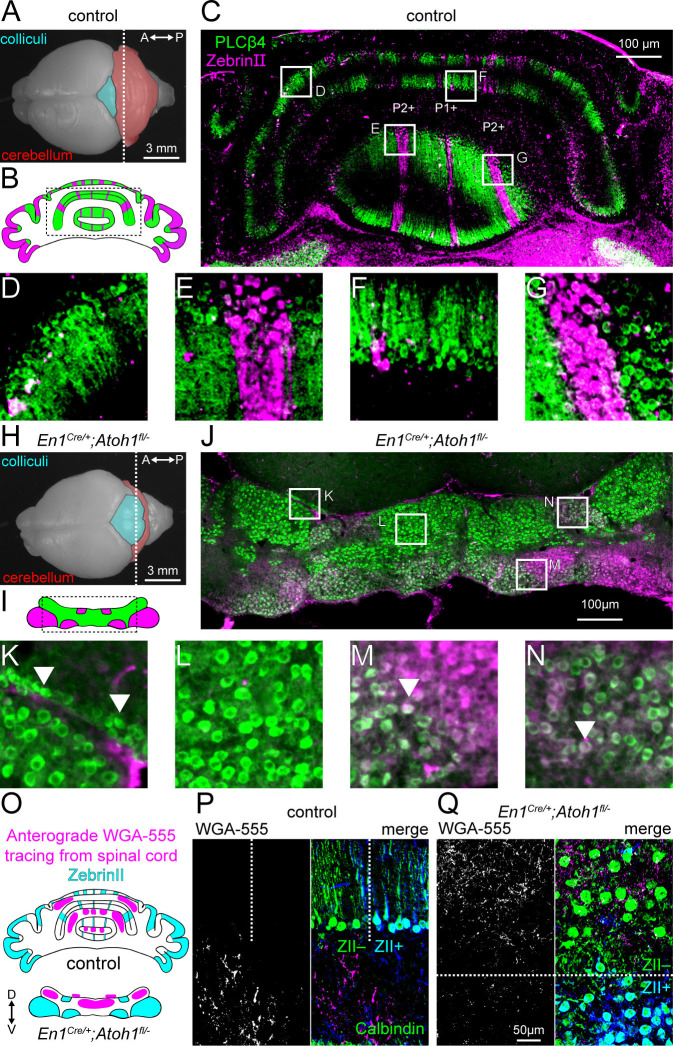
Figure 2. Atoh1 lineage neurons are necessary for the formation of sharp zonal patterns of Purkinje cell sub-types and spinal cord mossy fiber projections.
(A) Top view of a control P14 brain. Dotted line shows the position of the schematic in (B) and where the section in (C) was taken from. (B) Schematic of Purkinje cell ZebrinII (pink) and PLCβ4 (green) patterns in a control section illustrating the striped patterns at P14. (C) Staining of ZebrinII (pink) and PLCβ4 (green). (D-G) Higher power magnification images of insets in (C, H). Top view of En1Cre/+;Atoh1fl/- P14 brain. Dotted line shows position of schematic in (I) and where the section in (J) was taken from. (I) Schematic of Purkinje cell ZebrinII (pink) and PLCβ4 (green) patterns in En1Cre/+;Atoh1fl/- mice showing a clustered pattern at P14. (J) Staining of ZebrinII (pink) and PLCβ4 (green). (K-N) Higher power magnification images of insets in (J) Arrowhead in K: over-migrated Purkinje cells in the inferior colliculus. Arrowhead in M and N: Purkinje cells co-expressing ZebrinII and PLCβ4. (O) Schematic of ZebrinII staining pattern and WGA-Alexa 555 tracing form the spinal cord to the cerebellum in control and En1Cre/+;Atoh1fl/- mice. (P) Representative images of WGA-Alexa 555+ terminals (left: gray; right: pink) in the cerebellum of a control mouse. Dotted lines represent the border between ZebrinII+ (cyan) and ZebrinII- regions. Purkinje cell stained with Calbindin (green) ZebrinII is shown in dark blue. The overlap between Calbindin and ZebrinII is shown cyan. (Q) Representative images of WGA-Alexa 555+ terminals (left: gray; right: pink) in the cerebellum of an En1Cre/+;Atoh1fl/- mouse. Dotted lines represent the border between ZebrinII+ (cyan) and ZebrinII- regions. Purkinje cell stained with Calbindin (green). All images are representative of N=3 brains per genotype.

