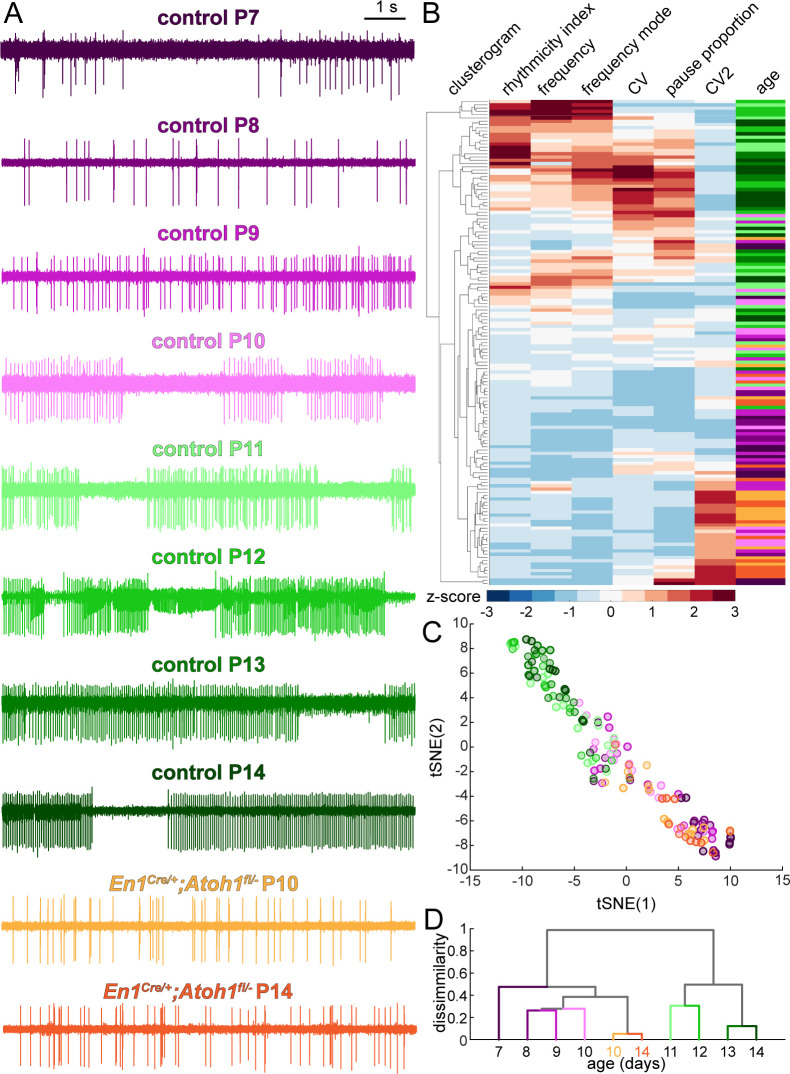
Figure 6. Purkinje cell simple spike firing patterns undergo a developmental transformation between P7-P10 and P11-P14 that does not occur in En1Cre/+;Atoh1fl/- mice.
(A) Representative electrophysiological recordings (each 10 s long) from Purkinje cells recorded in P7-P14 control mice and P10 and P14 En1Cre/+;Atoh1fl/- mice. In some recordings, we observed action potentials from a second cells in the background, typically observed as spikes with a smaller amplitude (for example, in the representative P12 trace). We only include the large amplitude spikes of the single predominant cell in our analysis. (B) Unbiased clusterogram based on the firing parameters summarized in Figure 5. Each row represents the Z-scored firing parameters of a single neuron. The rows were retroactively color-coded according to the colors in panel A. (C) tSNE analysis of the firing patterns summarized in Figure 5. (D) Unbiased cluster analysis on average firing patterns of Purkinje cells recorded in P7-P14 control mice and P10 and P14 En1Cre/+;Atoh1fl/- mice.


