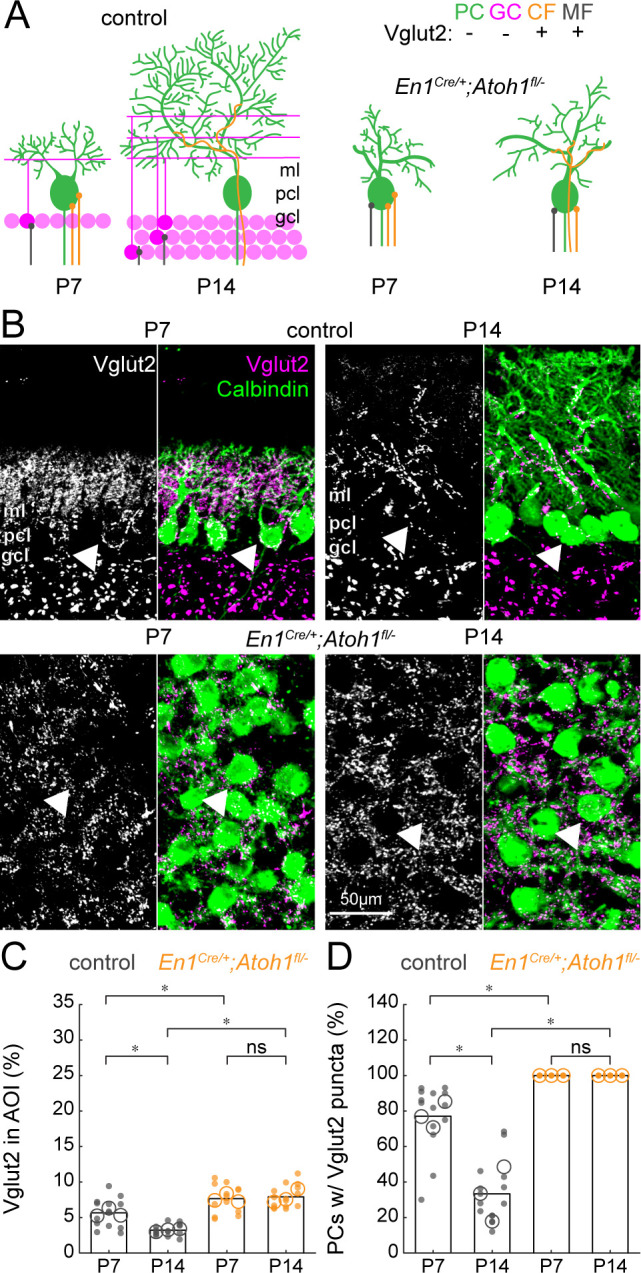
Figure 7. The density of Vglut2 synapses onto Purkinje cells decreases between P7 and P14 in control mice and is higher in En1Cre/+;Atoh1fl/- mutants.

(A) Schematic of Purkinje cell microcircuit in control (left) and En1Cre/+;Atoh1fl/- mice (right) at P7 and P14. Vglut2 is expressed in climbing fibers (orange) and some mossy fibers (gray) but not in Purkinje cells (green) or granule cell (pink) terminals at P14, but in some granule cells at P7 (Miyazaki et al., 2003). Abbreviations: ml = molecular layer; pcl = Purkinje cell layer; gcl = granule cell layer. (B) Representative images showing the density of Vglut2+ profiles in the cerebella of control (top) and En1Cre/+;Atoh1fl/- mice (bottom) at P7 and P14. Left panels are gray-scale images of the Vglut1 signal and right panels are merged to show the Vglut2 (pink) and Calbindin (green) signals. Arrowheads point to Purkinje cells that have direct Vglut2 synapses on their cell bodies. (C) Density of Vglut2 synapses as a percentage of the area of interest (AOI; AOI comprises the molecular and Purkinje cell layer in cerebella from control animals and the area occupied by Purkinje cells in the cerebella of En1Cre/+;Atoh1fl/- mice). (D) Number of Purkinje cells with direct Vglut2+ puncta on their cell bodies. Significance in C and D was established based on the average of each mouse (N=3 mice per genotype, large circles; n=3–5 tissue sections, small dots) using a two-way ANOVA (genotype*age) followed by a Tukey Kramer post-hoc analysis. *p=0.05. The raw data and specific p-values for all the comparisons are presented in Figure 7—source data 1.
