

Abstract
Objective
The benefit of Se supplementation in rheumatoid arthritis (RA) has been tested in clinical trials, but results remain inconclusive. The objective of this study was to specifically investigate the potential benefit of supranutritional Se by examining human samples from an area with supranutritional Se intake and testing a mouse model of RA.
Methods
Peripheral blood mononuclear cells (PBMCs) from RA patients (N = 57) and healthy controls (HC, N = 71) from an area of supranutritional Se intake (Enshi, Hubei, China) were analysed by flow cytometry. Serum cytokine and Se levels were measured by cytometric beads array (CBA) and inductively coupled plasma mass spectrometry (ICP‐MS), respectively. With sufficient or supranutritional selenium intake, mice were induced with collagen‐induced arthritis (CIA) and examined for disease activity and immunopathology. The influence of Se supplementation in the generation of RANKL‐expressing osteoclastogenic CD4+ T cells was investigated by in vitro assays.
Results
In Enshi city, HC showed the above‐normal concentrations of serum Se concentrations while RA patients were enriched in the normal range (70–150 ng mL−1) or below. RA patients with higher Se levels demonstrated milder disease and lower levels of C‐reactive protein, IL‐6, RANKL and Th17 cells. In the mouse CIA model, supranutritional Se supplementation delayed disease onset, ameliorated joint pathology and reduced CD4+CD44+RANKL+ T cells. Se supplementation could suppress RANKL expression in cultured mouse Th17 cells.
Conclusion
Supranutritional Se suppresses RANKL‐expressing osteoclastogenic CD4+ T cells and could be beneficial to RA, which warrants formal testing in randomised clinical trials.
Keywords: RANKL, rheumatoid arthritis, selenium, Th17 cells
In this study, we found that supranutritional selenium (Se) was associated with improved disease activities in patients with rheumatoid arthritis and also ameliorated collagen‐induced arthritis in mice. Se attenuated the production of reactive oxygen species (ROS) and thus suppressed ROS‐mediated induction of RANKL expression in activated CD4+ T cells.
Introduction
An essential trace element for human health, selenium (Se) plays a critical role in cellular biochemical processes and physiological homeostasis, shown by the association between Se deficiency and the increased risk of mortality, poor immune function, cognitive decline, cardiomyopathy and osteoarthropathy.1 The most studied function of Se lies in its incorporation into selenoproteins in which many act as antioxidant enzymes, such as glutathione peroxidases (GPXs), which protect cells against damages caused by reactive oxygen species (ROS).1, 2 More recently, selenoenzyme GPX4 was discovered for its essential role of protecting cells from ferroptosis, a non‐apoptosis type of regulated cell death, and is induced by iron‐dependent accumulation of lipid peroxides by reducing lipid peroxidation.3, 4, 5
Se supplementation has been conceived to mitigate oxidative stress and cell death to resolve inflammation and improve tissue homeostasis. For instance, Se supplementation, either systemically or locally delivered into the central nervous system, was tested in experimental mouse models for brain trauma, which showed the inhibition of apoptosis or ferroptosis in neurons and improved functional recovery.6, 7 In lupus‐prone mice, Se supplementation suppressed autoantibody production and ameliorated disease.8 The benefit of Se supplementation has also been tested in clinical studies. The blinded, placebo‐controlled, prospective study demonstrated that Se supplementation decreased thyroid peroxidase antibodies and improved inflammatory activities in patients with autoimmune thyroiditis.9 Se supplementation also improved the general conditions of the patients in radiotherapy with improved quality of life and reduced side effects.10
Notably, Se is essential for bone health. Bone contains a large amount of Se and expresses several selenoproteins. Se deficiency because of insufficient dietary intake causes Kaschin–Beck disease, a degenerative osteoarticular disorder.11, 12 The previous investigation suggested that Se regulates bone metabolism through antioxidant protection, cell proliferation and survival, as well as immune surveillance, but the exact mechanism needs to be elucidated.13 Rheumatoid arthritis (RA) is a chronic autoimmune disease with aberrantly activated T and B cells and other innate effector cells infiltrating in joints, promoting tissue inflammation and resulting in cartilage and bone damage. As one of the most common autoimmune immune diseases around the world, RA affects ˜1% of the population worldwide and is associated with substantial morbidity and mortality.14, 15 Given its regulation of bone metabolism and antioxidant and anti‐inflammatory effect, Se supplementation might benefit RA. However, the results are inconsistent, presumably because of the variation of baseline Se levels and the lack of rigorousness of clinical trial designs.16 The effect of Se supplementation in RA could be affected by the baseline and dose of Se. In this study, we took a novel approach to investigate the potential benefit of supranutritional Se supplementation in RA by examining RA patients living in the area with the supranutritional Se intake. Located in the southwest of Hubei province of China, Enshi County is well documented for high levels of Se in soils and water. Based on recent studies of the food Se concentrations, the residents at Enshi were reported to have an estimated daily Se intake of 550 ± 307 μg,17 which is higher than the recommended upper level of daily Se intake of 400 μg.
In this study, we found above‐normal Se levels in HC and normal levels in RA patients from Enshi country. In RA patients, higher Se levels were associated with reduced disease activity and lower production of osteoclastogenic cytokine receptor activator of nuclear factor kappa‐Β ligand (RANKL). Similar results were observed in the mouse model of collagen‐induced arthritis (CIA) whereby supranutritional Se supplementation suppressed RANKL‐expressing CD4+ T cells and ameliorated the disease activity in mice. Mechanistically, Se supplementation restrained ROS to suppress the expression of RANKL but not IL‐17 in mouse CD4+ T cells, suggesting an unappreciated disparity between the regulation of IL‐17 and RANKL in osteoclastogenic CD4+ T cells. Our study thus supports the notion that supranutritional Se inhibits RANKL‐producing osteoclastogenic helper T cells and might improve RA. This should be formally tested in randomised clinical trials in the future. For the design of the clinical trial, the baseline of Se levels and the dose of Se supplementation should be taken into acount.
Results
Se levels in RA patients with supranutritional Se intake negatively associate with disease activities and the osteoclastogenic CD4+ T cells
In 2019, we recruited treatment‐naïve RA patients (N = 57) and age‐ and sex‐matched health controls (HC) (N = 71) from Minda Hospital of Hubei Minzu University, located at Enshi County of Hubei Province, China. Serum Se levels were measured by inductively coupled plasma mass spectrometry (ICP‐MS). RA patients had a median serum Se concentration of 103.5 ng mL−1, within the normal reference range (70–150 ng mL−1).18, 19 In agreement with reported supranutritional Se in this area, HC had above‐normal serum Se concentration (median, 166.9 ng mL−1) and showed ˜50% increase than those in RA patients (P‐value < 0.0001) (Figure 1a). The higher Se levels in HC than RA patients were consistent in both females (median: HC/163.9 vs RA/115.0 ng mL−1, P‐value < 0.001) and males (median: HC/180.5 vs RA/86.3 ng mL−1, P‐value < 0.001), with a larger difference in males (Figure 1b and c). When HC and RA subjects were pooled and divided into low (< 70 ng mL−1), normal (70–150 ng mL−1) and high (> 150 ng mL−1) Se groups, RA subjects were largely excluded from high Se group (4/52, 7.7%) but enriched in low and normal Se group (9/9, 100%; 44/67, 65.7%) (P‐value < 0.001) (Figure 1d). The negative association between high Se levels and RA suggested a potential involvement of Se metabolism or function in the development of RA.
Figure 1.
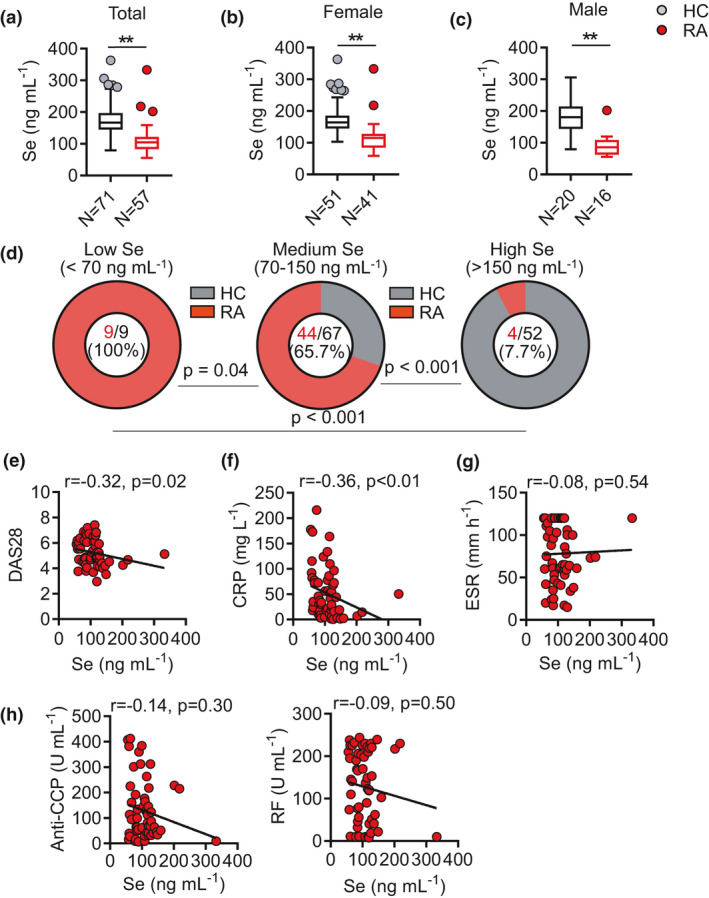
Supranutritional serum Se levels negatively correlate with disease activity of patients with RA. (a–c) Comparison of serum Se level in patients with rheumatoid arthritis (RA, N = 57) and healthy controls (HC, N = 71) (a), female RA patients (N = 41) and HCs (N = 50) (b), male RA patients (N = 16) and HCs (N = 21) (c). (d) Comparison of RA frequencies among low (< 70 ng mL−1), normal (70‐150 ng mL−1) and high (> 150 ng mL−1) Se groups in pooled HC and RA. (e–g) Correlation between serum Se level and clinical parameters DAS28 (e), CRP (f), ESR (g) of RA patients. (h) Correlation between serum Se level and anti‐CCP and RF of RA patients. Data are shown as Median and analysed by the Mann–Whitney U‐test (a–c). Frequency comparison was calculated by a chi‐square test (d). The correlations were determined by using Spearman’s correlation coefficient (e–h). * P‐value < 0.05, ** P‐value < 0.01.
We next examined the relationship between Se levels and disease activities in RA patients. Se levels were negatively correlated with DAS28 (Disease Activity Score including a 28‐joint count) (r = −0.32, P‐value = 0.02, Figure 1e) and C‐reactive protein (CRP) (r = −0.36, P‐value < 0.01, Figure 1f), but not with erythrocyte sedimentation rate (ESR) (Figure 1g). Although Se levels showed trends of the negative association with the titres for anti‐cyclic citrullinated peptide (CCP) autoantibodies or rheumatoid factor (RF), they did not reach a statistical significance (Figure 1h). Collectively, such results suggest a possible association between high Se levels and reduced incidence of RA and milder disease activities in RA patients.
T cells, especially CD4+ T cells, have been long regarded as the important regulators in the pathogenesis of RA.20, 21, 22 We next examined whether Se levels might influence the functional differentiation of CD4+ T‐cell differentiation. Peripheral blood mononuclear cells (PBMCs) from RA patients were collected to analyse major CD4+ T‐cell functional subsets including regulatory T (Treg) (CD25highCD127dim), Th1 (CD45RA−CXCR3+CCR6−), Th2 (CD45RA−CXCR3−CCR6−) and Th17 (CD45RA−CXCR3−CCR6+) cells by flow cytometry23 (Figure 2a). Se levels appeared not influencing the frequencies of Treg cells in total CD4+ T cells (Figure 2b) while a negative association with Th17 frequencies (r = −0.33, P‐value = 0.01) and a borderline positive association with Th1 frequencies (r = 0.27, P‐value = 0.04) were noted (Figure 2c).
Figure 2.
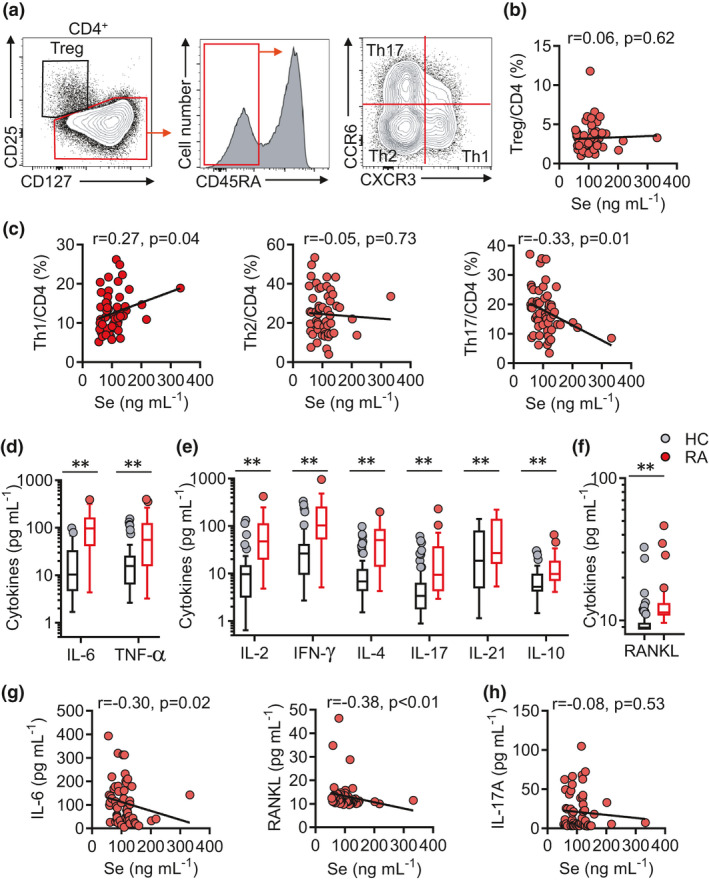
Supranutritional selenium levels correlate with declined serum IL‐6, RANKL and Th17 cells in patients with RA. (a) Representative FASC plots showing CD4 T‐cell subsets (Treg cells (CD4+CD127−CD25+), Th1 cells (CD4+CD45RA−CCR6−CXCR3+), Th2 cells (CD4+CD45RA−CCR6−CXCR3−) and Th17 cells (CD4+CD45RA−CCR6+CXCR3−)). (b) Correlation between serum Se levels and Treg/CD4 in RA patients. (c) Correlation between serum selenium level and the frequencies of Treg cells, Th1 cells, Th2 cells and Th17 cells in RA patients. (d–f) Comparison of IL‐6 and TNF‐α (D), IL‐2, IFN‐γ, IL‐4, IL‐17, IL‐21 and IL‐10 (e), RANKL levels (f) in HCs (N = 71) and RA patients (N = 57). (g, h) Correlation between serum Se levels and IL‐6, RANKL (g), IL‐17 in RA patients. (h) Correlation between serum Se levels and IL‐17 in RA patients. Data are shown as median and analysed by the Mann–Whitney U‐test (d–f). Correlations were determined by using Spearman’s correlation coefficient (b, c, g, h). * P‐value < 0.05, ** P‐value < 0.01.
Pro‐inflammatory and osteoclastogenic cytokines play key roles in driving the development of RA, osteoarthritis and osteoporosis. Biologics that inhibit TNF‐α or IL‐6 are broadly administered to treat RA while RANKL inhibition shows benefits in osteoporosis.14, 15, 24, 25, 26, 27 The serum concentrations of pro‐inflammatory cytokines TNF‐α and IL‐6 (Figure 2d), effector and regulatory T‐cell cytokines (Figure 2e) and osteoclastogenic cytokine RANKL (Figure 2f) were quantified and demonstrated a ubiquitous elevation in RA patients than HC, suggesting systemic immune activation in RA. Nevertheless, among these cytokines, only IL‐6 (r = −0.30, P‐value = 0.02) and RANKL (r = −0.38, P‐value < 0.01) were found to be negatively associated with Se levels (Figure 2g). Th17 functions as the osteoclastogenic helper T‐cell subset that critically mediates bone destruction.14, 15, 27, 28 Se levels were negatively associated with Th17 frequencies (Figure 2c), but there was no significant association between Se levels and IL‐17 concentrations (Figure 2h), suggesting Se might be more important for the regulation of RANKL‐expressing osteoclastogenic helper T cells rather than Th17 cells per se. Taken together, results from this unique cohort of RA patients from the region with supranutritional Se intake suggested an association between supranutritional Se levels and less severe disease of RA with reduced production of RANKL.
Se supplementation alleviates the severity of collagen‐induced arthritis in mice
The association between supranutritional Se levels and less severe disease of RA with reduced production of RANKL in RA patients could not distinguish whether supranutritional Se was the cause or the consequence of ameliorated RA. We decided to parse the relationship using a pre‐clinical mouse model for RA. Collagen‐induced arthritis (CIA) in DBA/1J mice is the most widely applied model that resembles many features of RA in human patients.29, 30 We first measured serum Se concentrations in DBA mice with a normal chew diet and found that CIA did not induce significant changes in Se levels (Figure 3a), showing a normal and sufficient status of Se (400–500 ng mL−1) as reported before.31 Since the Se levels were found not to be influenced by CIA, we next tested whether Se levels affected CIA. When mice underwent CIA and were given selenomethionine (Se‐Met) in drinking water (CIA+Se) from the beginning of the model induction (day 0). At the end of the CIA model (day 45), Se supplementation increased serum Se levels by ˜20% than control mice (CIA) (Figure 3a). The Se supplementation did not result in any noticeable change in body weight (Figure 3b). To examine whether Se supplementation affected the development of arthritis, we compared the disease onset and severity between CIA and CIA+Se groups. Compared to the CIA group showing 100% disease onset (5/5) at day 33 post‐induction, the CIA+Se group only showed an incidence of 50% (3/6) at day 33 (Figure 3c). In line with the delayed onset of disease, Se supplementation also improved the disease severity, displaying a significant reduction of disease activities (P‐value < 0.01) (Figure 3d) and less swollen hind paws (P‐value < 0.05) (Figure 3e). Histopathological analysis of knee joints and hind paws revealed that mice in the CIA+Se group demonstrated reduced synovitis and fewer leukocyte infiltration and ameliorated cartilage degradation compared to the control CIA mice (Figure 3f and g). Altogether, these results demonstrate that Se supplementation ameliorated CIA in mice.
Figure 3.
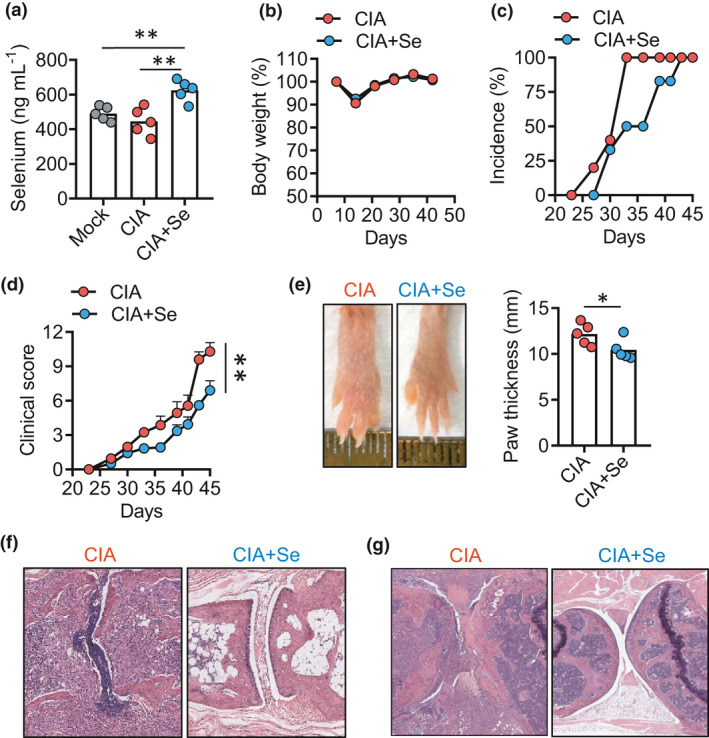
Se supplementation ameliorates collagen‐induced arthritis in mice. (a) Serum selenium concentration in DBA (grey circle), DBA mice with CIA control (CIA, red circle) and selenium supplementation (CIA+Se, blue circle). (b–g) Kinetics of body weight changes (b), arthritis incidence (c), clinical score (d), hinder paw thickness (e) and histopathology (f), knee joints histopathology (f, g) in mice with CIA in control and +Se groups. Data are shown for individual (dots, n = 5) and mean (bars) values and analysed by the Kaplan–Meier curves by the log‐rank test (d), and the Mann–Whitney U‐test (a, e) unpaired t‐test. * P‐value < 0.05, ** P‐value < 0.01. Results are representative of three independent experiments.
CD4+ T cells play a dominant role in driving the development of CIA in mice.30 We analysed major CD4+ T‐cell subsets including CD44−CD62L+ naïve T (T naïve), CD44+C62L− effector T (Teff) and CD4+Foxp3+ Treg cells in spleens (SPL) and inguinal lymph nodes (LN) by flow cytometry. Se supplementation reduced the activation of CD4+ T cells, showing an increase in T naïve cells and a decrease in Teff cells in spleens (P‐value < 0.01) with the same trends in lymph nodes but not reaching statistical significance (Figure 4a). The frequencies of Foxp3+ Treg cells in CD4+ T cells were comparable between CIA and CIA+Se groups (Figure 4b). Se supplementation did not change the function of CD4+ T cells for the expression of effector cytokines TNF‐α, IFN‐γ and IL‐17 that are critically involved in RA pathogenesis (Figure 4c). In contrast, the expression of RANKL on CD4+ T cells in spleens and lymph nodes was significantly suppressed by 30–50% by Se supplementation (P‐value < 0.05) (Figure 4d). These results demonstrate that Se supplementation selectively inhibits RANKL expression, but not TNF‐α, IFN‐γ and IL‐17 in activated CD4+ T cells from mice with CIA.
Figure 4.
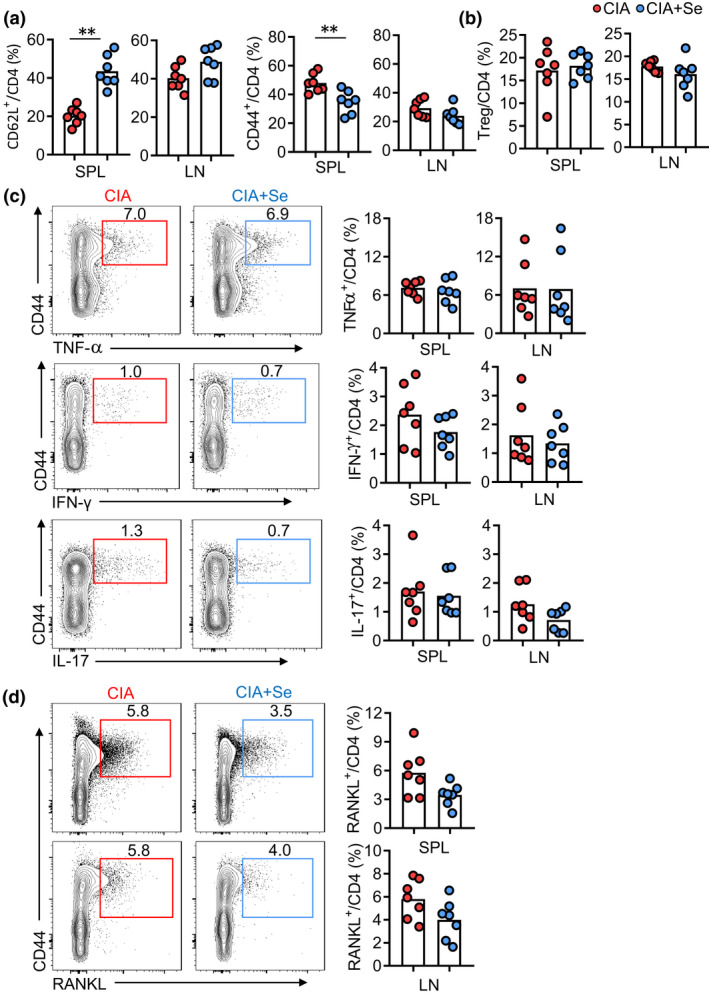
The effect of Se supplementation on CD4+ T‐cell activation and effector differentiation in CIA mice. (a, b) Comparison of naïve T cells (CD4+CD44−CD62L+) and effector CD4+ T cells (Teff cells, CD4+CD44+CD62L−) (a) and Treg cells (CD4+Foxp3+) (b) in inguinal lymph nodes (LN) and spleens (SPL) of mice with CIA in control (red dots) and +Se groups (blue dots). (c, d) Representative FASC plots and statistics showing the frequencies of CD4+CD44+TNF‐α+ cells, CD4+CD44+IFN‐γ+ cells, CD4+CD44+IL‐17+ cells (c) and CD4+CD44+RANKL+ cells (d) in SPs and LNs of CIA (red dots) and CIA plus selenium (blue dots). Data are shown for individual (n = 7) and mean (bars) values and analysed by the Mann–Whitney U‐test. * P‐value < 0.05, ** P‐value < 0.01. Results are representative of three independent experiments.
Se supplementation suppresses reactive oxygen species (ROS)‐induced RANKL but not IL‐17 expression in Th17 cells
Although Se supplementation showed the effect to inhibit the generation of RANKL‐producing osteoclastogenic CD4+ T cells in mice with CIA, it remains unknown whether the action of Se supplementation is autonomous to CD4+ T cells. We then tested the effect of Se supplementation in in vitro‐polarised Th17 cells. We chose two concentrations of Se‐Met (1.25 and 5 µM) which are considered as physiological levels and not affecting cellular viability.32 Naïve CD4+ T cells from wild‐type (WT) mice were purified and activated with anti‐CD3/CD28 in a Th17‐polarised condition with IL‐6, TGF‐β, anti‐IFN‐γ and anti‐IL‐4 for 3 days.33 Using the carboxyfluorescein succinimidyl ester (CFSE) labelling to measure cellular proliferation, Se‐Met treatment modestly modulated CD4+ T‐cell proliferation, showing a slight increase in the 3rd division while a reduction in the 5th division (P‐value < 0.01) (Figure 5a). Se‐Met treatment slightly enhanced the viability of cultured cells and significantly reduced Annexin V+PI+ dead cells (Figure 5b). These results suggest the concentrations of Se‐Met used did not drastically change the proliferation or survival of T cells, thus suitable in testing the effect on the effector differentiation of CD4+ T cells.
Figure 5.
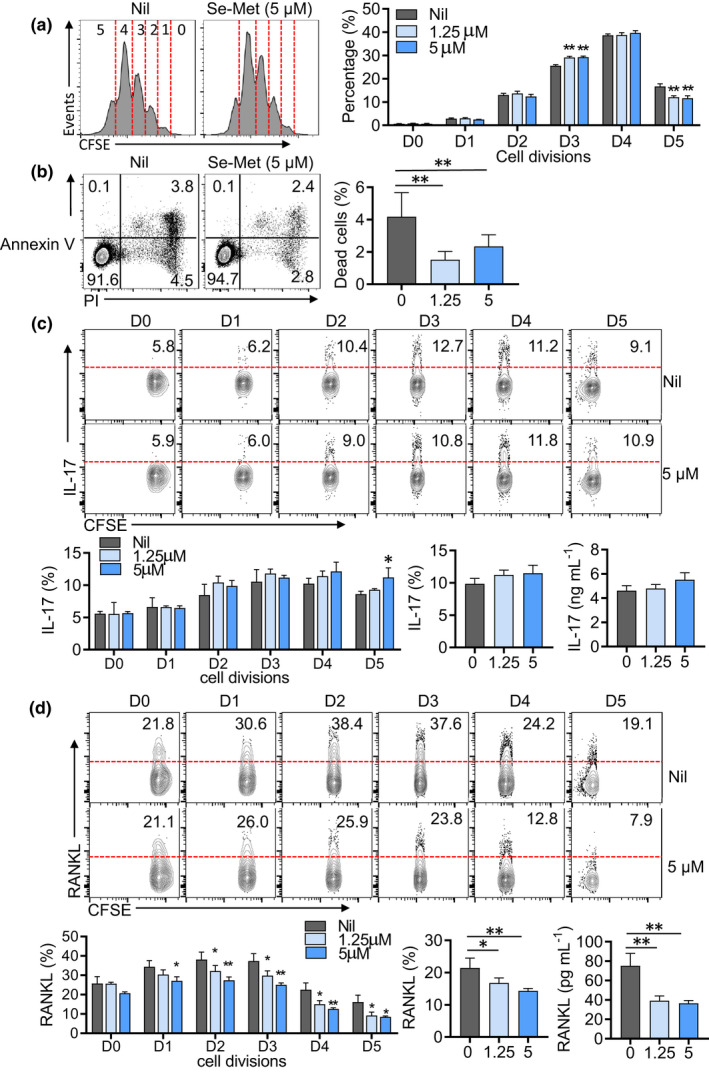
Se supplementation differentially regulates IL‐17 and RANKL expression in polarised CD4+ T cells. (a) CFSE‐labelled proliferation assay of wild‐type naïve CD4+ T cells cultured under a Th17‐polariised condition plus Se‐Met for 72 h. (b) Representative FASC plots and statistics showing the percentages of apoptotic cells (Annexin V+PI+ plus Annexin V+PI−) of wild‐type naïve CD4+ T cells cultured under Th17‐induction conditions with or without Se‐Met for 72 h. (c, d) CFSE‐labelled proliferation assay of IL‐17 (c) and RANKL (d) ratios in each generation in WT naïve CD4+ T cells under Th17 cell‐induction conditions, with or without Se‐Met. Data are shown for individual (n = 4) and mean (bars) values and analysed by the Mann–Whitney U‐test (b) and the ANOVA test (a, c, d). * P‐value < 0.05, ** P‐value < 0.01. Results are representative of three independent experiments.
Notably, IL‐17 and RANKL expressions were not overlapped in in vitro‐polarised Th17 cells (Figure 5c), which were also confirmed in effector CD44+CD4+ T cells from mice with CIA (Figure 5d). The divergence between IL‐17 and RANKL‐expressing populations suggests the distinct regulation of these two effector molecules in CD4+ T cells. We then examined how Se‐Met treatment affected the expression of IL‐17 or RANKL. Se‐Met treatment showed no inhibition of IL‐17 production (Figure 5c). As compared to the slow induction of IL‐17 production in cells after the 2nd division, the induction of RANKL reached the peak on cells with the 2nd and 3rd divisions, followed by prominent declines in cells with the 4th or 5th divisions. Se‐Met treatment suppressed RANKL expression on cells of almost every division. Overall, the surface expression of RANKL was inhibited by about 30% while the soluble RANKL levels in culture supernatants were reduced by about 50% with Se‐Met treatment (Figure 5d).
The regulation of RANKL expression is not fully understood. A growing number of studies suggest that canonical Wnt signalling through the downstream transcription factor T‐cell factor 1 (TCF1) to suppress the transcription of the Tnfsf11 gene that encodes RANKL.34, 35, 36 We compared WT and TCF1‐deficient (Tcf7‐KO) CD4+ T cells cultured under a Th17 polarisation condition. TCF1‐deficient showed enhanced expression of both IL‐17 and RANKL compared with WT cells (Figure 6a and b). Se‐Met treatment was able to suppress RANKL expression on both WT and TCF1‐deficient CD4+ T cells comparably (Figure 6a and b), suggesting Se regulates RANKL expression in a TCF1‐independent manner.
Figure 6.
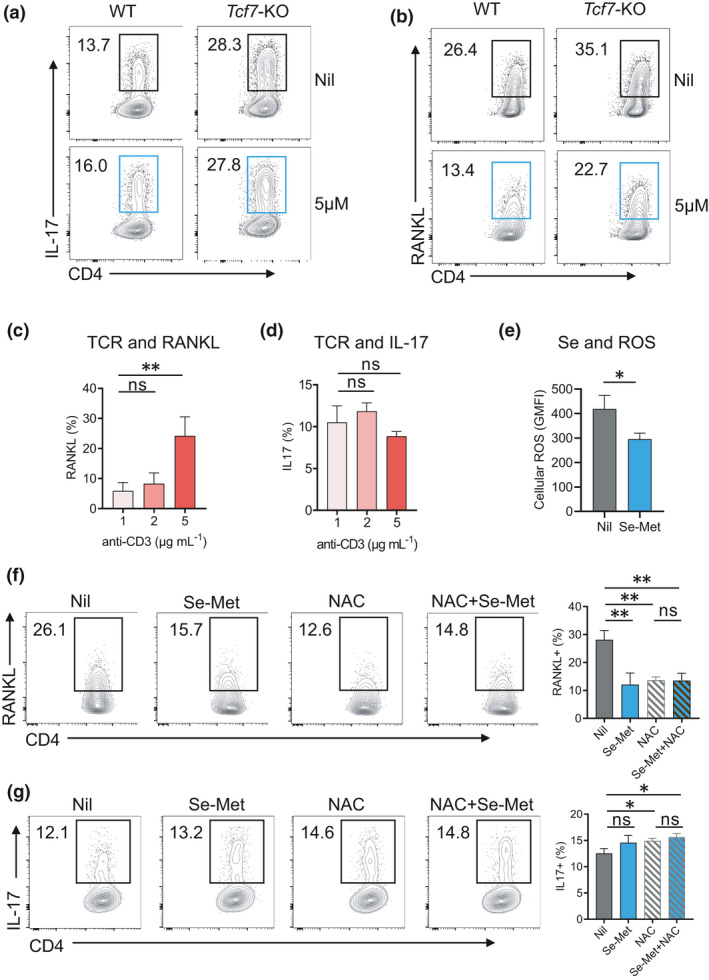
Se supplementation attenuates ROS to suppress RANKL expression in activated CD4+ T cells. (a, b) Representative FASC plots and statistics showing the frequencies of IL‐17 (a) and RANKL (b) and in WT and Tcf7‐KO with or without Se‐Met for 72 h. (c, d) RANKL (c) and IL‐17 (d) expression on CD4+ T cells increased with different doses of TCR stimulation. (e) The levels of ROS in cultured CD4+ T cells with or without Se‐Met. (f, g) Representative FASC plots and statistics showing the frequencies of RANKL (f) and IL‐17 (g) under Th17 cell‐induction conditions, with or without Se‐Met or NAC treatment. Data are shown for individual (n = 4) and mean (bars) values and analysed by the Mann–Whitney U‐test. * P‐value < 0.05, ** P‐value < 0.01. Results are representative of three independent experiments.
We observed that RANKL expression on CD4+ T cells increased with the dose of TCR stimulation (Figure 6c) while IL‐17 expression did not (Figure 6d). As reported previously, increased signalling from T‐cell receptor (TCR) enhanced ROS accumulation in cultured CD4+ T cells. Since adding Se‐Met reduced the levels of ROS in cultured CD4+ T cells (Figure 6e), we then asked whether ROS induces RANKL expression such that Se‐Met attenuates ROS levels to suppress RANKL expression. To test whether ROS induces RANKL expression in CD4+ T cells, we adopted the commonly used artificial antioxidant N‐acetyl‐l‐cysteine (NAC) to scavenge ROS. As a synthetic precursor of intracellular cysteine and glutathione, NAC inhibits ROS by the redox potential of thiols and increasing glutathione levels in the cells.37 NAC treatment also suppressed RANKL expression, and importantly, Se‐Met was unable to further decrease RANKL expression in the presence of NAC (Figure 6f), suggesting Se‐Met suppresses RANKL expression primarily through mitigating ROS‐induced RANKL expression. As a control, NAC treatment did not change the expression of IL‐17 (Figure 6g). In summary, ROS in activated CD4+ T cells induces RANKL but not IL‐17 expression which can be attenuated by supranutritional Se or Se supplementation.
Discussion
Se is an essential trace element that broadly regulates human health and disease. In addition to treating Se deficiency, the supplementation of Se has been tested in diversified conditions including infection, cancer, inflammatory, neurological and cardiovascular diseases with several hundreds of registrations identified in the Clinical Trials (ClinicalTrials.gov). However, most studies did not lead to conclusive results and reports were sometimes contradictory. These could be explained by the difference lying in the baseline Se levels, the dose of Se supplementation, the criteria of subject inclusion and the design of clinical trial endpoints. The limitation of such clinical trials highlights the importance to pair clinical studies with the investigations to dissect cellular and molecular mechanisms underlying physiological regulation by Se supplementation.
RA affects ˜1% of the population worldwide. As a chronic inflammatory and autoimmune disease with lifelong pharmacological management, more than half of arthritis patients are reported to use complementary and alternative medicine.38 Given the critical function of Se and selenoproteins in the regulation of bone metabolism and their antioxidant and anti‐inflammatory effects, we were inspired to examine whether Se supplementation could benefit RA. By a combination of three complementary approaches including the association study using human cohorts of supranutritional Se intake, an intervention study using the mouse RA model and the mechanistic study using cellular assays, our results revealed that supranutritional Se was beneficial in the mouse model for RA, at least partially by suppressing the generation of RANKL‐expressing osteoclastogenic CD4+ T cells.
One unique advantage of our study is the assessment of RA patients in Enshi County, China, where supranutritional Se intake is well documented for residents.17 Compared to the high serum Se levels in HC (> 150 ng mL−1), the serum Se levels in RA patients from the same area was not high but within a normal range (70–150 ng mL−1), comparable to reported normal Se levels in healthy individuals in many countries (China, 120 ng mL−1; Australia, 103 ng mL−1; the United States, 136.7 ng mL−1; UK, 86.9 ng mL−1).39, 40, 41, 42 Among RA patients, higher serum Se concentrations were associated with less severe disease, shown by lower DAS 28 and reduced CRP. The protective role of supranutritional Se in RA was validated in the mouse CIA model whereby Se supplementation increased serum Se concentrations, significantly delayed the arthritic onset, lowered clinical scores and ameliorated the severity of joint inflammation and damages. Results from our human and mouse studies suggest that Se supplementation reaching supranutritional levels could benefit RA.
It should be noted that the relationship between Se status and disease risk is not linear but often U‐shaped as reported in several studies.1, 43 Although our study supports the notion that supranutritional Se could potentially benefit RA, this study does not provide evidence for Se deficiency in RA. Previous studies reported Se deficiency (serum Se < 70 ng mL−1) in RA patients, especially those with more active diseases.44, 45 It is yet to be determined whether Se deficiency leads to an exaggerated generation of RANKL‐expressing osteoclastogenic CD4+ T cells. Future studies are also required to validate the positive association between supranutritional Se and improved RA or the negative association between Se deficiency and severe RA in large cohorts, in order to understand the full spectrum of the relationship between Se status and RA risk.
Another question is why RA patients showed reduced Se levels compared with HC in ours and other studies. In our study, both groups were from the same county so that it is unlikely that they differed drastically for dietary preference or Se consumption. It has been reported that Se metabolism (absorption and excretion) is associated with genetic variation46, 47 and can also be affected by lifestyle. For example, tobacco smoking is a well‐known lifestyle risk factor for RA,21 which was also found associated with reduced Se levels.48 Therefore, the genetic and lifestyle difference may contribute to lower Se levels in RA patients. On the contrary, oxidative stress in RA49 might further reduce Se levels. The pathogenesis of RA is driven by the hyperactivation of the immune system including excessive function of effector Th1, Th17 and follicular helper T (Tfh) cells.21, 50 The activation of T cells by TCR stimulation strongly induces oxidative stress51, 52 which could consume antioxidant selenoenzymes and reduce the pool of Se reserve. The association between oxidative stress and reduced antioxidant micronutrients including Se was found in HIV infection53 but such relationship needs to be carefully examined in RA.
It is conceivable that supranutritional Se benefits RA through multiple mechanisms of action. There was one common observation emerging in the immunological analysis of both RA patients with supranutritional Se intake and the CIA mouse model with Se supplementation. High Se levels were found associated with low levels of RANKL and a reduced generation of RANKL‐expressing CD4+ T cells. Both mouse and human activated T cells can directly induce osteoclastogenesis from myeloid cells such as monocytes and dendritic cells,54, 55, 56 which is importantly mediated by RANKL expression of Th17 cells.28 The negative relationship between Se levels and RANKL expression suggested a possibility that Se supplementation might regulate RANKL expression. To our knowledge, this important question has not been examined before. Using the in vitro culture assays, we demonstrated that Se supplementation directly suppressed RANKL expression without inhibiting IL‐17 expression. The suppression is likely to be mediated by the mitigation of ROS by Se supplementation. Intriguingly, the interaction of RANKL with its receptor RANK has been shown to induce ROS in monocytes and promote the differentiation into osteoclasts.57 Our study thus adds a new piece into the regulation of osteoclastogenesis by showing the upstream RANKL expression is also enhanced by ROS. Th17 cells produce RANKL and IL‐17, both suppressed by TCF1. Our study revealed a more specific regulation whereby ROS promotes RANKL expression without upregulating IL‐17. This again supports the notion of the dichotomous nature of Th17 cells, which can either support the homeostasis of tissue barriers or drive inflammatory disorders and tissue damage.58 In this case, RANKL‐expressing Th17 cells promote osteoclastogenesis in RA. As RANKL expression was upregulated in a TCR dose‐dependent manner, it might imply that the repeated stimulation by autoantigens in RA might drive excessive RANKL production by T cells.
While our data demonstrate that Se supplementation reduces ROS to suppress RANKL expression in CD4+ T cells, it is yet to be dissected how ROS regulates RANKL expression in T cells. ROS can act downstream of TCR signalling to broadly modulate T‐cell activation, proliferation and effector function, which involve transcriptional regulations by NFAT, NF‐κB, AP‐1 and mTOR/c‐Myc.51 RANKL expression in T cells is not regualted by c‐Myc.59 In contrast, NFAT was identified to bind the regulatory element of the Tnfsf11 gene and regulate RANKL expression in both mouse and human T cells.60, 61 An elegant study by Navdeep Chandel and colleagues demonstrated that TCR stimulation and resulting calcium influx increase mitochondria ROS, which is converted into H2O2 and diffuse into the cytoplasm to promote NFAT activation and the transcription of the Il2 gene.62 This precedent study sets up an example whereby TCR‐mediated ROS accumulation activates the NFAT pathway. Future study is required to test whether RANKL in T cells is regulated in a similar manner.
It should be noted that RANKL is not only expressed by T cells but also by other cell types such as B cells and synovial fibroblasts.27 Although it is anticipated that the Se‐ROS regulatory axis might also control the expression of RANKL in other cell types, this needs to be formally examined. Although we identified a critical regulatory mechanism by Se in suppressing RANKL expression to improve disease activity, supranutritional Se likely benefits RA beyond a single mechanism.
Collectively, our study suggests a potential benefit of supranutritional Se levels in suppressing RANKL‐expressing osteoclastogenic CD4+ T cells and improving RA patients. Understanding mechanisms of action for supranutritional Se will help to design novel Se‐based intervention and optimise treatment regimen. Importantly, the benefit of Se supplementation in RA should be formally tested in a well‐conducted and sufficiently large randomised clinical trial with the intervention of Se supplementation versus placebo. Given that Se modulates health and disease in a dose‐ and time‐dependent manner. The design of clinical trials should take into account the Se baseline and the dose of supplementation, such as the supranutritional level suggested by our study.
Methods
Human studies
Patients with rheumatoid arthritis (RA) (n = 57) enrolled in this study were newly diagnosed according to the American College of Rheumatology classification criteria (1978). Age‐ and sex‐matched health controls (HCs) (n = 71) were enrolled from the healthy examination centre without the disorder in routine blood count, liver and kidney functions, immune function and blood glucose. PBMCs from RA patients and HCs were provided written informed consent according to the Ethical Committee of Minda Hospital of Hubei Minzu University (Enshi, Hubei, China) to donate blood for this study. Demographics are shown in Table 1.
Table 1.
Demographics and clinical data of the study cohorts.
| Characteristic | Value |
|---|---|
| Healthy controls | N = 71 |
| Female/male, n | 50/21 |
| Age, median (range) | 54 (25–80) |
| Patients with rheumatoid arthritis | N = 57 |
| Female/male, n | 41/16 |
| Age, median(range) | 55 (24–79) |
| Disease duration (year), median (range) | 2 (< 1–40) |
| DAS28, median (range) | 4.97 (2.96–7.41) |
| RF, N (%) | 46 (81%) |
| Anti‐CCP, N (%) | 45 (80%) |
| CRP, mg L–1 ( mean ± SD) | 50.89 ± 50.36 |
| ESR, mm h–1 (mean ± SD) | 78.14 ± 34.86 |
| Medication, N (%) | 12 |
| Glucocorticoids | 0 |
| DMARDs | 8 |
Animals and ethics
DBA/1J mice, wild‐type (WT) C57BL/6 mice were maintained in the animal facility of Renji Hospital, Shanghai Jiao Tong University School of Medicine; CD4Cre x Tcf7fl/fl mice were described63 and maintained in the Biological Resource Facility at the University of Queensland. All animal experiments were performed according to the animal welfare guidelines under approved protocols of each research institute.
CIA induction and Se supplementation
DBA/1J mice with 8–10 weeks of age were immunised with 200 μg type II bovine collagen (CII, Chondrex, Redmond, WA, USA) emulsified in complete Freund’s adjuvant (CFA, BD Biosciences, San Jose, CA, USA) at the tail base on day 0. A booster immunisation of 100 μg type II bovine collagen emulsified in incomplete Freund’s adjuvant (IFA, BD Biosciences, San Jose, CA, USA) was given on day 21.
DBA/1J mice with CII+CFA immunisation on day 0 were randomly divided into 2 groups: CIA control and CIA+Se. Mice from the CIA+Se group were fed with Seleno‐L‐methionine (Sigma‐Aldrich, St. Louis, MO, USA) dissolved in ddH2O at a concentration of 0.3 ppm64 and changed every three days. Mice body weight, incidence and clinical score were evaluated daily from day 21 with the previously described protocol.29
Serum Se level measurement
Serum samples were diluted 10 times with 0.1% nitric acid solution (Sigma, Saint Louis, USA) and incubated overnight at room temperature. Se levels in sera were measured by inductively coupled plasma mass spectrometry ((ICP‐MS) by a Thermo Fisher Scientific iCAP‐Qc, Waltham, MA, USA) at Shandong Analysis and Test Center. Briefly, the standard curve of selenium concentration was established using the certified reference material (SPEX CertiPrep, Metuchen, NJ, USA) containing 100 mg L−1 Se. To avoiding the major interferences from argon dimer, the 82Se isotope was selected for analysis. 103Rh served as the internal standard.
Flow cytometric bead array analysis (CBA)
T‐cell cytokines (IL‐2, IL‐4, IL‐6, IL‐10, IL‐17, IL‐21, IFN‐γ and TNF‐α) in the serum of RA patients and HCs were measured by using a flow cytometric bead array (CBA) kit (LEGENDplex, BioLegend, San Diego, CA, USA) according to the manufacture’s protocol. Briefly, Standard Cocktail and samples were prepared with assay buffer and beads cocktails. After 2 h of incubation with 500 rpm shaking, detection antibodies were added to each well and incubated at room temperature for 1 h. Samples were then analysed with a flow cytometer (Fortessa X20, BD), and the concentrations of cytokines were calculated with LEGENDplex v8.0 (Biolegend).
Cell culture and Se treatment
WT C57BL/6 mice or CD4Cre Tcf7fl/fl mice CD4+ naïve T cells were isolated using magnetic beads (Miltenyi Biotec, Bergisch Gladbach, Germany) and further sorted in a flow cytometer (Aria III, BD). CD4+CD25−CD44−CD62L+ naïve T cells with a purity of > 95% were used for in vitro culture experiments. Naïve CD4+ T cells were cultured in the anti‐CD3 (clone: 17A2, Biolegend) and anti‐CD28 (clone: 37.51, Biolegend)‐coated 96‐well plates and cultured under a Th17 cell polarisation condition: TGF‐β (1 ng mL−1, PeproTech, Cranbury, NJ, USA), IL‐6 (20 ng mL−1, PeproTech), anti‐IFN‐γ (10 μg mL‐−1, PeproTech) and anti‐IL‐4 (10 μg mL−1, PeproTech) for 72 h. Se‐Met (0, 1.25 and 5 μM) with or without NAC (2 μM, Sigma‐Aldrich) was added to the culture medium. For the CFSE‐labelled proliferation assay, naïve CD4+ T cells were pre‐stained with CFSE (1 μg mL−1) at 37°C for 10 min and then cultured in the anti‐CD3/CD28‐coated plates for 72 h.
Enzyme‐linked immunosorbent assay (ELISA)
RANKL level in the human serum (MultiSciences, Hangzhou, China), mouse serum and supernatants of cultured CD4+ T cells (MultiSciences) were measured with ELISA kits following the manufacturer’s protocol. IL‐17 concentration in the cultured medium was measured with an ELISA kit (Biolegend).
Flow cytometry
PBMCs from blood samples of RA patients and HCs were isolated with the Ficoll‐Paque, and stained with fluorochrome‐conjugated monoclonal antibodies: CXCR3‐BV421 (Biolegend, Clone: G025H7), anti‐CCR6‐PE (Biolegend, Clone: G034E3), anti‐CD45RA‐ PE‐Cy7 (Biolegend, Clone: HI100), anti‐CD25‐PE (Biolegend, Clone: M‐A251), anti‐CD127‐APC (Biolegend, Clone: A019D5), anti‐CD3‐BV421 (Biolegend, Clone: UCHT1) and anti‐CD4‐FITC (BD Pharmingen, Clone: RPA‐T4). Data were acquired on a SH800 flow cytometer (Sony, Minato, Tokyo, Japan). Data were analysed using FlowJo software (BD).
Single‐cell suspension from spleens and inguinal lymph nodes of DBA/1J mice with CIA were prepared and stained with the following antibodies: anti‐CD4‐BUV496 (BD, Clone: GK1.5), anti‐TCRβ‐BUV737 (BD Pharmingen, Clone: H57‐597), anti‐CD44‐PE‐Cy7 (BD Pharmingen, Clone: IM7), anti‐CD62L‐APC (BD Pharmingen, Clone: MEL‐14), anti‐RANKL (BD Pharmingen, Clone: IK22‐5), anti‐ZA‐BV510 (Biolegend), anti‐IL‐17‐FITC (Biolegend, Clone: TC11‐18H10.1) and anti‐CD8a‐APC‐Cy7 (Biolegend, Clone: YTS156.7.7). For intracellular staining of IL‐17, cells were stimulated with phorbol 12‐myristate 13‐acetate (50 ng mL−1, PMA) (Sigma‐Aldrich), ionomycin (1μg mL−1, Sigma‐Aldrich) and monensin (1000x, Biolegend) for 4–5 h. Cells were fixed and stained with anti‐IL‐17‐APC (BD Pharmingen clone: TC11‐18H10.1) after surface staining. Data were acquired on a flow cytometer (X‐20, BD). Data were analysed using Flow Jo software (BD).
Histological assessment of arthritis
Knee joints and paws of CIA mice were fixed with 4% paraformaldehyde (PFA) solution; sections (6 μm) were stained with haematoxylin and eosin (HE). The histology of knee joints and paw was evaluated with Aperio CS2 (Leica Biosystems, Wetzlar, Germany) and ImageScope software (Leica).
Quantification and statistical analysis
An unpaired two‐tailed t‐test (Welch’s correction for unequal variance and the Mann–Whitney U‐test for non‐Gaussian distribution) was applied to test statistical significance. One‐way ANOVA was applied for multiple groups. Spearman’s correlation was used to analyse nonparametric data. The chi‐square test was for contingency tables. All data are shown as mean ± SD and were analysed with GraphPad Prism (version 7.0). A P‐value < 0.05 was considered significant; n means the number of biological replicates.
Conflict of Interest
The authors declare no conflict of interest.
Author Contributions
Jiahuan Qin: Data curation; formal analysis; investigation; writing–original draft; writing–review and editing. Xia Huang: Data curation; project administration. Naiqi Wang: Data curation; formal analysis. Pengcheng Zhou: Data curation; formal analysis. Hao Zhang: Data curation; methodology. Zhian Chen: Data curation; formal analysis; investigation; project administration. Kaili Liang: Data curation; formal analysis; investigation. Dongcheng Gong: Data curation. Qunxiong Zeng: Data curation. Peng Niu: Data curation. Anping Chen: Project administration. Lin Yuan: Project administration. Zhaohui Yang: Project administration. Linchong Su: Data curation; investigation; project administration; writing–review and editing. Nan Shen: Conceptualization; investigation; methodology; project administration; writing–review and editing. Jun Deng: Conceptualization; data curation; investigation; methodology; project administration; resources; writing–original draft; writing–review and editing. Di Yu: Conceptualization; formal analysis; project administration; supervision; writing–original draft; writing–review and editing.
Acknowledgments
We acknowledge Ms J Yao from the animal facility of Renji Hospital, Shanghai Jiao Tong University School of Medicine for technical assistance. This project was supported by the National Natural Science Foundation of China (82071792, 82071816 to JD, 31630021, 81421001 and 31930037 to NS), Health Commission of Hubei Province Scientific Research Project (WJ2019H136, WJ2019H137), Innovative Research Team of High‐level Local Universities in Shanghai led by NS, and Shanghai Municipal Key Medical Center Construction Project (2017ZZ01024‐002). Part of the research was carried out at the Translational Research Institute, Woolloongabba, QLD, Australia. The Translational Research Institute is supported by a grant from the Australian Government.
Contributor Information
Linchong Su, Email: linchongsu@126.com.
Nan Shen, Email: nanshensibs@gmail.com.
Jun Deng, Email: jun.deng@aliyun.com.
Di Yu, Email: di.yu@uq.edu.au.
References
- 1.Rayman MP. Selenium and human health. Lancet 2012; 379: 1256–1268. [DOI] [PubMed] [Google Scholar]
- 2.Zoidis E, Seremelis I, Kontopoulos N, Danezis GP. Selenium‐dependent antioxidant enzymes: actions and properties of selenoproteins. Antioxidants 2018; 7: 66. [DOI] [PMC free article] [PubMed] [Google Scholar]
- 3.Dixon S, Lemberg K, Lamprecht Met al. Ferroptosis: an iron‐dependent form of nonapoptotic cell death. Cell 2012; 149: 1060–1072. [DOI] [PMC free article] [PubMed] [Google Scholar]
- 4.Stockwell BR, Friedmann Angeli JP, Bayir Het al. Ferroptosis: a regulated cell death nexus linking metabolism, redox biology, and disease. Cell 2017; 171: 273–285. [DOI] [PMC free article] [PubMed] [Google Scholar]
- 5.Ingold I, Berndt C, Schmitt Set al. Selenium utilization by GPX4 is required to prevent hydroperoxide‐induced ferroptosis. Cell 2018; 172(409–422): e421. [DOI] [PubMed] [Google Scholar]
- 6.Yeo JE, Kang SK. Selenium effectively inhibits ROS‐mediated apoptotic neural precursor cell death in vitro and in vivo in traumatic brain injury. Biochim Biophys Acta 2007; 1772: 1199–1210. [DOI] [PubMed] [Google Scholar]
- 7.Alim I, Caulfield JT, Chen Yet al. Selenium drives a transcriptional adaptive program to block ferroptosis and treat stroke. Cell 2019; 177(1262–1279): e1225. [DOI] [PubMed] [Google Scholar]
- 8.Soni C, Sinha I, Fasnacht MJ, Olsen NJ, Rahman ZSM, Sinha R. Selenium supplementation suppresses immunological and serological features of lupus in B6.Sle1b mice. Autoimmunity 2019; 52: 57–68. [DOI] [PMC free article] [PubMed] [Google Scholar]
- 9.Gartner R, Gasnier BC, Dietrich JW, Krebs B, Angstwurm MW. Selenium supplementation in patients with autoimmune thyroiditis decreases thyroid peroxidase antibodies concentrations. J Clin Endocrinol Metab 2002; 87: 1687–1691. [DOI] [PubMed] [Google Scholar]
- 10.Puspitasari IM, Abdulah R, Yamazaki C, Kameo S, Nakano T, Koyama H. Updates on clinical studies of selenium supplementation in radiotherapy. Radiat Oncol 2014; 9: 125. [DOI] [PMC free article] [PubMed] [Google Scholar]
- 11.Yang GQ, Ge KY, Chen JS, Chen XS. Selenium‐related endemic diseases and the daily selenium requirement of humans. World Rev Nutr Diet 1988; 55: 98–152. [DOI] [PubMed] [Google Scholar]
- 12.Moreno‐Reyes R, Suetens C, Mathieu Fet al. Kashin‐beck osteoarthropathy in rural Tibet in relation to selenium and iodine status. N Engl J Med 1998; 339: 1112–1120. [DOI] [PubMed] [Google Scholar]
- 13.Zeng H, Cao JJ, Combs GF Jr. Selenium in bone health: roles in antioxidant protection and cell proliferation. Nutrients 2013; 5: 97–110. [DOI] [PMC free article] [PubMed] [Google Scholar]
- 14.Guo Q, Wang Y, Xu D, Nossent J, Pavlos NJ, Xu J. Rheumatoid arthritis: pathological mechanisms and modern pharmacologic therapies. Bone Res 2018; 6: 15. [DOI] [PMC free article] [PubMed] [Google Scholar]
- 15.Chen Z, Bozec A, Ramming A, Schett G. Anti‐inflammatory and immune‐regulatory cytokines in rheumatoid arthritis. Nat Rev Rheumatol 2019; 15: 9–17. [DOI] [PubMed] [Google Scholar]
- 16.Turrubiates‐Hernández FJ, Márquez‐Sandoval YF, González‐Estevez G, Reyes‐Castillo Z, Muñoz‐Valle JF. The relevance of selenium status in rheumatoid arthritis. Nutrients 2020; 12: 3007. [DOI] [PMC free article] [PubMed] [Google Scholar]
- 17.Huang Y, Wang Q, Gao Jet al. Daily dietary selenium intake in a high selenium area of Enshi, China. Nutrients 2013; 5: 700–710. [DOI] [PMC free article] [PubMed] [Google Scholar]
- 18.Bleys J, Navas‐Acien A, Guallar E. Serum selenium levels and all‐cause, cancer, and cardiovascular mortality among US adults. Arch Intern Med 2008; 168: 404–410. [DOI] [PubMed] [Google Scholar]
- 19.Bernhard M. Selenium. 1st ed. Cham, Switzerland: Springer International Publishing AG, 2018. [Google Scholar]
- 20.Cope AP, Schulze‐Koops H, Aringer M. The central role of T cells in rheumatoid arthritis. Clin Exp Rheumatol 2007; 25: S4–11. [PubMed] [Google Scholar]
- 21.McInnes IB, Schett G. The pathogenesis of rheumatoid arthritis. N Engl J Med 2011; 365: 2205–2219. [DOI] [PubMed] [Google Scholar]
- 22.Burmester GR, Feist E, Dorner T. Emerging cell and cytokine targets in rheumatoid arthritis. Nat Rev Rheumatol 2014; 10: 77–88. [DOI] [PubMed] [Google Scholar]
- 23.He J, Zhang X, Wei Yet al. Low‐dose interleukin‐2 treatment selectively modulates CD4+ T cell subsets in patients with systemic lupus erythematosus. Nat Med 2016; 22: 991–993. [DOI] [PubMed] [Google Scholar]
- 24.McInnes IB, Schett G. Cytokines in the pathogenesis of rheumatoid arthritis. Nat Rev Immunol 2007; 7: 429–442. [DOI] [PubMed] [Google Scholar]
- 25.Alunno A, Carubbi F, Giacomelli R, Gerli R. Cytokines in the pathogenesis of rheumatoid arthritis: new players and therapeutic targets. BMC Rheumatol 2017; 1: 3. [DOI] [PMC free article] [PubMed] [Google Scholar]
- 26.Mbalaviele G, Novack DV, Schett G, Teitelbaum SL. Inflammatory osteolysis: a conspiracy against bone. J Clin Invest 2017; 127: 2030–2039. [DOI] [PMC free article] [PubMed] [Google Scholar]
- 27.Tsukasaki M, Takayanagi H. Osteoimmunology: evolving concepts in bone‐immune interactions in health and disease. Nat Rev Immunol 2019; 19: 626–642. [DOI] [PubMed] [Google Scholar]
- 28.Sato K, Suematsu A, Okamoto Ket al. Th17 functions as an osteoclastogenic helper T cell subset that links T cell activation and bone destruction. J Exp Med 2006; 203: 2673–2682. [DOI] [PMC free article] [PubMed] [Google Scholar]
- 29.Wooley PH, Luthra HS, Stuart JM, David CS. Type II collagen‐induced arthritis in mice. I. Major histocompatibility complex (I region) linkage and antibody correlates. J Exp Med 1981; 154: 688–700. [DOI] [PMC free article] [PubMed] [Google Scholar]
- 30.Cho YG, Cho ML, Min SY, Kim HY. Type II collagen autoimmunity in a mouse model of human rheumatoid arthritis. Autoimmun Rev 2007; 7: 65–70. [DOI] [PubMed] [Google Scholar]
- 31.Koyama H, Omura K, Ejima A, Kasanuma Y, Watanabe C, Satoh H. Separation of selenium‐containing proteins in human and mouse plasma using tandem high‐performance liquid chromatography columns coupled with inductively coupled plasma‐mass spectrometry. Anal Biochem 1999; 267: 84–91. [DOI] [PubMed] [Google Scholar]
- 32.Frisk P, Yaqob A, Nilsson K, Carlsson J, Lindh U. Uptake and retention of selenite and selenomethionine in cultured K‐562 cells. Biometals 2000; 13: 209–215. [DOI] [PubMed] [Google Scholar]
- 33.Zhou L, Chong MM, Littman DR. Plasticity of CD4+ T cell lineage differentiation. Immunity 2009; 30: 646–655. [DOI] [PubMed] [Google Scholar]
- 34.Spencer GJ, Utting JC, Etheridge SL, Arnett TR, Genever PG. Wnt signalling in osteoblasts regulates expression of the receptor activator of NFkappaB ligand and inhibits osteoclastogenesis in vitro . J Cell Sci 2006; 119: 1283–1296. [DOI] [PubMed] [Google Scholar]
- 35.O'Brien CA. Control of RANKL gene expression. Bone 2010; 46: 911–919. [DOI] [PMC free article] [PubMed] [Google Scholar]
- 36.Xu S, Zhang Y, Liu Bet al. Activation of mTORC1 in B lymphocytes promotes osteoclast formation via regulation of beta‐catenin and RANKL/OPG. J Bone Miner Res 2016; 31: 1320–1333. [DOI] [PubMed] [Google Scholar]
- 37.Sun SY. N‐acetylcysteine, reactive oxygen species and beyond. Cancer Biol Ther 2010; 9: 109–110. [DOI] [PMC free article] [PubMed] [Google Scholar]
- 38.Ng JY, Azizudin AM. Rheumatoid arthritis and osteoarthritis clinical practice guidelines provide few complementary and alternative medicine therapy recommendations: a systematic review. Clin Rheumatol 2020; 39: 2861–2873. [DOI] [PubMed] [Google Scholar]
- 39.Ju W, Ji M, Li Xet al. Relationship between higher serum selenium level and adverse blood Q3 lipid profile. Clin Nutr 2017; 37: 1512–1517. [DOI] [PubMed] [Google Scholar]
- 40.Lyons GH, Judson GJ, Ortiz‐Monasterio I, Genc Y, Stangoulis JC, Graham RD. Selenium in Australia: selenium status and biofortification of wheat for better health. J Trace Elem Med Biol 2005; 19: 75–82. [DOI] [PubMed] [Google Scholar]
- 41.Stranges S, Laclaustra M, Ji Cet al. Higher selenium status is associated with adverse blood lipid profile in British adults. J Nutr 2010; 140: 81–87. [DOI] [PMC free article] [PubMed] [Google Scholar]
- 42.Laclaustra M, Stranges S, Navas‐Acien A, Ordovas JM, Guallar E. Serum selenium and serum lipids in US adults: National Health and Nutrition Examination Survey (NHANES) 2003–2004. Atherosclerosis 2010; 210: 643–648. [DOI] [PMC free article] [PubMed] [Google Scholar]
- 43.Winther KH, Rayman MP, Bonnema SJ, Hegedus L. Selenium in thyroid disorders ‐ essential knowledge for clinicians. Nat Rev Endocrinol 2020; 16: 165–176. [DOI] [PubMed] [Google Scholar]
- 44.Tarp U, Overvad K, Hansen JC, Thorling EB. Low selenium level in severe rheumatoid arthritis. Scand J Rheumatol 1985; 14: 97–101. [DOI] [PubMed] [Google Scholar]
- 45.Yazar M, Sarban S, Kocyigit A, Isikan UE. Synovial fluid and plasma selenium, copper, zinc, and iron concentrations in patients with rheumatoid arthritis and osteoarthritis. Biol Trace Elem Res 2005; 106: 123–132. [DOI] [PubMed] [Google Scholar]
- 46.Evans DM, Zhu GU, Dy Vet al. Genome‐wide association study identifies loci affecting blood copper, selenium and zinc. Hum Mol Genet 2013; 22: 3998–4006. [DOI] [PMC free article] [PubMed] [Google Scholar]
- 47.Mao J, Vanderlelie JJ, Perkins AV, Redman CW, Ahmadi KR, Rayman MP. Genetic polymorphisms that affect selenium status and response to selenium supplementation in United Kingdom pregnant women. Am J Clin Nutr 2016; 103: 100–106. [DOI] [PMC free article] [PubMed] [Google Scholar]
- 48.Kocyigit A, Erel O, Gur S. Effects of tobacco smoking on plasma selenium, zinc, copper and iron concentrations and related antioxidative enzyme activities. Clin Biochem 2001; 34: 629–633. [DOI] [PubMed] [Google Scholar]
- 49.McGarry T, Biniecka M, Veale DJ, Fearon U. Hypoxia, oxidative stress and inflammation. Free Radic Biol Med 2018; 125: 15–24. [DOI] [PubMed] [Google Scholar]
- 50.Deng J, Wei Y, Fonseca VR, Graca L, Yu D. T follicular helper cells and T follicular regulatory cells in rheumatic diseases. Nat Rev Rheumatol 2019; 15: 475–490. [DOI] [PubMed] [Google Scholar]
- 51.Franchina DG, Dostert C, Brenner D. Reactive oxygen species: involvement in T cell signaling and metabolism. Trends Immunol 2018; 39: 489–502. [DOI] [PubMed] [Google Scholar]
- 52.Yao Y, Chen Z, Zhang Het al. Selenium–GPX4 axis protects follicular helper T cells from ferroptosis. Nature Immunol. 2021; 22: 1127–1139. [DOI] [PubMed] [Google Scholar]
- 53.Allard JP, Aghdassi E, Chau J, Salit I, Walmsley S. Oxidative stress and plasma antioxidant micronutrients in humans with HIV infection. Am J Clin Nutr 1998; 67: 143–147. [DOI] [PubMed] [Google Scholar]
- 54.Horwood NJ, Kartsogiannis V, Quinn JM, Romas E, Martin TJ, Gillespie MT. Activated T lymphocytes support osteoclast formation in vitro . Biochem Biophys Res Commun 1999; 265: 144–150. [DOI] [PubMed] [Google Scholar]
- 55.Kotake S, Udagawa N, Hakoda Met al. Activated human T cells directly induce osteoclastogenesis from human monocytes: possible role of T cells in bone destruction in rheumatoid arthritis patients. Arthritis Rheum 2001; 44: 1003–1012. [DOI] [PubMed] [Google Scholar]
- 56.Alnaeeli M, Penninger JM, Teng YT. Immune interactions with CD4+ T cells promote the development of functional osteoclasts from murine CD11c+ dendritic cells. J Immunol 2006; 177: 3314–3326. [DOI] [PubMed] [Google Scholar]
- 57.Lee NK, Choi YG, Baik JYet al. A crucial role for reactive oxygen species in RANKL‐induced osteoclast differentiation. Blood 2005; 106: 852–859. [DOI] [PubMed] [Google Scholar]
- 58.Stockinger B, Omenetti S. The dichotomous nature of T helper 17 cells. Nat Rev Immunol 2017; 17: 535–544. [DOI] [PubMed] [Google Scholar]
- 59.Wang R, Zhang L, Zhang Xet al. Regulation of activation‐induced receptor activator of NF‐kappaB ligand (RANKL) expression in T cells. Eur J Immunol 2002; 32: 1090–1098. [DOI] [PubMed] [Google Scholar]
- 60.Bishop KA, Coy HM, Nerenz RD, Meyer MB, Pike JW. Mouse Rankl expression is regulated in T cells by c‐Fos through a cluster of distal regulatory enhancers designated the T cell control region. J Biol Chem 2011; 286: 20880–20891. [DOI] [PMC free article] [PubMed] [Google Scholar]
- 61.Bishop KA, Wang X, Coy HM, Meyer MB, Gumperz JE, Pike JW. Transcriptional regulation of the human TNFSF11 gene in T cells via a cell type‐selective set of distal enhancers. J Cell Biochem 2015; 116: 320–330. [DOI] [PMC free article] [PubMed] [Google Scholar]
- 62.Sena L, Li S, Jairaman Aet al. Mitochondria are required for antigen‐specific T cell activation through reactive oxygen species signaling. Immunity 2013; 38: 225–236. [DOI] [PMC free article] [PubMed] [Google Scholar]
- 63.Leong YA, Chen Y, Ong HSet al. CXCR5+ follicular cytotoxic T cells control viral infection in B cell follicles. Nat Immunol 2016; 17: 1187–1196. [DOI] [PubMed] [Google Scholar]
- 64.Kudva AK, Shay AE, Prabhu KS. Selenium and inflammatory bowel disease. Am J Physiol Gastrointest Liver Physiol 2015; 309: G71–77. [DOI] [PMC free article] [PubMed] [Google Scholar]