

Abstract
Background:
Deposition and spreading of misfolded proteins (α-synuclein and tau) have been linked to Parkinson’s cognitive dysfunction. The glymphatic system may play an important role in the clearance of these toxic proteins via cerebrospinal fluid (CSF) flow through perivascular and interstitial spaces. Recent studies discovered that sleep-dependent global brain activity is coupled to CSF flow that may reflect glymphatic function.
Objective:
To determine if the decoupling of brain activity-CSF flow is linked to Parkinson’s cognitive dysfunction.
Methods:
Functional and structural MRI data, clinical motor (Unified Parkinson’s Disease Rating Scale), and cognitive (Montreal Cognitive Assessment, MoCA) scores were collected from 60 Parkinson’s and 58 control subjects. Parkinson’s patients were sub-grouped into those with (MoCA < 26; N = 31) and without (MoCA ≥ 26; N = 29) mild cognitive impairment (MCI). The coupling strength between the resting-state global blood-oxygen-level-dependent signal (gBOLD) and associated CSF flow was quantified, compared among groups, and associated with clinical and structural measurements.
Results:
gBOLD-CSF coupling decreased significantly (p < 0.006) in Parkinson’s patients showing MCI, compared to those without MCI and controls. Reduced gBOLD-CSF coupling was associated with decreased MoCA scores that was present in Parkinson’s patients (p = 0.005) but not in controls (p = 0.65). Weaker gBOLD-CSF coupling in Parkinson’s patients also was associated with a thinner right entorhinal cortex (Spearman’s correlation = − 0.36; p = 0.012), an early structural change often seen in Alzheimer’s.
Conclusions:
The decoupling between global brain activity and associated CSF flow is related to Parkinson’s cognitive impairment.
Keywords: cerebrospinal fluid flow (CSF), cognitive impairment, glymphatic system, global resting-state fMRI signal, Parkinson’s disease
Introduction
Parkinson’s disease (PD) is characterized clinically by motor dysfunction1 and pathologically by both α-synuclein-positive Lewy bodies/neurites and dopamine neuron loss in the substantia nigra pars compacta of the basal ganglia.2 Recent literature also highlights non-motor features of the disease, with cognitive decline being one of the most debilitating symptoms. Indeed, >75% of Parkinson’s patients who survive for more than 10 years ultimately develop dementia.3 The exact mechanisms contributing to cognitive decline in PD are unknown and probably multifactorial. Many pathological processes have been proposed. The aggregation and spreading of α-synuclein to extra-nigral subcortical and cortical structures4,5 is one prominent hypothesis. Superimposed Alzheimer’s disease (AD) pathology6–9 could be another cause, since moderate to severe Alzheimer’s-co-pathology (e.g., amyloid-β and tau) has been found in 51% of PD patients, and is associated with faster time to dementia than Parkinson’s pathology alone.10
There is evidence suggesting an important role of a newly discovered “glymphatic system”11 in clearing proteins (e.g., toxic species of α-synuclein,12,13 amyloid-β,14 or tau15) from the brain. In this clearance pathway, cerebrospinal fluid (CSF) flows into the interstitial space through the periarterial space, a process facilitated by astroglial aquaporin-4 water channels. The bulk CSF flow then drives interstitial fluid (ISF) flux and interstitial solutes/proteins into the perivenous space around deep-draining veins where they eventually are transported into the lymphatic system.11,14,16 Intriguingly, the glymphatic system functions mainly during sleep, and is engaged much less during the awake state.11 This leads to the hypothesis that this “waste clearance” function is a universal mechanism contributing to the need for sleep in all species. This also may explain, at least partially, the diurnal rhythms of amyloid-β, tau, and α-synuclein.15,17,18
Despite its potential role in cognitive dysfunction and dementia, the study of the glymphatic system in humans has been challenging, largely due to a lack of tools that can assess glymphatic function directly and non-invasively. Two-photon microscopy and fluorescence imaging are used commonly in animal studies of the glymphatic system, but cannot yet be applied to human subjects.19,20 Contrast-enhanced MRI has been employed to track whole-brain CSF flow, including in human subjects,21,22 but the broad application is limited by the need for intrathecal contrast agents and the long-duration of experiments. Diffusion and structural MRI have been proposed to probe glymphatic function through surrogate markers such as perivascular space,22–24 however, they do not directly reflect dynamic aspects of the glymphatic system.
The pioneering study of Kiviniemi et al.25 suggested that low-frequency (<0.1 Hz) resting-state fMRI (rsfMRI) blood-oxygen-level-dependent (BOLD) signals are linked to CSF dynamics and, thus, glymphatic function. Additional evidence supports the link between global brain activity (measured by BOLD) and glymphatic function. First, the global BOLD (gBOLD) signal, like glymphatic function, is highly sensitive to brain vigilance state, and also has large-amplitude fluctuations during drowsiness or sleep.26–28 Second, the gBOLD signal is accompanied by profound low-frequency (<0.1 Hz) physiological changes in cardiac pulsation,29–31 respiration,32–34 and arterial signals.35 These physiological functions have been hypothesized to drive glymphatic CSF flow.36–40 Third, the large gBOLD signal during sleep was reported to couple to strong CSF movement41 that is an essential component of the glymphatic system. Collectively, the resting-state global activity and associated physiological modulations are hypothesized to represent highly coordinated neural and physiological processes closely linked to glymphatic clearance. Thus, gBOLD-CSF coupling may serve as a marker for gauging glymphatic function.
There is limited research on the role of the glymphatic system in PD or even in PD animal models, in part because α-synuclein conformational changes and accumulation were believed to occur within neurons or at presynaptic terminals.42 Recent evidence, however, indicates that α-synuclein is secreted into brain extracellular spaces,43 suggesting a potential role of glymphatic clearance in PD. Similar to amyloid-β and tau, α-synuclein in both ISF and CSF increases in response to sleep deprivation.15 In addition, tau protein, which can be cleared by the glymphatic system,44 plays an important role in the development of PD and PD dementia.7,45,46 Thus, we hypothesized that coupling between the global brain signal and CSF flow is related to glymphatic function and thus cognitive impairment in Parkinson’s patients.
Methods
Study design and participants
Sixty PD subjects and 58 controls for whom we had rsfMRI data and Montreal Cognitive Assessment (MoCA) scores were included. The PD subjects were recruited from a tertiary movement disorders clinic, and controls were from the spouse population of the clinic or via IRB-approved recruitment materials posted in the local community. PD diagnosis was confirmed by a movement disorder specialist according to the UK Brain Bank criteria.47 All subjects were free of major/unstable medical issues such as liver, kidney, or thyroid abnormality, and deficiency of vitamin B12, or any cerebrovascular disease or neurological condition (other than PD). Disease duration was obtained from subject history, with onset defined as the first diagnosis by a medical professional.
Ethics approval
The full protocol of this study was approved by the Institutional Review Board of Human Subjects Protection Office at the Penn State Milton S. Hershey Medical Center College of Medicine. All subjects provided written informed consent. The study was conducted in accordance with the principles of the Declaration of Helsinki.
Clinical assessments
The Movement Disorder Society (MDS)-UPDRS sub-scores (UPDRS-I, UPDRS-II, and UPDRS-III) were obtained. UPDRS-I evaluates non-motor aspects of daily living, UPDRS-II assesses motor aspects of daily living reported by the subjects, and UPDRS-III evaluates motor symptoms assessed by a trained examiner.48,49 Levodopa-equivalent daily dose (LEDD) was calculated for Parkinson’s subjects according to published criteria.50 Cognition was assessed using the Montreal Cognitive Assessment (MoCA) test.51,52 Following procedures reported in previous studies,51,53 Parkinson’s patients were subgrouped into those with (MoCA < 26) and without (MoCA ≥ 26) mild cognitive impairment (MCI).
Image acquisition and preprocessing
All MRI data were obtained on a 3.0 Tesla MR scanner (Trio, Siemens Magnetom, Erlangen, Germany). To avoid systematic bias, Parkinson’s and control subjects were scanned in an intermixed fashion throughout the study. Each rsfMRI acquisition began with a T1-weighted MPRAGE structural MRI sequence (repetition time/echo time (TR/TE) = 1540/2.3 msec, field of view = 256 mm × 256 mm, matrix = 256 × 256, slice thickness = 1 mm, slice number = 176) that was used for anatomical segmentation and template normalization. In each rsfMRI session, we acquired 240 fMRI volumes using an echo-planar image (EPI) sequence (flip angle = 90°, spatial resolution = 3×3×4 mm3, slice thickness = 3.0 mm) with TR/TE = 2000/30 msec. During the MRI scanning session, we used foam pads inside the head coil to reduce potential head motion. An experienced MRI technologist also manually evaluated image quality to make sure the data were free of severe motion artifacts.
RsfMRI data were preprocessed with a rsfMRI preprocessing pipeline adapted from the 1000 Functional Connectomes Project (version 1.1-beta).54 Specifically, we performed motion correction, skull/edge stripping, spatial smoothing (full width at maximum (FWHM) = 4mm), bandpass filtering (0.01–0.1 Hz), and linear and quadratic detrending. In addition, the first five rsfMRI volumes were discarded to avoid the unsteady state of magnetization and the potential edge effect of temporal filtering. These procedures generated the preprocessed rsfMRI at individual space, from which the gBOLD and CSF signals were extracted. Similar to the approach of Fultz et al.,41 we skipped the nuisance regression of gBOLD and CSF signal since these variables were the focus of the current study. Head motion also may affect the gBOLD signal,34 and we thus tested its effects separately by regarding the head motion as a confounding factor as described below. To derive the fMRI-based drowsiness index34 (see below), we further registered spatially the rsfMRI images to the standard MNI-152 space55 (spatial resolution: 3×3×3 mm) and (temporally) standardized signals of each voxel to Z scores.
Because there is a great deal of research related to early-stage Alzheimer’s disease,56–59 we quantified entorhinal cortex (ERC) thickness and hippocampal volume from both hemispheres using Free-Surfer (version 5.1.0) from T1-weighted images.60 These two markers for early-stage or preclinical Alzheimer’s were selected because Parkinson’s subjects in our cohort have relatively high MoCA scores (mean MoCA = 24.8) compared to that for diagnosing Alzheimer’s (MoCA < 18).61 The process included motion correction, tissue classification, brain extraction, registration, and segmentation of gray matter volumetric structures, such as the ERC and hippocampus. To control for inter-subject variability of brain size, we normalized the ERC thickness and hippocampal volume with estimated total brain tissue volume.62
Coupling between gBOLD signal and CSF flow
The gBOLD signal was extracted from the gray matter region.33,63 It was defined based on the Harvard-Oxford cortical and subcortical structural atlases.64 The gray-matter mask was transformed from the MNI-152 space back to the original space of each subject following a previous study.41 The fMRI signal temporally was Z-normalized and then spatially averaged across all gray matter voxels. The resulting gBOLD signal reflects the amplitude and synchronization level of global brain activity. The CSF signal was extracted from the bottom slice of the fMRI acquisition near the bottom of the cerebellum and normalized by the temporal mean to percentage change. This bottom slice is expected to have maximal sensitivity to inflow effects:65 CSF inflow from outside the fMRI acquisition volume, which has not experienced repeated radiofrequency pulses, would increase the fMRI signal.41 The mask of CSF regions was obtained manually based on increased image intensity compared to surrounding brain regions in T2*-weighted fMRI and confirmed with T1-weighted MRI images.
Following procedures from Fultz et al.,41 the cross-correlation function first was calculated between the gBOLD and CSF signals to quantify their cross-correlations at different time lags (the gBOLD was regarded as the reference). The gBOLD-CSF cross-correlation at the time lag of +4 seconds, where the negative peak was found, was employed to quantify the gBOLD-CSF coupling for each subject. We also calculated the cross-correlation function between the negative first-order derivative of the gBOLD signal and the CSF signal to compare with findings from Fultz et al.41 We tested the statistical significance for the gBOLD-CSF cross-correlations using a permutation approach, which randomly matched the gBOLD and CSF signals from different subjects and then build a null distribution (10,000 times) based on their correlations.
Comparison of gBOLD-CSF coupling and association with clinical metrics
A linear regression first was conducted between the gBOLD-CSF coupling and age, and the two-sample t-test then was used to compare the gBOLD-CSF coupling between males and females. After these two initial analyses, the age- and gender-adjusted gBOLD-CSF coupling was used for all subsequent analyses described below.
We compared gBOLD-CSF coupling among control, PD-MCI (MoCA < 26), and PD-non-MCI (MoCA ≥ 26) subjects using the two-sample t-test. We then used Spearman’s correlations to quantify associations between gBOLD-CSF coupling and various clinical measures, including MoCA scores, MDS-UPDRS scores, ERC thickness, and hippocampal volumes. These correlational analyses were conducted within the control (if applicable) and PD groups, as well as the entire group of subjects. In addition, the gBOLD-CSF coupling was correlated with the normalized thickness of all cortical regions across PD subjects as a supplementary whole brain analysis.
We further evaluated the potential effects of multiple factors, including high-leverage data points, disease duration, head motion, arousal state, and medication status, on the association between the gBOLD-CSF coupling and MoCA score. We re-ran the correlation between the two after excluding two high-leverage data points with MoCA < 15, as well as controlling for disease duration. We estimated head motion, drowsiness/sleepiness level of subjects, and medication status, and then re-tested the association between gBOLD-CSF coupling and MoCA controlling for these factors. For head motion, we quantified framewise displacement (FD), defined as the sum of the absolute values of six motion parameters,66 and then took its within-session mean to quantify individual subject head motion.34 For the arousal state, we adapted an fMRI-based drowsiness index.34,67 Briefly, we computed the spatial correlation between each rsfMRI volume and a pre-defined drowsiness template derived previously28 and then took the envelope amplitude of this spatial correlation as an estimation of instantaneous brain arousal level. This drowsiness index then was averaged within each session to represent the overall drowsiness level of each subject and included in the correlation analysis.
Statistical analysis
In summary, the two-sample t-test was used for group comparisons of continuous demographic and clinical measures, whereas the Fisher exact test was utilized for categorical metrics.68 The permutation test was used to assess the statistical significance of the gBOLD-CSF correlations tested. Spearman’s correlation was used to quantify inter-subject associations between the gBOLD-CSF coupling and various clinical measures in order to account for the potential non-normality of these variables. P-values < 0.05 were considered statistically significant. We corrected for multiple comparisons using the Bonferroni method.69
Results
Participant characteristics
Demographic and clinical data are presented in Table 1. PD participants on average were 3-years older than controls (p = 0.027). The two groups had similar numbers of males and females (p = 0.58). PD participants had an average disease duration of 6.6 ± 5.7 years, and significantly lower MoCA scores (p = 0.009) than controls. There were approximately equal numbers of normal cognition PD patients (MoCA ≥ 26, N = 29) and those with MCI (MoCA < 26, N = 31).
Table 1:
Characteristics of the cohort
| Controls (N=58) | PD (N=60) | P value | |
|---|---|---|---|
| Age, y | 61.4 (8.0) | 64.7 (8.2) | 0.027 |
| Gender (Male/ Female) | 31/27 | 36/24 | 0.58 |
| Disease duration, y | — | 6.6 (5.7) | — |
| UPDRS-I | — | 10.6 (7.9) | — |
| UPDRS-II | — | 9.4 (8.5) | — |
| UPDRS-III | — | 22.2 (20.0) | — |
| LEDD, mg | — | 736 (487) | — |
| MoCA | 26.5 (2.6) | 24.8 (4.1) | 0.009 |
Data represent the mean and standard deviation (in parentheses) unless otherwise indicated. Pairwise comparisons were performed based on the two-sample t-test for all measures except for gender that used the Fisher exact test.
Abbreviation: PD, Parkinson’s disease group; UPDRS: Unified Parkinson’s Disease Rating Scale; LEDD: levodopa equivalent daily dose; MoCA: Montreal Cognitive Assessment.
gBOLD signal is coupled to CSF signal changes
We first examined whether the gBOLD signal is coupled to strong CSF signal changes in this Parkinson’s dataset. As shown in a representative control, changes in the gBOLD signal are associated with large CSF signal changes (Fig. 1B, black and gray arrows). The mean gBOLD-CSF cross-correlation function was characterized by a positive peak (r = 0.28; p < 0.0001; permutation test, N = 10,000) around the −4-sec lag (i.e., correlation with shifting CSF ahead of time by 4 sec), whereas there was a negative peak (r = −0.28; p < 0.0001) at the lag of +4 sec (Fig. 1C, left panel). The cross-correlation function between the CSF signal and the negative first-order derivative of the gBOLD signal displayed a large positive peak at the zero time-lag (r = 0.37; p < 0.0001). Overall, both cross-correlation functions (Fig. 1C) showed patterns consistent with the data of Fultz et al.,41 confirming a systematic coupling between the global brain signal and CSF flow.
Fig. 1. Systematic coupling between the gBOLD and CSF signals measured by rsfMRI.
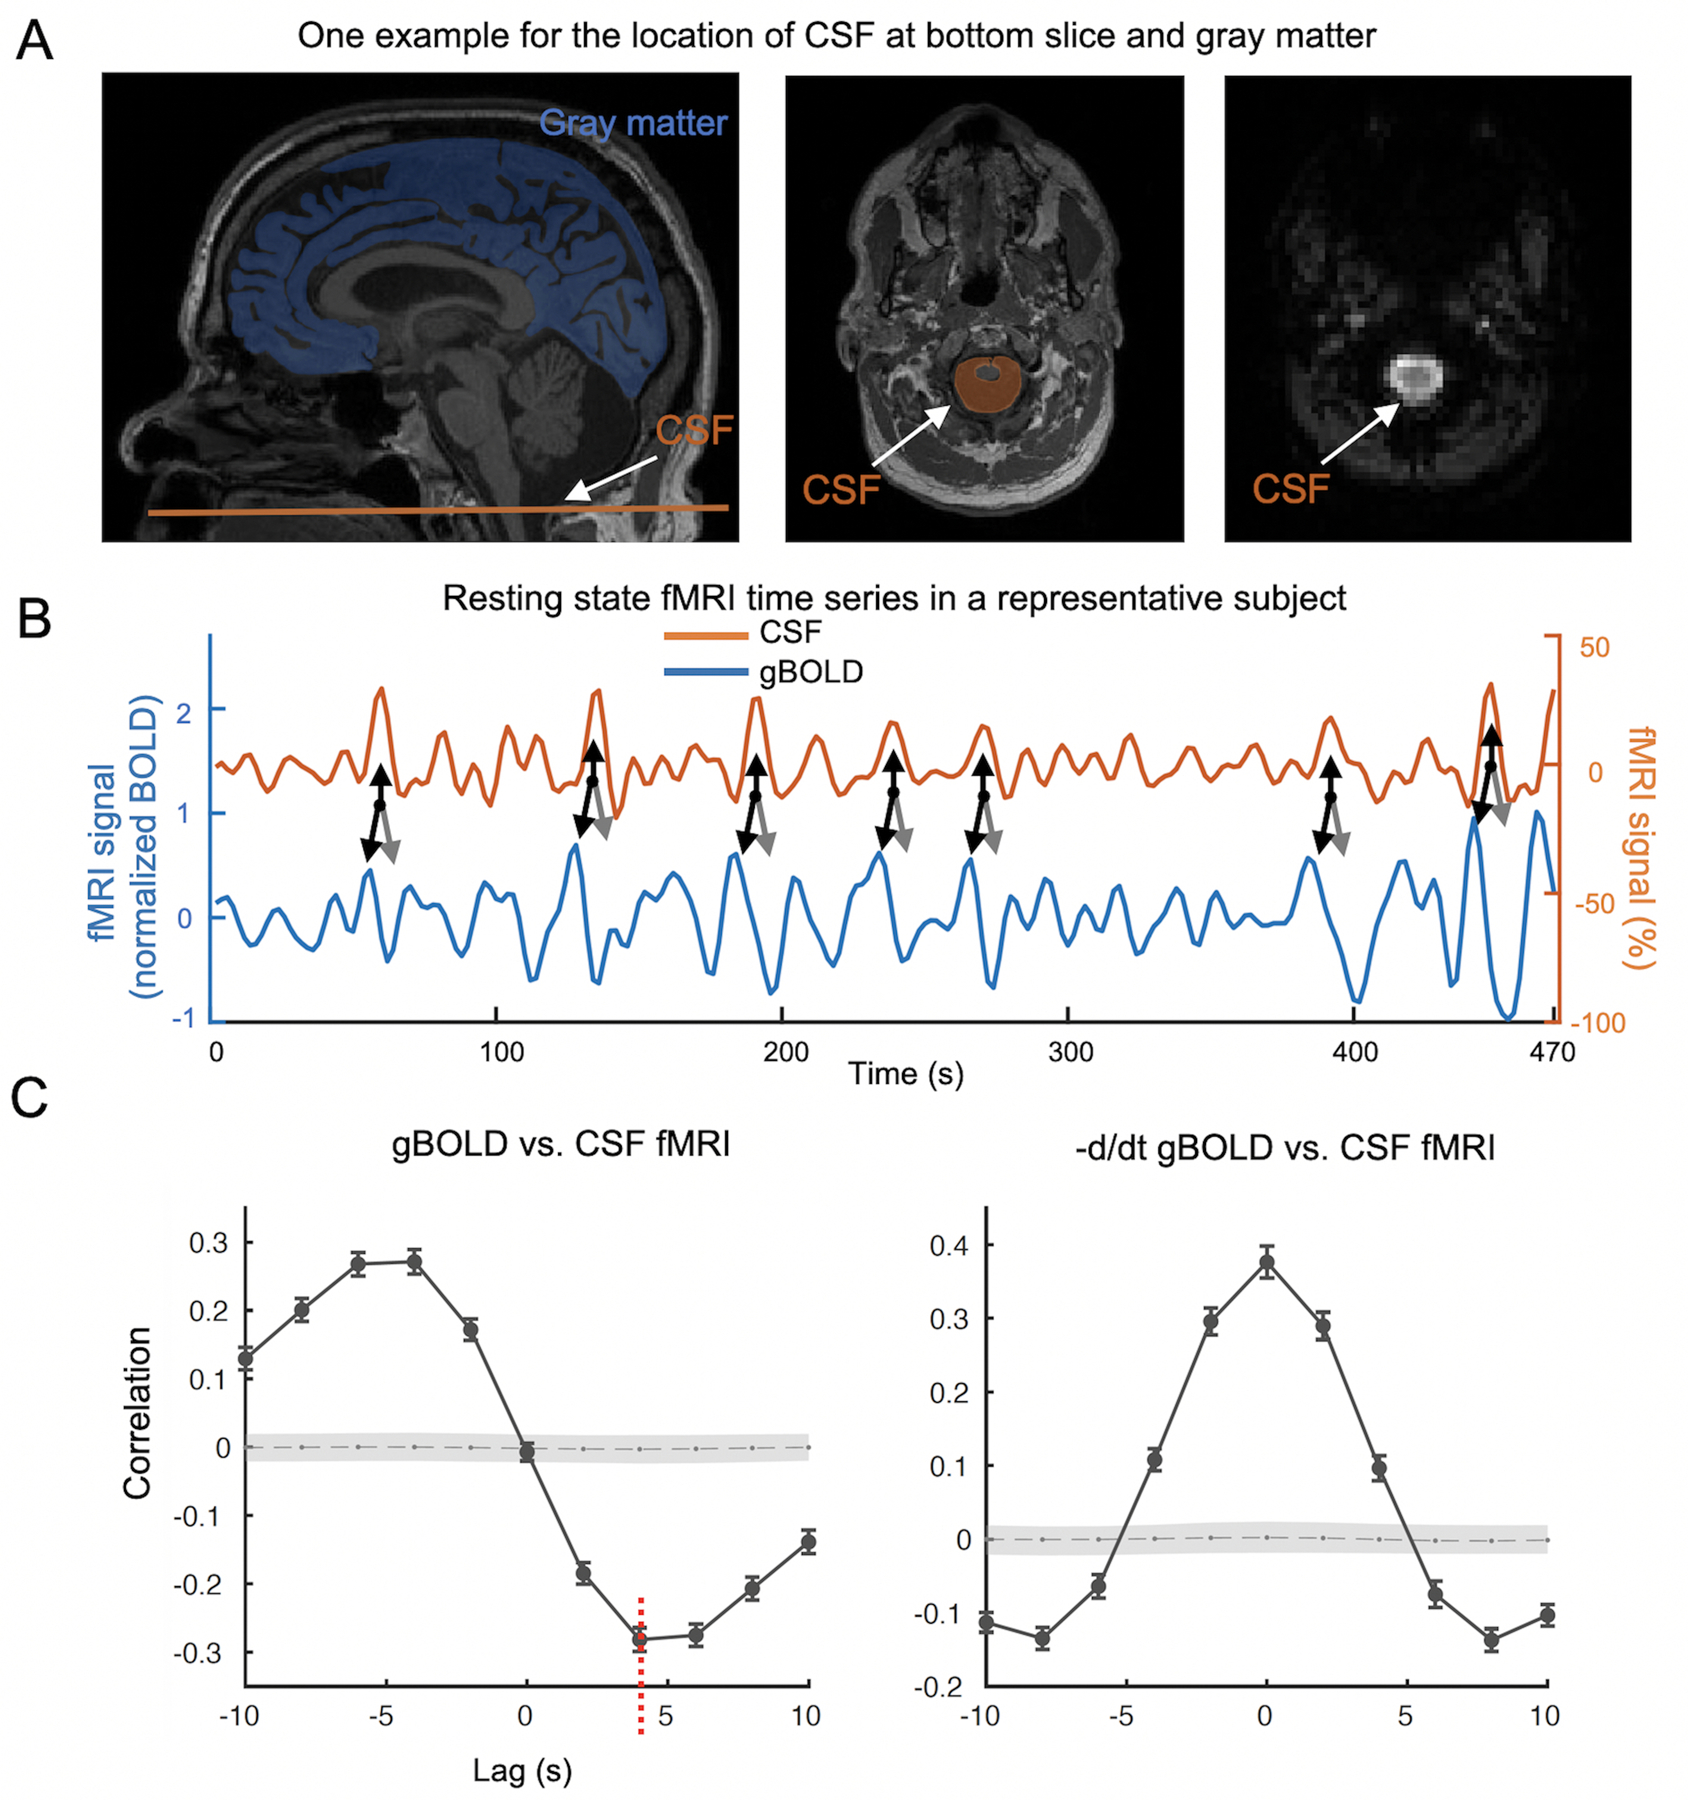
(A) The gBOLD and CSF fMRI signals were extracted from the whole-brain gray matter regions (the blue mask on a T1-weighted structural MRI in the left panel) and the CSF region at the bottom slice of the fMRI acquisition (the bright region in the right panel and the orange-shaded area in the middle panel), respectively. (B) The gBOLD and CSF signal from a representative subject (control) showed corresponding changes of large amplitude. Large CSF peaks (upwards black arrows) often are preceded by a large positive gBOLD peak (downwards black arrows) and followed by a large negative gBOLD peak (gray arrows). (C) The averaged cross-correlation function (N =118 subjects) between the gBOLD signal (reference) and the CSF signal (left), as well as between the first-order negative derivative of gBOLD signal (reference) and the CSF signal (right). The gray dashed line and the shaded region mark 95% confidence intervals for the mean correlation computed on shuffled signals (see Materials and methods for details). The cross-correlations between the gBOLD and CSF signal at the +4 seconds lag (mean r: −0.28; p < 0.0001, permutation test with N =10,000; red dashed line) was used to represent “the gBOLD-CSF coupling” for subsequent analyses.
Comparison of gBOLD-CSF coupling among groups
We tested whether the gBOLD-CSF coupling was affected by age or gender. A significant correlation was found between age and gBOLD-CSF coupling (Fig. 2A; ρ = 0.32, p < 0.001), with increased age associated with weaker (less negative) gBOLD-CSF coupling. No significant difference (p = 0.44) in gBOLD-CSF coupling was found between males and females. For scientific rigor, we controlled for the age and gender effects on gBOLD-CSF coupling for all subsequent analyses.
Fig. 2. The associations of gBOLD-CSF coupling to age, disease condition, and MoCA.
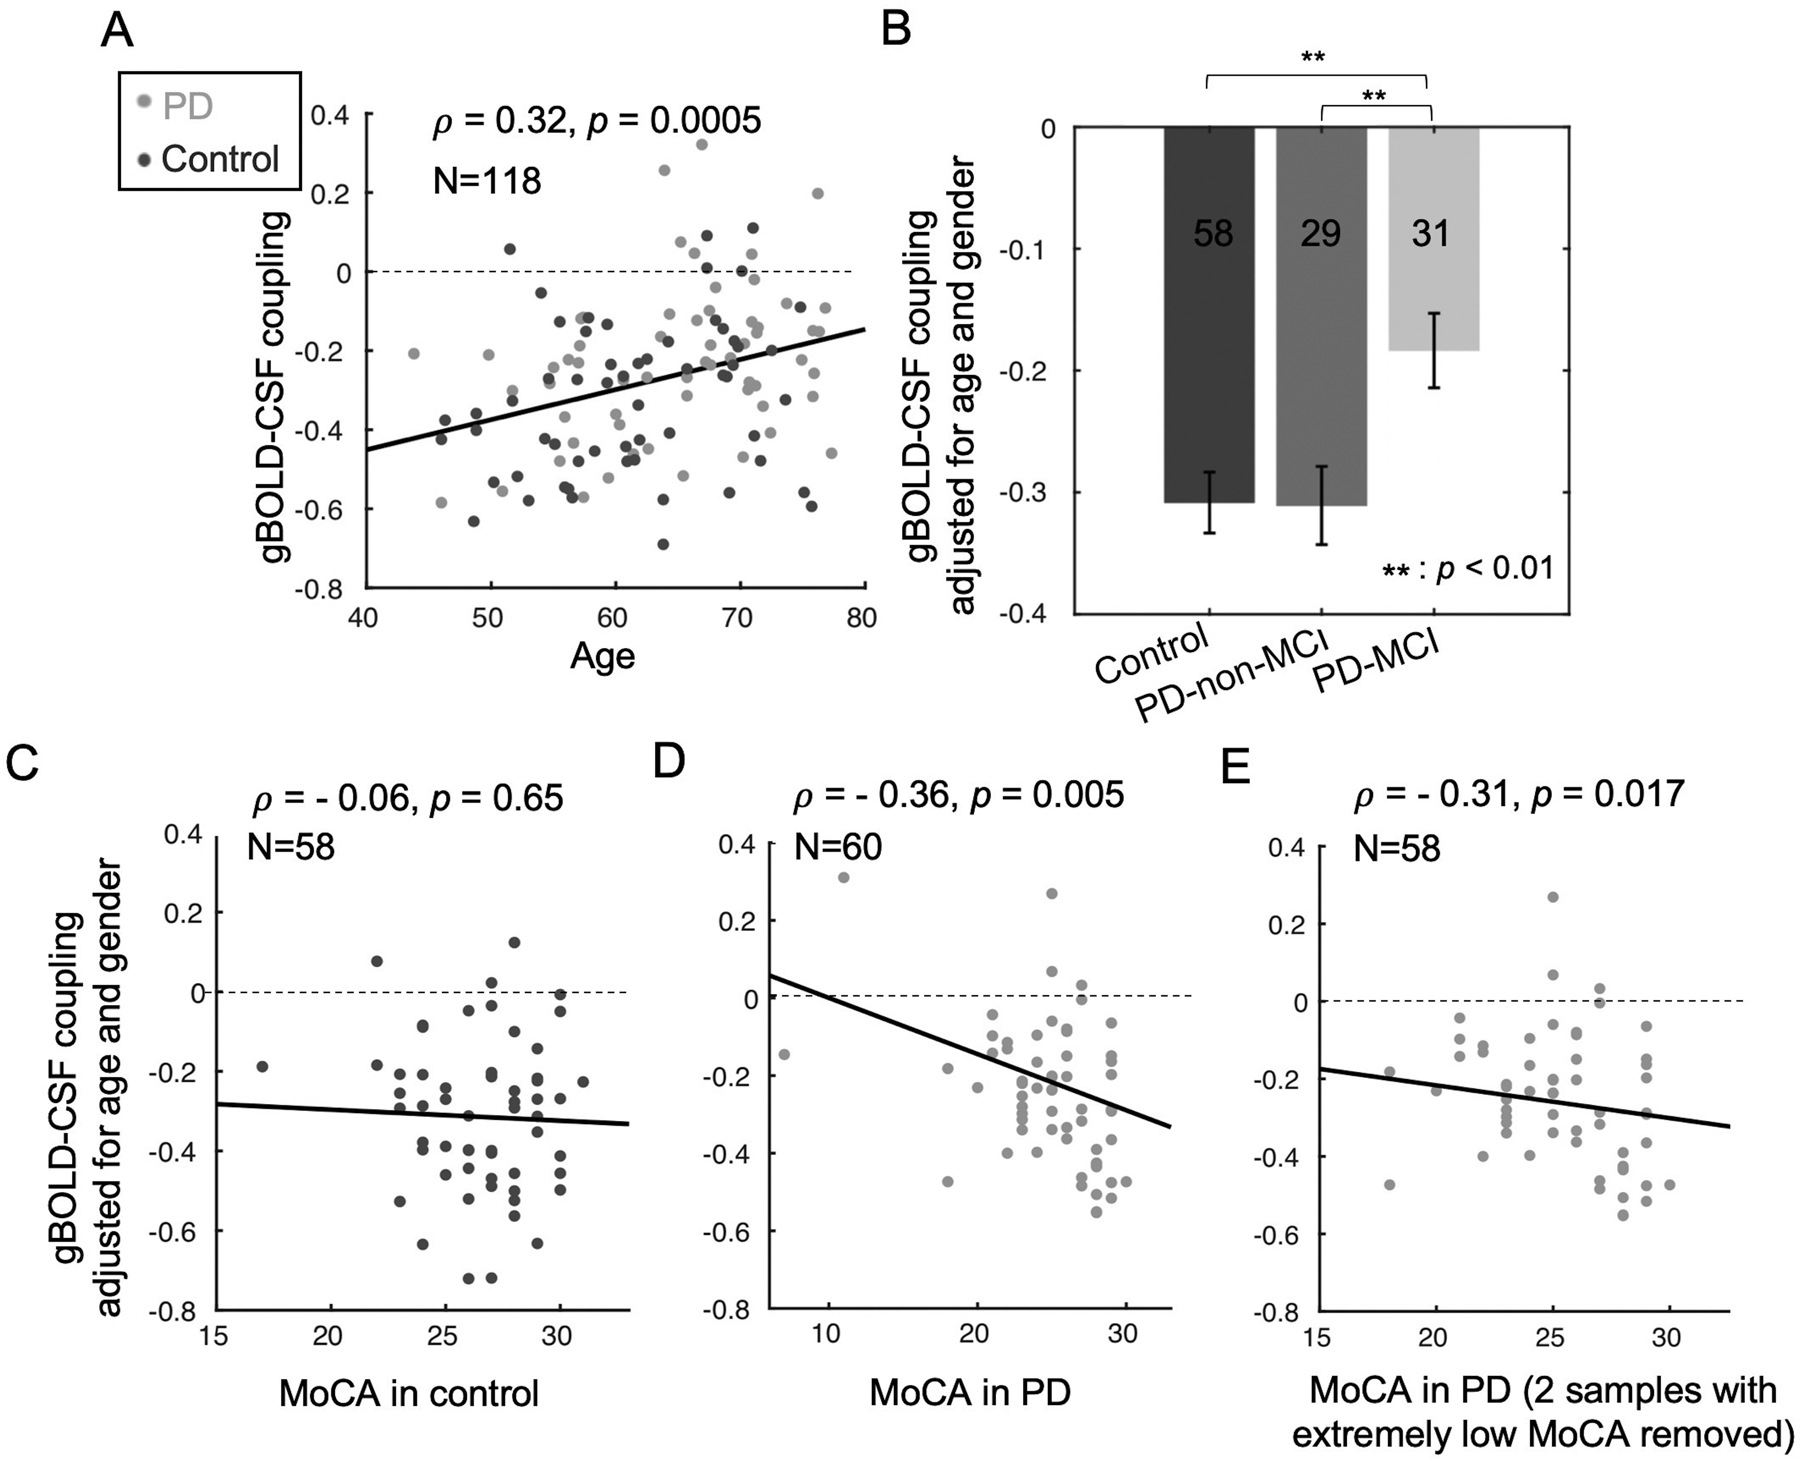
(A) Older subjects have a weaker (less negative) gBOLD-CSF coupling (Spearman’s ρ = 0.32, p = 0.0005). (B) Compared with controls and PD-non-MCI subjects, PD-MCI subjects have decreased gBOLD-CSF coupling strength (adjusted for age and gender; p ≤ 0.006, two-sample t-test). (C-D) The correlation between the gBOLD-CSF coupling (adjusted for age and gender) and MoCA scores is significant in the PD group (ρ = −0.36, p = 0.005, pBonferroni = 0.01; D) but not in the controls (ρ = −0.06, p = 0.65; C). (E) The significant correlation between gBOLD-CSF coupling and MoCA within PD subjects remained significant when removing the two subjects with extremely low MoCA scores (ρ = −0.31, p = 0.017, pBonferroni = 0.034). The dashed lines indicate where the gBOLD-CSF coupling equals zero.
The gBOLD-CSF coupling metric then was compared among groups. PD-MCI subjects showed significantly weaker gBOLD-CSF coupling (Fig. 2B) than controls (p = 0.003) and PD-non-MCI (p = 0.006) subjects. gBOLD-CSF coupling strength, however, was not different between control and PD-non-MCI subjects (p = 0.96).
Association between gBOLD-CSF coupling and cognitive and PD measures
The gBOLD-CSF coupling then was correlated with various clinical and structural measurements. Consistent with comparisons across disease groups, weaker (less negative) gBOLD-CSF coupling was correlated with lower MoCA scores across all PD subjects (ρ = −0.36, p = 0.005, pBonferroni = 0.01, Fig. 2D), but not across the controls (ρ = −0.06, p = 0.65, Fig. 2C). The Parkinson’s-specific gBOLD-CSF coupling/MoCA associations remained significant (ρ = −0.31, p = 0.017, pBonferroni = 0.034, Fig. 2E) when excluding two subjects with very low MoCA scores. The association across the entire group of subjects also was significant (p < 0.05) (Suppl. Fig. 1). The coupling-MoCA association remained significant after controlling for disease duration (Suppl. Fig. 2), head motion (Suppl. Fig. 3), drowsiness score (Suppl. Fig. 4), and medication status (Suppl. Fig. 5). As seen in Suppl. Fig. 6, there was no significant correlation found between the gBOLD-CSF coupling and any of the MDS-UPDRS motor (UPDRS-II, p = 0.80, UPDRS-III, p = 0.27); or non-motor (UPDRS-I, p = 0.49) subscores.
Association of BOLD-CSF coupling strength with structural changes in Parkinson’s
Weaker (less negative) gBOLD-CSF coupling was associated significantly with a thinner right ERC region (ρ = −0.36, p = 0.012, pBonferroni = 0.024, Fig. 3A), whereas only a trend was found for the left ERC thickness (ρ = −0.19, p = 0.19, pBonferroni = 0.38, Fig. 3B). Weaker gBOLD-CSF coupling was not associated with lower hippocampal volume bilaterally (p > 0.05; Suppl. Figs. 7A–B). There was no correlation between gBOLD-CSF coupling and ERC thickness or hippocampal volume in the control group (p > 0.05; see Suppl. Fig. 8). A follow-up whole brain analysis suggested the weaker gBOLD-CSF coupling strength (less negative) was associated with thinner cortex across the entire brain (Suppl. Fig. 9) with the most significant regions largely overlapped with the regions showing cortical thinning in prodromal AD patients, including the ERC.70
Fig. 3. Associations between gBOLD-CSF coupling and thickness of the entorhinal cortex in PD patients.
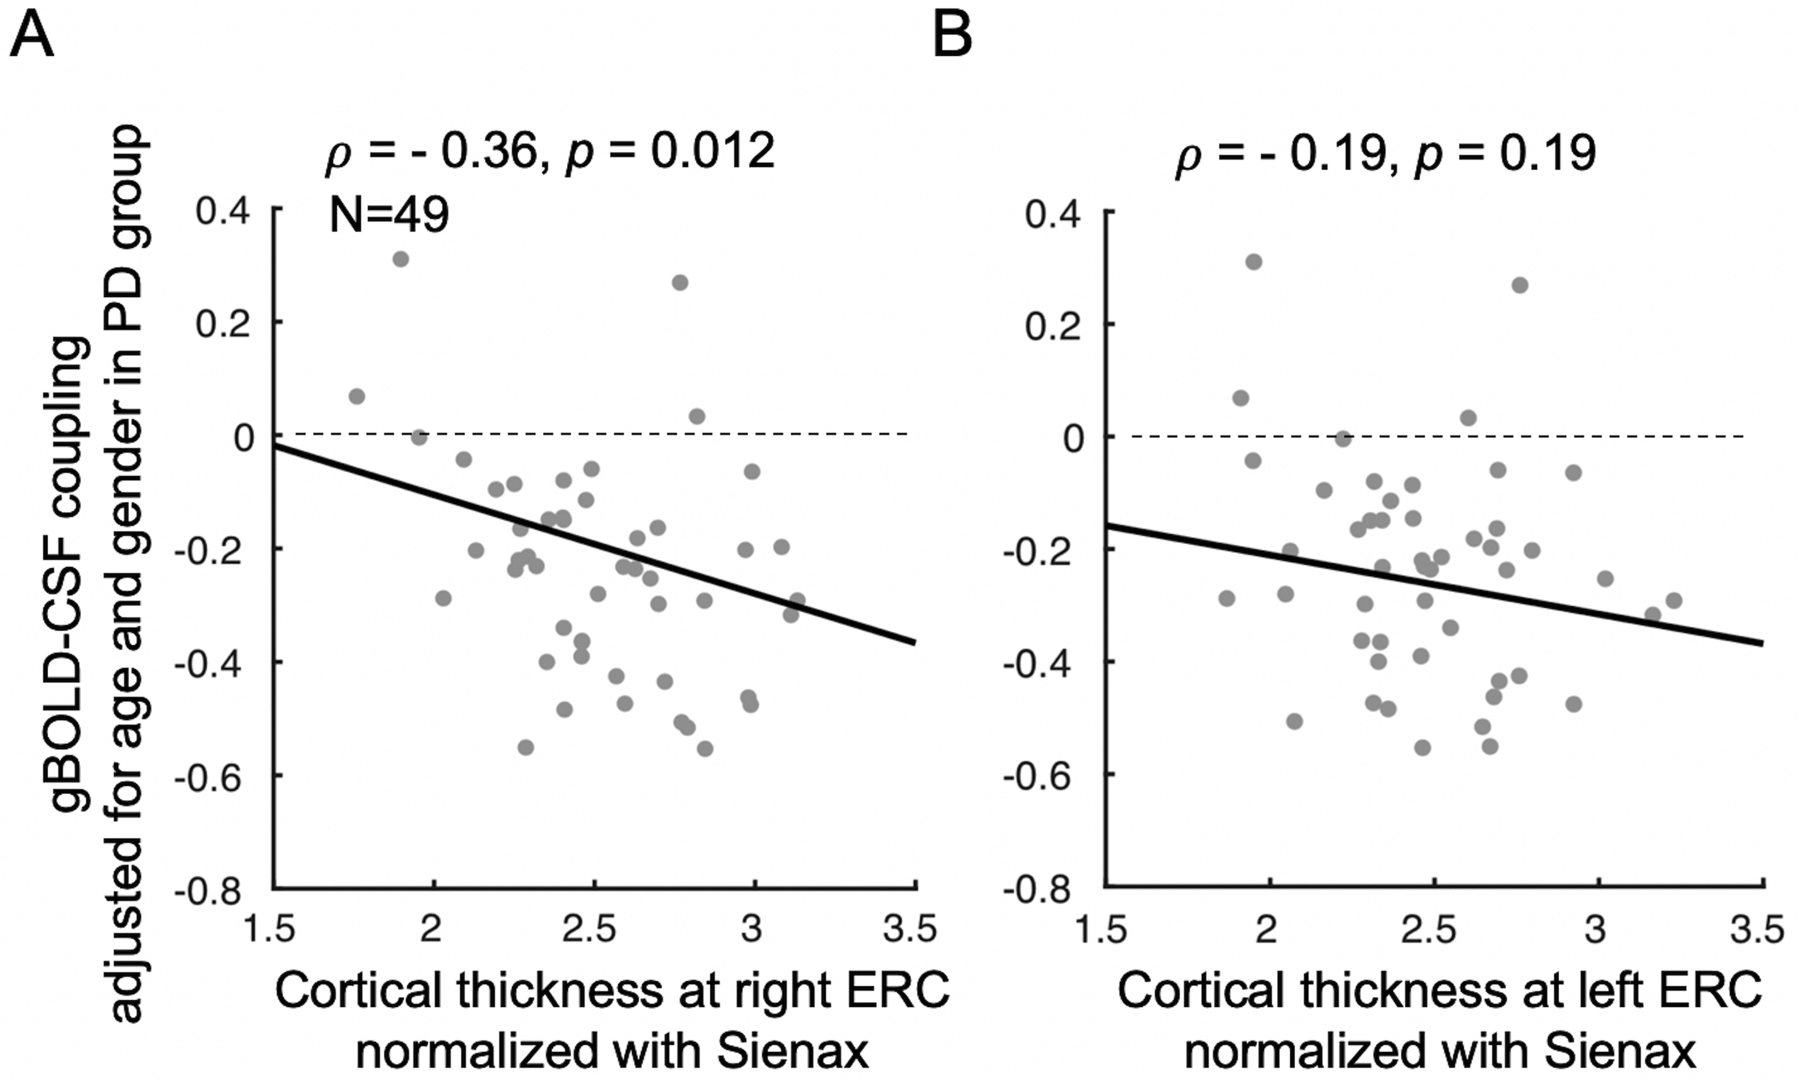
The PD patients with thinner right ERC tend to have weaker gBOLD-CSF coupling (Spearman’s ρ = −0.36, p = 0.012, pBonferroni = 0.024) (A). This association is similar but not significant (ρ = −0.19, p = 0.19, pBonferroni = 0.38) for the left ERC (B). The ERC thickness was normalized with the Sienax index.62
Discussion
The current study demonstrated a strong coupling between global brain activity and CSF flow using rsfMRI data obtained both from Parkinson’s and control subjects, consistent with the idea that gBOLD-CSF coupling is related to glymphatic function. The strength of this gBOLD-CSF coupling was significantly lower in those Parkinson’s patients with cognitive impairment compared to either controls or Parkinson’s patients without cognitive dysfunction. Moreover, the gBOLD-CSF coupling strength was correlated with cognitive scores, but only in Parkinson’s patients and not controls, suggesting it is linked to Parkinson’s-related processes. No correlation was found between gBOLD-CSF coupling and UPDRS motor or non-motor scores, suggesting it is related specifically to a cognitive component of Parkinson’s. The reduced gBOLD-CSF coupling also was associated with a thinner ERC that has been observed in early-stage Alzheimer’s. Although we speculate a possible contribution of Alzheimer’s-like pathology to PD-MCI, further studies are needed to understand the mechanism(s) underlying our finding. Nonetheless, these data suggest that gBOLD-CSF coupling is a potential non-invasive marker for the glymphatic function that may be related to dementia pathology.
The link of gBOLD-CSF coupling to the glymphatic system may underlie its association with cognitive dysfunction in PD
Resting-state gBOLD-CSF coupling likely results from highly coordinated neural and physiological processes that are linked closely to glymphatic clearance. First, the resting-state gBOLD signal shows a similar sleep dependency as glymphatic function, and is strongly promoted by drowsiness and sleep.26,27,71,72 Sleep deprivation71 and hypnotic drugs (e.g., midazolam)73 significantly enhance the gBOLD signal, whereas caffeine has the opposite effect.72 It became clear recently that the large gBOLD peaks reflect transient arousal modulations of 10–20 sec.28 Second, this gBOLD signal is accompanied by slow (<0.1 Hz) but strong physiological modulations of cardiac,29–31 respiratory,33,34 and arterial35 signals. These physiological functions have been hypothesized to drive glymphatic CSF flow36–40, and could be mediated through the autonomic system at transient arousal variations represented by the large gBOLD peaks.29 Among them, spontaneous low-frequency modulations in vessel tone have been directly linked to perivascular clearance.74 Thus, the gBOLD signal and associated physiological modulations should provide sleep-dependent dynamics for CSF flow that could be essential for assessing the glymphatic system. Lastly, strong CSF movements were, indeed, found coupled to the large gBOLD signal,41 as confirmed in the present study, adding a new piece of evidence for their relevance to the glymphatic system. Together, the potential link of these low-frequency neural and physiological dynamics to the glymphatic system could help explain the association we found between gBOLD-CSF coupling and cognitive dysfunction in Parkinson’s.
gBOLD-CSF coupling may be a new functional metric for cognitive decline
As summarized in the introduction, there is recent evidence for the glymphatic system being involved in the clearance of toxic misfolded proteins that may include α-synuclein,12,13 amyloid-β,14 and tau.15 These proteins are involved in cognitive decline,7,42,45,46 thus anything that impedes their clearance may hasten detrimental processes. The initial test of this hypothesis in the current study indicated that gBOLD-CSF coupling was decreased significantly only in Parkinson’s patients with cognitive decline. It also was correlated with cognitive MoCA scores, but not with motor and other non-motor symptoms measured by MDS-UPDRS scores. Together, these data provide the first evidence that gBOLD-CSF coupling may serve as a new, non-invasive, functional metric for quantifying cognitive decline, and warrants future studies of its relationship to the ultimate development of dementia in PD.
gBOLD-CSF coupling is associated with structural brain changes
The present study showed that weaker gBOLD-CSF coupling was associated with a thinner right ERC, although correlations with left ERC thickness or bilateral hippocampal volumes were not statistically significant. Right ERC thinning and early loss of ERC symmetry has been suggested as a marker for preclinical Alzheimer’s.75,76 In Alzheimer’s patients, gray matter loss in the right ERC has been shown to occur earlier and be larger than in other brain regions.75 Because the ERC is one of the earliest affected cortical regions in both Alzheimer’s and Parkinson’s,77–79 we speculate this may reflect AD co-pathology. It remains to be determined, however, whether the ERC atrophy associated with gBOLD-CSF reduction simply reflects a change generally associated with cognitive decline or some other unspecified pathophysiological process.
Limitations and future directions
The present study linked gBOLD-CSF coupling to cognitive dysfunction in PD, but one clear limitation was that it did not directly link gBOLD-CSF coupling to the accumulation of toxic chemical species (proteins or small molecules). This provides a fertile area for the mechanistic understanding of the association of gBOLD-CSF coupling with cognitive impairment. Future studies should include quantification of α-synuclein and tau in brain and CSF. The MoCA score has limited diagnostic accuracy for PD-MCI,80 and future studies may need to combine other neuropsychological tests for defining PD-MCI and quantifying more specific domains of cognitive function. It also is important to explore other markers that result from the same low-frequency global brain activity and physiological modulations, and to relate them to the prognosis and progression of Parkinson’s disease dementia. To tease out the role of cardiorespiratory pulsations, fast fMRI methods25,81 may be used to separate and compare the contributions of these low-frequency neural/physiological dynamics and those of cardiac and respiratory frequencies to PD dementia. In addition, it also would be interesting to know whether the changes in gBOLD-CSF are related to autonomic disturbances widely observed in PD.82,83 Finally, despite the recent evidence, the relationship between gBOLD-CSF coupling and the glymphatic system remains hypothetical, and direct evidence using both murine and non-human primate models will be very important.
Supplementary Material
Acknowledgements
We thank Jiaxuan Diao for preparing some figures and reviewing the manuscript.
Financial disclosure and conflict of interest statement:
This work was supported by the National Institutes of Health (NIH) Pathway to Independence Award (K99/R00 5R00NS092996-03), the Brain Initiative award (1RF1MH123247-01), and the NIH R01 award (1R01NS113889-01A1). This work was also supported by the National Institute of Neurological Disorders and Stroke Parkinson’s Disease Biomarker Program (NS06722 and NS112008 to X.H), the National Institute of Aging (AG067651 to G.B), the Hershey Medical Center General Clinical Research Center (National Center for Research Resources, Grant UL1 RR033184 that is now at the National Center for Advancing Translational Sciences, Grant UL1 TR000127), the PA Department of Health Tobacco CURE Funds, and the Penn State Translational Brain Research Center. The authors report no financial interests or potential conflicts of interest.
References
- 1.Parkinson J. An essay on shaking palsy. 1817; 14: 223–236. [DOI] [PubMed] [Google Scholar]
- 2.Venda LL, Cragg SJ, Buchman VL, Wade-Martins R. α-Synuclein and dopamine at the crossroads of Parkinson’s disease. Trends Neurosci. 2010; 33: 559–568. [DOI] [PMC free article] [PubMed] [Google Scholar]
- 3.Aarsland D, Kurz MW. The epidemiology of dementia associated with Parkinson disease. J. Neurol. Sci 2010; 289: 18–22. [DOI] [PubMed] [Google Scholar]
- 4.Mattila PM, Rinne JO, Helenius H, Dickson DW, Röyttä M. Alpha-synuclein-immunoreactive cortical Lewy bodies are associated with cognitive impairment in Parkinson’s disease. Acta Neuropathol. 2000; 100: 285–290. [DOI] [PubMed] [Google Scholar]
- 5.Hurtig HI, Trojanowski JQ, Galvin J, et al. Alpha-synuclein cortical Lewy bodies correlate with dementia in Parkinson’s disease. Neurology. 2000; 54: 1916–1921. [DOI] [PubMed] [Google Scholar]
- 6.Lei P, Ayton S, Finkelstein DI, et al. Tau protein: Relevance to Parkinson’s disease. Int. J. Biochem. Cell Biol 2010; 42: 1775–1778. [DOI] [PubMed] [Google Scholar]
- 7.Zhang X, Gao F, Wang D, et al. Tau pathology in Parkinson’s disease. Front. Neurol 2018; 9. [DOI] [PMC free article] [PubMed] [Google Scholar]
- 8.Goris A, Williams-Gray CH, Clark GR, et al. Tau and α-synuclein in susceptibility to, and dementia in, Parkinson’s disease. Ann. Neurol 2007; 62: 145–153. [DOI] [PubMed] [Google Scholar]
- 9.Vermersch P, Delacourte A, Javoy‐Agid F, Hauw J‐J, Agid Y. Dementia in Parkinson’s disease: Biochemical evidence for cortical involvement using the immunodetection of abnormal tau proteins. Ann. Neurol 1993; 33: 445–450. [DOI] [PubMed] [Google Scholar]
- 10.Irwin DJ, Grossman M, Weintraub D, et al. Neuropathological and genetic correlates of survival and dementia onset in synucleinopathies: a retrospective analysis. Lancet Neurol. 2017; 16: 55–65. [DOI] [PMC free article] [PubMed] [Google Scholar]
- 11.Jessen NA, Munk ASF, Lundgaard I, Nedergaard M. The Glymphatic System: A Beginner’s Guide. Neurochem. Res 2015; 40: 2583–2599. [DOI] [PMC free article] [PubMed] [Google Scholar]
- 12.Sundaram S, Hughes RL, Peterson E, et al. Establishing a framework for neuropathological correlates and glymphatic system functioning in Parkinson’s disease. Neurosci. Biobehav. Rev 2019; 103: 305–315. [DOI] [PMC free article] [PubMed] [Google Scholar]
- 13.Valdinocci D, Radford RAW, Goulding M, et al. Extracellular interactions of Alpha-synuclein in multiple system atrophy. Int. J. Mol. Sci 2018; 19: 4219. [DOI] [PMC free article] [PubMed] [Google Scholar]
- 14.Tarasoff-Conway JM, Carare RO, Osorio RS, et al. Clearance systems in the brain - Implications for Alzheimer disease. Nat. Rev. Neurol 2015; 11: 457–470. [DOI] [PMC free article] [PubMed] [Google Scholar]
- 15.Holth JK, Fritschi SK, Wang C, et al. The sleep-wake cycle regulates brain interstitial fluid tau in mice and CSF tau in humans. Science (80-. ) 2019; 363: 880–884. [DOI] [PMC free article] [PubMed] [Google Scholar]
- 16.Mestre H, Mori Y, Nedergaard M. The Brain’s Glymphatic System: Current Controversies. Trends Neurosci. 2020; 43: 458–466. [DOI] [PMC free article] [PubMed] [Google Scholar]
- 17.Musiek ES, Xiong DD, Holtzman DM. Sleep, circadian rhythms, and the pathogenesis of Alzheimer disease. Exp. Mol. Med 2015; 47: e148. [DOI] [PMC free article] [PubMed] [Google Scholar]
- 18.Xie L, Kang H, Xu Q, et al. Sleep drives metabolite clearance from the adult brain. Science (80-. ) 2013; 342: 373–377. [DOI] [PMC free article] [PubMed] [Google Scholar]
- 19.Iliff JJ, Wang M, Liao Y, et al. A paravascular pathway facilitates CSF flow through the brain parenchyma and the clearance of interstitial solutes, including amyloid β. Sci. Transl. Med 2012; 4: 147. [DOI] [PMC free article] [PubMed] [Google Scholar]
- 20.Iliff JJ, Lee H, Yu M, et al. Brain-wide pathway for waste clearance captured by contrast-enhanced MRI. J. Clin. Invest 2013; 123: 1299–1309. [DOI] [PMC free article] [PubMed] [Google Scholar]
- 21.Eide PK, Ringstad G. MRI with intrathecal MRI gadolinium contrast medium administration: a possible method to assess glymphatic function in human brain. Acta Radiol. Open 2015; 4: 1–5. [DOI] [PMC free article] [PubMed] [Google Scholar]
- 22.Ringstad G, Valnes LM, Dale AM, et al. Brain-wide glymphatic enhancement and clearance in humans assessed with MRI. JCI insight. 2018; 3: e121537. [DOI] [PMC free article] [PubMed] [Google Scholar]
- 23.Taoka T, Masutani Y, Kawai H, et al. Evaluation of glymphatic system activity with the diffusion MR technique: diffusion tensor image analysis along the perivascular space (DTI-ALPS) in Alzheimer’s disease cases. Jpn. J. Radiol 2017; 35: 172–178. [DOI] [PubMed] [Google Scholar]
- 24.Harrison IF, Siow B, Akilo AB, et al. Non-1 invasive imaging of CSF-mediated brain clearance pathways via assessment of perivascular fluid movement with diffusion tensor MRI. Elife. 2018; 7: e34028. [DOI] [PMC free article] [PubMed] [Google Scholar]
- 25.Kiviniemi V, Wang X, Korhonen V, et al. Ultra-fast magnetic resonance encephalography of physiological brain activity-Glymphatic pulsation mechanisms? J. Cereb. Blood Flow Metab 2016; 36: 1033–1045. [DOI] [PMC free article] [PubMed] [Google Scholar]
- 26.Fukunaga M, Horovitz SG, van Gelderen P, et al. Large-amplitude, spatially correlated fluctuations in BOLD fMRI signals during extended rest and early sleep stages. Magn. Reson. Imaging 2006; 24: 979–972. [DOI] [PubMed] [Google Scholar]
- 27.Horovitz SG, Fukunaga M, De Zwart JA, et al. Low frequency BOLD fluctuations during resting wakefulness and light sleep: A simultaneous EEG-fMRI study. Hum. Brain Mapp 2008; 29: 671–682. [DOI] [PMC free article] [PubMed] [Google Scholar]
- 28.Liu X, De Zwart JA, Schölvinck ML, et al. Subcortical evidence for a contribution of arousal to fMRI studies of brain activity. Nat. Commun 2018; 9: 395. [DOI] [PMC free article] [PubMed] [Google Scholar]
- 29.Özbay PS, Chang C, Picchioni D, et al. Contribution of systemic vascular effects to fMRI activity in white matter. Neuroimage. 2018; 176: 541–549. [DOI] [PMC free article] [PubMed] [Google Scholar]
- 30.Shmueli K, van Gelderen P, de Zwart JA, et al. Low-frequency fluctuations in the cardiac rate as a source of variance in the resting-state fMRI BOLD signal. Neuroimage. 2007; 38: 306–320. [DOI] [PMC free article] [PubMed] [Google Scholar]
- 31.Chang C, Cunningham JP, Glover GH. Influence of heart rate on the BOLD signal: The cardiac response function. Neuroimage. 2009; 44: 857–869. [DOI] [PMC free article] [PubMed] [Google Scholar]
- 32.Birn RM, Diamond JB, Smith MA, Bandettini PA. Separating respiratory-variation-related fluctuations from neuronal-activity-related fluctuations in fMRI. Neuroimage. 2006; 31: 1536–1548. [DOI] [PubMed] [Google Scholar]
- 33.Power JD, Plitt M, Gotts SJ, et al. Ridding fMRI data of motion-related influences: Removal of signals with distinct spatial and physical bases in multiecho data. Proc. Natl. Acad. Sci. U. S. A 2018; 115: E2105–E2114. [DOI] [PMC free article] [PubMed] [Google Scholar]
- 34.Gu Y, Han F, Sainburg LE, Liu X. Transient Arousal Modulations Contribute to Resting-State Functional Connectivity Changes Associated with Head Motion Parameters. Cereb. Cortex 2020; 30: 5242–5256. [DOI] [PMC free article] [PubMed] [Google Scholar]
- 35.Tong Y, Yao J (Fiona), Chen JJ, Frederick B de B. The resting-state fMRI arterial signal predicts differential blood transit time through the brain. J. Cereb. Blood Flow Metab 2019; 39: 1148–1160. [DOI] [PMC free article] [PubMed] [Google Scholar]
- 36.Schley D, Carare-Nnadi R, Please CP, Perry VH, Weller RO. Mechanisms to explain the reverse perivascular transport of solutes out of the brain. J. Theor. Biol 2006; 238: 962–974. [DOI] [PubMed] [Google Scholar]
- 37.Iliff JJ, Wang M, Zeppenfeld DM, et al. Cerebral arterial pulsation drives paravascular CSF-Interstitial fluid exchange in the murine brain. J. Neurosci 2013; 33: 18190–18199. [DOI] [PMC free article] [PubMed] [Google Scholar]
- 38.Klose U, Strik C, Kiefer C, Grodd W. Detection of a relation between respiration and CSF pulsation with an echoplanar technique. J. Magn. Reson. Imaging 2000; 11: 438–444. [DOI] [PubMed] [Google Scholar]
- 39.Yamada S, Miyazaki M, Yamashita Y, et al. Influence of respiration on cerebrospinal fluid movement using magnetic resonance spin labeling. Fluids Barriers CNS. 2013; 10: 36. [DOI] [PMC free article] [PubMed] [Google Scholar]
- 40.Mestre H, Tithof J, Du T, et al. Flow of cerebrospinal fluid is driven by arterial pulsations and is reduced in hypertension. Nat. Commun 2018; 9: 4878. [DOI] [PMC free article] [PubMed] [Google Scholar]
- 41.Fultz NE, Bonmassar G, Setsompop K, et al. Coupled electrophysiological, hemodynamic, and cerebrospinal fluid oscillations in human sleep. Science (80-. ) 2019; 366: 628–631. [DOI] [PMC free article] [PubMed] [Google Scholar]
- 42.Stefanis L. α-Synuclein in Parkinson’s disease. Cold Spring Harb. Perspect. Med 2012; 2: a009399. [DOI] [PMC free article] [PubMed] [Google Scholar]
- 43.Emmanouilidou E, Elenis D, Papasilekas T, et al. Assessment of α-synuclein secretion in mouse and human brain parenchyma. PLoS One. 2011; 6: e22225. [DOI] [PMC free article] [PubMed] [Google Scholar]
- 44.Harrison IF, Ismail O, Machhada A, et al. Impaired glymphatic function and clearance of tau in an Alzheimer’s disease model. Brain. 2020; 143: 2576–2 593. [DOI] [PMC free article] [PubMed] [Google Scholar]
- 45.Wills J, Jones J, Haggerty T, et al. Elevated tauopathy and alpha-synuclein pathology in postmortem Parkinson’s disease brains with and without dementia. Exp. Neurol 2010; 225: 210–218. [DOI] [PMC free article] [PubMed] [Google Scholar]
- 46.Irwin DJ, Lee VMY, Trojanowski JQ. Parkinson’s disease dementia: Convergence of α-synuclein, tau and amyloid-β pathologies. Nat. Rev. Neurosci 2013; 14: 626–636. [DOI] [PMC free article] [PubMed] [Google Scholar]
- 47.Hughes AJ, Daniel SE, Kilford L, Lees AJ. Accuracy of clinical diagnosis of idiopathic Parkinson’s disease: A clinico-pathological study of 100 cases. J. Neurol. Neurosurg. Psychiatry 1992; 55: 181–184. [DOI] [PMC free article] [PubMed] [Google Scholar]
- 48.Goetz CG, Fahn S, Martinez-Martin P, et al. Movement disorder society-sponsored revision of the unified Parkinson’s disease rating scale (MDS-UPDRS): Process, format, and clinimetric testing plan. Mov. Disord 2007; 22: 41–47. [DOI] [PubMed] [Google Scholar]
- 49.Lewis MM, Harkins E, Lee EY, et al. Clinical Progression of Parkinson’s Disease: Insights from the NINDS Common Data Elements. J. Parkinsons. Dis 2020; 10: 1075–1085. [DOI] [PMC free article] [PubMed] [Google Scholar]
- 50.Tomlinson CL, Stowe R, Patel S, et al. Systematic review of levodopa dose equivalency reporting in Parkinson’s disease. Mov. Disord 2010; 25: 2649–2653. [DOI] [PubMed] [Google Scholar]
- 51.Nasreddine ZS, Phillips NA, Bédirian V, et al. The Montreal Cognitive Assessment, MoCA: A brief screening tool for mild cognitive impairment. J. Am. Geriatr. Soc 2005; 53: 695–699. [DOI] [PubMed] [Google Scholar]
- 52.Hoops S, Nazem S, Siderowf AD et al. Validity of the MoCA and MMSE in the detection of MCI and dementia in Parkinson disease. Neurology. 2009; 73: 1738–1745. [DOI] [PMC free article] [PubMed] [Google Scholar]
- 53.Dalrymple-Alford JC, MacAskill MR, Nakas CT, et al. The MoCA: Well-suited screen for cognitive impairment in Parkinson disease. Neurology. 2010; 75: 1717–1725. [DOI] [PubMed] [Google Scholar]
- 54.Biswal BB, Mennes M, Zuo XN, et al. Toward discovery science of human brain function. Proc. Natl. Acad. Sci. U. S. A 2010; 107: 4734–4739. [DOI] [PMC free article] [PubMed] [Google Scholar]
- 55.Mazziotta JC, Toga AW, Evans A, Fox P, Lancaster J. A probabilistic atlas of the human brain: Theory and rationale for its development. Neuroimage. 1995; 2: 89–101. [DOI] [PubMed] [Google Scholar]
- 56.Babiloni C, Frisoni GB, Pievani M, et al. Hippocampal volume and cortical sources of EEG alpha rhythms in mild cognitive impairment and Alzheimer disease. Neuroimage. 2009; 44: 123–135. [DOI] [PubMed] [Google Scholar]
- 57.Velayudhan L, Proitsi P, Westman E, et al. Entorhinal cortex thickness predicts cognitive decline in Alzheimer’s disease. J. Alzheimer’s Dis 2013; 33: 755–766. [DOI] [PubMed] [Google Scholar]
- 58.Fjell AM, Westlye LT, Grydeland H, et al. Accelerating cortical thinning: Unique to dementia or universal in aging? Cereb. Cortex 2014; 24: 919–934. [DOI] [PMC free article] [PubMed] [Google Scholar]
- 59.Ma X, Li Z, Jing B, et al. Identify the atrophy of Alzheimer’s disease, mild cognitive impairment and normal aging using morphometric MRI analysis. Front. Aging Neurosci 2016; 8: 243. [DOI] [PMC free article] [PubMed] [Google Scholar]
- 60.Fischl B. FreeSurfer. Neuroimage. 2012; 62: 774–781. [DOI] [PMC free article] [PubMed] [Google Scholar]
- 61.Hoops S, Nazem S, Siderowf AD, et al. Validity of the MoCA and MMSE in the detection of MCI and dementia in Parkinson disease. Neurology. 2009; 75: 478. [DOI] [PMC free article] [PubMed] [Google Scholar]
- 62.Smith SM, Zhang Y, Jenkinson M, et al. Accurate, robust, and automated longitudinal and cross-sectional brain change analysis. Neuroimage. 2002; 17: 479–489. [DOI] [PubMed] [Google Scholar]
- 63.Aquino KM, Fulcher BD, Parkes L, Sabaroedin K, Fornito A. Identifying and removing widespread signal deflections from fMRI data: Rethinking the global signal regression problem. Neuroimage. 2020; 212: 116614. [DOI] [PubMed] [Google Scholar]
- 64.Desikan RS, Ségonne F, Fischl B, et al. An automated labeling system for subdividing the human cerebral cortex on MRI scans into gyral based regions of interest. Neuroimage. 2006; 31: 968–980. [DOI] [PubMed] [Google Scholar]
- 65.Gao JH, Liu HL. Inflow effects on functional MRI. Neuroimage. 2012; 62: 1035–1039. [DOI] [PubMed] [Google Scholar]
- 66.Power JD, Barnes KA, Snyder AZ, Schlaggar BL, Petersen SE. Spurious but systematic correlations in functional connectivity MRI networks arise from subject motion. Neuroimage. 2012; 59: 2142–2154. [DOI] [PMC free article] [PubMed] [Google Scholar]
- 67.Chang C, Leopold DA, Schölvinck ML, et al. Tracking brain arousal fluctuations with fMRI. Proc. Natl. Acad. Sci. U. S. A 2016; 113: 4518–4523. [DOI] [PMC free article] [PubMed] [Google Scholar]
- 68.Fisher RA. On the Interpretation of χ 2 from Contingency Tables, and the Calculation of P. J. R. Stat. Soc 1922; 85: 87–94. [Google Scholar]
- 69.Bonferroni CE. 1936Teoria statistica delle classi e calcolo delle probabilità. Pubbl. del R Ist. Super. di Sci. Econ. e Commer. di Firenze 19366; 1493–1494. [Google Scholar]
- 70.Bakkour A, Morris JC, Dickerson BC. The cortical signature of prodromal AD: Regional thinning predicts mild AD dementia. Neurology. 2009; 72:1048–1055. [DOI] [PMC free article] [PubMed] [Google Scholar]
- 71.Yeo BTT, Tandi J, Chee MWL. Functional connectivity during rested wakefulness predicts vulnerability to sleep deprivation. Neuroimage. 2015; 111: 147–158. [DOI] [PubMed] [Google Scholar]
- 72.Wong CW, Olafsson V, Tal O, Liu TT. The amplitude of the resting-state fMRI global signal is related to EEG vigilance measures. Neuroimage. 2013; 83: 983–990. [DOI] [PMC free article] [PubMed] [Google Scholar]
- 73.Kiviniemi VJ, Haanpää H, Kantola JH, et al. Midazolam sedation increases fluctuation and synchrony of the resting brain BOLD signal. Magn. Reson. Imaging 2005; 23: 531–537. [DOI] [PubMed] [Google Scholar]
- 74.van Veluw SJ, Hou SS, Calvo-Rodriguez M, et al. Vasomotion as a Driving Force for Paravascular Clearance in the Awake Mouse Brain. Neuron. 2020; 105: 549–561. [DOI] [PMC free article] [PubMed] [Google Scholar]
- 75.Thompson PM, Hayashi KM, De Zubicaray G, et al. Dynamics of gray matter loss in Alzheimer’s disease. J. Neurosci 2003; 23: 994–1005. [DOI] [PMC free article] [PubMed] [Google Scholar]
- 76.Long X, Zhang L, Liao W, Jiang C, Qiu B. Distinct laterality alterations distinguish mild cognitive impairment and Alzheimer’s disease from healthy aging: Statistical parametric mapping with high resolution MRI. Hum. Brain Mapp 2013; 34: 3400–3410. [DOI] [PMC free article] [PubMed] [Google Scholar]
- 77.Braak H, Braak E. The human entorhinal cortex: normal morphology and lamina-specific pathology in various diseases. Neurosci. Res 1992; 15: 6–31. [DOI] [PubMed] [Google Scholar]
- 78.Braak H, Braak E. Neuropathological stageing of Alzheimer-related changes. Acta Neuropathol. 1991; 82: 239–259. [DOI] [PubMed] [Google Scholar]
- 79.Braak H, Del Tredici K, Rüb U, et al. Staging of brain pathology related to sporadic Parkinson’s disease. Neurobiol. Aging 2003; 24: 197–211. [DOI] [PubMed] [Google Scholar]
- 80.Chou KL, Lenhart A, Koeppe RA et al. Abnormal MoCA and normal range MMSE scores in Parkinson disease without dementia: Cognitive and neurochemical correlates. Park Relat Disord. 2014; 20:1076–1080. [DOI] [PMC free article] [PubMed] [Google Scholar]
- 81.Helakari H, Korhonen V, Holst SC et al. Sleep-specific changes in physiological brain pulsations. bioRxiv. 2020. [Google Scholar]
- 82.Jain S, Goldstein DS. Cardiovascular dysautonomia in Parkinson disease: From pathophysiology to pathogenesis. Neurobiol. Dis 2012; 46: 572–590. [DOI] [PMC free article] [PubMed] [Google Scholar]
- 83.Postuma RB, Montplaisir J, Lanfranchi P et al. Cardiac autonomic denervation in Parkinson’s disease is linked to REM sleep behavior disorder. Mov Disord. 2011; 26: 1529–1533. [DOI] [PubMed] [Google Scholar]
Associated Data
This section collects any data citations, data availability statements, or supplementary materials included in this article.