Abstract
Recent developments in neuroimaging allow us to investigate the structural and functional connectivity between brain regions in vivo. Mounting evidence suggests that hub nodes play a central role in brain communication and neural integration. Such high centrality, however, makes hub nodes particularly susceptible to pathological network alterations and the identification of hub nodes from brain networks has attracted much attention in neuroimaging. Current popular hub identification methods often work in a univariate manner, i.e., selecting the hub nodes one after another based on either heuristic of the connectivity profile at each node or predefined settings of network modules. Since the topological information of the entire network (such as network modules) is not fully utilized, current methods have limited power to identify hubs that link multiple modules (connector hubs) and are biased toward identifying hubs having many connections within the same module (provincial hubs). To address this challenge, we propose a novel multivariate hub identification method. Our method identifies connector hubs as those that partition the network into disconnected components when they are removed from the network. Furthermore, we extend our hub identification method to find the population-based hub nodes from a group of network data. We have compared our hub identification method with existing methods on both simulated and human brain network data. Our proposed method achieves more accurate and replicable discovery of hub nodes and exhibits enhanced statistical power in identifying network alterations related to neurological disorders such as Alzheimer’s disease and obsessive-compulsive disorder.
Keywords: Graph spectrum, brain network, connector hub, hub identification
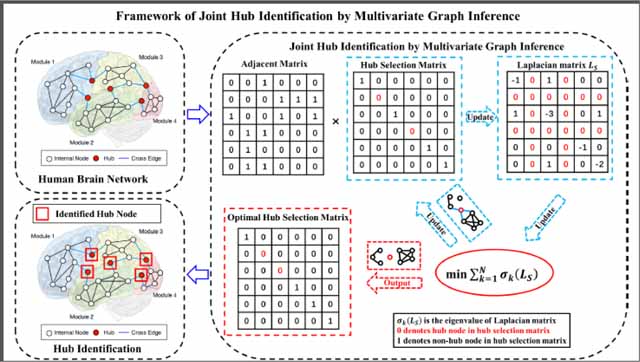
Graphical Abstract
1. Introduction
Recent developments in network science allow us to investigate brain function via the patterns of shared anatomical or functional relationships in the context of large-scale brain networks (Bullmore and Sporns, 2012; van den Heuvel and Sporns, 2013). Like many other real-world networks, such as social (Halu et al., 2013), economic (DeFord and Pauls, 2017), and transportation networks (De Domenico et al., 2015), brain networks derived from neuroimaging data exhibit small-world organization and a heavy-tailed degree distribution. These properties suggest that there are a small number of critical nodes in the network with a high centrality that are essential for network function and dysfunction (these nodes are commonly referred to as hubs) (Achard et al., 2006; Fornito et al., 2015; Hagmann et al., 2007; Sporns and Zwi, 2004). Mounting evidence has shown that hub regions participate widely across a diverse set of cognitive functions and thus hold great potential for understanding network alterations associated with neurological diseases (Achard et al., 2012; Afshari and Jalili, 2017; Alexander-Bloch et al., 2012; Beucke et al., 2013; Buckner et al., 2009; Crossley et al., 2014; Drzezga et al., 2011; Power et al., 2013; van den Heuvel et al., 2008). For example, amyloid-β is one of the important neuropathological biomarkers found in Alzheimer’s disease (AD). Interestingly, network analysis in (Afshari and Jalili, 2017; Buckner et al., 2009; Drzezga et al., 2011) found high concentrations of amyloid-β deposition specifically at those regions of the brain network that are identified as critical network hubs. Also, alterations to the hub nodes are found to be more correlated to clinical measurements in other conditions such as schizophrenia (Alexander-Bloch et al., 2012), obsessive-compulsive disorder (OCD) (Beucke et al., 2013), and coma (Achard et al., 2012).
Although general studies of brain network and studies focusing on the importance of network hubs are greatly expanding our understanding of normal and abnormal brain function, brain network hubs have not yet been found to be an effective clinical biomarker. Ideally the analysis of brain network hubs in individual patients would be useful for diagnosis, prognosis, and/or personalizing treatment plans for a range of neurological and psychiatric disorders. However, the accuracy and reliability of hubs are not at the level that is needed for clinical application (Hohenfeld et al., 2018; Sporns, 2018; Uddin et al., 2017) Therefore, it is essential that we continue to develop methods with the goal of achieving accuracy and reliability that are sufficient to advance the biomarker into the clinic.
In the network science community, there is a wide consensus that hub nodes are located at the central positions of the network (van den Heuvel and Sporns, 2013), exhibiting a much higher degree of connectivity than other nodes. Based on the identification of network modules, hub nodes can be generally categorized into provincial hubs and connector hubs (Fornito et al., 2015; Guimerà and Nunes Amaral, 2005; van den Heuvel and Sporns, 2013). Specifically, provincial hubs are high-degree nodes that primarily connect to nodes in the same module. On the contrary, connector hubs are high-degree nodes that show a diverse connectivity profile by linking several different modules in the network (van den Heuvel and Sporns, 2013). Consistent with the hypothesis that connector hubs serve as fundamental network integrators, several studies have shown that damage to a connector hub results in more global disruption to the network as compared to the eradication of a high degree provincial hub (Gratton et al., 2012; Warren et al., 2014). This hypothesis is also supported by the evidence that significant network alterations have been observed at connector hub regions (Bullmore and Sporns, 2012; Warren et al., 2014). Hence, identification of connector hub nodes in brain networks is essential to quantify network differences among individuals and network changes in a single individual across time.
It is worth noting that identifying network differences is the most common problem in network neuroscience. For instance, Bayesian inference approaches have been developed (Venkataraman et al., 2015; Venkataraman et al., 2013) for the detection of network differences between two populations, which are only designed to locate regions of the network (i.e. disease foci) that differ between a specific disease and non-disease state. However, current state-of-the-art network analysis methods are often limited to the network scale. In this regard, a complementary solution would be to detect well-defined regions of the network that are most critical to the network’s global architecture (i.e. connector hubs). Thus, we can substantially alleviate the computational burden by focusing on a small portion of the networks.
Current hub identification methods can be grouped into two general categories. The first category is a simple sorting-based method, which simply selects hubs based on the heuristics of nodal centrality (van den Heuvel and Sporns, 2013). Most of the current approaches sequentially select a set of hub nodes by ranking a nodal centrality measurement such as degree (Nijhuis et al., 2013), clustering coefficient (Onnela et al., 2005), vulnerability (Kaiser and Hilgetag, 2004), betweenness (Freeman, 1977; Zalesky et al., 2010), eigenvector centrality (Lohmann et al., 2010), and so on (van den Heuvel and Sporns, 2013). Although these variables capture complex topological characteristics, the sorting method relies on a node-by-node selection process. Given all the interdependencies in complex networks it is likely that there is a system of critical hubs that need to be identified simultaneously rather than sequentially. Lacking global heuristics for quantifying the topological importance of hub nodes in the entire network provincial hubs over connector hubs (Power et al., 2013). As the toy example in Fig. 1 illustrates, node #3, #5, #8 have the same number of links. Conventional sorting-based hub identification methods often regard all of these nodes as comparable hub nodes. However, node #3 is located at a more critical place in the network since node #3 connects two network communities (modules). Improved hub identification results have been also been reported in (Jiao et al., 2018; Rubinov and Sporns, 2010; Sporns et al., 2007) by combining multiple nodal centrality metrics, but these methods still use a sequential, univariate method for hub selection.
Fig. 1.
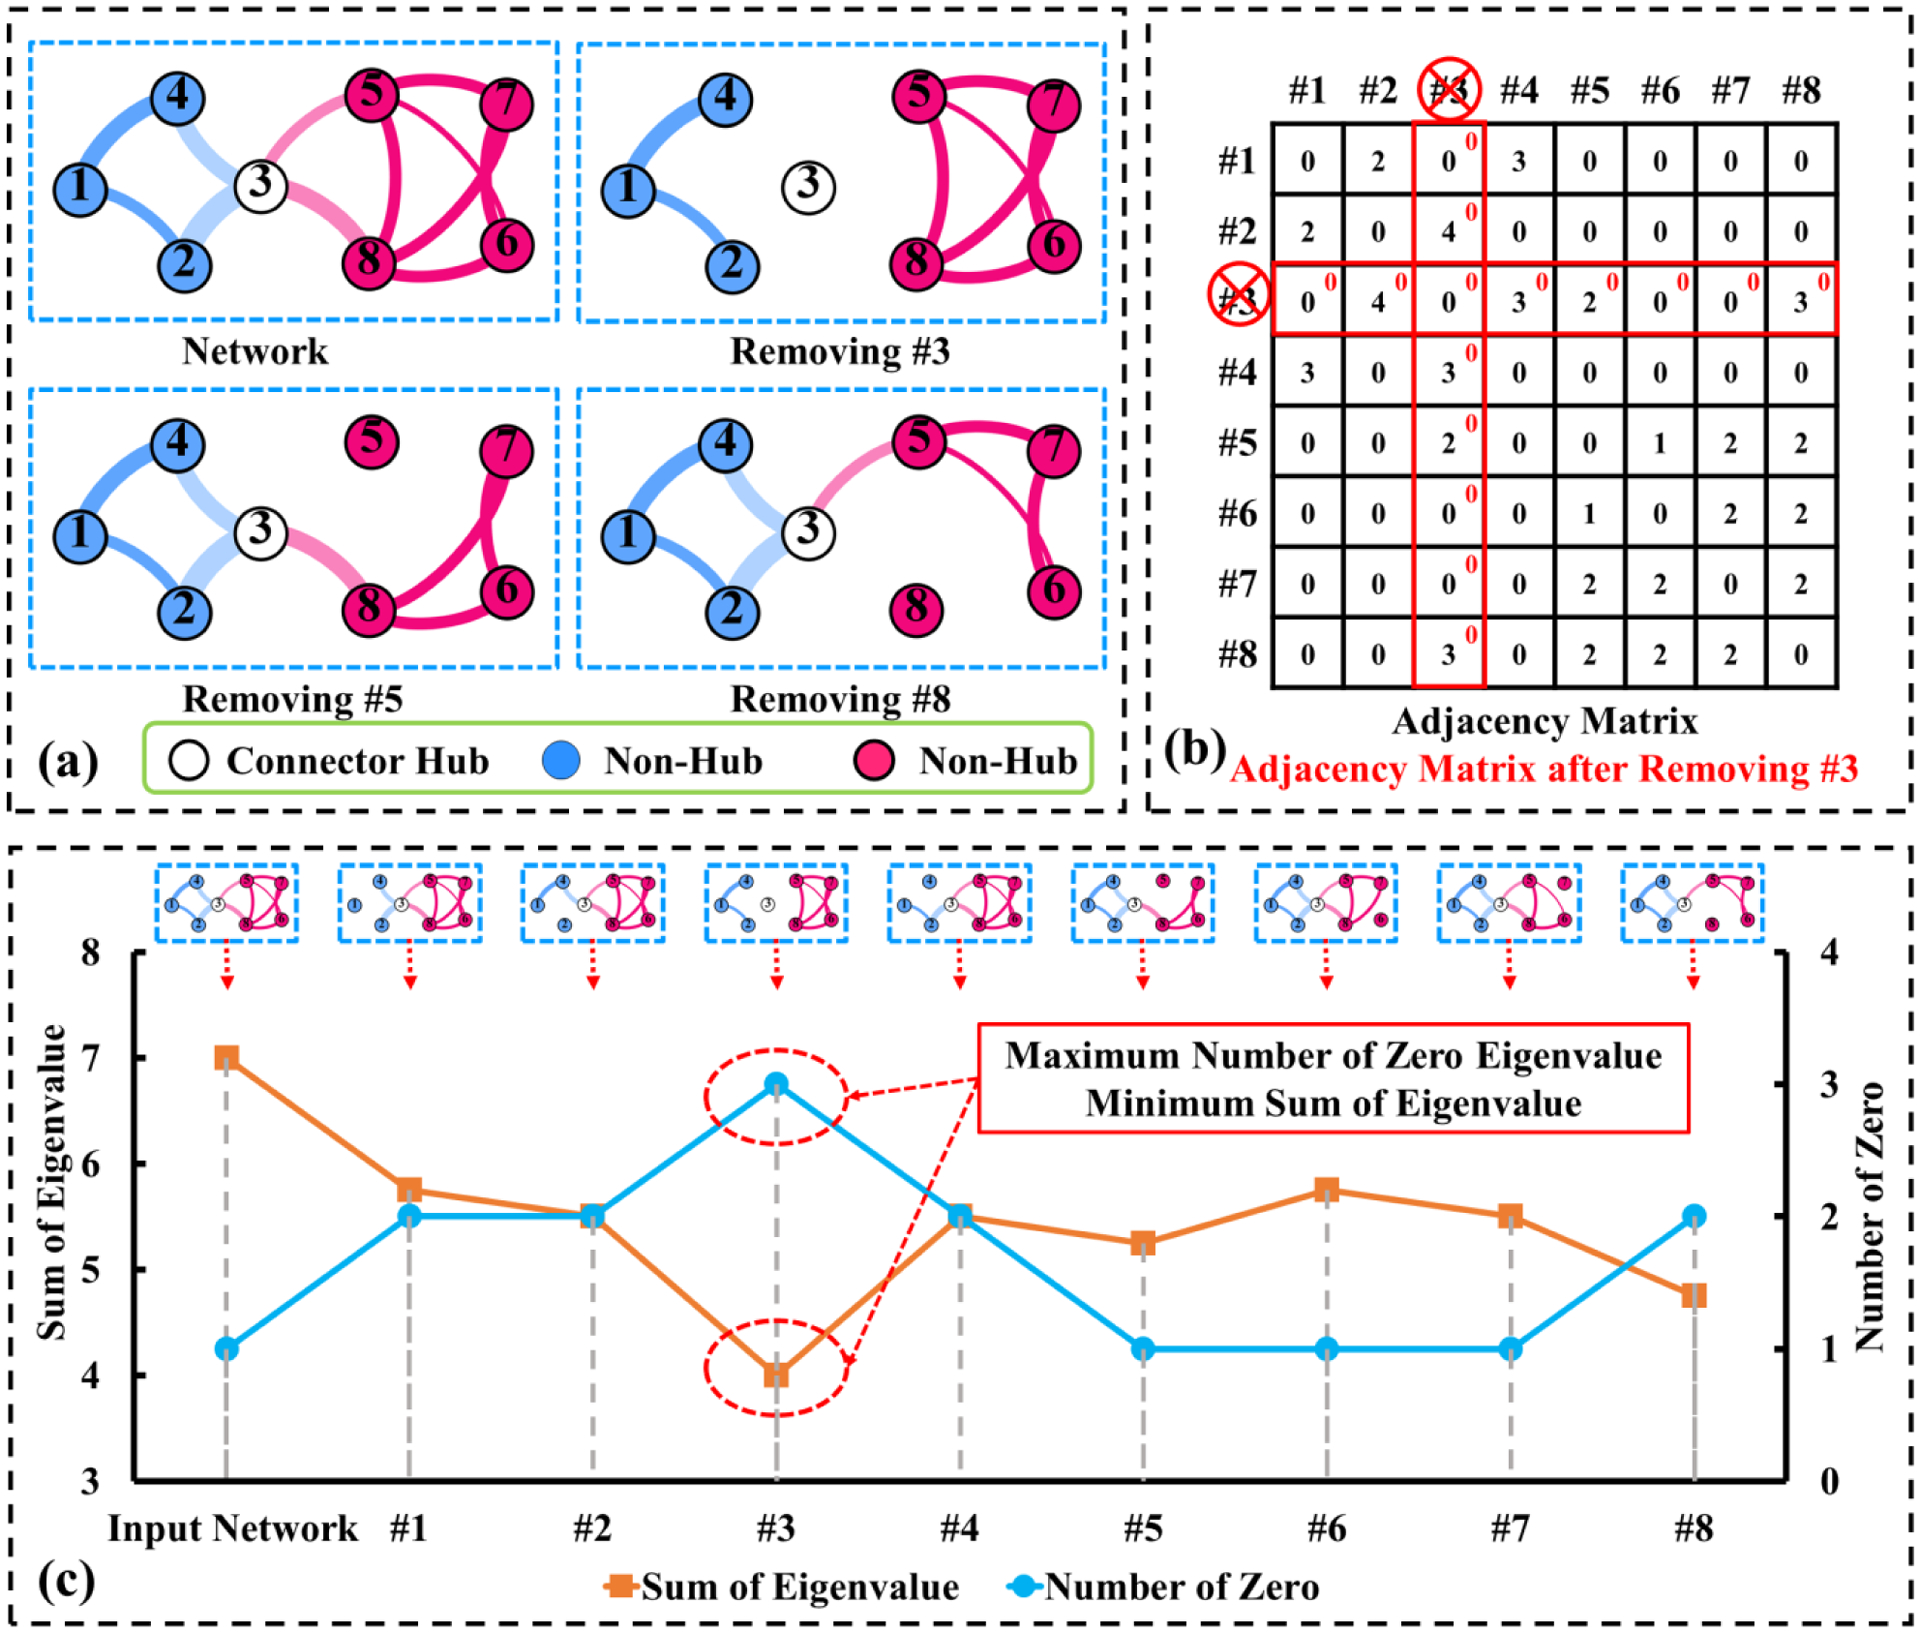
Schematic toy example demonstrating our joint hub identification method, which seeks to identify the optimal set of hub nodes by examining the damage (measured by the summation of eigenvalues from the affected Laplacian matrix (b)) after removing these critical nodes. (a) Original network and networks after removing connector hub #3, provincial hub #5, and provincial hub #8. (b) Adjacency matrix. (c) The original objective function (number of zero eignevalues) and the continuous objective function (sum of the eigenvalues) are displayed in brown and blue, where both of them suggest node #3 is the connector hub in the network.
The second category (functional cartography) uses module-based methods that identify hub nodes based on the network modularity (Guimerà and Nunes Amaral, 2005; van den Heuvel and Sporns, 2013). Functional cartography is able to distinguish provincial hubs from connector hubs (Guimerà and Nunes Amaral, 2005). Mounting evidence suggests that the human brain is a hierarchically organized system consisting of specialized network modules (Bassett et al., 2008; Bullmore and Sporns, 2012; Park and Friston, 2013; van den Heuvel et al., 2010). Once an optimal module partition has been identified, it is straightforward to determine connector hub nodes based on the diversity of connections related to the module partition (Guimerà and Nunes Amaral, 2005; Tijms et al., 2013). Although this method initially considers global network properties, the final hub distinction uses a sorting-based method. In addition, detecting network modules is made difficult by the complexity of the brain network and no optimal method has been devised (Fortunato, 2010; Newman, 2006).
All the univariate methods that use sequential selection ignore the interdependencies of the hub nodes and complex topology of the entire network. These methods are susceptible to identifying a redundant set of hub nodes. For instance, consider the toy example shown in Fig. 1(a) where the network consists of two modules (in pink and blue respectively). Nodes #3, #5, and #8 all conform to the general definition of a hub, as they all exhibit a high degree of connectivity. Current univariate hub identification approaches often sequentially select node #3, #5, #8 since their connectivity degrees are the same. However, only node #3 can be defined as a connector hub since the removal of this node separates the network into two subnetworks (shown in Fig. 1(a)). In contrast, removal of either node #5 or #8 leaves the remaining network fully connected (shown in Fig. 1(a)). At worse, it is highly redundant to select all these three nodes since they are closely connected. Hence, it is important to consider the multivariate topological dependency in a multivariate manner, instead of selecting each node separately.
We propose a novel, multivariate hub identification method to jointly find a set of critical nodes in the network such that the removal of these identified nodes would break down the network into the largest number of connected components. As is shown by the example in Fig. 1, our proposed method utilizes information corresponding to the network organization to identify critical nodes. Since intra-module connectivity are often much denser than inter-module connectivity in brain networks (van den Heuvel and Sporns, 2013), the removal of provincial hubs is less likely to separate the network into disconnected-subgraphs. As a result, our method is more likely to identify connector hubs, rather than provincial hubs.
Specifically, our method is built upon the spectral property of the Laplacian matrix that describes the network topology. Since the number of connected components in the graph is equal to the multiplicity of the zero eigenvalues of the underlying Laplacian matrix (Nie et al., 2014), we cast the identification of hub nodes into a combinatorial optimization problem where the optimal set of hub nodes should be able to render the largest number of zero eigenvalues after removing them from the network. As shown in Fig. 1(b), we effectively detach the identified hub nodes from the original network by zeroing their associated connections. Thus, the output of our method is a compact set of hub nodes that maximally fragment the network. While an exhaustive search can be performed when the scale of the network is small, the combinatorial optimization becomes intractable for networks consisting of hundreds of nodes. To alleviate this issue, we further present an efficient convex optimization framework to minimize the total variation of the eigenvalues (the curve shown in Fig. 1(c)) with a manner of multivariate optimization to jointly identify a set of hub nodes.
Many brain network analysis studies for either group comparisons or biomarker discovery require normalization of hub nodes across networks from individual participants. In our previous work (Yang et al., 2019), we follow the common practice to (1) identify the hub nodes in each network and (2) vote for the most representative hub nodes across individuals. Such a two-step approach, however, is not robust to network diversity among individual graphs, especially when the sample size is small. To address this limitation, we further extend our individual-based hub identification method (Yang et al., 2019) to a population-wise scenario, i.e., jointly identifying the most representative hub nodes, while simultaneously optimizing for consensus across individual networks.
We first present our joint hub identification method and the optimization steps in Section II. The performance of our proposed method for hub detection is tested in Section III, on both simulated and human brain network data corresponding to both structural and functional networks. We show that we achieve more accurate and replicable results compared to current state-of-the-art hub detection methods. Finally, we conclude our method in Section IV.
2. Method
2.1. Graph Theory in Brain Network Analysis
A brain network can be mathematically described as a graph , where the set of N network nodes V denote brain regions or neuronal elements and the set of edges E represent their interactions (Bullmore and Sporns, 2009). In addition, the whole brain connectively can be encoded in a N × N adjacency matrix , where each element wij measures the connectivity strength between network nodes Vi and Vj. In neuroscience, it is common to assume W is non-negative and symmetric. Suppose D is a diagonal matrix where each diagonal element is equal to the corresponding row-wise summation in W:
| (1) |
Thus, we can obtain the Laplacian matrix as follows:
| (2) |
When W is non-negative, several of the most important properties of the Laplacian matrix L are as follows (Merris, 1994; Nie et al., 2014):
Theorem 1.
The Laplacian matrix L is symmetric and positive semi-definite; for every column vector , it has ; the Laplacian matrix L has N non-negative and real valued eigenvalues 0 = ≤ θ1 ≤ θ2 ≤ ⋯ ≤ θN.
Theorem 2.
The number of the eigenvalues of the Laplacian matrix, L, that are equal to zero is equal to the number of connected components in the graph .
2.2. Framework of Joint Hub Nodes Identification
Given Theorem 2, maximizing the number of connected components upon K nodes removal becomes a problem of minimizing the summation of the Laplacian eigenvalues as shown in Fig.1(c). Here, we effectively detach the connector hub nodes from the other nodes in the original network by zeroing out the corresponding rows and columns in the adjacency matrix. Without loss of generality, we use a N × N diagonal matrix S = diag(s) = diag[s1, s2, … , sN] (the hub selection matrix) to represent the selection of connector hub nodes where si = 0 indicates node Vi is a connector hub node, and si = 1 indicates Vi is not a hub node. As shown in Fig. 1(b), STWS results in a fully disconnected network after the connector hub nodes (indexed in S) are removed. Thus, hub identification can be converted into a multivariate-based optimization problem with respect to S. After removing of the hub nodes from the network, the corresponding Laplacian matrix is updated as follows:
| (3) |
where the ith diagonal element in Ds equals to . It is worth noting that we are just zeroing the corresponding rows and columns of L, instead of taking the underlying nodes out the network. Thus, Ls is a N × N matrix, where N is the number of nodes in the original network under investigation.
Theorem 2 suggests that we can optimize the setting of S such that we maximize the number of remaining connected components. However, directly optimizing towards the number of zero eigenvalues is NP-hard combinatory optimization problem. To that end, we relax the combinatory optimization to a continuous energy function as follows. Suppose σk(LS) is the kth eigenvalue of the Laplacian matrix Ls and the Eigen values are sorted in an increasing order. Then, the optimal setting of hub nodes can be realized by optimizing the following energy function:
| (4) |
Since the number of hub nodes is pre-defined based on the domain knowledge of network neuroscience, our following optimization is free of the trivial solution of si = 0 (∀i = 1, .. , N).
There is a two-fold benefit of the approximation from optimizing the number of zero eigenvalues to minimizing the sum of eigenvalues. First, such an approximation allows us to cast the objective function from an NP-hard combinatory problem to a convex optimization scenario. Second, since there are often multiple links between two nodes in the brain network, it is not common to break down the entire network into disconnected components by removing the single node. In this regard, the new objective function (i.e., the sum of eigenvalues) is more informative and reliable than the counting of zero eigenvalues which only works for brain networks with relatively simple topology. In Fig. 1(c), we demonstrate that the characteristic of the new objective function (sum of eigenvalues) is equivalent to the original one (number of zero eigenvalues), when both objective functions points to the local local optima when node #3 is removed from the network.
Since each σk(LS) is no less than zero, minimizing the summation of all eigenvalues of LS in Eq. (4) makes the original network (where all nodes are connected) fragment into the largest number of disconnected sub-networks. While optimization of Eq. (4) is NP-hard, according to the Ky Fan’s theorem (Fan, 1949), we have:
| (5) |
where and FT F = I. tr(.) denotes for the trace norm of matrix. Hence, the energy function in Eq. (4) is further equivalent to:
| (6) |
It is apparent that our method jointly determines a set of hub nodes, as specified in the hub selection matrix S. Since the ith row fi in F is often considered as the low dimensional descriptor for the corresponding network node Vi, our method iteratively optimizes the network modules (characterized by F) and finds of hub nodes that pay the greatest role in preventing network fragmentation. Hence compared to contemporary univariate methods (Guimerà and Nunes Amaral, 2005; van den Heuvel and Sporns, 2013), our proposed method utilizes the power of graph spectrum theory to simultaneously identify the set of connector hubs that reflect the underlying network topology.
2.3. Optimization
Although Eq. (6) is not a convex function if jointly considering F and S, we can progressively minimize the energy function in an alternative manner as follows (Ghadimi et al., 2015; Shi et al., 2014).
2.3.1. Optimizing network modules under the current setting of hub nodes
By fixing S, the minimization of Eq. (6) is converted to a conventional spectral clustering problem with respect to F, as the follows:
| (7) |
It has the closed form solution which is formed by the Eigen vectors of LS corresponding to the first Kn smallest Eigen values (Nie et al., 2014).
2.3.2. Identifying hub nodes based on network modular information
By fixing F, the energy function of Eq. (6) regarding S becomes:
| (8) |
Since Ds is coupled with hub selection matrix S, it is difficult to find the closed-form solution for S from Eq. (8). According to the theorem (1) and Eq. (3), Eq. (8) can be reformulated as:
| (9) |
where is a N × N matrix with each element . Thus, according Eq. (9), the energy function of Eq. (8) can be converted as follows:
| (10) |
Since S = diag(s) is an index matrix (si is either 0 or 1), it is hard to directly optimize s as a combinatorial optimization problem. Instead, we introduce an auxiliary matrix p, which is a continuous diagonal matrix with each diagonal element pi ranges from 0 to 1. Thus, the optimization of Eq. (10) can be approximated to:
| (11) |
Then, we use Augmented Lagrange Multiplier (ALM) (Ghadimi et al., 2015; Shi et al., 2014) to optimize s and p as:
| (12) |
where is a column vector consisting of N Lagrangian multipliers, μ is a large positive scalar to enforce the constraint s = p. Then, we introduce a new term in Eq. (12) as the follows:
| (13) |
Furthermore, Eq. (13) can be rewritten as follows:
| (14) |
To solve Eq. (14), we present the following alternative solutions by using the Alternating Direction Method of Multipliers (ADMM) (Ghadimi et al., 2015; Shi et al., 2014):
| (15) |
where ρ is a stripe to adjust the value of μ. By letting the derivative of Eq. (15) w.r.t. p go to zero, we can obtain the solution for p as follows:
| (16) |
To solve the binary vector s in Eq. (15), it is equivalent to minimize:
| (17) |
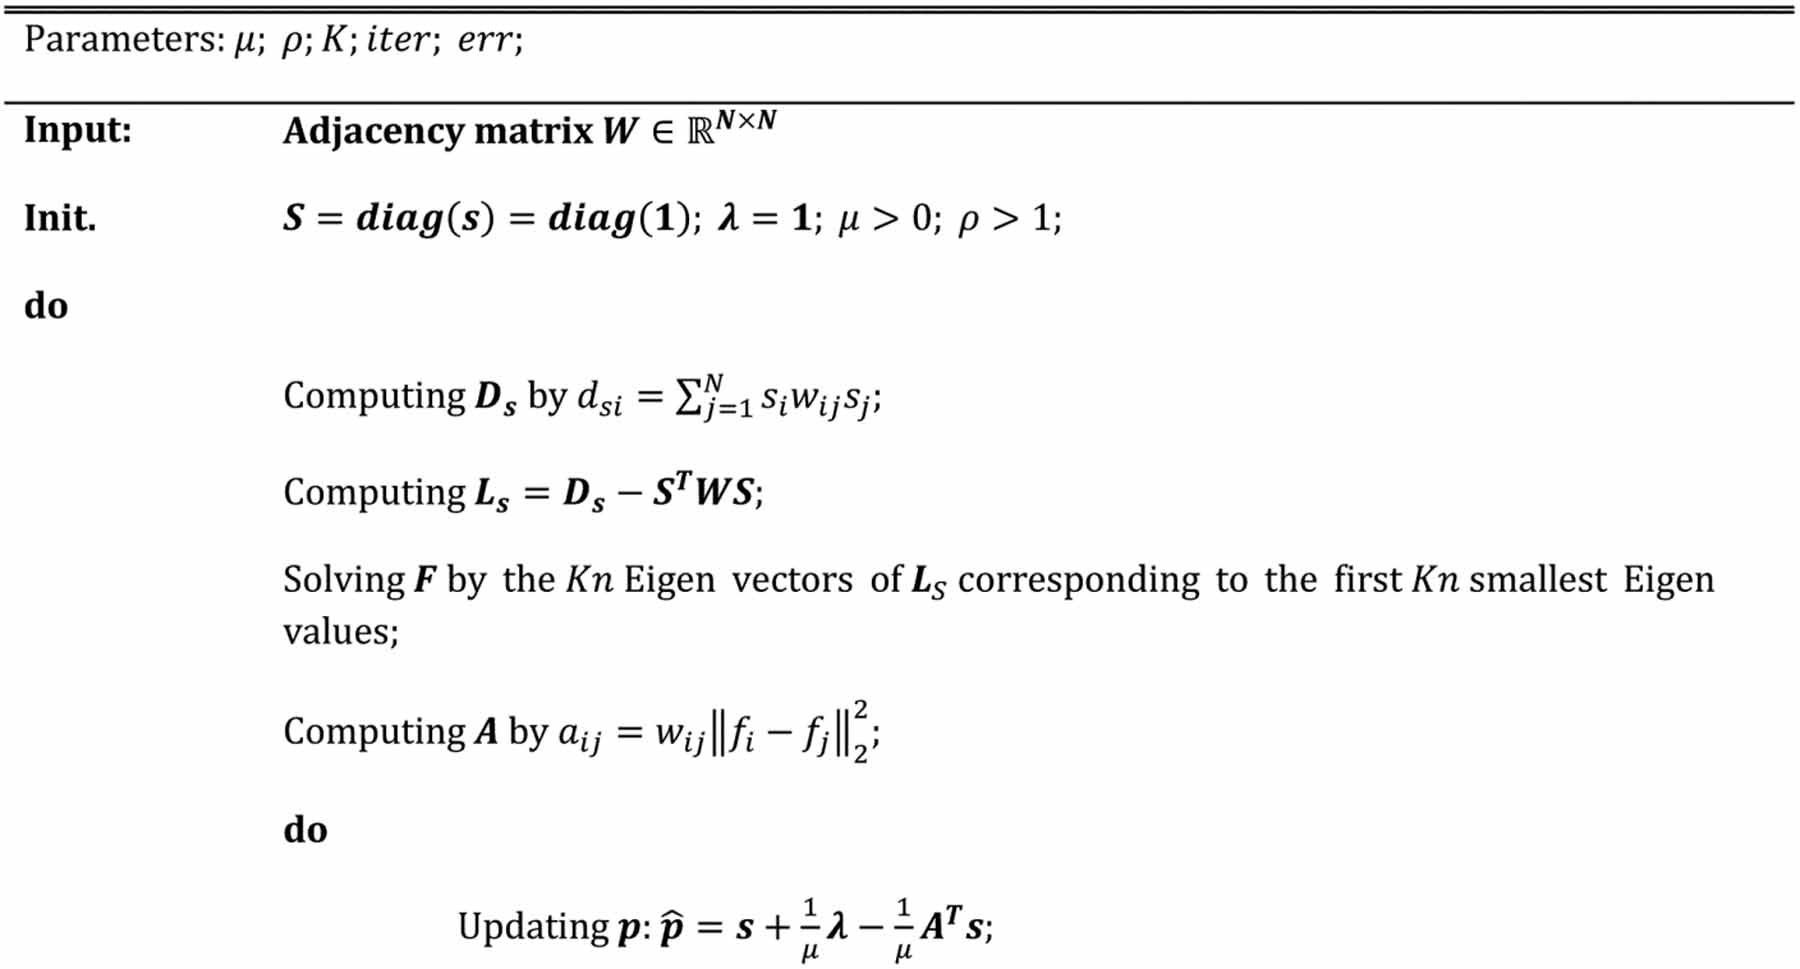
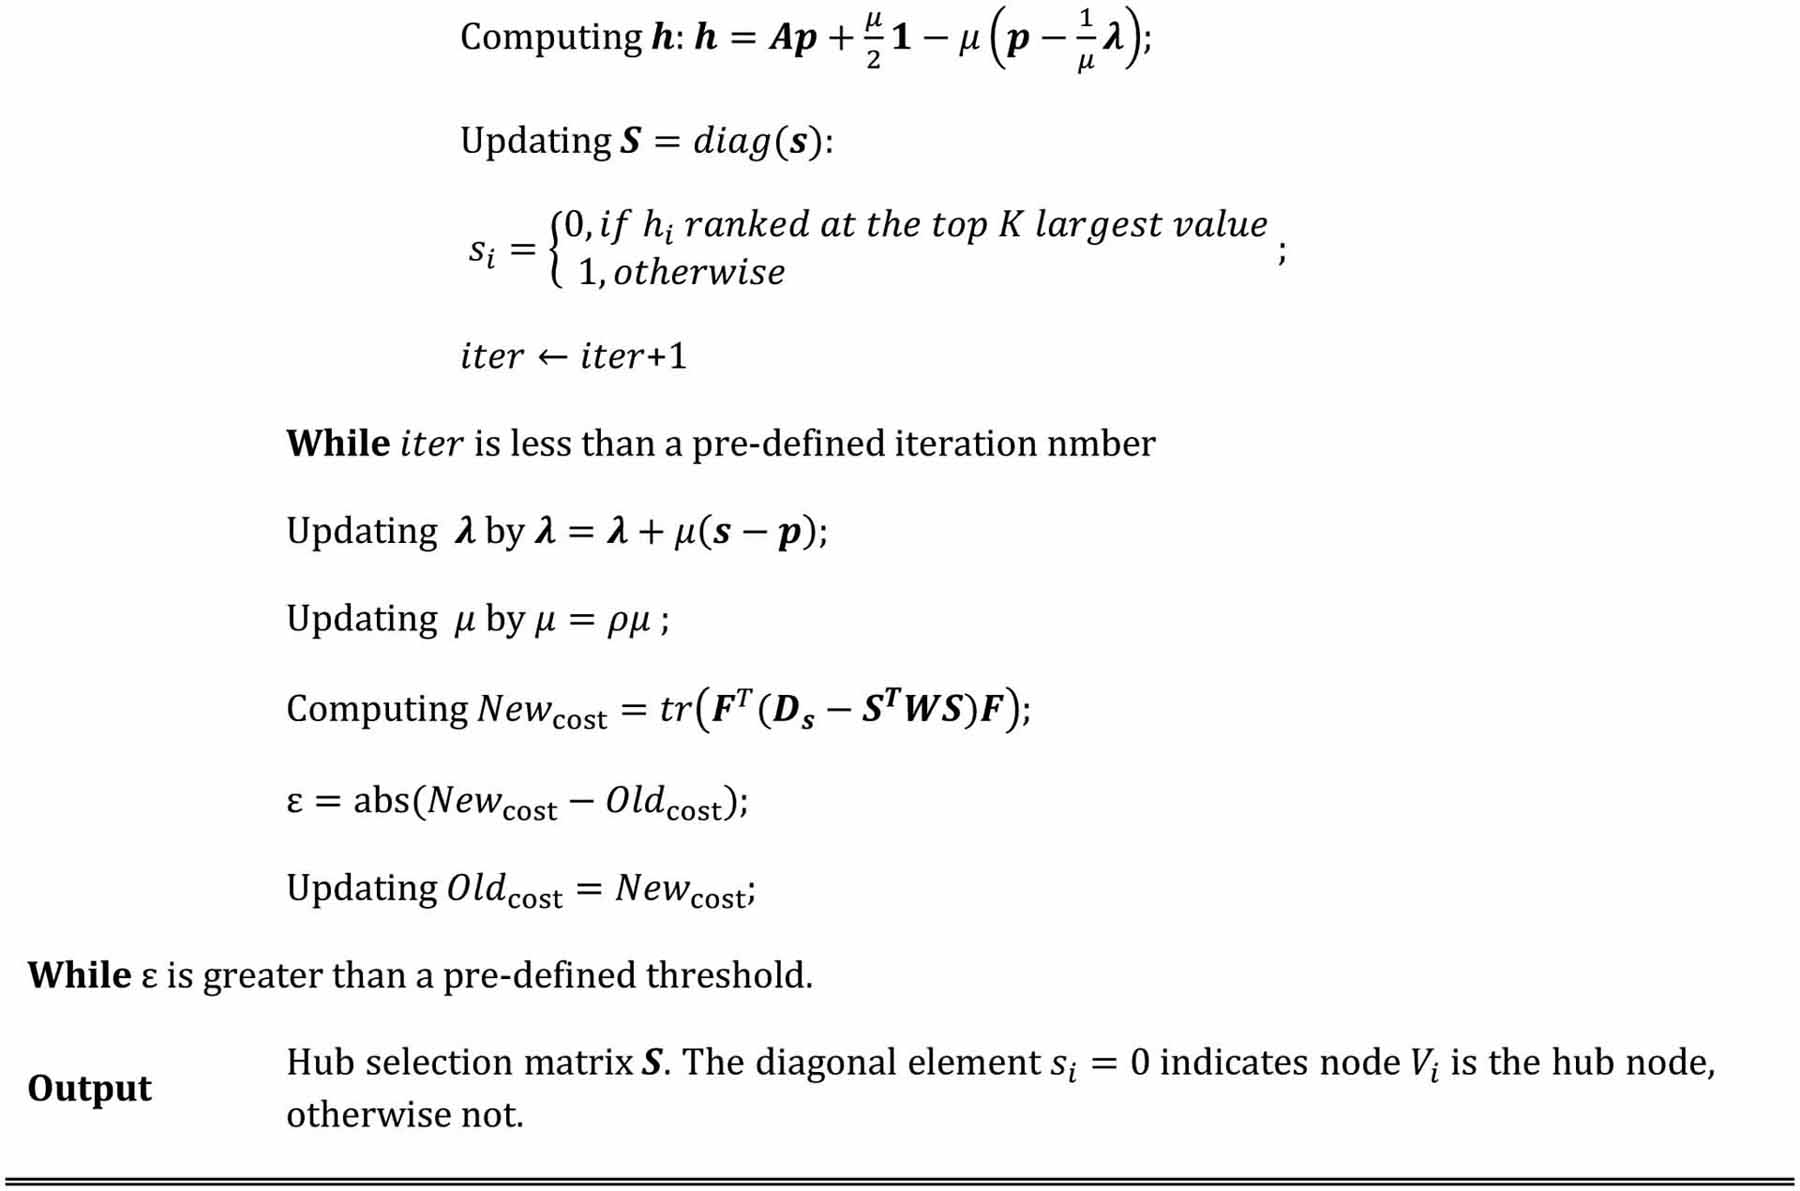
denotes a column all-ones vector. It is clear that h = [h1, h2, …, hN]T is also a vector. Thus, as the same problem addressed in reference (Nie et al., 2017), we use greedy search to optimize each si by: (1) calculating h based on the current estimation of p, λ, and μ; (2) sorting the elements of h; (3) setting si = 0 (i.e., Vi is hub node) if the corresponding hi is ranked among the top K largest values; otherwise, si = 1. The whole optimization framework is briefly summarized in Table I.
Table I.
Algorithm for joint hub identification
|
Convergence.
On the top of our optimization schema, the alterative optimization of F and S converges to a local minimum since S and F are independent and both energy functions are convex. Since each diagonal element in S is a binary selection result, it is difficult to directly solve S = diag(s) as a computationally hard combinatory optimization problem. Thus, we further relax this difficult optimization by introducing another continuous variable p, which becomes another two-step alterative optimization schema. Since we can optimize p using gradient descent approach, the optimization of p converges given F and S. In order to avoid the trivial solution in optimizing S, we resort to a greedy search strategy, which has been widely used in the machine learning field (Nie et al., 2017). Although it is hard to show the proof of convergence in a general sense, it is reasonable to assume that our method can converge to the same subset of hub nodes since the greedy optimization S is constrained by the number of hub nodes K and hub nodes are characterized by distinctive connectivity profiles compared to other nodes in the brain network.
2.4. Extension to identify population-wise setting of hub nodes
It is rather straightforward to extend this hub identification scheme from the individual network setting to the scenario of population-wise setting. Such a population hub identification discovers a set of the most representative hub nodes S from a population of M individual networks . To do so, we convert the individual-based energy function in Eq. (4) to the objective function of population-based hub identification as:
| (18) |
where each Fm denotes the low dimensional descriptor derived from the Laplacian matrix of mth network, and is the diagonal matrix with (i = 1, …, N). It is clear that we allow each individual network to have its own network organization (characterized by Fm), but they share a common setting of hub nodes S.
Similarly, we alternatively optimize {Fm} and S = diag(s) in Eq. (18). Since it is reasonable to assume that each Fm is independent to all others, we estimate Fm for each network separately by minimizing the energy function in Eq. (7). By fixing {Fm}, the common hub identification matrix s can be optimized by:
| (19) |
where and each element in the matrix Am can be calculated by (i, j = 1, … , N). We apply the optimization steps summarized in Table I to solve S = diag(s), where si = 0 indicates the node Vi is the representative hub for the whole network population.
3. Experiments
We evaluate the performance of our joint hub identification method on both simulated and real network data, including a well-known social network and both structural and functional brain networks. We compared our method with respect to two current popular hub identification methods: (1) a sorting-based method which finds a set of hub nodes based on the centrality of betweenness (Tijms et al., 2013; Zhu et al., 2012), and (2) a module-based method, which first detects network modules, and then selects hub nodes based on participation coefficients (Guimerà and Nunes Amaral, 2005), and a higher-order-connectivity-based method (Andjelković et al., 2020), which detects a set of hub nodes based on the structure of simplicial complexes of different orders that each node participates in a complex network.
3.1. Evaluation on Synthesized Network Data
3.1.1. Data Preparation
A series of synthesized network data is generated by the following steps: (1) we first generate a set of densely connected connectivity matrices (considered as modules) where each element is a random number from 0 to 1; (2) we stack these matrices along the diagonal line and form a new bigger matrix where there is no inter-module connection; (3) we specify a set of connector hub nodes with random links (considered as inter-module connectivity with a value from 0 to 1) between all the rest of nodes in the network. Since the ground truth is known for these synthesized networks, we are able to evaluate the performance on hub identification in terms of the location and the number of connector hub nodes.
3.1.2. Accuracy of Hub Identification
Two synthesized network datasets are generated as described above, each consisting of two modules (indicated by red and blue respectively), and at least one connector hub (indicated by hollow circle(s)) connecting the two modules in Fig. 2(a)–(b). Furthermore, the Zachary’s karate club network (Zachary, 1977) is also used to test the performance of our algorithm, as shown in Fig. 2(c), in which nodes 1 and 34 represent the administrator (hub) and instructor (hub) respectively.
Fig. 2.
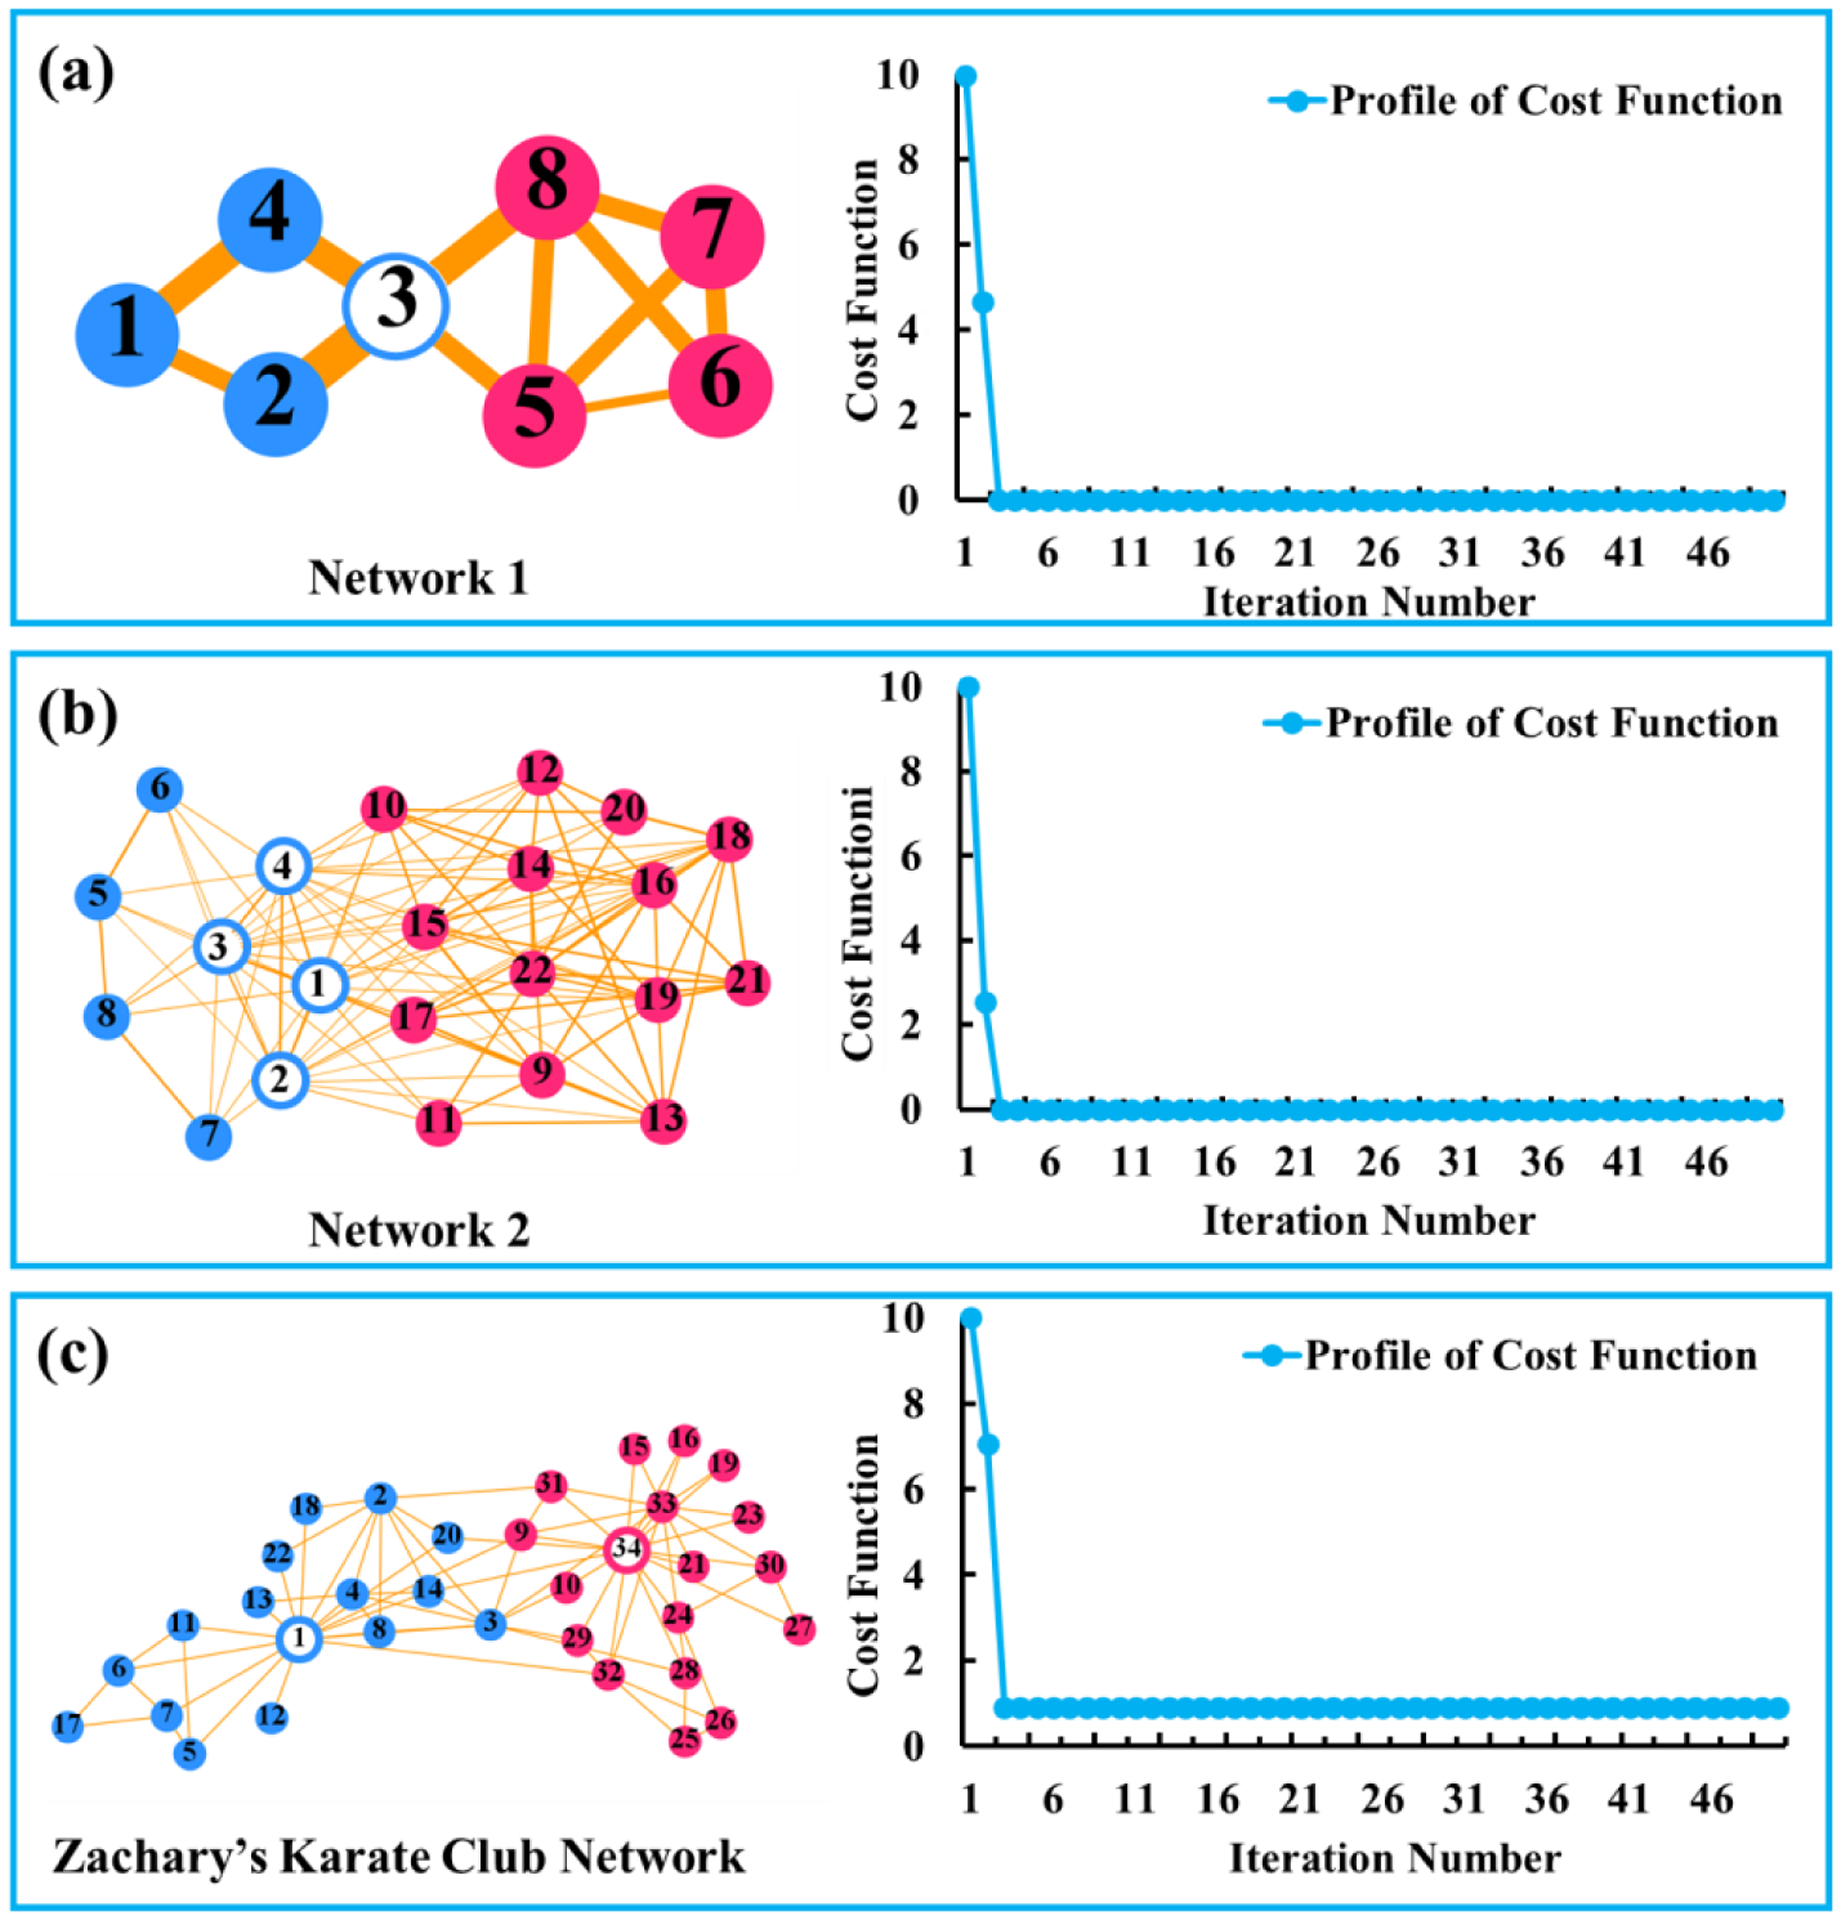
Networks and the convergence curves of our proposed hub identification method for synthetic networks (a)-(b) and a real network - Zachary’ karate club network (c).
First, we investigate the convergence of our proposed hub identification method. The convergence profiles of the decreasing cost function with respect to the increasing number of iterations for three networks are shown in the right side of Fig. 2(a)–(c). It is apparent that our proposed optimization schema can quickly converge after a few iterations.
Second, we evaluate the accuracy of the hub identification results, where the identified hub nodes are marked by the red box, obtained via the sorting-based method Fig. 3(a), the module-based method Fig. 3(b), higher-order-connectivity-based method Fig. 3(c), and the method proposed here Fig. 3(d). As is evident by visual inspection, our hub identification and the higher-order-connectivity-based method outperforms the conventional sorting-based and the module-based methods on both the simulated data and the Zachary’s karate club network in terms of identifying the location.
Fig. 3.
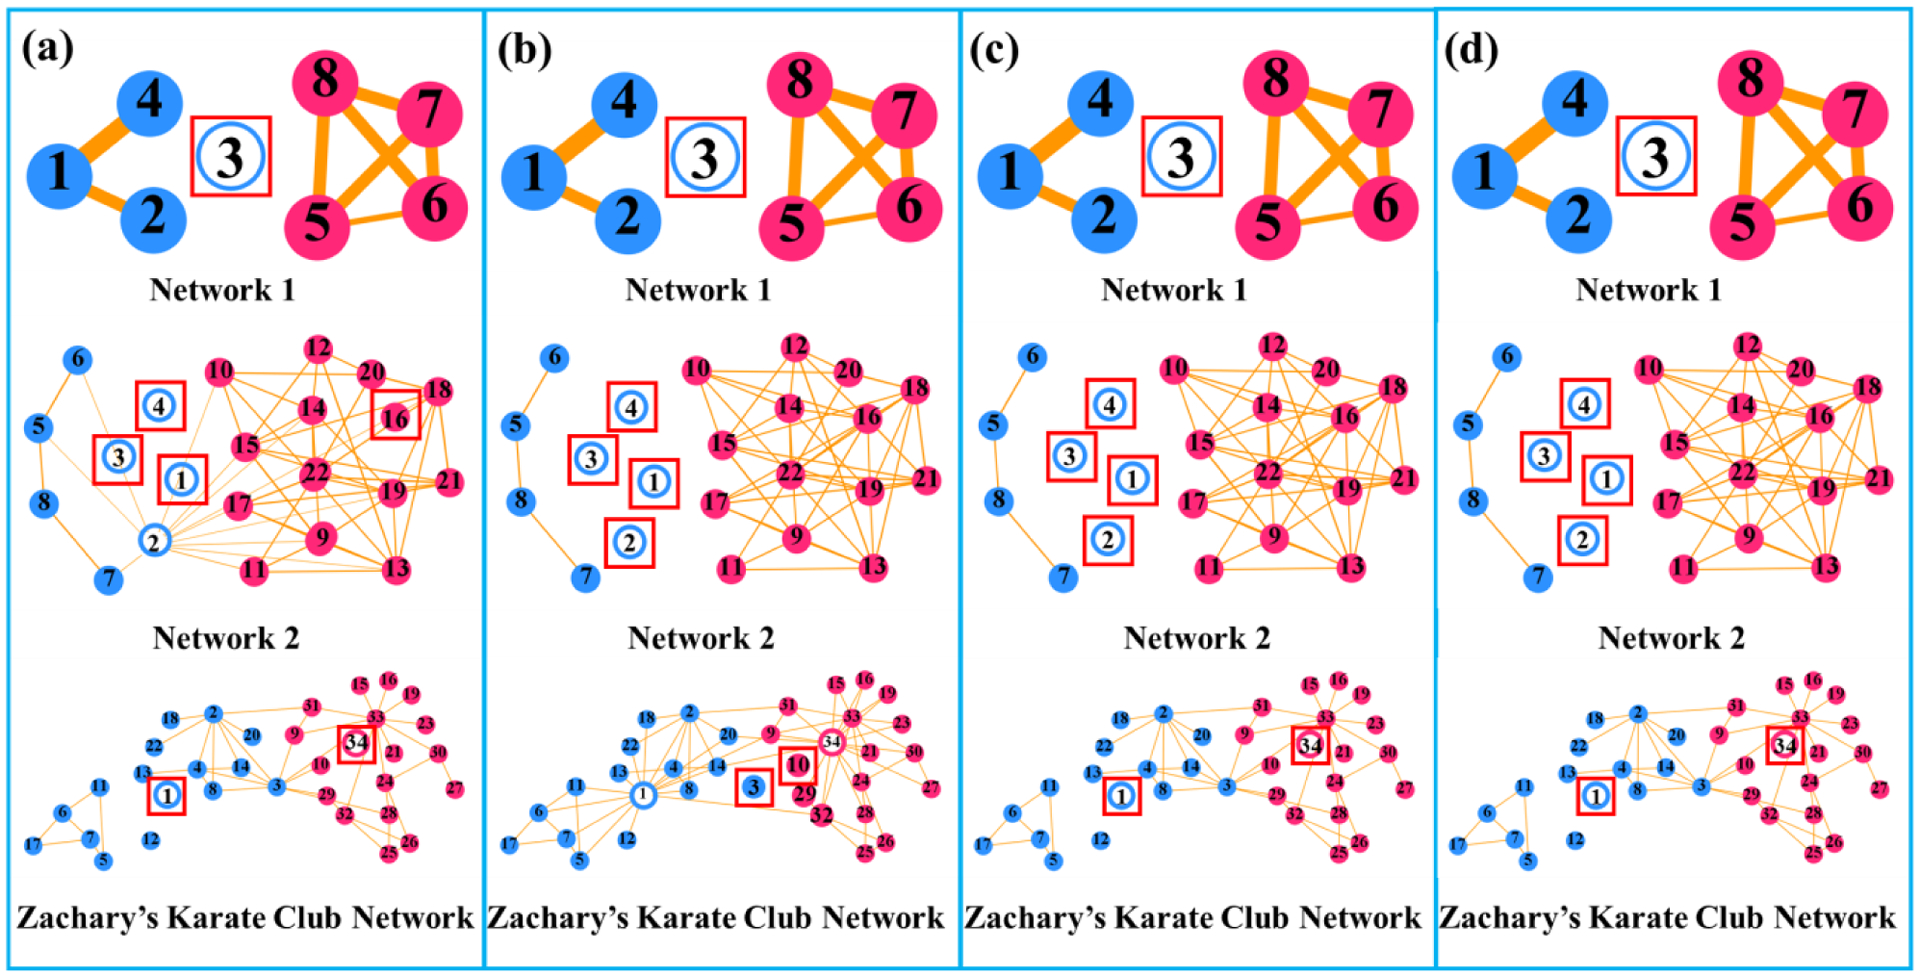
Hub identification results on the simulated networks and Zachary’s karate club network by using the conventional sorting-based method (a), the module-based method (b), the higher-order-connectivity-based method, and our joint hub identification method (d). Red and blue designate the module information. Hollow and solid circles respectively represent the ground truth of connector hub and non-connector hub in the synthesized network. The automatically identified hub nodes are marked by a red box.
3.1.3. Robustness of Hub Identification on Network Topology
The accuracy of hub identification can be quantified by calculating the Jaccard Index (Ce ∩ Cg)/Ce ∪ Cg, where Ce is the set of identified hub nodes and Cg represent the set of ground truth nodes in a synthetic network. First, we synthesize a series of networks with an increasing total number of nodes. Then, the accuracy curves varied with the increase of network scale by sorting-based (blue), module-based (orange), higher-order-connectivity-based method (green), and our proposed joint hub identification methods (red) are shown in Fig. 4(b). Since the module information and the connector hubs are known in the simulated network data, we evaluate the percentile of the ground truth hub nodes within the total identified hub nodes by sorting-based, module-based, higher-order-connectivity-based, and our proposed joint hub identification methods are shown in Fig. 4 (b), and displayed in blue, orange, green, and red curves, respectively. It is apparent that our joint hub identification method consistently had higher accuracy of detecting connector hubs than all of the conventional methods.
Fig. 4.
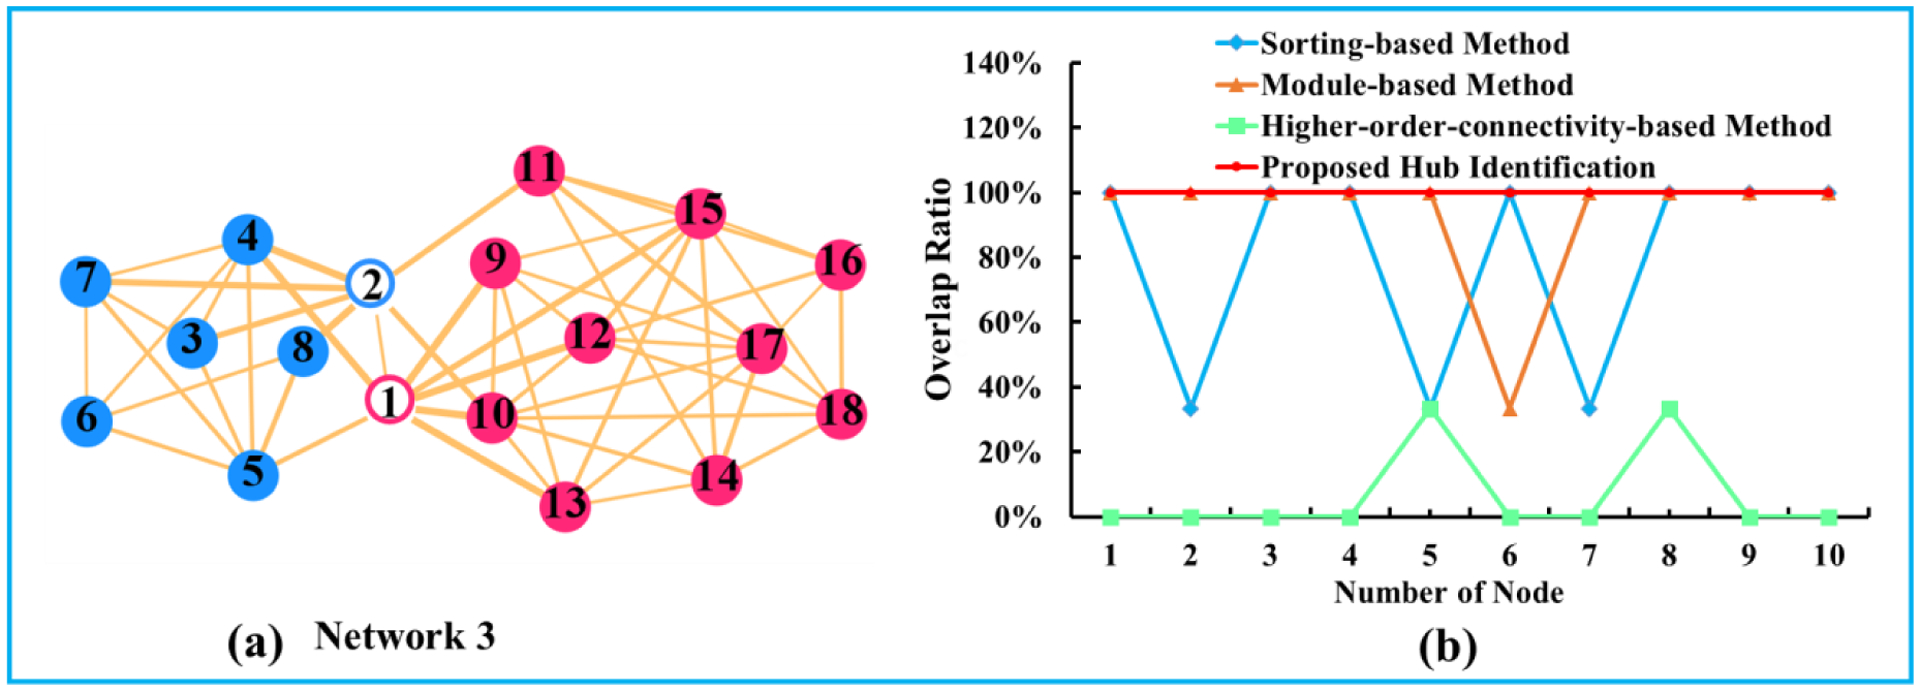
(a) is the baseline network model, in which the connector hub nodes are fixed. Red and blue designate the module information. Hollow and solid circle respectively represent the ground truth of connector hub and non-connector hub. (b) Overlap ratio between the estimated hub nodes and the ground truth hub nodes by the sorting-based method (blue), the module-based method (orange), higher-order-connectivity-based method (green), and our joint hub identification method (red).
3.1.4. Univariate-based vs Multivariate-based Hub Identification
In this subsection, we specifically evaluate the advantage of multivariate (joint) hub identification over the univariate manner (using the same selection criteria but sequentially selecting hub one after another). Two simulations based on the network #2 (shown in Fig. 2(b)) and network #4 (shown in Fig. 5(a)) were conducted to investigate the performance of univariate-based and the multivariate-based hub identification approaches. In the framework of the univariate-based approach, hub nodes were sequentially identified one after another (based on the break-down effect quantified in Eq. 4) until reaching the predefined hub number, as shown in Fig. 5(b). In contrast, our multivariate-based approach jointly identifies a set of hub nodes by optimizing Eq. 4. The identified hub nodes by the multivariate-based approach are shown in Fig. 5(c). It is clear that the multivariate approach outperforms the univariate approach as the network topology becomes more and more complex. Note, the reason for the univariate approach’s failure in network #4 is that the separation of the two modules is not distinct until we consider removing four hub nodes jointly.
Fig. 5.
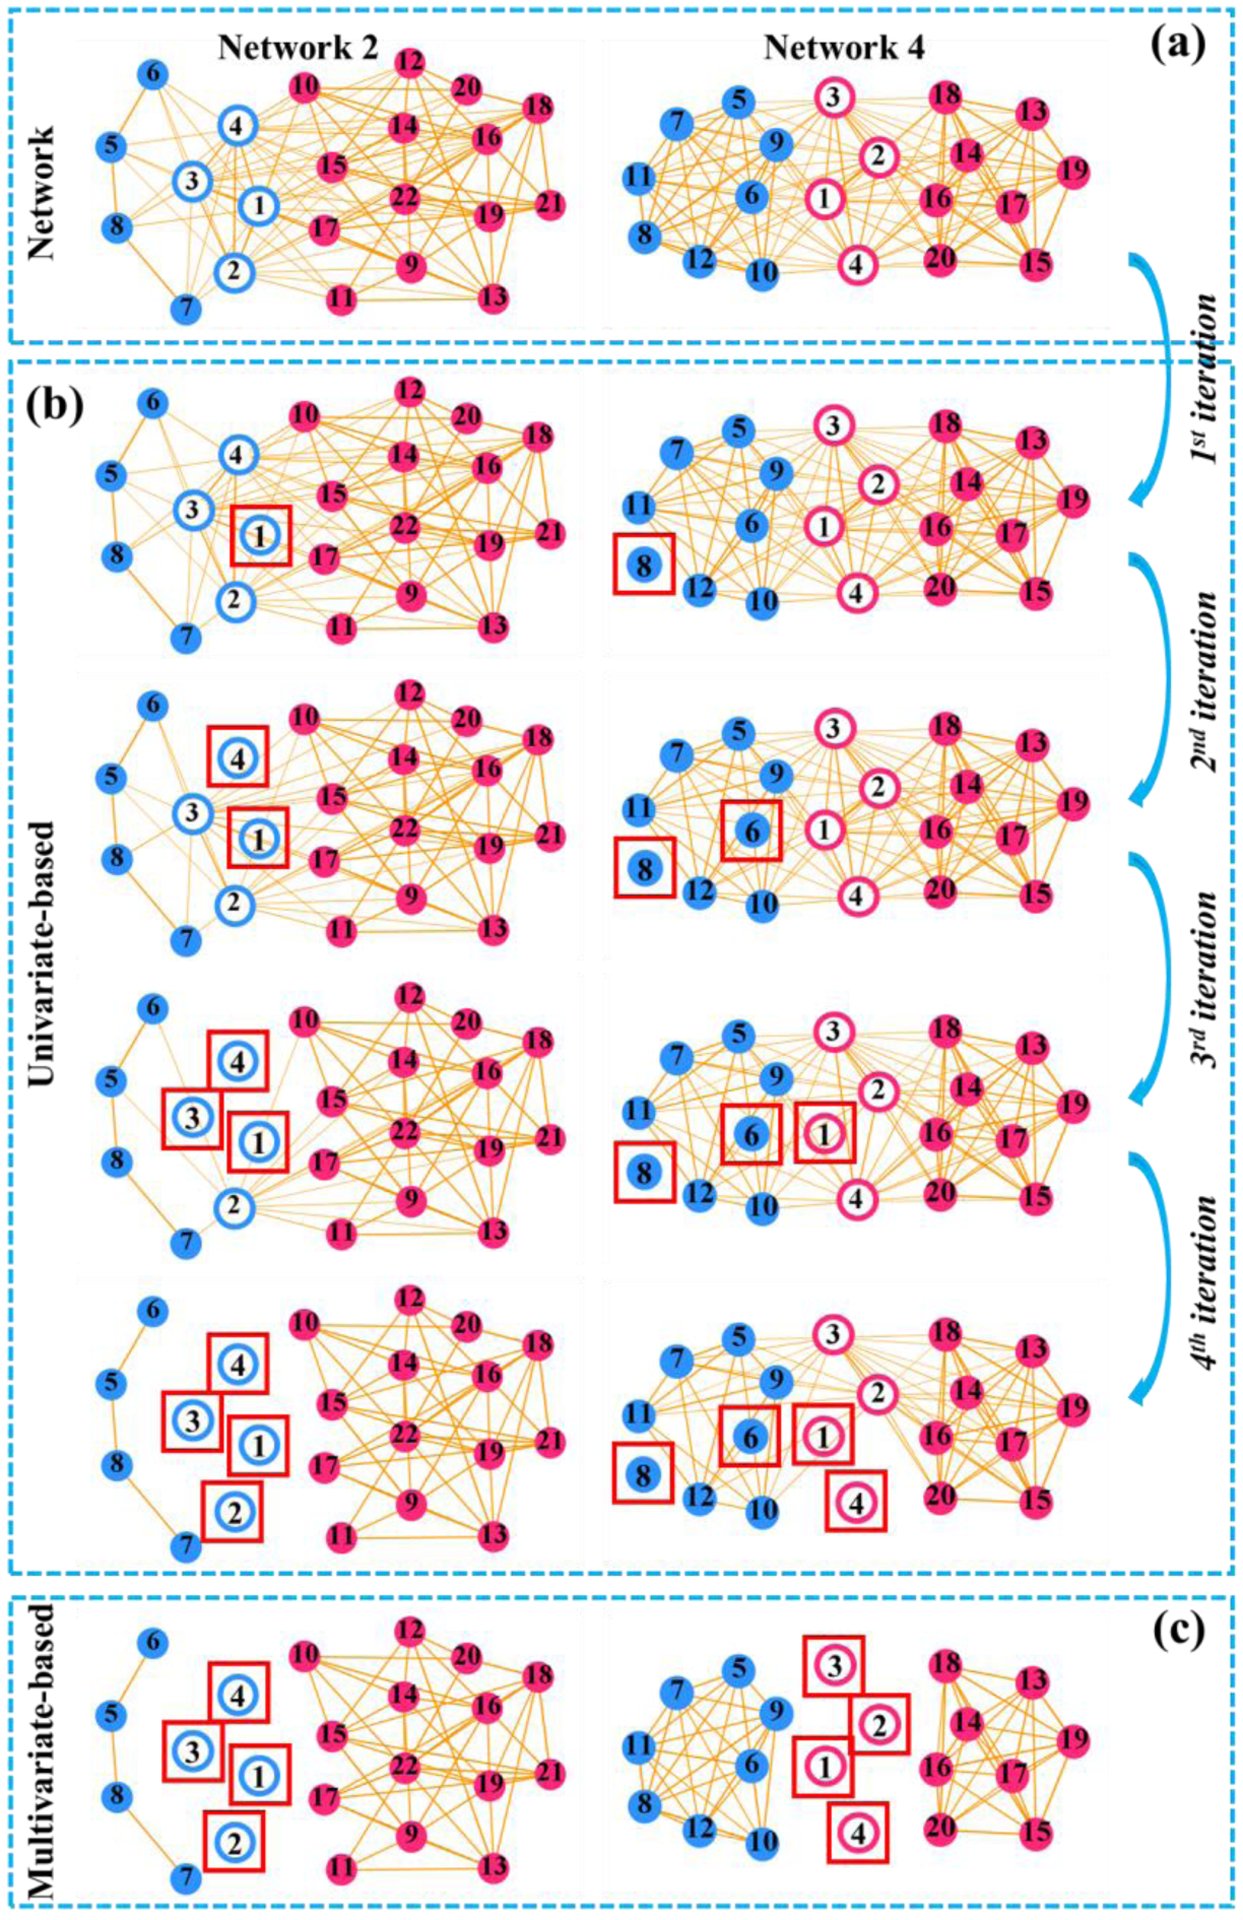
(a) Networks. (b) Univariate-based framework for hub identification. (c) Multivariate-based approach for joint hub identification. The red box marked the identified hub node.
3.2. Evaluation on Structural Network Data
A total of 128 subjects from the ADNI database (as shown in Table. II) are selected, in which each subject has longitudinal scans of T1-weighted MRI and DWI images. For each scan, we first segment T1-weighted MR images into white matter, gray matter, and cerebrospinal fluid using FreeSurfer (Fischl, 2012). Based on the tissue segmentation result, we construct the cortical surface and then calculate the cortical thickness. Next, we parcellate the cortical surface into 148 cortical regions and then apply surface seed based probabilistic fiber tractography, thus producing a 148 × 148 anatomical connectivity matrix (Destrieux et al., 2010). The weight of the anatomical connectivity of pair-wise regions is measured by the number of fibers between the regions. In the following experiments, we first evaluate our proposed population-based hub identification method by testing for consistency in those hubs detected among different sub-samples from a common larger cohort of network data. Then, we evaluate the replicability of hub identification results obtained by our proposed individual-based hub identification method. Finally, as mounting evidence shows decreased cortical thickness in AD (Lerch et al., 2008), we use permutation tests to study the differences in cortical thickness among normal control (NC), mild cognitive impairment (MCI), and Alzheimer’s disease (AD) cohorts at the identified hub nodes. Again, we compare our results to sorting-based (Tijms et al., 2013) and module-based (Guimerà and Nunes Amaral, 2005) hub identification methods.
Table II.
Demographic information about the ADNI database based on the baseline scan.
| Gender | Number | Range of Age | Average Age | NC | MCI | AD |
|---|---|---|---|---|---|---|
| Male | 74 | 55.0~90.3 | 74.3 | 20 | 39 | 15 |
| Female | 54 | 55.6~87.8 | 72.8 | 25 | 18 | 11 |
| Total | 128 | 55.0~90.3 | 73.7 | 45 | 57 | 26 |
Since there is no ground truth for us to know how many connector hubs exist within the human brain network, we calculate the network properties of small-world and scale-free as in (van den Heuvel and Sporns, 2013) to estimate the number of hub nodes K in the following real-data experiments. Specifically, we examine the distribution of nodal connectivity centrality in the whole population (NC+MCI+AD). To make the estimation more robust, we show the average of connectivity degree (blue), betweenness (orange), and clustering coefficient (green), across individual networks, in Fig. 6(a), where we sort the centrality degree in decreasing order. Furthermore, we also plot the ratio between the overall top-ranked nodes’ centrality and their nodal number, as shown in Fig. 6(b). Based on Fig. 6, we empirically use K = 8 for all hub identification methods in the following experiments since there is a relatively larger drop of nodal measurements after K = 8.
Fig. 6.

(a) The population average of connectivity degree (blue), betweenness (orange), and clustering coefficient (green) at each network node, where the values are sorted in decreasing order. (b) Profile of the ratio between the overall top-ranked nodes’ centrality and their nodal number. Blue represent the connectivity degree, orange is the betweenness, and green show the clustering coefficient.
In the following, we first compare the population-wise hub identification result using a voting strategy and our integrated strategy illustrated in Section 2.4. Next, we evaluate the replicability using the individual-based hub identification method on the test/re-test data. In the evaluation of statistical power for group comparison and diagnostic value for classification, we apply the population-based hub identification method since all individual networks are required to have a common set of hub nodes
3.2.1. Comparison between voting-based and our integrated method in population hub identification
Given a group of networks, conventional methods attempt to find a set of population-wise hub nodes by first detecting hub nodes in each network separately, and then applying a voting scheme to determine the most representative hubs. In contrast, our population-based hub identification method offers an integrated solution (Eq. (19)) to optimize the common set of hub nodes for all individual networks simultaneously. Due to a lack of ground-truth in the real brain network data, we evaluate the performance of the population-wise hub identification based on the consistency across the different number of hub nodes and based on the consistency across each resampling test.
A total of 128 networks were used to test the consistency of the hub node locations as the number of hubs was increased. According to the Fig. 6, we set K=6 as the baseline hub number and investigated the consistency of our integrated population-based hub identification method when increasing the number of hub nodes from 6 to 11. The results are shown in Fig. 7. Blue circles represent the location of nodes that were not identified when at the baseline case of hub number of K=8. Red circles represent the added hub nodes that were identified when increasing the number of hub nodes. There were no identified hub nodes at the baseline that were lost when increasing the hub number. These results show that our integrated population-based hub identification is consistent as the number of hub nodes is increased. Thus, in the following experiments, we only show the result obtained by the number of fixing K= 8.
Fig. 7.
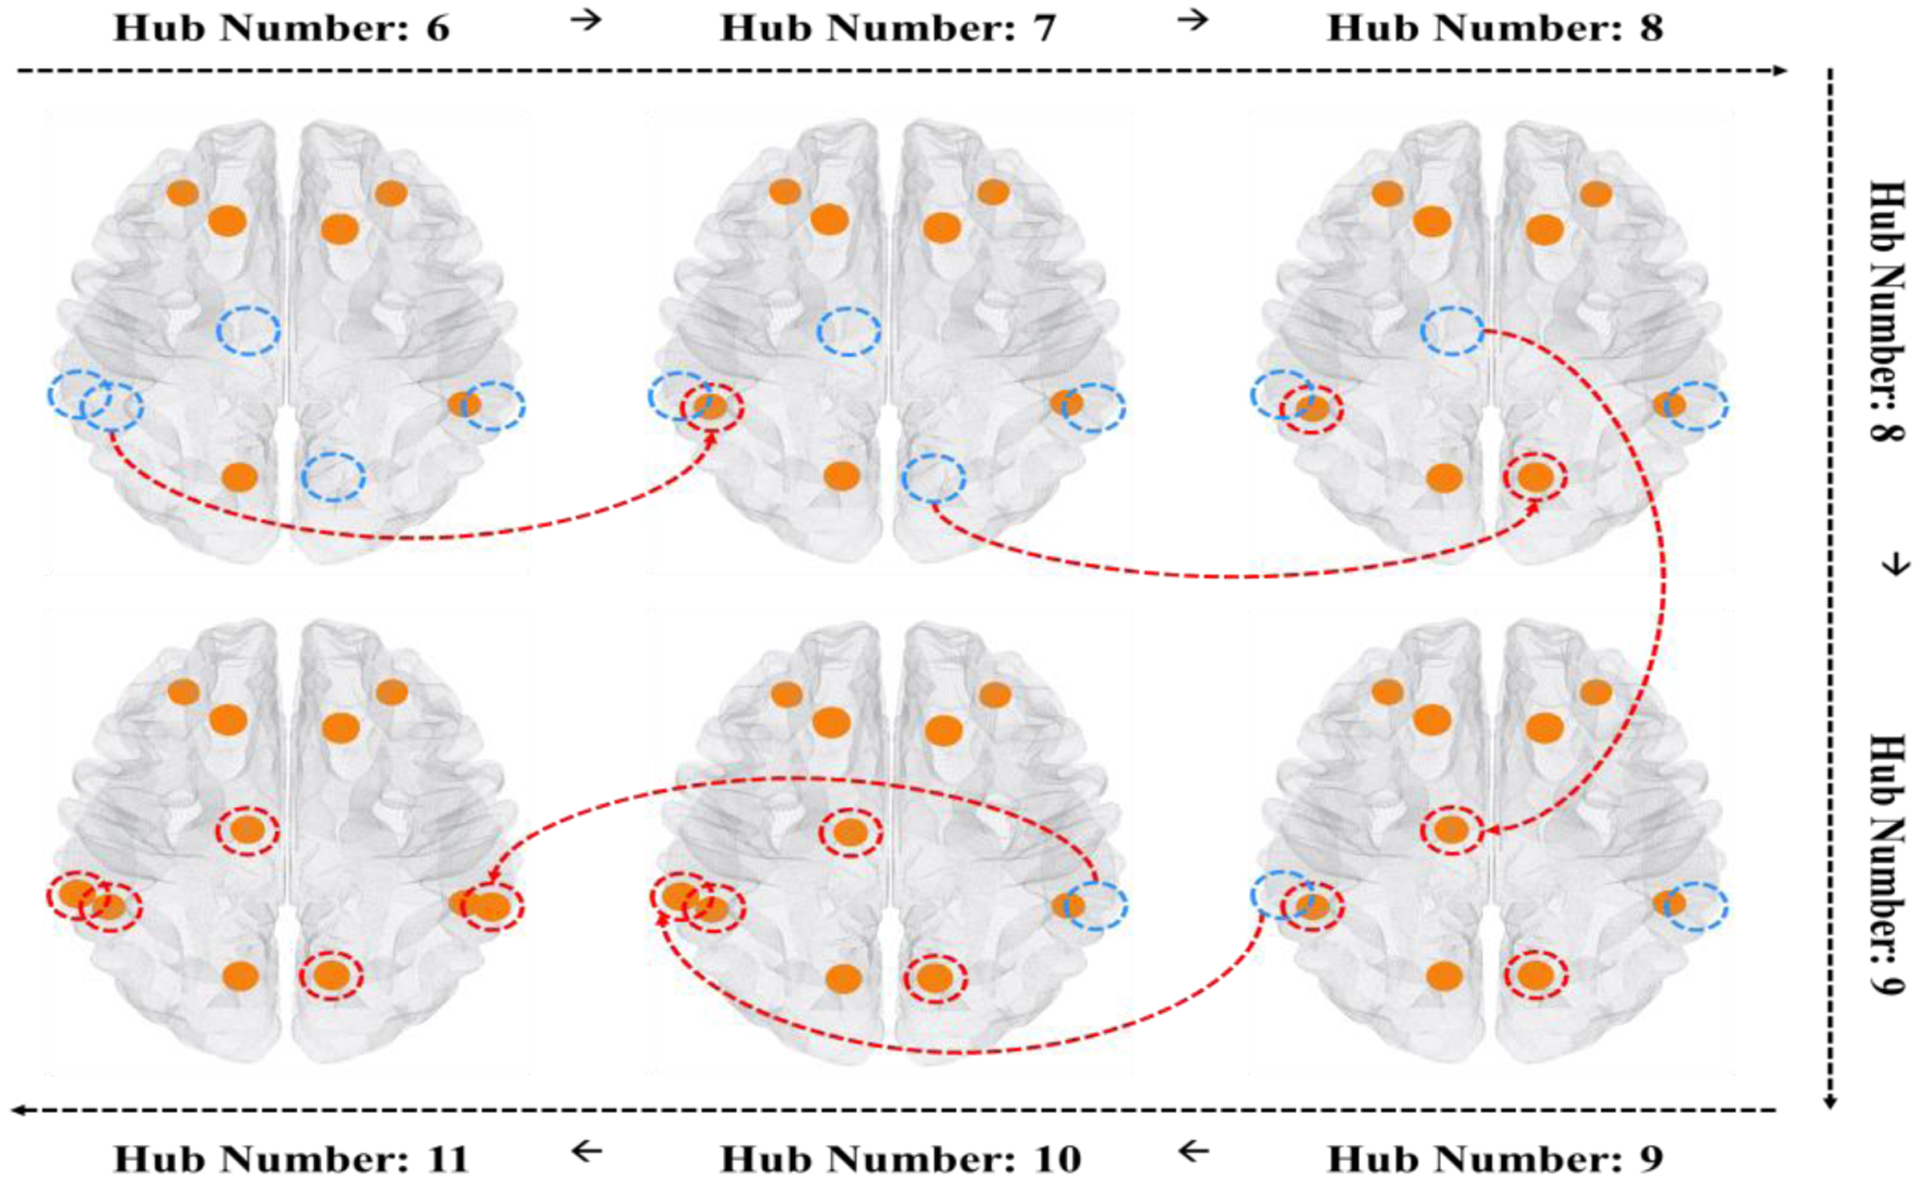
Consistency of common hub nodes being identified when sweeping the number of hub nodes from 6 to 11 by using the population-based method. Blue circles represent the location of nodes that were not identified when using the baseline number of 6. Red circles represent the added hub nodes that were identified when increasing the number of hub nodes
Second, we evaluate the performance of the population-wise hub identification based on the consistency across each resampling test. We randomly draw a subset of individual networks from the dataset and then identify the population-wise hub nodes for the sampled subset. By repeating this process for a sufficient number of times (100 resampling tests here), we can obtain the frequency histogram of each node being selected as a hub node across all resampling tests. Next, we calculate the entropy of frequency histogram for each method, where smaller values suggest a higher consistency in the resampling tests. Note, to reduce the influence of the diagnosis label, we divide the whole dataset into three groups: NC, MCI, and AD. Here, there are 45 NC, 57 MCI, and 26 AD subjects. Fig. 8 shows the curve of entropy with respect to the number of samples drawn in each resampling test, where the conventional sorting-based+voting, module-based+voting, and our integrated method are displayed in green, red, and yellow, respectively. To specifically evaluate the contribution of the integrated strategy proposed in our method, we show the consistency performance of our individual-based hub identification+voting in blue. Notably, our population-based hub identification method produces more consistent results compared to the other methods, particularly when the population sample size is small.
Fig. 8.

Test and retest in terms of the consensus of common hub nodes being identified between different population networks sampled and resampled from the same ADNI structural brain network data sets.
3.2.2. Consistent Hub Identification of Structural Networks Facilitates Longitudinal Brain Studies
Here, we select 128 pairs of consecutive longitudinal scans where the time interval between two scans in each pair is less than twelve months and there is no change of diagnostic label. Thus, it is reasonable to assume that the hub nodes do not change significantly between the two longitudinal scans. Then, we deploy each hub identification method to each scan separately and examine the common hubs identified within each pair. The percentages of hub nodes being selected in both time points over the total number of the identified hub nodes are 66%, 55%, and 67% by sorting-based, module-based, and our proposed individual hub identification method, respectively. Furthermore, we show the count histogram of each network node being both identified in each longitudinal pair in the left panel of Fig. 9(a)–(c), and the count histogram of common hub nodes being identified in each longitudinal pair in the bottom panel of Fig. 9(a)–(c). We calculate the entropy value (shown in Fig. 9) based on the count histogram of each network node being both identified in each longitudinal pair. Our method achieves the smallest entropy value, indicating better replicability over the other two conventional methods. Especially, there are more pairs of consecutive longitudinal scans being identified with a relatively high common hub number). Also, we display the identified hub node in Fig. 9, where a larger node size denotes the higher frequency with which the hub node was detected in both consecutive scans.
Fig. 9.
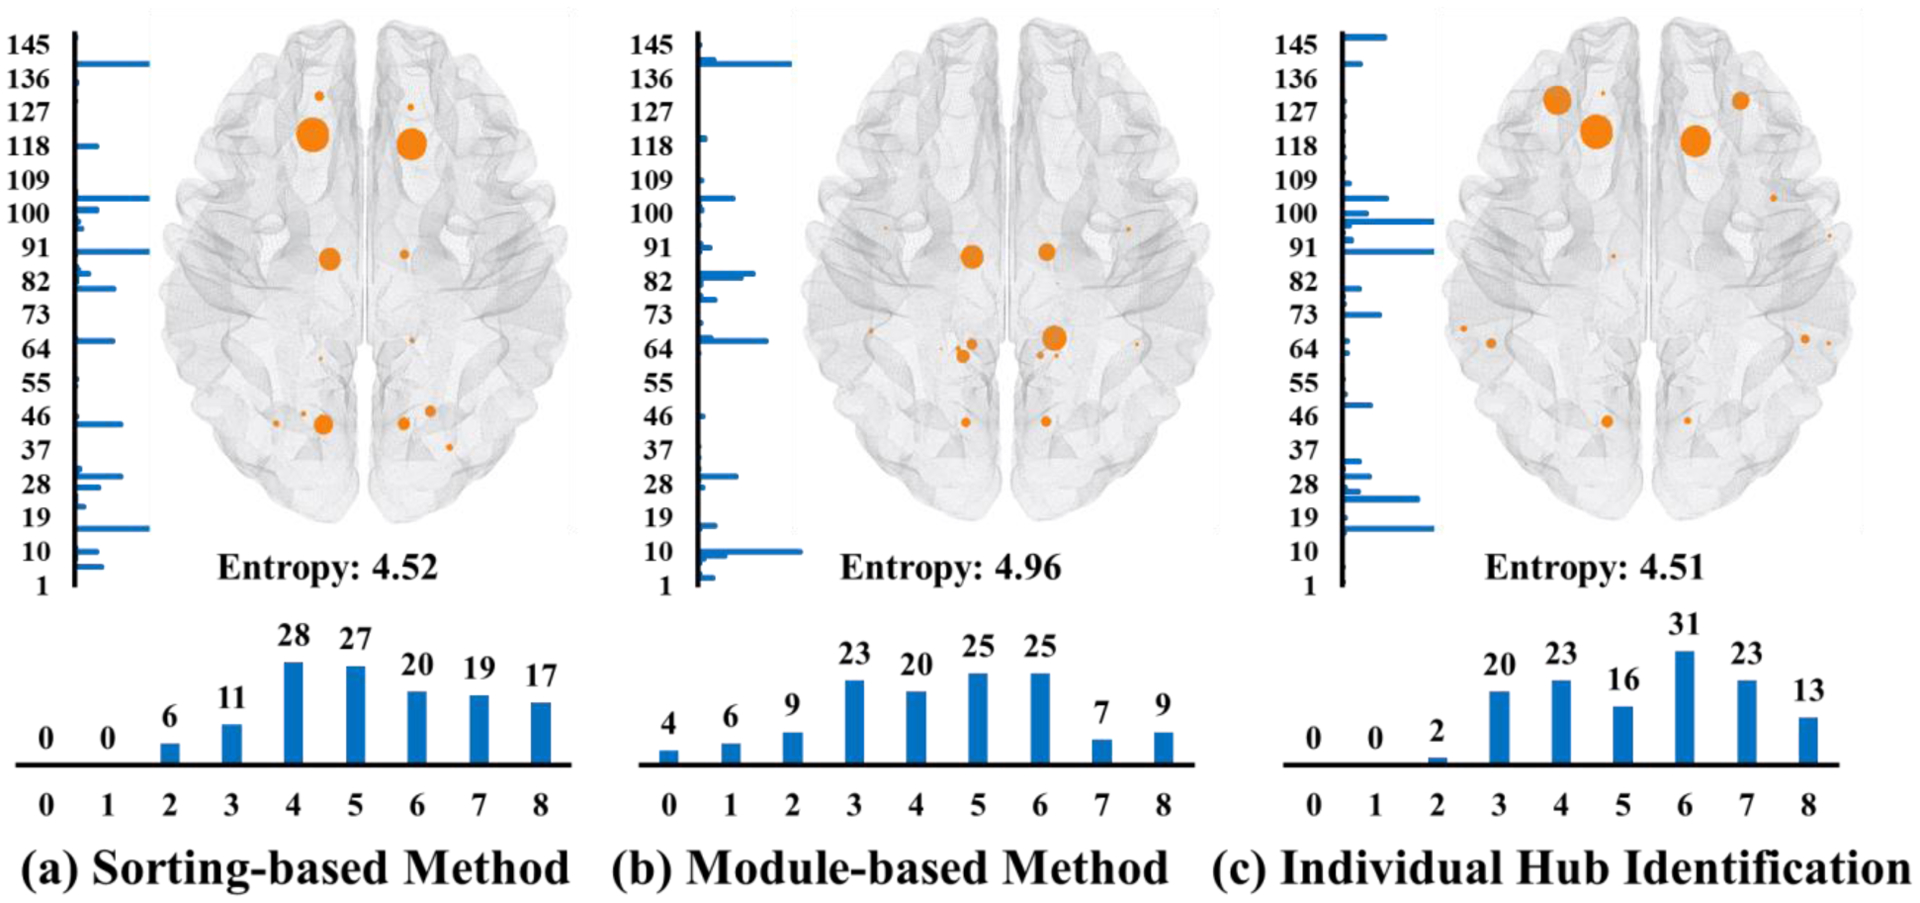
Replicability test in terms of the consensus of common hub nodes being identified in two consecutive longitudinal scans by sorting-based (a), module-based (b), and our method (c).
3.2.3. Evaluation of the Statistical Power of Identified Hub Nodes
In this experiment, a total of 128 subjects (45 NC, 57 MCI, and 26 AD) are selected. Here, we first identify/vote the eight most representative hub nodes from the hub identification results of each scan. Then we examine the statistical power at the identified hub nodes by applying a two-sample significant permutation test (p<0.05) of cortical thickness. Here, we randomly permute the subject diagnoses (NC vs MCI, NC vs AD, MCI vs AD) 5000 times and then obtain the empirical p-value to report the significance of the identified hub nodes on cortical thickness. In Fig. 10 (a), we display the 16 nodes that were identified by at least one of the three hub identification methods. Both left (#13) and right (#14) Precuneus gyrus, shown in Fig. 10 (b)–(d), are selected by all three hub identification methods. In Fig. 10 (b)–(d), we show the statistical tables for sorting-based+voting, module-based+voting, and our proposed population-based hub identification method, respectively. In each table, the first and second columns show the location and the voting consensus of each representative hub node. ‘√’ and ‘×’ denote significance and non-significance after two-sample permutation tests. The hub nodes identified by our method (5 regions for NC vs AD, and 6 regions for MCI vs AD) have greater ability to statistically distinguish the patient populations compared to the other two hub detection methods (Sorting-based+Voting: 4 regions for NC vs AD, and 5 regions for MCI vs AD; Module-based+Voting: 5 regions for NC vs AD, and 5 regions for MCI vs AD).
Fig. 10.
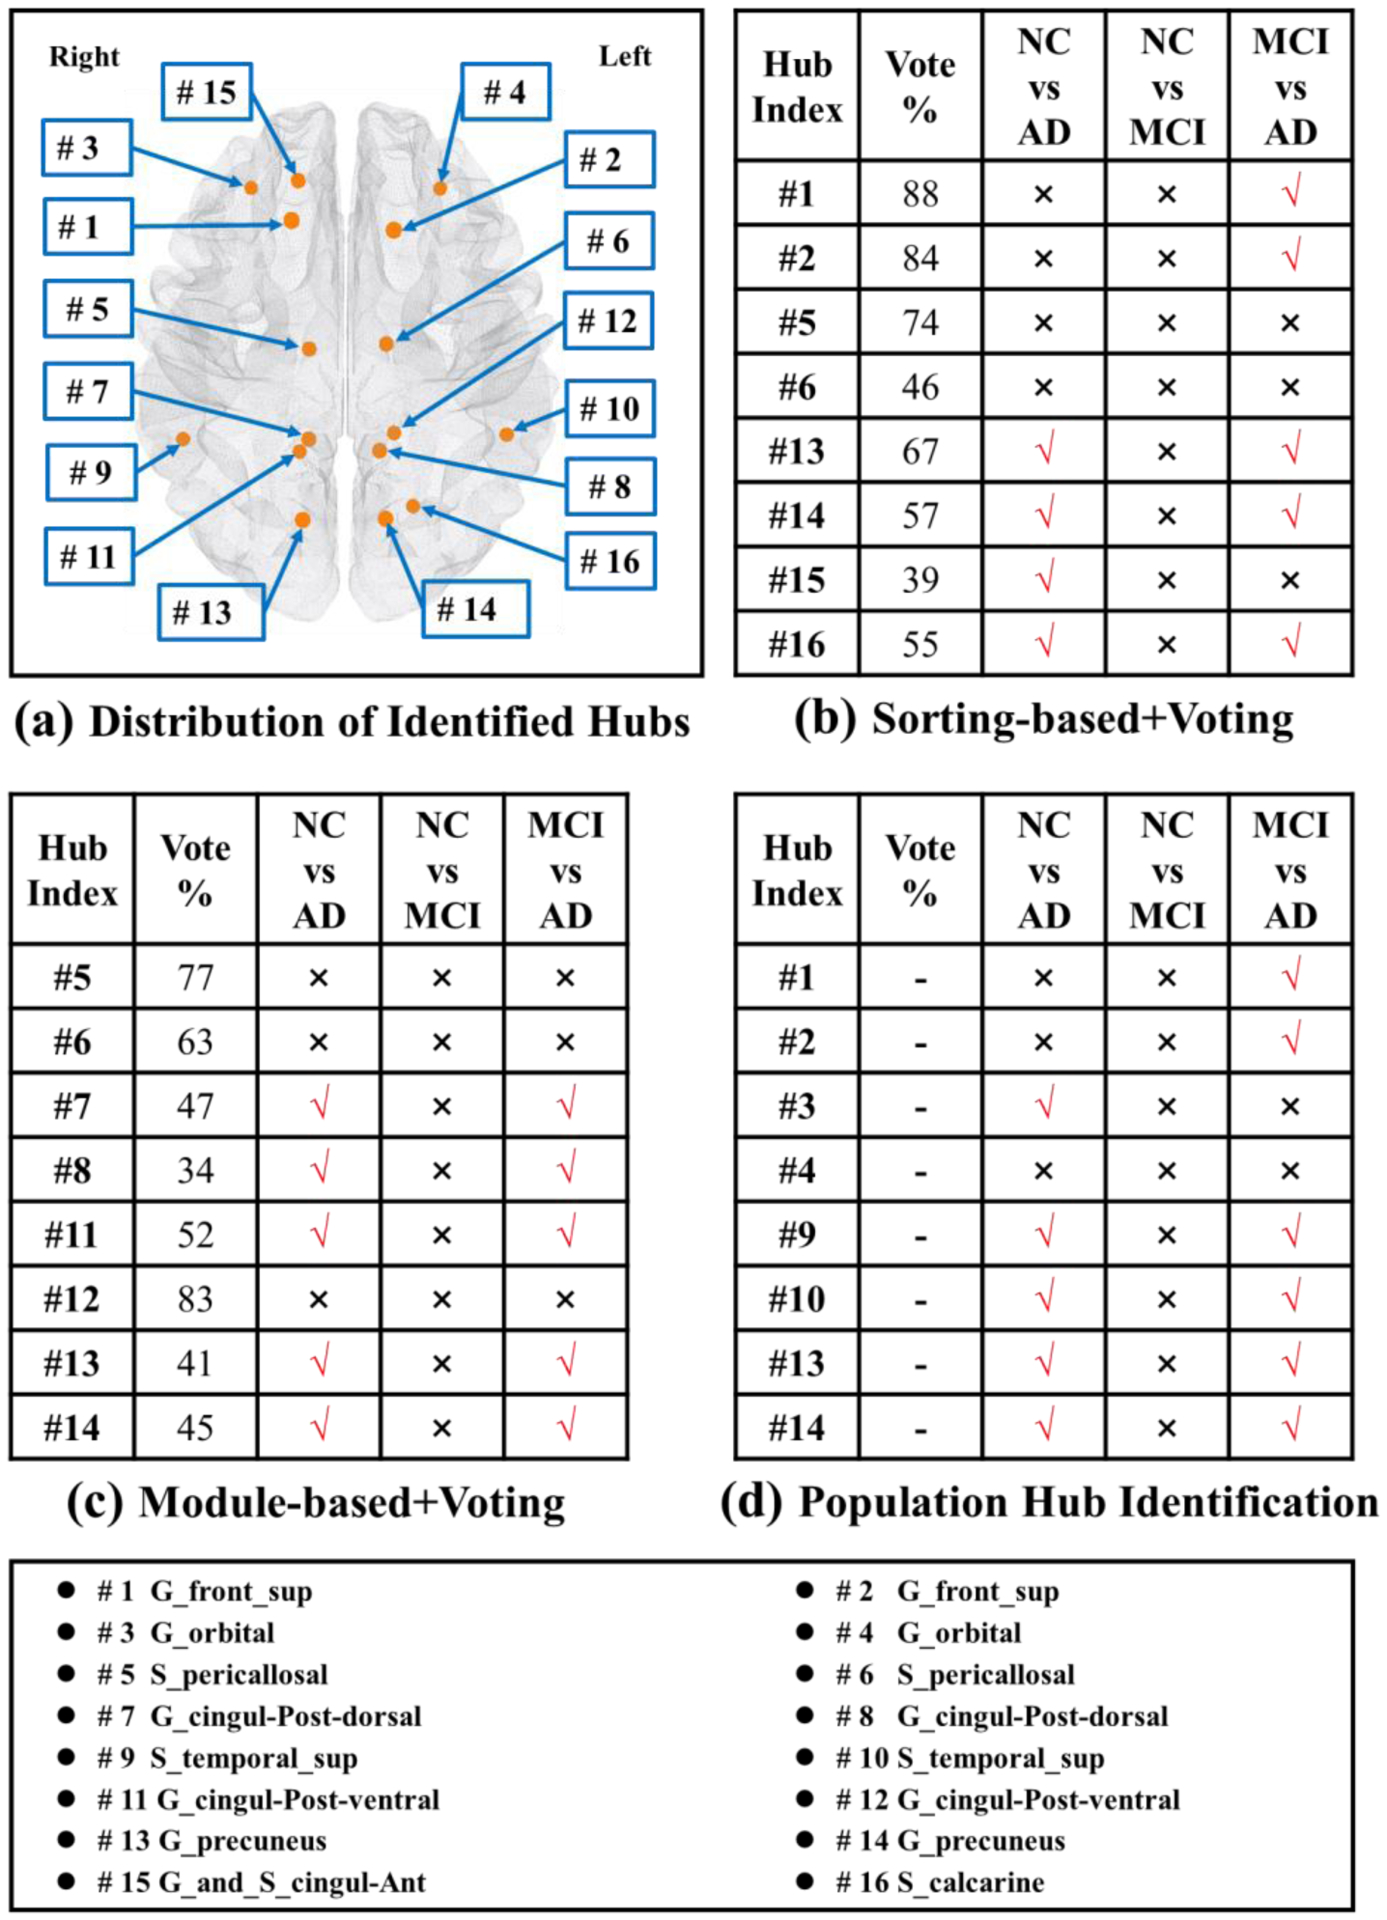
The location of representative hub nodes and statistical power comparison at hub nodes between NC, MCI, and AD. (a) Spatial distribution of identified hub nodes, where each node has been identified by at least one of the three hub identification methods tested. Statistical tests for differences in the cortical thickness at hub nodes identified via the sorting-based+voting (b), the module-based+voting (c), and our proposed population-based hub identification method (d).
3.2.4. Evaluation of the Diagnostic Value of Identified Hub Nodes
To demonstrate the diagnostic value of identified hub nodes, one application is to use features extracted from these nodes in the network to classify AD. For clarity, we only show the classification between NC and AD cohorts by using the nodal cortical thickness at the identified hubs. Here, a total of 71 subjects (45 NC and 26 AD) are divided into a training dataset of 57 subjects (36 NC and 21 AD) and test dataset of 14 subjects (9 NC and 5 AD). Then we use a 10-fold cross-validation based SVM to train the classifier and report the classification accuracy, precision, and recall. Here, we use an SVM model with an RBF kernel function. To enhance the reliability of our results, we repeat this process five times. Note, for each repeat, the test data is different, and eventually, all the subjects have been used as the test dataset. Thus, a reliable average result is reported, as shown in Table III. Note, we use the same parameters for the SVM, but we use the cortical thickness at different hub nodes. In each repeat, the set of hub nodes were identified from the training data. In accordance with our single feature comparisons in Fig. 10, the classifier trained using the features of cortical thickness extracted at the hub nodes identified by our population-based method exhibited enhanced performance over those models trained using more traditional hub detection methods (Table III).
Table. III.
NC/AD classification accuracy by using the cortical thickness as the features at the hub nodes identified by sorting-based, module-based, and our method, respectively.
| Hub Identification Methods | Accuracy | Precision | Recall |
|---|---|---|---|
| Sorting-based Method | 72.86±5.98% | 73.96±6.07% | 91.11±9.30% |
| Module-based Method | 70.00±11.74% | 73.03±7.35% | 84.44±12.67% |
| Population-based Hub Identification | 77.14±5.98% | 77.26±7.34% | 93.33±9.94% |
3.3. Evaluation on Functional Network Data
In this section, two functional neuroimaging datasets are used to evaluate the accuracy and replicability of hub identification results. The first dataset consists of 944 pairs of test/retest resting-state fMRI scans from HCP (Human Connectome Project) database, where the participants are healthy adults (aged 22–35). MRI scanning was done using a customized 3T Siemens Connectome Skyra with a standard 32-channel Siemens receive head coil and a body transmission coil. T1-weighted high resolution structural images acquired using a 3D MPRAGE sequence with 0.7 mm isotropic resolution (FOV = 224 mm, matrix = 320, 256 sagittal slices, TR = 2400 ms, TE = 2.14 ms, TI = 1000 ms, FA = 8°) were used in the HCP minimal preprocessing pipelines to register functional MRI data to a standard brain space. Resting state fMRI data were collected using gradient-echo echo-planar imaging (EPI) with 2.0 mm isotropic resolution (FOV = 208 × 180 mm, matrix = 104 × 90, 72 slices, TR = 720 ms, TE = 33.1 ms, FA = 52°, multi-band factor = 8, 1200 frames, ~15 min/run). The second dataset consists of 124 subjects (63 control subjects and 61 subjects identified with obsessive-compulsive disorder), which has been published in (Dong et al., 2019). The demographic information is shown in Table. IV. Each subject has corresponding T1-weighted images (TR = 8 ms, TE = 1.7 ms, flip angle = 20°, resolution = 1.0 × 1.0 × 1.0 mm3) and resting state fMRI data (TR=2s, TE=60ms, flip angle=90°, resolution = 3.0 × 3.0 × 4.0 mm3).
Table. IV.
Demographic information about the OCD database based on the baseline scan.
| Gender | Number | Range of Age | Average Age | NC | OCD |
|---|---|---|---|---|---|
| Male | 36 | 13~59 | 25.4 | 20 | 16 |
| Female | 88 | 13~44 | 23.0 | 43 | 45 |
| Total | 124 | 13~59 | 23.7 | 63 | 61 |
All these data were preprocessed by using the Statistical Parametric Mapping toolbox and Data Processing Assistant for Resting-State fMRI with the following essential steps: 1) slice timing correction; 2) head motion correction; 3) realignment with the corresponding T1-volume; 4) nuisance covariate regression; 5) spatial normalization into the stereotactic space of the Montreal Neurological Institute and resampling at 3×3×3 mm3; 6) spatial smoothing with a 6-mm full-width half-maximum isotropic Gaussian kernel, and band-pass filtered (0.01–0.08 Hz). For the HCP dataset, we parcellated each scan into 268 regions using a functional atlas (Shen et al., 2013). Note that since we are more interested in the default and attention subnetworks (total of 58 regions), and a 58×58 functional connectivity matrix was computed based on the correlation of mean time course of the BOLD (blood oxygen level-dependent) signals. For the OCD dataset, we parcellated each brain into 90 AAL regions (Tzourio-Mazoyer et al., 2002) which results in a 90 × 90 functional connectivity matrix for each subject. All functional connectivity matrices were preprocessed by using a conventional standard pipeline: (1) setting all negative correlations to zero and (2) density-based thresholding (keeping the 40% of the total positive edges).
The following experiments in this section are arranged with a similar design as the above section 3.2. We first evaluate the replicability of hub identification obtained by our proposed individual-based hub identification method on the test/re-test data from HCP database. Since OCD patients showed decreased small-world efficiency (Shin et al., 2014) such as nodal efficiency and nodal clustering, we then use the local efficiency and clustering coefficient as the nodal feature to evaluate the statistical power of the identified hub nodes, where we use the permutation test to carry out a classic statistical population comparison (local efficiency and clustering coefficient) between normal control (NC) and obsessive-compulsive disorder (OCD) at the identified hub nodes. Note, the total number of hub nodes is set to eight, i.e., K = 8, after we examine the distribution of nodal centrality degrees in the population of functional networks (please refer to Fig. 6).
3.3.1. Replicability Test of Hub Identification on HCP dataset
Here, we deploy each hub identification method to each scan separately and examine the common hubs identified within each pair. The replicability was defined as being selected as hub nodes in test/retest network data. The sorting-based, module-based, and our joint hub identification methods are depicted visually in Fig. 11(a)–(c), respectively. Additionally, we show the count histogram of each network node being both identified in each pair of networks in the left panel of Fig. 11(a)–(c) and the count histogram of common hub nodes being identified in each test-retest pair in the bottom panel of Fig. 11(a)–(c). The quantitative results of entropy value based on each network node being both identified in each pair of networks are shown in the bottom of Fig. 11, which are 5.78 by sorting-based method, 5.81 by module-based method, and 5.33 by our method. For the functional networks, our method also achieves the smallest entropy value, consistently showing greater replicability performance as we demonstrated in Fig. 9 for structural networks. Similarly, we display the frequency of being identified as a hub node in the setting of brain surfaces, as shown in Fig. 11, where larger node size indicates more consistency of the hub identification results between test and re-test fMRI data.
Fig. 11.
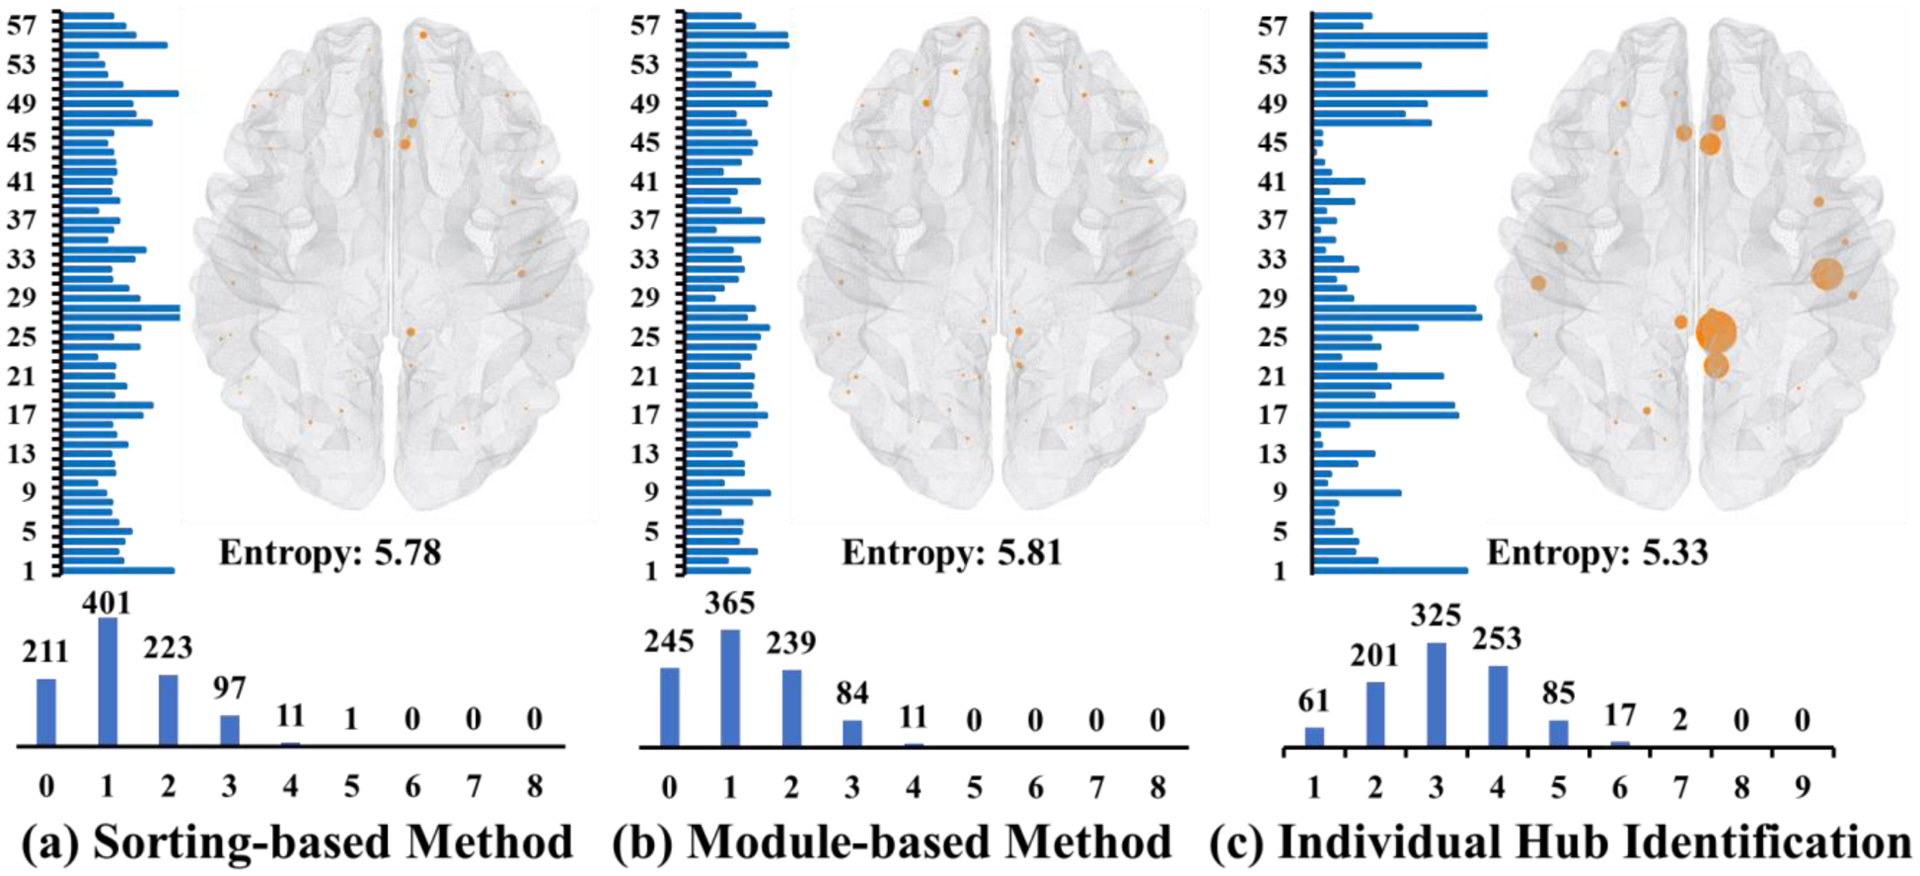
Replicability test in terms of the consensus of common hub nodes being identified in two consecutive longitudinal scans by sorting-based (a), module-based (b), and our proposed individual-based hub identification method (c).
Furthermore, we also evaluate the performance of our proposed hub identification method under different population size of brain networks. Here, a bootstrap resampling framework was applied. Firstly, we randomly sampled a subset (population size from 100 to 900) from the above 944 test/retest pairs. Then, we applied these four methods to find the common hub nodes between the test and retest experiments. To obtain a reliable result, we repeat the above process 100 times. As shown in the Fig. 12, our proposed individual-based (blue curve) and population-based (yellow curve) hub identification methods perform better than the conventional sorting-based+voting (green curve) and module-based+voting methods (red curve).
Fig. 12.
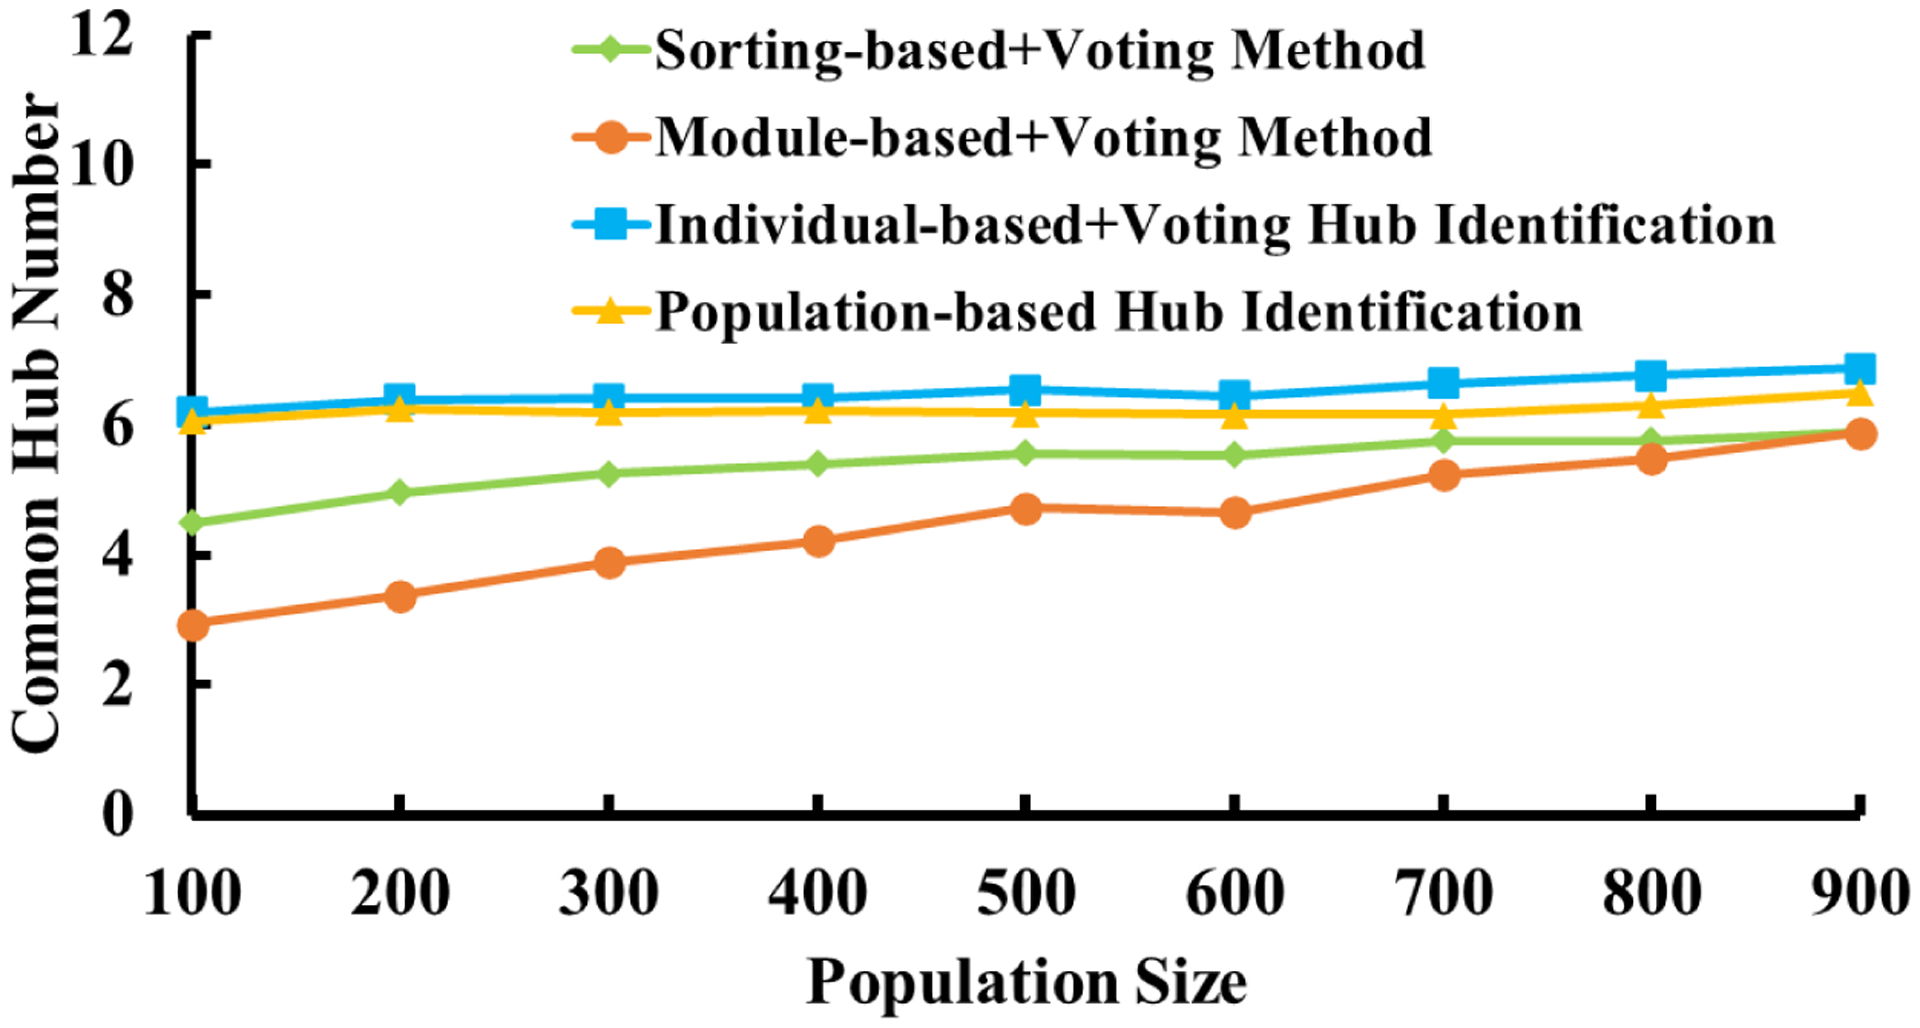
The consensus of common hub nodes being identified across different population networks sampled and resampled from the test/retest dataset.
3.3.2. Evaluation of the Statistical Power of the Identified Hub Nodes on OCD dataset
To investigate the statistical power of the identified hub nodes by our population-based hub identification method, a total of 124 subjects, which included 63 NC and 61 OCD cases, are employed. First, using the functional connectivity matrices from all 124 subjects we identify the eight most representative hub nodes for the OCD dataset. Then, we apply two-sample permutation test (p<0.05) of local efficiency and clustering coefficient to examine the power of these identified hubs. Here, we randomly permute the subject diagnoses (NC vs OCD) 5000 times and then obtain the empirical p-value to report the significance of the identified hub nodes on local efficiency and clustering coefficient. Fig. 13(a) shows the total of 23 most representative hubs, where each has been identified at least one of the three hub identification methods. Fig. 13(b)–(d) show the statistical result by sorting-based+voting, module-based+voting, and our proposed population-based hub identification method, respectively. In each table, the first and second rows show the location and the voting consensus of each representative hub node. ‘√’ and ‘×’ denote statistical significance and non-significance after permutation test. Based on the tables in Fig. 13(b)–(d), the representative hub nodes identified by our method show a more statistical power compared with the other two methods (soring-based+voting and module-based+voting). Furthermore, the distribution of hub nodes identified by our proposed population-based hub identification method best agrees with the previous studies that suggested that the caudate (#4), putamen (#17), thalamus (#11, #14), hippocampus (#15), orbitofrontal cortex, anterior cingulate cortex (#12), and striatum are the most relevant regions in OCD (Anticevic et al., 2014; Brennan et al., 2013).
Fig. 13.
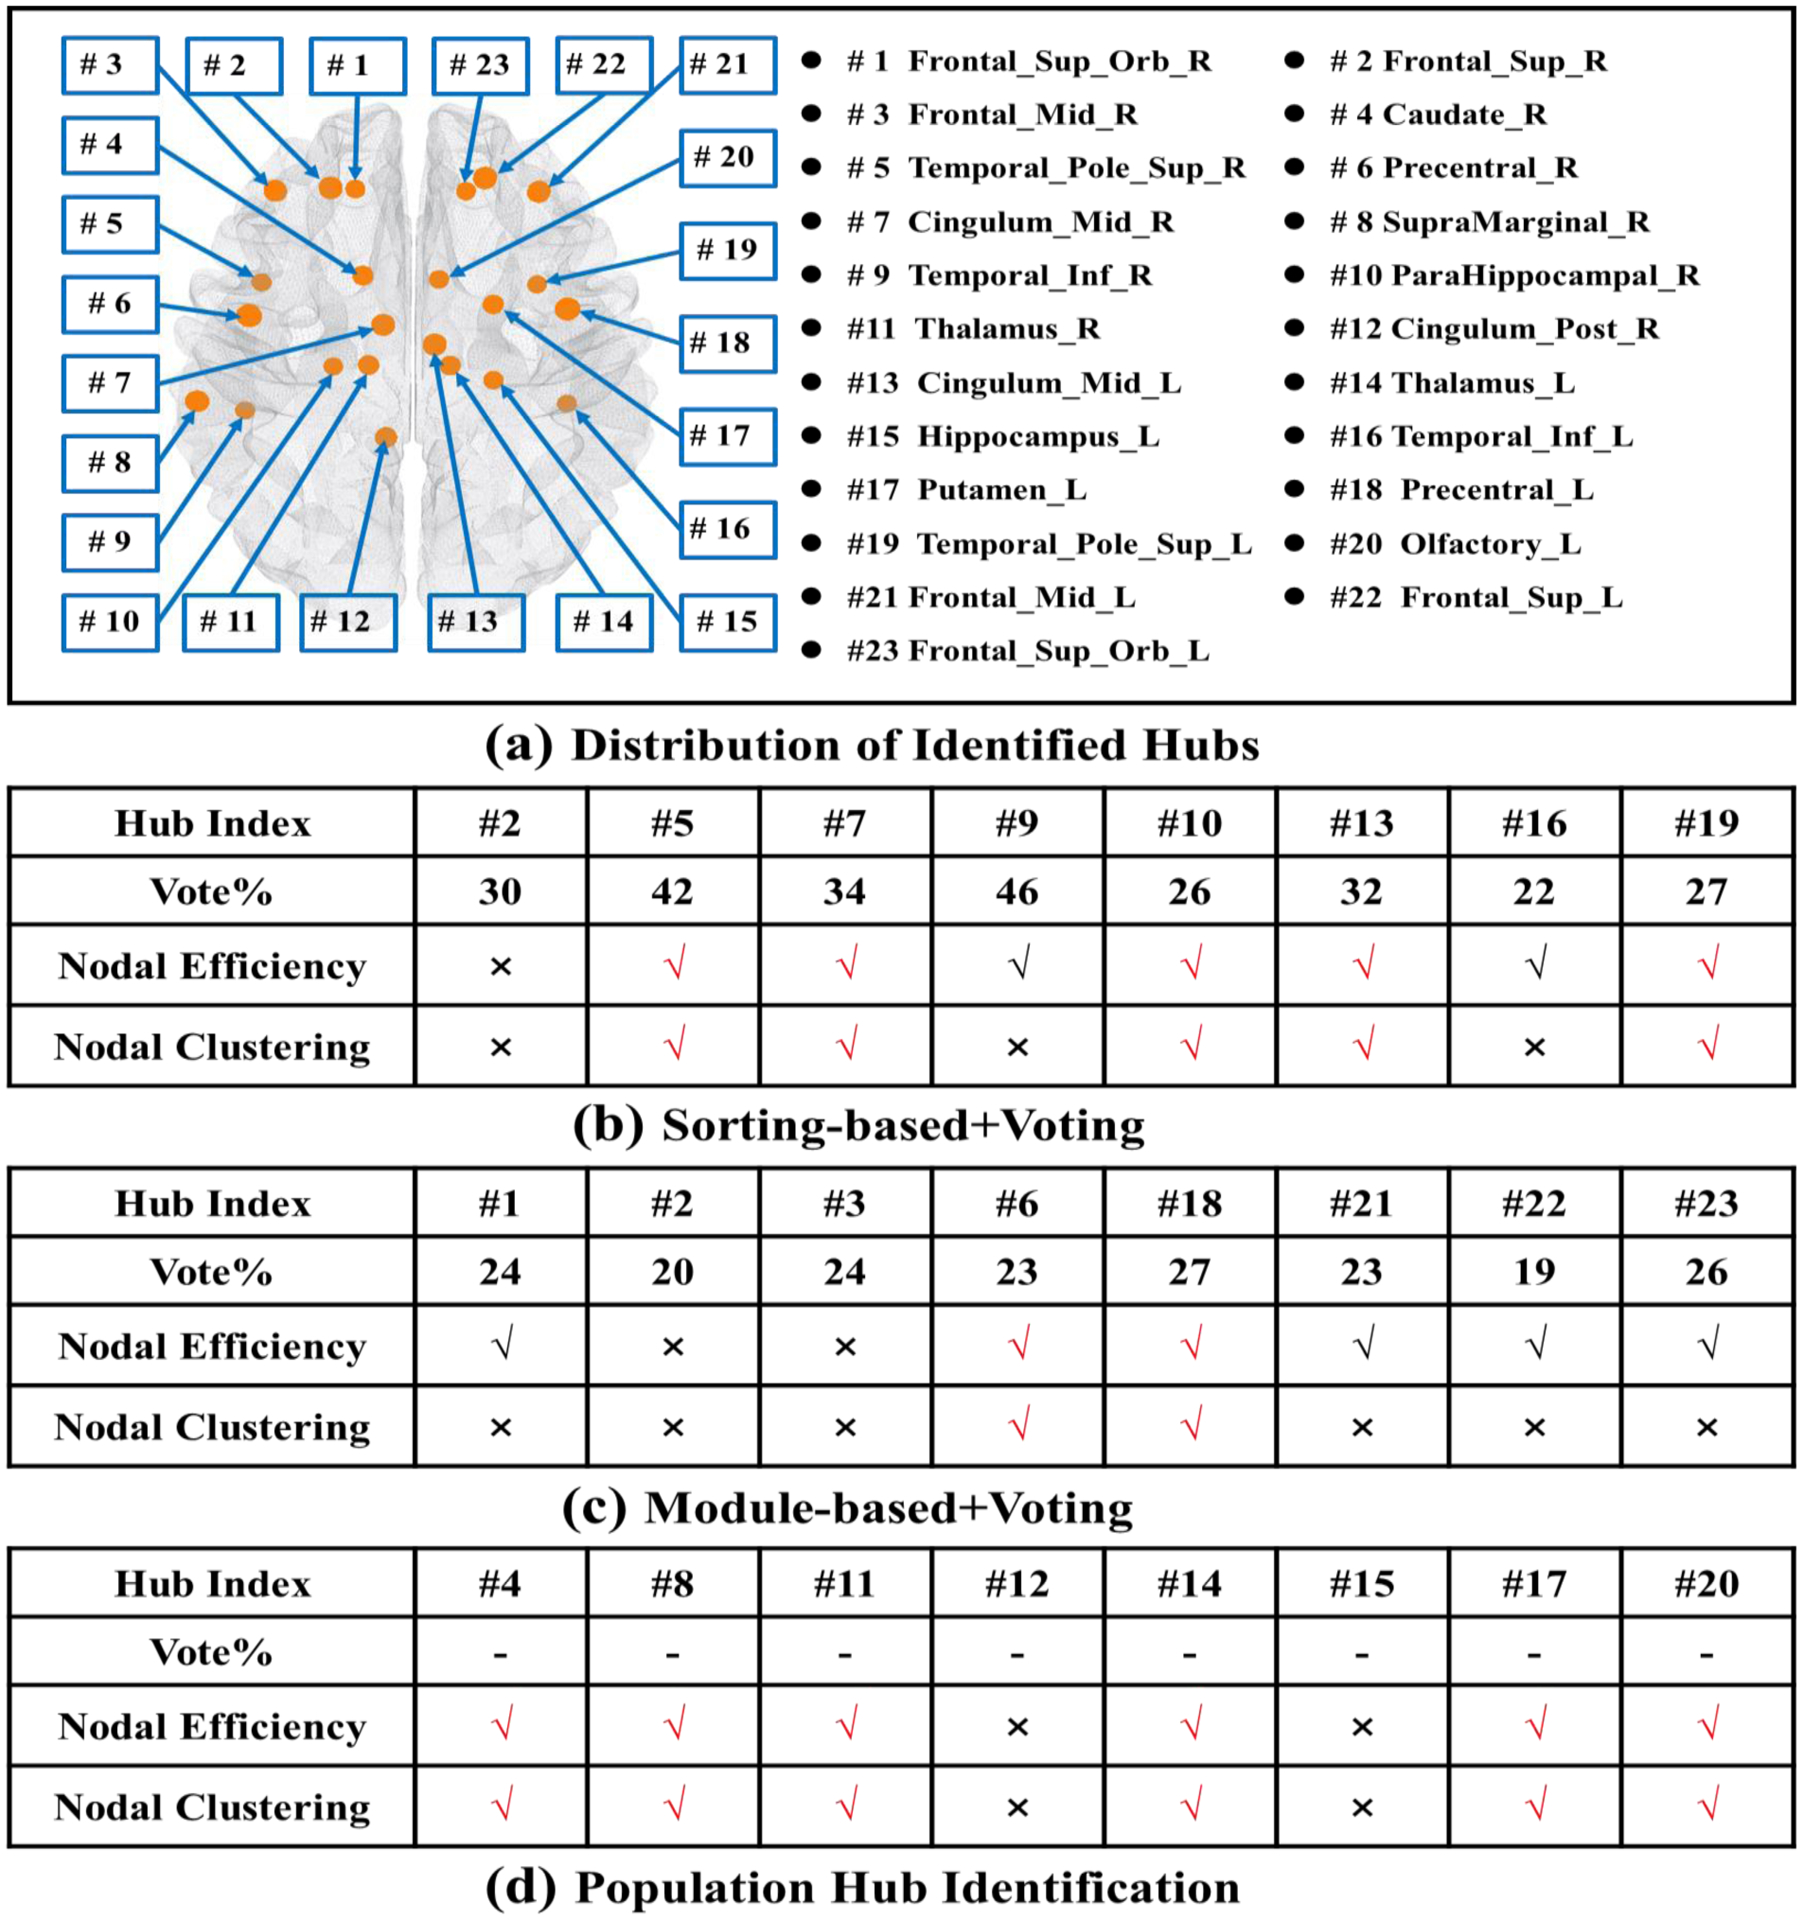
The location of representative hub nodes and statistical power comparison at hub nodes between NC and OCD. (a) Spatial distribution of identified hub nodes, where each node has been identified by at least one of the three hub identification methods tested. Statistical tests for differences in the local efficiency and clustering coefficient at hub nodes identified via the sorting-based+voting (b), the module-based+voting (c), and our proposed population-based hub identification method (d).
4. Conclusion
Computational studies suggest that, compared to other nodes in the network, damage to connector hubs have a more widespread effect on the network dynamics, resulting in more pervasive dysfunction of the system (Fornito et al., 2015; Gratton et al., 2012). Hence, identification of connector hub nodes from brain networks is a necessary first step to understanding human brain function under normal and pathological conditions. To identify the connector hub nodes from brain network more accurately, we present a novel multivariate hub identification method using graph spectrum theory. We jointly find a set of critical nodes in the network, where the removal of these identified candidate hubs would break down the network into largest number of connected components. To achieve this, we present an augmented Lagrange Multiplier-based approach to covert the NP-hard combinatory optimization into a convex optimization framework. We have demonstrated the accuracy and the power of our proposed hub identification method using both simulated and experimentally obtained graph networks. Comparative analysis using simulated networks revealed our proposed hub identification method discovered connector hub nodes with higher accuracy and sensitivity than conventional univariate approaches. Furthermore, using experimentally obtained structural and functional brain network data we illustrated the value and the power of our joint hub identification method in distinguishing network alterations related to disorders such as AD and OCD.
Additionally, to make our proposed hub identification method more widely applicable, we proposed a population-based hub identification method, which can identify a set of common hub nodes simultaneously from a group of networks across different populations or longitudinal time points. Our experimental results confirmed that our proposed population-based hub identification method yields superior results compared to methods that detect hubs separately for each network and then apply a voting scheme.
Both our proposed individual-based and the population-based hub identification methods performed better than the current state-of-art methods. In the future, we plan to further demonstrate our proposed method’s generalizability by applying it to studies of other neurological diseases.
Highlights.
A novel multivariate hub identification method to jointly find a set of critical connector hub nodes in the network.
An extension of population-wise hub identification was also proposed to identify a set of common hubs from a group of networks across different populations or longitudinal time points.
Experiments based on both structural and functional data demonstrated the population-wise hub identification has a more power on distinguishing network alterations related to disorders such as Alzheimer’s disease and obsessive-compulsive disorder.
Acknowledgements
This work is supported by the National Natural Science Foundation of China Grant No. 61801157, the National Institutes of Health (NIH) Grant No. AG059065, AG068399, and AG070701.
Footnotes
Publisher's Disclaimer: This is a PDF file of an unedited manuscript that has been accepted for publication. As a service to our customers we are providing this early version of the manuscript. The manuscript will undergo copyediting, typesetting, and review of the resulting proof before it is published in its final form. Please note that during the production process errors may be discovered which could affect the content, and all legal disclaimers that apply to the journal pertain.
Declaration of interests
The authors declare that they have no known competing financial interests or personal relationships that could have appeared to influence the work reported in this paper.
5. Reference
- Achard S, Delon-Martin C, Vértes PE, Renard F, Schenck M, Schneider F, Heinrich C, Kremer S, Bullmore ET, 2012. Hubs of brain functional networks are radically reorganized in comatose patients. Proceedings of the National Academy of Sciences 109, 20608–20613. [DOI] [PMC free article] [PubMed] [Google Scholar]
- Achard S, Salvador R, Whitcher B, Suckling J, Bullmore E, 2006. A resilient, low-frequency, small-world human brain functional network with highly connected association cortical hubs. Journal of Neuroscience 26, 63–72. [DOI] [PMC free article] [PubMed] [Google Scholar]
- Afshari S, Jalili M, 2017. Directed functional networks in Alzheimer’s disease: disruption of global and local connectivity measures. IEEE journal of biomedical and health informatics 21, 949–955. [DOI] [PubMed] [Google Scholar]
- Alexander-Bloch AF, Vertes PE, Stidd R, Lalonde F, Clasen L, Rapoport J, Giedd J, Bullmore ET, Gogtay N, 2012. The anatomical distance of functional connections predicts brain network topology in health and schizophrenia. Cerebral cortex 23, 127–138. [DOI] [PMC free article] [PubMed] [Google Scholar]
- Andjelković M, Tadić B, Melnik R, 2020. The topology of higher-order complexes associated with brain hubs in human connectomes. Scientific reports 10, 1–10. [DOI] [PMC free article] [PubMed] [Google Scholar]
- Anticevic A, Hu S, Zhang S, Savic A, Billingslea E, Wasylink S, Repovs G, Cole MW, Bednarski S, Krystal JH, 2014. Global resting-state fMRI analysis identifies frontal cortex, striatal, and cerebellar dysconnectivity in obsessive-compulsive disorder. Biological psychiatry 75, 595. [DOI] [PMC free article] [PubMed] [Google Scholar]
- Bassett DS, Bullmore E, Verchinski BA, Mattay VS, Weinberger DR, Meyer-Lindenberg A, 2008. Hierarchical organization of human cortical networks in health and schizophrenia. Journal of Neuroscience 28, 9239–9248. [DOI] [PMC free article] [PubMed] [Google Scholar]
- Beucke JC, Sepulcre J, Talukdar T, Linnman C, Zschenderlein K, Endrass T, Kaufmann C, Kathmann N, 2013. Abnormally high degree connectivity of the orbitofrontal cortex in obsessive-compulsive disorder. JAMA psychiatry 70, 619–629. [DOI] [PubMed] [Google Scholar]
- Brennan BP, Rauch SL, Jensen JE, Pope HG Jr, 2013. A critical review of magnetic resonance spectroscopy studies of obsessive-compulsive disorder. Biological psychiatry 73, 24–31. [DOI] [PMC free article] [PubMed] [Google Scholar]
- Buckner RL, Sepulcre J, Talukdar T, Krienen FM, Liu H, Hedden T, Andrews-Hanna JR, Sperling RA, Johnson KA, 2009. Cortical hubs revealed by intrinsic functional connectivity: mapping, assessment of stability, and relation to Alzheimer’s disease. Journal of neuroscience 29, 1860–1873. [DOI] [PMC free article] [PubMed] [Google Scholar]
- Bullmore E, Sporns O, 2009. Complex brain networks: graph theoretical analysis of structural and functional systems. Nature Reviews Neuroscience 10, 186. [DOI] [PubMed] [Google Scholar]
- Bullmore E, Sporns O, 2012. The economy of brain network organization. Nature Reviews Neuroscience 13, 336. [DOI] [PubMed] [Google Scholar]
- Crossley NA, Mechelli A, Scott J, Carletti F, Fox PT, McGuire P, Bullmore ET, 2014. The hubs of the human connectome are generally implicated in the anatomy of brain disorders. Brain 137, 2382–2395. [DOI] [PMC free article] [PubMed] [Google Scholar]
- De Domenico M, Solé-Ribalta A, Omodei E, Gómez S, Arenas A, 2015. Ranking in interconnected multilayer networks reveals versatile nodes. Nature communications 6, 6868. [DOI] [PubMed] [Google Scholar]
- DeFord DR, Pauls SD, 2017. A new framework for dynamical models on multiplex networks. Journal of Complex Networks 6, 353–381. [Google Scholar]
- Destrieux C, Fischl B, Dale A, Halgren E, 2010. Automatic parcellation of human cortical gyri and sulci using standard anatomical nomenclature. NeuroImage 53, 1–15. [DOI] [PMC free article] [PubMed] [Google Scholar]
- Dong C, Yang Q, Liang J, Seger CA, Han H, Ning Y, Chen Q, Peng Z, 2019. Impairment in the goal-directed corticostriatal learning system as a biomarker for obsessive–compulsive disorder. Psychological medicine, 1–11. [DOI] [PubMed] [Google Scholar]
- Drzezga A, Becker JA, Van Dijk KR, Sreenivasan A, Talukdar T, Sullivan C, Schultz AP, Sepulcre J, Putcha D, Greve D, 2011. Neuronal dysfunction and disconnection of cortical hubs in non-demented subjects with elevated amyloid burden. Brain 134, 1635–1646. [DOI] [PMC free article] [PubMed] [Google Scholar]
- Fan K, 1949. On a theorem of Weyl concerning eigenvalues of linear transformations I. Proceedings of the National Academy of Sciences of the United States of America 35, 652. [DOI] [PMC free article] [PubMed] [Google Scholar]
- Fischl B, 2012. FreeSurfer. Neuroimage 62, 774–781. [DOI] [PMC free article] [PubMed] [Google Scholar]
- Fornito A, Zalesky A, Breakspear M, 2015. The connectomics of brain disorders. Nature Reviews Neuroscience 16, 159. [DOI] [PubMed] [Google Scholar]
- Fortunato S, 2010. Community detection in graphs. Physics Reports 486, 75–174. [Google Scholar]
- Freeman LC, 1977. A set of measures of centrality based on betweenness. Sociometry, 35–41. [Google Scholar]
- Ghadimi E, Teixeira A, Shames I, Johansson M, 2015. Optimal Parameter Selection for the Alternating Direction Method of Multipliers (ADMM): Quadratic Problems. IEEE Transactions on Automatic Control 60, 644–658. [Google Scholar]
- Gratton C, Nomura EM, Pérez F, Esposito MD, 2012. Focal Brain Lesions to Critical Locations Cause Widespread Disruption of the Modular Organization of the Brain. Journal of Cognitive Neuroscience 24, 1275–1285. [DOI] [PMC free article] [PubMed] [Google Scholar]
- Guimerà R, Nunes Amaral LA, 2005. Functional cartography of complex metabolic networks. Nature 433, 895–900. [DOI] [PMC free article] [PubMed] [Google Scholar]
- Hagmann P, Kurant M, Gigandet X, Thiran P, Wedeen VJ, Meuli R, Thiran J-P, 2007. Mapping human whole-brain structural networks with diffusion MRI. PloS one 2, e597. [DOI] [PMC free article] [PubMed] [Google Scholar]
- Halu A, Mondragón RJ, Panzarasa P, Bianconi G, 2013. Multiplex pagerank. PloS one 8, e78293. [DOI] [PMC free article] [PubMed] [Google Scholar]
- Hohenfeld C, Werner CJ, Reetz K, 2018. Resting-state connectivity in neurodegenerative disorders: Is there potential for an imaging biomarker? NeuroImage: Clinical 18, 849–870. [DOI] [PMC free article] [PubMed] [Google Scholar]
- Jiao Z, Xia Z, Cai M, Zou L, Xiang J, Wang S, 2018. Hub recognition for brain functional networks by using multiple-feature combination. Computers & Electrical Engineering 69, 740–752. [Google Scholar]
- Kaiser M, Hilgetag CC, 2004. Edge vulnerability in neural and metabolic networks. Biological cybernetics 90, 311–317. [DOI] [PubMed] [Google Scholar]
- Lerch J, Pruessner J, Zijdenbos A, Collins D, Teipel S, Hampel H, Evans A, 2008. Automated cortical thickness measurements from MRI can accurately separate Alzheimer’s patients from normal elderly controls. Neurobiology of Aging 29, 23–30. [DOI] [PubMed] [Google Scholar]
- Lohmann G, Margulies DS, Horstmann A, Pleger B, Lepsien J, Goldhahn D, Schloegl H, Stumvoll M, Villringer A, Turner R, 2010. Eigenvector Centrality Mapping for Analyzing Connectivity Patterns in fMRI Data of the Human Brain. PLOS ONE 5, e10232. [DOI] [PMC free article] [PubMed] [Google Scholar]
- Merris R, 1994. Laplacian matrices of graphs: a survey. Linear Algebra and its Applications 197–198, 143–176. [Google Scholar]
- Newman ME, 2006. Modularity and community structure in networks. Proceedings of the national academy of sciences 103, 8577–8582. [DOI] [PMC free article] [PubMed] [Google Scholar]
- Nie F, Wang X, Huang H, 2014. Clustering and projected clustering with adaptive neighbors, Proceedings of the 20th ACM SIGKDD international conference on Knowledge discovery and data mining. ACM, New York, New York, USA, pp. 977–986. [Google Scholar]
- Nie F, Zhang R, Li X, 2017. A generalized power iteration method for solving quadratic problem on the Stiefel manifold. Science China Information Sciences 60, 112101. [Google Scholar]
- Nijhuis EH, van Walsum A.-M.v.C., Norris DG, 2013. Topographic hub maps of the human structural neocortical network. PloS one 8, e65511. [DOI] [PMC free article] [PubMed] [Google Scholar]
- Onnela J-P, Saramäki J, Kertész J, Kaski K, 2005. Intensity and coherence of motifs in weighted complex networks. Physical Review E 71, 065103. [DOI] [PubMed] [Google Scholar]
- Park H-J, Friston K, 2013. Structural and Functional Brain Networks: From Connections to Cognition. Science 342, 1238411. [DOI] [PubMed] [Google Scholar]
- Power JD, Schlaggar BL, Lessov-Schlaggar CN, Petersen SE, 2013. Evidence for hubs in human functional brain networks. Neuron 79, 798–813. [DOI] [PMC free article] [PubMed] [Google Scholar]
- Rubinov M, Sporns O, 2010. Complex network measures of brain connectivity: uses and interpretations. Neuroimage 52, 1059–1069. [DOI] [PubMed] [Google Scholar]
- Shen X, Tokoglu F, Papademetris X, Constable RT, 2013. Groupwise whole-brain parcellation from resting-state fMRI data for network node identification. Neuroimage 82, 403–415. [DOI] [PMC free article] [PubMed] [Google Scholar]
- Shi W, Ling Q, Yuan K, Wu G, Yin W, 2014. On the Linear Convergence of the ADMM in Decentralized Consensus Optimization. IEEE Transactions on Signal Processing 62, 1750–1761. [Google Scholar]
- Shin D-J, Jung WH, He Y, Wang J, Shim G, Byun MS, Jang JH, Kim SN, Lee TY, Park HY, 2014. The effects of pharmacological treatment on functional brain connectome in obsessive-compulsive disorder. Biological psychiatry 75, 606–614. [DOI] [PubMed] [Google Scholar]
- Sporns O, 2018. Graph theory methods: applications in brain networks. Dialogues in clinical neuroscience 20, 111. [DOI] [PMC free article] [PubMed] [Google Scholar]
- Sporns O, Honey CJ, Kötter R, 2007. Identification and Classification of Hubs in Brain Networks. PLOS ONE 2, e1049. [DOI] [PMC free article] [PubMed] [Google Scholar]
- Sporns O, Zwi JD, 2004. The small world of the cerebral cortex. Neuroinformatics 2, 145–162. [DOI] [PubMed] [Google Scholar]
- Tijms BM, Wink AM, de Haan W, van der Flier WM, Stam CJ, Scheltens P, Barkhof F, 2013. Alzheimer’s disease: connecting findings from graph theoretical studies of brain networks. Neurobiology of Aging 34, 2023–2036. [DOI] [PubMed] [Google Scholar]
- Tzourio-Mazoyer N, Landeau B, Papathanassiou D, Crivello F, Etard O, Delcroix N, Mazoyer B, Joliot M, 2002. Automated anatomical labeling of activations in SPM using a macroscopic anatomical parcellation of the MNI MRI single-subject brain. Neuroimage 15, 273–289. [DOI] [PubMed] [Google Scholar]
- Uddin LQ, Dajani D, Voorhies W, Bednarz H, Kana R, 2017. Progress and roadblocks in the search for brain-based biomarkers of autism and attention-deficit/hyperactivity disorder. Translational psychiatry 7, e1218–e1218. [DOI] [PMC free article] [PubMed] [Google Scholar]
- van den Heuvel MP, Mandl RC, Stam CJ, Kahn RS, Pol HEH, 2010. Aberrant frontal and temporal complex network structure in schizophrenia: a graph theoretical analysis. Journal of Neuroscience 30, 15915–15926. [DOI] [PMC free article] [PubMed] [Google Scholar]
- van den Heuvel MP, Sporns O, 2013. Network hubs in the human brain. Trends in cognitive sciences 17, 683–696. [DOI] [PubMed] [Google Scholar]
- van den Heuvel MP, Stam CJ, Boersma M, Pol HH, 2008. Small-world and scale-free organization of voxel-based resting-state functional connectivity in the human brain. Neuroimage 43, 528–539. [DOI] [PubMed] [Google Scholar]
- Venkataraman A, Duncan JS, Yang DY-J, Pelphrey KA, 2015. An unbiased Bayesian approach to functional connectomics implicates social-communication networks in autism. NeuroImage: Clinical 8, 356–366. [DOI] [PMC free article] [PubMed] [Google Scholar]
- Venkataraman A, Kubicki M, Golland P, 2013. From connectivity models to region labels: identifying foci of a neurological disorder. IEEE transactions on medical imaging 32, 2078–2098. [DOI] [PMC free article] [PubMed] [Google Scholar]
- Warren DE, Power JD, Bruss J, Denburg NL, Waldron EJ, Sun H, Petersen SE, Tranel D, 2014. Network measures predict neuropsychological outcome after brain injury. Proceedings of the National Academy of Sciences 111, 14247–14252. [DOI] [PMC free article] [PubMed] [Google Scholar]
- Yang D, Yan C, Nie F, Zhu X, Turja MA, Zsembik LCP, Styner M, Wu G, 2019. Joint Identification of Network Hub Nodes by Multivariate Graph Inference, International Conference on Medical Image Computing and Computer-Assisted Intervention. Springer, pp. 590–598. [Google Scholar]
- Zachary WW, 1977. An information flow model for conflict and fission in small groups. Journal of anthropological research 33, 452–473. [Google Scholar]
- Zalesky A, Fornito A, Harding IH, Cocchi L, Yücel M, Pantelis C, Bullmore ET, 2010. Whole-brain anatomical networks: does the choice of nodes matter? Neuroimage 50, 970–983. [DOI] [PubMed] [Google Scholar]
- Zhu W, Wen W, He Y, Xia A, Anstey KJ, Sachdev P, 2012. Changing topological patterns in normal aging using large-scale structural networks. Neurobiology of Aging 33, 899–913. [DOI] [PubMed] [Google Scholar]


