

Abstract
Aims
Assessment of hyperaemia during adenosine stress cardiovascular magnetic resonance (CMR) remains a clinical challenge with lack of a gold-standard non-invasive clinical marker to confirm hyperaemic response. This study aimed to validate maximum stress myocardial blood flow (SMBF) measured using quantitative perfusion mapping for assessment of hyperaemic response and compare this to current clinical markers of adenosine stress.
Methods and results
Two hundred and eighteen subjects underwent adenosine stress CMR. A derivation cohort (22 volunteers) was used to identify a SMBF threshold value for hyperaemia. This was tested in a validation cohort (37 patients with suspected coronary artery disease) who underwent invasive coronary physiology assessment on the same day as CMR. A clinical cohort (159 patients) was used to compare SMBF to other physiological markers of hyperaemia [splenic switch-off (SSO), heart rate response (HRR), and blood pressure (BP) fall]. A minimum SMBF threshold of 1.43 mL/g/min was derived from volunteer scans. All patients in the coronary physiology cohort demonstrated regional maximum SMBF (SMBFmax) >1.43 mL/g/min and invasive evidence of hyperaemia. Of the clinical cohort, 93% had hyperaemia defined by perfusion mapping compared to 71% using SSO and 81% using HRR. There was no difference in SMBFmax in those with or without SSO (2.58 ± 0.89 vs. 2.54 ± 1.04 mL/g/min, P = 0.84) but those with HRR had significantly higher SMBFmax (2.66 1.86 mL/g/min, P < 0.001). HRR >15 bpm was superior to SSO in predicting adequate increase in SMBF (AUC 0.87 vs. 0.62, P < 0.001).
Conclusion
Adenosine-induced increase in myocardial blood flow is accurate for confirmation of hyperaemia during stress CMR studies and is superior to traditional, clinically used markers of adequate stress such as SSO and BP response.
Keywords: cardiovascular magnetic resonance myocardial, blood flow hyperaemia adenosine, stress
Introduction
Stress perfusion cardiovascular magnetic resonance (CMR) is established as a validated non-invasive tool for assessment of ischaemia, with high sensitivity and specificity for detection of obstructive coronary artery disease.1,2 The absence of inducible ischaemia carries favourable prognosis for cardiovascular mortality and morbidity.3,4 However, it is reported that 10% of stress perfusion studies are false-negative.5 It has been proposed that one-third of false-negative studies may be due to inadequate response to pharmacological stress resulting in failure to unmask inducible perfusion defects.6
A commonly used pharmacological stressor is adenosine, which reliably induces maximal hyperaemia in the majority of patients.7 Most protocols suggest a fixed dose administered intravenously (typically 140 μg/kg/min for 3–5 min), with up-titration if there is failure to reach physiological targets such as heart rate increase >10 bpm, fall in systolic blood pressure (SBP) >10 mmHg, and/or adenosine associated symptoms.8 However, it has recently been suggested that heart rate response (HRR) and blood pressure (BP) drop are poor surrogate markers for increase in coronary blood flow.9
Splenic switch-off (SSO), defined as reduction in splenic signal intensity during stress due to adenosine-induced splenic vasoconstriction, has been proposed as a useful sign to assess hyperaemic response and is frequently used in clinical practice. This is based on the observation that SSO was absent in up to one-third of patients with false-negative stress CMR scans.10,11 Whilst potentially useful, the mechanisms of SSO are not fully understood and SSO assesses the systematic response to adenosine rather the direct effect on the organ of interest, the heart.
Quantitative myocardial perfusion mapping is a novel tool for assessment of inducible ischaemia in patients with suspected coronary disease12 and may also have a role in assessment coronary microvascular dysfunction (MVD), left ventricular (LV) hypertrophy, and cardiomyopathies where myocardial blood flow (MBF) may be impaired. This dual-sequence protocol provides the ability to rapidly and quantitatively assess stress myocardial blood flow (SMBF) using perfusion maps generated and displayed in-line on the scanner within minutes.13 As MBF can be measured at a pixel-wise level, perfusion maps may have a role in the detection of adequate hyperaemia in response to adenosine stress.
We hypothesized that peak SMBF measured on myocardial perfusion maps could be used as a direct marker of adequate hyperaemia during adenosine stress CMR studies. The aims of this study were (i) to establish a stress MBF threshold value for hyperaemia, (ii) validate this threshold using invasive markers of hyperaemia as the reference standard, and (iii) compare this method to other clinically used markers of hyperaemia (SSO, HRR, and BP response).
Methods
Two hundred and eighteen subjects were recruited. This comprised three cohorts: (i) a derivation cohort of 22 healthy volunteers, to derive an MBF threshold value representative of the normal minimum increase in MBF associated with adenosine hyperaemia; (ii) a validation cohort of 37 patients with suspected coronary artery disease, who underwent adenosine stress CMR and invasive coronary physiological assessment on the same day, to validate the SMBF threshold value against invasive markers of hyperaemia; and (iii) a clinical cohort of 159 patients undergoing clinically indicated adenosine stress CMR to assess the presence of SMBF defined hyperaemia and other physiological markers of hyperaemia (SSO, HRR, and BP fall). All participants provided written informed consent prior to inclusion in the study.
Derivation cohort: healthy volunteers
In order to identify a SMBF threshold value representative of the normal minimum increase in MBF associated with adenosine hyperaemia, a validation cohort of 22 healthy controls with no symptoms and no past history of cardiovascular disease, hypertension, or diabetes were recruited. All healthy volunteers underwent adenosine stress CMR using the protocol below.
Validation cohort: coronary physiology
A ‘coronary physiology cohort’ of 37 patients scheduled for invasive coronary angiography for investigation of angina were prospectively recruited. Participants underwent adenosine stress CMR using the below protocol prior to the invasive procedure which was performed within 4 h of the CMR. Patients with previous coronary artery bypass surgery (CABG), myocardial infarction (with transmural late gadolinium enhancement), unstable symptoms (including crescendo angina, angina at rest, or acute coronary syndrome), standard contraindications to CMR or adenosine, or estimated glomerular filtration rate <30 mL/min/1.73 m2 were excluded. During coronary angiography, adenosine was administered at the same dose as during the CMR study for the measurement of fractional flow reserves (FFR) in at least one vessel. The presence of hyperaemia was defined as the presence of two out of three of (i) ventricularization of the distal pressure waveform, (ii) disappearance of the dicrotic notch on the distal waveform, and (iii) separation of mean aortic and distal pressures.9
Clinical cohort
To compare stress response defined by SMBF, SSO, HRR, and BP response, we identified a clinical cohort of 159 adenosine stress perfusion studies performed between January 2017 and November 2018. As this group was intended to represent a population encountered in routine clinical practice, patients with prior myocardial infarction, previous percutaneous coronary intervention, and previous CABG were also included. Basic demographic data were extracted from electronic patient records. Heart rate at rest and stress, and presence of adenosine-induced symptoms were recorded for all studies. BP pressure at rest and stress were recorded for 110 (69%) of cases.
CMR protocol
All scans were performed using a 1.5-T MR scanner (Magnetom Aera, Siemens Healthcare, Erlangen, Germany) in accordance with local protocol. Patients were asked to refrain from caffeine for at least 12 h prior to the scan. Basal, mid-ventricular, and apical short-axis perfusion images were acquired both at rest and during hyperaemia. Hyperaemia was induced using adenosine infused via a peripheral cannula at a rate of 140 μg/kg/min for 4 min with a further 2 min at 175 μg/kg/min if there was evidence of insufficient stress such as no HRR and no symptoms (the coronary physiology cohort received a fixed dose of 140 μg/kg/min for both the CMR scan and invasive physiology assessment).
Generation of myocardial perfusion maps
The perfusion sequence used has been described previously.13 In brief, the sequence utilized a dual-sequence approach with separate pulse sequences for the arterial input function (AIF) and myocardial tissue. Image acquisition was performed over 60 heart beats with a bolus of 0.05 mmol/kg gadoterate meglumine (Dotarem, Guerbet SA, Paris, France) administered at 4 mL/s followed by a 20-mL saline flush during acquisition of the perfusion sequence. The AIF was calculated using the LV blood pool signal which was automatically segmented from optimized low-resolution proton density-weighted images acquired in parallel with higher spatial resolution saturation recovery images used for estimating myocardial perfusion. Myocardial perfusion was calculated using an automated blood tissue exchange model14 after corrections to minimize T2* losses and for non-linearity of saturation recovery, and pixel-wise perfusion maps were automatically generated in-line and displayed on the scanner after a process of motion correction and surface-coil intensity correction.
Invasive protocol
Invasive coronary angiography was performed via radial arterial access. Coronary physiology measurements were obtained using a coronary PressureWire (St Jude Medical, St Paul, MN, USA) connected to a RadiAnalyzer (St Jude Medical). Heparin (70 iu/kg) was administered prior to coronary instrumentation. Adenosine (140 μg/kg/min) was administered via a peripheral cannula for at least 2 min and until hyperaemia was achieved. Aortic and distal pressure traces were acquired at baseline and throughout adenosine administration. Pressure traces were analysed offline.
Image analysis
Quantitative analysis of perfusion maps
Perfusion maps were analysed offline using Osirix MD 9.0 (Bernex, Switzerland). The endocardial and epicardial borders were manually delineated for each basal, mid-ventricular, and apical short-axis map. Obvious image artefacts and coronary arteries were excluded from the regions-of-interest. Using a custom-made plug-in, maps were split into 16 segments. For the healthy control cohort, the segment with the lowest SMBF was used for analysis (as the minimum expected increase in MBF in response to adenosine in the absence of cardiovascular disease or other comorbidities). For the coronary physiology and clinical cohorts, the segment with the highest SMBF (SMBFmax) was used for analysis (as ischaemic segments would not demonstrate significant increase in MBF).
Splenic switch-off
All scans were analysed for the presence of SSO, which was graded using visual comparison of the splenic tissue contrast enhancement on the stress short-axis slice in which the spleen was seen best with the rest perfusion images of the spleen. SSO was graded as either present (i.e. clearly lower splenic enhancement compared to rest) or absent (i.e. visually similar splenic enhancement at rest and stress).
Statistical analysis
All continuous variables were tested for normal distribution (Shapiro–Wilk test). Normally distributed metrics are summarized by the mean ± standard deviation (SD). For normally distributed variables, the unpaired Student’s t-test was used to compare the means between two groups and one-way analysis of variance with post hoc Bonferroni correction to compare the means of multiple groups. Proportions between groups were compared using the Fisher’s exact test. Receiver operator characteristic (ROC) curves were compared using the Delong method. The Youden index was used to identify optimal cut-offs to predict adequate hyperaemia defined by different methods. A P-value of <0.05 was considered statistically significant. ROC analyses were performed using MedCalc 13.2.1.0 (Ostend, Belgium). All other statistical analysis was performed using IBM SPSS Statistics Version 24 (IBM, Somers, NY, USA).
Results
Baseline characteristics are presented in Table 1 and clinical parameters during stress perfusion CMR scans in Table 2.
Table 1.
Baseline characteristics
| Validation cohort (n = 22) | Coronary physiology cohort (n = 37) | Clinical cohort (n = 159) | P-value (coronary physiology vs. clinical cohort) | |
|---|---|---|---|---|
| Age (years) | 45 ± 9 | 59 ± 17 | 64 ± 11 | 0.02 |
| Males | 17 (77%) | 27 (73%) | 123 (77%) | 0.67 |
| Hypertension | 0 (0%) | 22 (60%) | 80 (51%) | 0.37 |
| Diabetes | 0 (0%) | 12 (32%) | 55 (35%) | 0.85 |
| Hyperlipidaemia | 0 (0%) | 28 (76%) | 87 (55%) | 0.03 |
| Previous PCI | 0 (0%) | 2 (5.4%) | 61 (39%) | <0.01 |
| Previous CABG | 0 (0%) | 0 (0%) | 27 (17%) | <0.01 |
CABG, coronary artery bypass surgery; PCI, percutaneous coronary intervention.
Bold values denotes statistical significance (P < 0.05).
Table 2.
Myocardial blood flow (MBF) and clinical parameters during stress perfusion CMR scans
| Control cohort (n = 22) | Coronary physiology cohort (n = 37) | Clinical cohort (n = 159) | P-value | |
|---|---|---|---|---|
| MBF | ||||
| SMBFmax (mL/g/min) | 4.10 ± 0.99 | 3.28 ± 1.01 | 2.57 ± 0.93 | <0.01 |
| Resting MBF (mL/g/min) | 0.80 ± 0.21 | 0.93 ± 0.27 | 1.01 ± 0.37 | 0.03 |
| Maximum myocardial perfusion reserve | 5.6 ± 1.2 | 3.8 ± 1.4 | 2.7 ± 1.1 | <0.001 |
| BP (mmHg) | ||||
| Baseline systolic BP | 122 ± 12 | 135 ± 28 | 136 ± 22 | 0.03 |
| Baseline diastolic BP | 71 ± 7 | 75 ± 12 | 72 ± 12 | 0.59 |
| Hyperaemic systolic BP | 120 ± 12 | 122 ± 24 | 127 ± 21 | 0.30 |
| Hyperaemic diastolic BP | 70 ± 8 | 66 ± 9 | 67 ± 14 | 0.68 |
| Systolic BP fall | 2 ± 10 | 13 ± 14 | 9 ± 17 | 0.12 |
| Diastolic BP fall | 1 ± 7 | 10 ± 9 | 5 ± 10 | 0.08 |
| Heart rate (bpm) | ||||
| Baseline heart rate | 63 ± 9 | 66 ± 11 | 67 ± 14 | 0.40 |
| Hyperaemic heart rate | 91 ± 14 | 89 ± 13 | 85 ± 15 | 0.21 |
| Heart rate increase | 27 ± 12 | 23 ± 12 | 19 ± 11 | <0.01 |
BP, blood pressure; bpm, beats per minute; MBF, myocardial blood flow; SMBFmax, maximum stress myocardial blood flow.
Bold values denotes statistical significance (P < 0.05).
Derivation of SMBF threshold to define hyperaemia
The derivation cohort comprised 22 healthy controls [17 (77%) male, mean age 45 ± 9 years]. The mean SMBF of the segments with the lowest SMBF in each subject was 2.39 ± 0.49 mL/g/min. The hyperaemic threshold for SMBF to be assessed in the test cohorts was defined as 1.96 SD below the mean and was 1.43 mL/g/min.
Mean HRR was 27 ± 12 bpm and mean change in SBP −2 ± 10 mmHg. HRR >10 bpm was present in 95% of cases and fall in SBP >10 mmHg present in only 15% of cases. The spleen was visible on first-pass gadolinium images in all cases. SSO was absent in 8 (36%) of cases (Figure 1). There was no significant difference in minimum SMBF between those with and without SSO (SSO 2.51 ± 0.49 mL/g/min vs. no SSO 2.17 ± 0.43 mL/g/min, P = 0.12).
Figure 1.

Stress perfusion maps, rest perfusion maps, and splenic first-pass perfusion of healthy controls. Examples of cases with (upper panel) and without (lower panel) splenic switch-off. Both cases show similar increase in MBF. MBF, myocardial blood flow.
Validation of stress MBF threshold
The validation cohort (n = 37) underwent coronary angiography with coronary physiology assessment in at least one vessel within 4 h of the adenosine stress CMR. Mean age was 58 ± 17 years and 27 (73%) were male. Eighteen patients had obstructive coronary artery disease (defined as FFR <0.80 in at least one epicardial vessel) and 19 patients had no obstructive disease. All patients were assessed to have achieved hyperaemia in the catheterization laboratory as defined by changes in the invasive pressure trace during adenosine administration. We therefore assume that all of these patients were also adequately hyperaemic during the CMR study which was performed on the same day as the invasive assessment using the same dose of adenosine and with no medication other than intravenous heparin being administered in between the two studies.
The mean SMBFmax (the myocardial segment in each participant with the highest SMBF value) was 3.28 ± 1.01 mL/g/min. There was no difference in SMBFmax between those with or without obstructive coronary artery disease (3.34 ± 1.10 vs. 3.23 ± 0.95 mL/g/min, P = 0.74). All participants demonstrated at least one myocardial segment with SMBF above the threshold of 1.43 mL/g/min.
The spleen was not visible in one case (3%) and SSO was absent in 7 (19%) of cases. There was no difference in SMBFmax between those with and without SSO (SMBFmax: SSO 3.26 ± 0.95 mL/g/min vs. no SSO 3.32 ± 1.40 mL/g/min, P = 0.89) (Figure 2).
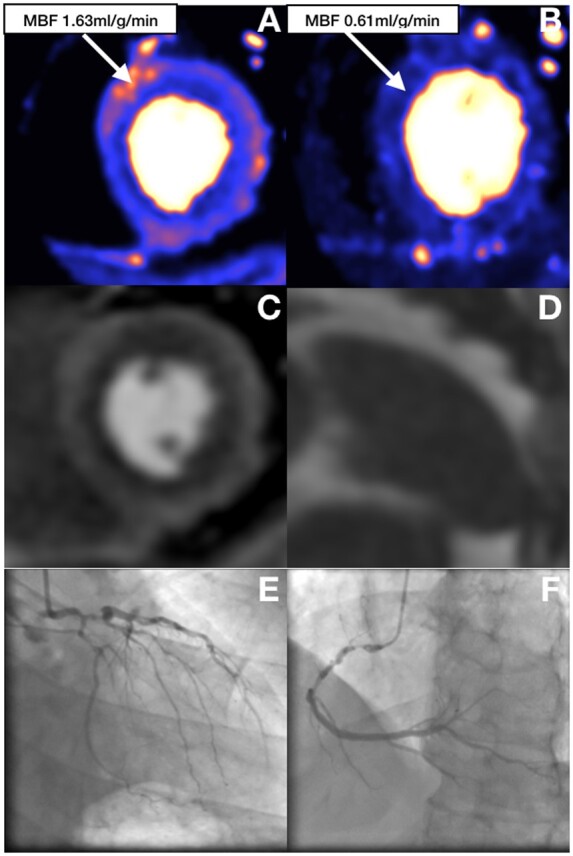
Figure 2.

Perfusion maps, first-pass perfusion, and coronary angiogram of patient with obstructive coronary artery disease. Perfusion maps (A and B) and first-pass perfusion (C) show a subendocardial inducible perfusion defects in the inferior and inferolateral wall corresponding with angiographically severe stenoses in the obtuse marginal and left posterior descending artery (E). Stress (A) and rest (B) perfusion maps show significant increase in MBF remote to the ischaemic area despite lack of splenic switch-off (D). MBF, myocardial blood flow.
During adenosine administration, there was a significant fall in invasive aortic pressure and rise in heart rate on stress (invasive mean aortic pressure: baseline 93 ± 12 mmHg vs. hyperaemic 84 ± 10 mmHg, P < 0.001; heart rate: baseline 70 ± 12 vs. hyperaemic 83 ± 14 bpm, P < 0.001).
Comparison to alternative markers in clinical practice
One hundred and fifty-nine clinically requested adenosine stress CMR scans were analysed. Mean age was 64 ± 11 years and 123 (72%) male. The spleen was not visible in one case (0.6%). Of the cohort, 93% had evidence of hyperaemia defined as SMBFmax >1.43 mL/g/min compared to 71% defined by SSO, 81% defined by HRR >10 bpm, and 42% defined by SBP fall >10 mmHg (Figure 3). There was no significant difference in SMBFmax in those with or without SSO (SMBFmax: 2.58 ± 0.89 mL/g/min SSO vs. 2.54 ± 1.04 mL/g/min no SSO, P = 0.84). SMBFmax was significantly higher in those with HRR >10 bpm compared to those with HRR ≤10 bpm (2.66 ± 0.90 vs. 1.86 ± 0.61 mL/g/min, P < 0.001). There was no difference in SMBFmax in those with SBP fall >10 mmHg compared to those with SBP fall <10 mmHg (2.46 ± 0.72 vs. 2.57 mL/g/min, P = 0.52).
Figure 3.
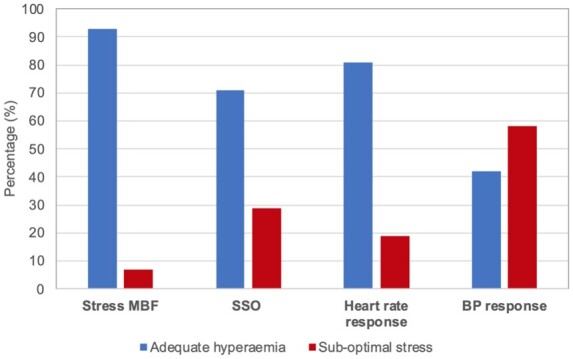
Classification of adequate stress based on stress MBF, SSO, heart rate response, and BP response. Percentage of cases defined as adequate hyperaemia based on different methods (hyperaemia defined as stress MBF >1.43 mL/g/min, presence of SSO sign, heart rate increase >10 bpm, or BP fall >10 mmHg). BP, blood pressure; MBF, myocardial blood flow; SSO, splenic switch-off.
Eighty-nine patients (56%) had invasive coronary angiography within the 6 months before or after the stress CMR scan, 26 with single-vessel disease, 22 with two-vessel disease, 12 with three-vessel disease (3VD), and 29 with unobstructed coronaries. SMBFmax was significantly lower in patients with 3VD compared to those with unobstructed coronaries but there was no difference in SMBFmax between the other groups (SMBFmax: single-vessel 2.67 ± 0.83 mL/g/min, two-vessel 2.56 ± 0.77 mL/g/min, three-vessel 1.80 ± 1.18 mL/g/min, unobstructed coronaries 2.82 ± 1.03 mL/g/min; P = 0.01 for 3VD vs. unobstructed coronaries, all other comparisons non-significant). Two patients had ‘false-negative’ CMR scans. Both of these patients had SMBF defined evidence of hyperaemia, SSO, and HRR >10 bpm. In both cases, angiography revealed visually moderate disease in a single-vessel and both vessels were borderline positive on FFR measurement suggesting these were due to discordance between the two tests in lesions with borderline significance rather than lack of hyperaemia. Of the 12 patients who had inadequate stress defined by SMBFmax <1.43 mL/g/min, 6 (50%) had confirmed 3VD, 1 had single-vessel disease, and 2 had unobstructed coronaries, with the remaining 3 not having invasive coronary angiography as the CMR was reported as negative for inducible ischaemia (Figures 4 and 5). All patients with confirmed 3VD and the one with single-vessel disease had visual perfusion defects on first-pass perfusion. The three patients without angiographic data and the two with unobstructed coronaries had no visual perfusion defects.
Figure 4.
Perfusion maps, splenic first-pass perfusion, and coronary angiogram in obstructive three-vessel disease. (A) Global reduction of stress MBF with some areas of increased MBF on the epicardial side of the myocardium. (B) Rest perfusion map. (C) First-pass stress perfusion shows global subendocardial perfusion defect consistent with three-vessel disease. (D) Splenic switch-off. (E and F) Coronary angiogram showing severe obstructive three-vessel disease. MBF, myocardial blood flow.
Figure 5.

Perfusion maps and splenic first-pass perfusion of patient with inadequate stress. Stress perfusion map (A) shows maximum stress MBF below hyperaemic threshold and similar to rest MBF values (B). There is also no splenic switch-off (C). MBF, myocardial blood flow.
Predictors of SMBF defined hyperaemic response
Using SMBFmax >1.43 mL/g/min as the definition for adequate stress, HRR >15 bpm was able to predict hyperaemia with sensitivity 63% and specificity 91% [Area under the reciever-operator characteristic curve (AUC) 0.87 (95% confidence interval 0.82–0.92), P < 0.001] (Figure 6). HRR >10 bpm had sensitivity 85% and specificity 64%. The presence of SSO had a sensitivity of 73% and specificity of 50% for the prediction of hyperaemia [AUC 0.62 (0.55–0.68), P = 0.13] and was inferior to HRR (P < 0.001). Change in BP was unable to predict hyperaemic response.
Figure 6.
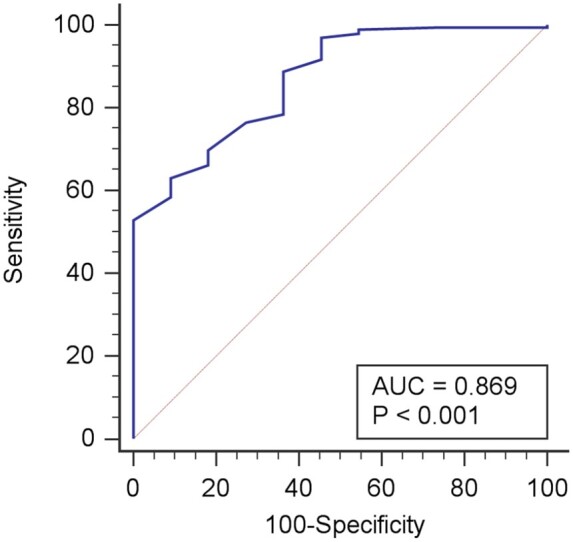
Heart rate increase as a predictor of hyperaemic response. Receiver operator characteristic curve for change in heart rate to detect hyperaemic response as defined by maximum stress myocardial blood flow >1.43 mL/g/min. A heart rate increase of >15 bpm had a sensitivity of 63% and specificity of 91%. .
Discussion
SMBF derived from pixel-wise in-line CMR myocardial perfusion maps can be used to confirm hyperaemic response during adenosine stress studies. SMBF >1.43 mL/g/min in at least one myocardial segment is a robust marker of hyperaemia as confirmed by invasive coronary physiology. Our data suggest that lack of hyperaemic response is less of a clinical issue than previously reported6,10,11 with the vast majority of patients displaying increase in MBF. We therefore propose a diagnostic algorithm for the assessment of hyperaemia based upon SMBFmax and using HRR to guide up-titration of adenosine dose (Figure 7).
Figure 7.

Adenosine stress cardiovascular magnetic resonance protocol using myocardial perfusion mapping. Suggested algorithm based on heart rate response and perfusion maps. MVD, coronary microvascular dysfunctiom; SMBFmax, maximum myocardial blood flow on stress maps.
The confirmation of adequate hyperaemia during adenosine stress remains a clinical challenge due to lack of a ‘gold-standard’ non-invasive measure of hyperaemic response. In normal coronary arteries, intravenous adenosine infusion increases coronary blood flow velocity by greater than four times above resting velocity, as well as increasing heart rate by more than 20 bpm and fall in BP.7 These initial observations supported the clinical use of HRR and BP drop as surrogate markers for hyperaemia. However, more recent studies have shown conflicting results regarding the use of heart rate and BP as markers of adenosine hyperaemia.9,15 Invasive studies demonstrate that increasing the dose of adenosine above 140 μg/kg/min fails to result in changes in FFR16,17 but there is no data on coronary flow velocity or markers of MVD. It could be hypothesized that patients with MVD may not fully respond to standard doses of adenosine, but further studies are required to clarify the role of high-dose adenosine for stress perfusion studies. Current CMR guidelines recommend increasing doses up to 210 μg/kg/min depending upon peripheral haemodynamic response.8
Invasive measurement of coronary flow reserve with a Doppler flow wire is the reference standard for hyperaemia assessment. However, hyperaemia can also be invasively assessed using changes in the invasive pressure waveform using the pressure traces obtained from a standard pressure wire used in routine clinical practice for FFR measurements. Whilst this method is limited by not being a direct measure of adenosine-induced increase in blood flow, it is simpler to acquire and has been validated against coronary flow reserve.9 In the present study, we demonstrate that in patients with invasive evidence of hyperaemia, SMBF was always above the 1.43-mL/g/min threshold in at least one segment whilst only 81% of patients demonstrated a HRR >10 bpm, 81% demonstrated SSO, and 55% demonstrated an SBP drop >10 mmHg. Interestingly, whilst patients exhibiting HRR displayed significantly higher SMBF compared to those without, neither SSO nor BP drop were associated with higher SMBF. These data suggest that currently used surrogate markers of myocardial hyperaemia (SSO, BP fall >10 mmHg, and HRR >10 bpm) may result in many studies being graded as non-diagnostic despite the fact that MBF has been significantly increased. The poor performance of these surrogate markers is likely due to the complexity of the systemic response to adenosine and the influence that other factors such as fluid status, comorbidities, anxiety, and use of medication.
One theoretical limitation of the SMBF-based approach is the fact that patients with 3VD often have global ischaemia and therefore may not significantly increase their MBF. Interestingly, only 50% of patients with 3VD in this cohort failed to increase their MBF above the defined threshold as even in the presence of severe epicardial disease there may be some elevation in MBF in at least one myocardial segment and predominantly on the epicardial side of the myocardium. Furthermore, all of these patients with obstructive 3VD had visual perfusion defects on first-pass perfusion images and were therefore classified as positive for myocardial ischaemia. Additionally, conditions such as severe MVD and cardiomyopathies with hypertrophic phenotypes (e.g. hypertrophic cardiomyopathy and cardiac amyloidosis) may also display global reductions in stress MBF below the threshold value despite adequate response to adenosine stress. The estimated prevalence of MVD is up to 50% of patients undergoing positron emission tomography myocardial perfusion imaging for investigation of chest pain18 and two-thirds of patients with unobstructed coronaries at invasive coronary angiography.19 Only 7% of our cohort failed to achieve SMBF >1.43 mL/g/min, significantly lower than reported prevalence of MVD. This is likely due to the cut-off chosen to define hyperaemic response, which is significantly lower than the published cut-off for the identification of MVD (SMBF < 2.25 mL/g/min).20 However, some cases of severe MVD could fail to increase SMBF >1.43 mL/g/min and be falsely classified as lack of hyperaemic response, although this is likely to represent a small proportion of patients and with both explanations for low SMBF (severe MVD or lack of hyperaemia) further clinical investigations would be indicated. We therefore suggest that SMBF >1.43 mL/g/min is a reliable marker of adequate stress but a value <1.43 mL/g/min does not necessarily indicate inadequate stress.
Our data suggest that HRR still has a role in the assessment of hyperaemic response as it is associated with increased SMBF. Patients with HRR >10 bpm had significantly higher SMBFmax than those without HRR and HRR >10 bpm has reasonable sensitivity but poor specificity. ROC analysis suggests that HRR >15 bpm is a better threshold with high specificity for prediction of stress MBF defined hyperaemia. We therefore propose an algorithm whereby HRR is used to guide adenosine dose increases and stress MBF used to define adequate stress.
Myocardial perfusion mapping is a simple to use sequence that delivers colour-coded pixel-wise perfusion maps in-line to the scanner within minutes of acquisition. MBF measured using this sequence shows good repeatability in controls with SMBF showing better repeatability than myocardial perfusion reserve.21 Quantitative perfusion maps can be easily analysed visually and quantitatively to measure stress MBF. This can be done in real time so, if necessary, adenosine stress can be repeated with a higher dose where stress is deemed sub-maximal. For these reasons, we suggest using SMBF for assessment of hyperaemic response rather than myocardial perfusion reserve which requires the additional acquisition of rest perfusion maps.
Limitations
This is a small single-centre study with the aim of assessing whether myocardial perfusion maps may be useful tool for the detection of hyperaemic response. A further larger multicentre study in which the actual rates of false-negative studies are assessed is required before this method can be fully implemented into clinical practice.
The threshold value of 1.43 mL/g/min was derived from a cohort of healthy volunteers who were younger than typical clinical patients, predominantly male and without any comorbidities. Therefore, hyperaemic response may be different from that observed in clinical patients although our data suggest that the majority of clinical patients are able to achieve this threshold in at least one myocardial segment. The invasive method used to confirm hyperaemia was a qualitative one using pressure traces rather than the gold-standard measurement of coronary flow reserve using a Doppler wire; however, this method has been previously validated against the reference standard.9
We did not test for blood levels of caffeine or xanthines prior to the stress CMR studies. We obtained both verbal and written confirmation from participants that they had not consumed caffeine in the 12 h prior to the scan.
Conclusion
In summary, this study demonstrates that CMR myocardial perfusion mapping can be used to confirm adequate hyperaemic response to adenosine stress, giving clinicians additional confidence when reporting clinical stress perfusion studies. We suggest that this tool is more useful than existing markers such as SSO, HRR, and BP response, and is easy to use in clinical practice.
Funding
This study was supported by the National Amyloidosis Centre, University College London and the National Institute for Health Research University College London Hospitals Biomedical Research Centre.
Conflict of interest: none declared.
Data availability
Fully anonymised raw data and images will be made available upon written request to the corresponding author.
References
- 1.Kiaos A, Tziatzios I, Hadjimiltiades S, Karvounis C, Karamitsos TD. Diagnostic performance of stress perfusion cardiac magnetic resonance for the detection of coronary artery disease: a systematic review and meta-analysis. Int J Cardiol 2018;252:229–33. [DOI] [PubMed] [Google Scholar]
- 2.Nagel E, Greenwood JP, McCann GP, Bettencourt N, Shah AM, Hussain ST et al. Magnetic resonance perfusion or fractional flow reserve in coronary disease. N Engl J Med 2019;380:2418–28. [DOI] [PubMed] [Google Scholar]
- 3.Heitner JF, Kim RJ, Kim HW, Klem I, Shah DJ, Debs D et al. Prognostic value of vasodilator stress cardiac magnetic resonance imaging: a multicenter study with 48000 patient-years of follow-up. JAMA Cardiol 2019;4:256–64. [DOI] [PMC free article] [PubMed] [Google Scholar]
- 4.Kwong RY, Ge Y, Steel K, Bingham S, Abdullah S, Fujikura K et al. Cardiac magnetic resonance stress perfusion imaging for evaluation of patients with chest pain. J Am Coll Cardiol 2019;74:1741–55. [DOI] [PMC free article] [PubMed] [Google Scholar]
- 5.Greenwood JP, Maredia N, Younger JF, Brown JM, Nixon J, Everett CC et al. Cardiovascular magnetic resonance and single-photon emission computed tomography for diagnosis of coronary heart disease (CE-MARC): a prospective trial. Lancet 2012;379:453–60. [DOI] [PMC free article] [PubMed] [Google Scholar]
- 6.Kidambi A, Sourbron S, Maredia N, Motwani M, Brown JM, Nixon J et al. Factors associated with false-negative cardiovascular magnetic resonance perfusion studies: a clinical evaluation of magnetic resonance imaging in coronary artery disease (CE-MARC) substudy. J Magn Reson Imaging 2016;43:566–73. [DOI] [PMC free article] [PubMed] [Google Scholar]
- 7.Wilson RF, Wyche K, Christensen BV, Zimmer S, Laxson DD. Effects of adenosine on human coronary arterial circulation. Circulation 1990;82:1595–606. [DOI] [PubMed] [Google Scholar]
- 8.Kramer CM, Barkhausen J, Bucciarelli-Ducci C, Flamm SD, Kim RJ, Nagel E. Standardized cardiovascular magnetic resonance imaging (CMR) protocols: 2020 update. J Cardiovasc Magn Reson 2020;22:17–35. [DOI] [PMC free article] [PubMed] [Google Scholar]
- 9.Modi BN, Rahman H, Sherif SA, Ellis H, Eruslanova K, Chiribiri A et al. Is heart rate response a reliable marker of adenosine-induced coronary hyperemia? Int J Cardiovasc Imaging 2018;34:1117–25. [DOI] [PMC free article] [PubMed] [Google Scholar]
- 10.Manisty C, Ripley DP, Herrey AS, Captur G, Wong TC, Petersen SE et al. Splenic switch-off: a tool to assess stress adequacy in adenosine perfusion cardiac MR imaging. Radiology 2015;276:732–40. [DOI] [PubMed] [Google Scholar]
- 11.Hosking A, Koulouroudias M, Zemrak F, Moon JC, Rossi A, Lee A et al. Evaluation of splenic switch off in a tertiary imaging centre: validation and assessment of utility. Eur Heart J Cardiovasc Imaging 2017;18:1216–21. [DOI] [PubMed] [Google Scholar]
- 12.Engblom H, Xue H, Akil S, Carlsson M, Hindorf C, Oddstig J et al. Fully quantitative cardiovascular magnetic resonance myocardial perfusion ready for clinical use: a comparison between cardiovascular magnetic resonance imaging and positron emission tomography. J Cardiovasc Magn Reson 2017;19:78–87. [DOI] [PMC free article] [PubMed] [Google Scholar]
- 13.Kellman P, Hansen MS, Nielles-Vallespin S, Nickander J, Themudo R, Ugander M et al. Myocardial perfusion cardiovascular magnetic resonance: optimized dual sequence and reconstruction for quantification. J Cardiovasc Magn Reson 2017;19:43–57. [DOI] [PMC free article] [PubMed] [Google Scholar]
- 14.Bassingthwaighte JB, Wang CY, Chan IS. Blood-tissue exchange via transport and transformation by capillary endothelial cells. Circ Res 1989;65:997–1020. [DOI] [PMC free article] [PubMed] [Google Scholar]
- 15.Mishra RK, Dorbala S, Logsetty G, Hassan A, Heinonen T, Schelbert HR et al. Quantitative relation between hemodynamic changes during intravenous adenosine infusion and the magnitude of coronary hyperemia: implications for myocardial perfusion imaging. J Am Coll Cardiol 2005;45:553–8. [DOI] [PubMed] [Google Scholar]
- 16.De Bruyne B, Pijls NH, Barbato E, Bartunek J, Bech JW, Wijns W et al. Intracoronary and intravenous adenosine 5'-triphosphate, adenosine, papaverine, and contrast medium to assess fractional flow reserve in humans. Circulation 2003;107:1877–83. [DOI] [PubMed] [Google Scholar]
- 17.Sparv D, Götberg M, Harnek J, Persson T, Madsen Hardig B, Erlinge D. Assessment of increasing intravenous adenosine dose in fractional flow reserve. BMC Cardiovasc Disord 2017;17:60–9. [DOI] [PMC free article] [PubMed] [Google Scholar]
- 18.Murthy VL, Naya M, Taqueti VR, Foster CR, Gaber M, Hainer J et al. Effects of sex on coronary microvascular dysfunction and cardiac outcomes. Circulation 2014;129:2518–27. [DOI] [PMC free article] [PubMed] [Google Scholar]
- 19.Sara JD, Widmer RJ, Matsuzawa Y, Lennon RJ, Lerman LO, Lerman A. Prevalence of coronary microvascular dysfunction among patients with chest pain and nonobstructive coronary artery disease. JACC Cardiovasc Interv 2015;8:1445–53. [DOI] [PubMed] [Google Scholar]
- 20.Kotecha T, Martinez-Naharro A, Boldrini M, Knight D, Hawkins P, Kalra S et al. Automated pixel-wise quantitative myocardial perfusion mapping by CMR to detect obstructive coronary artery disease and coronary microvascular dysfunction: validation against invasive coronary physiology. JACC Cardiovasc Imaging 2019;12:1958–69. [DOI] [PMC free article] [PubMed] [Google Scholar]
- 21.Brown LAE, Onciul SC, Broadbent DA, Johnson K, Fent GJ, Foley JRJ et al. Fully automated, inline quantification of myocardial blood flow with cardiovascular magnetic resonance: repeatability of measurements in healthy subjects. J Cardiovasc Magn Reson 2018;20:48–60. [DOI] [PMC free article] [PubMed] [Google Scholar]
Associated Data
This section collects any data citations, data availability statements, or supplementary materials included in this article.
Data Availability Statement
Fully anonymised raw data and images will be made available upon written request to the corresponding author.