

Abstract
Objective:
We performed a systematic review of the epidemiology literature to identify the neurodevelopmental effects associated with phthalate exposure.
Data sources and study eligibility criteria:
Six phthalates were included in the review: di(2-ethylhexyl) phthalate (DEHP), diisononyl phthalate (DINP), dibutyl phthalate (DBP), diisobutyl phthalate (DIBP), butyl benzyl phthalate (BBP), and diethyl phthalate (DEP). The initial literature search (of PubMed, Web of Science, and Toxline) included all studies of neurodevelopmental effects in humans, and outcomes were selected for full systematic review based on data availability.
Study evaluation and synthesis methods:
Studies of neurodevelopmental effects were evaluated using criteria defined a priori for risk of bias and sensitivity by two reviewers using a domain-based approach. Evidence was synthesized by outcome and phthalate and strength of evidence was summarized using a structured framework. For studies of cognition and motor effects in children ≤4 years old, a random effects meta-analysis was performed.
Results:
The primary outcomes reviewed here are (number of studies in parentheses): cognition (14), motor effects (9), behavior, including attention deficit hyperactivity disorder (20), infant behavior (3), and social behavior, including autism spectrum disorder (7). For each phthalate/outcome combination, there was slight or indeterminate evidence of an association, with the exception of motor effects for BBP, which had moderate evidence.
Conclusions and implications of key findings:
Overall, there is not a clear pattern of association between prenatal phthalate exposures and neurodevelopment. There are several possible reasons for the observed null associations related to exposure misclassification, periods of heightened susceptibility, sex-specific effects, and the effects of phthalate mixtures. Until these limitations are adequately addressed in the epidemiology literature, these findings should not be interpreted as evidence that there are no neurodevelopmental effects of phthalate exposure.
The views expressed are those of the authors and do not necessarily represent the views or policies of the U.S. EPA.
1. Introduction
The potential for exposure to endocrine disrupting chemicals (EDCs) to adversely affect neurodevelopment has been widely reported, with plausible mechanisms described (Braun, 2017). Phthalates (phthalic acid diesters) are a class of chemicals within the wider umbrella of EDCs, and past narrative reviews by Braun (2017) and Benjamin et al. (2017) and one systematic review by Ejaredar et al. (2015) suggest that phthalate exposure is associated with a variety of neurodevelopmental outcomes, including autism, ADHD, reduced IQ, and reduced mental and psychomotor development.
Phthalate exposure, primarily via the oral route, but also through inhalation and dermal contact, is ubiquitous in humans due to their widespread use in some consumer and industrial products (Johns et al., 2015). This is true across the lifespan, and the ability of phthalates to cross the placenta as reported by Langonne et al. (1998) increases concern for developmental effects from in utero exposure, particularly when combined with the potential for higher susceptibility in the fetus and child (Braun, 2017). After exposure, phthalate diesters are rapidly metabolized to monoesters (estimated half-lives of various phthalate metabolites is approximately 3–18 h) and excreted in the urine (Johns et al., 2015).
Phthalates encompass compounds with different structures, properties, and use. Some of the most studied phthalates, and those focused on here are: di(2-ethylhexyl) phthalate (DEHP), diisononyl phthalate (DINP), dibutyl phthalate (DBP), diisobutyl phthalate (DIBP), butyl benzyl phthalate (BBP), and diethyl phthalate (DEP). The metabolites of each are described in the supplemental materials. Five of the selected phthalates (DEHP, DINP, DBP, DIBP, BBP) were chosed because they are the most potent with respect to producing the “phthalate syndrome” of male reproductive effects in rats (NAS, 2008) and their metabolites have been frequently observed in human population studies; DEP is not one of the “phthalate syndrome” compounds but was included because it is often the phthalate to which humans have the highest exposure. Among these phthalates, there are some that are relatively structurally similar and moderately correlated with each other based on human biomonitoring data (e.g., DBP and DIBP), while others differ considerably in structure and commercial/industrial uses and correlations between these are typically low (e.g., DEHP and DEP).
A growing number of epidemiological studies have assessed the potential effects of early life phthalate exposure on human health. However, there are important limitations in these studies related to exposure misclassification, periods of heightened susceptibility, persistence of effects past childhood, and confounding. Thus, we performed a systematic review of the epidemiology literature examining the effects of phthalate exposure on infant and child neurodevelopment. This review builds on the past reviews on this topic in several ways. First, it includes in-depth study quality evaluations and study findings are synthesized in the context of those evaluations. In addition, quantitative meta-analysis is used where possible, and the results for individual phthalates are reviewed. Finally, there have been a notable number of new publications on this topic since the last review was published.
2. Methods
The full methods for this systematic review, including for literature search and screening, study evaluation, data extraction, and evidence synthesis are described in detail in the protocol (supplemental materials), which was created for a set of systematic reviews of the human, animal, and mechanistic evidence of all of the phthalates mentioned above. An abbreviated version is provided below, with references to specific sections of the protocol. There are a few minor deviations from the protocol for this review, and those are reflected in this section. In addition, for ease of reference, the key tables from the protocol that are necessary to understand how study evaluation and evidence synthesis conclusions were reached are included in a separate supplemental file (key methods supplement).
2.1. Neurodevelopmental Test Grouping
As neurodevelopment is typically assessed with an array of neurobehavioral or neuropsychological tests that include different domains, clear-cut divisions of these domains is challenging, and psychometric tests often reflect multiple domains. For example, longer mean reaction time (a measure of response time after a stimulus is introduced) on a continuous performance test typically indicates inattention but may also be impacted by slower information processing. Subscales within one test for one neuropsychological category might reflect aspects of another test (i.e., tests are not independent of each other). White et al. (2009) suggested grouping tests into broad categories of cognition, academics, attention, executive function/working memory, language/verbal skills, visuospatial abilities, learning/memory, and motor skills. We roughly follow these recommended groupings for this review, which examines cognition, motor effects, behavior, infant behavior, and social behavior (Table 1). While data on some other neurodevelopmental effects were available, they were not included in this review due to the small number of studies (e.g., language development, anxiety).
Table 1.
Primary outcomes included in the systematic review.
| Outcome | Background | Tests or assessments used in this set of studies to assess the outcome |
|---|---|---|
| Cognition | • General measure of intelligence. Other categories, including those not reviewed, relate to cognition. • Review focuses on the summary scale of intelligence quotient (IQ) or mental development index (MDI). |
• Bayley Scales of Infant Development • Wechsler Intelligence Scale • McCarthy Scales of Children’s Abilities |
| Motor effects | • Capacity to carry out manual motor activities, including coordination. • Review focuses on the summary scale of psychomotor developmental index (PDI) of or motor subscale. |
• Bayley Scales of Infant Development • McCarthy Scales of Children’s Abilities • Brazelton Neonatal Behavioral Assessment Scale • Bruininks-Oseretsky Test of Motor Proficiency |
| Behavior | • Broad category that includes dimensions such as anxiety, depression, attention, hyperactivity, aggression, and conduct problems. • Attention-deficit hyperactivity disorder (ADHD) is one of the most common neurobehavioral disorders in children. • Review focuses on the summary scales of internalizing and externalizing behavior. |
• Child Behavior Checklist • Behavior Assessment System for Children-Parent Rating Scales • Conners’ Parent Rating Scales • Strength and Difficulties Questionnaire • Clinical diagnosis (e.g., ICD codes) |
| Infant behavior | • Includes components of the other categories, but studies are limited to infants. • Review focuses on the subscales in common across tests – arousal, motor, regulation of state, and nonoptimal reflexes. |
• Brazelton Neonatal Behavioral Assessment Scale • NICU Network Neurobehavioral Scale |
| Social behavior and autism | • Measure of reciprocal social, repetitive, and stereotypic behaviors associated with autism spectrum disorders (ASD). • Review focuses on summary score of autistic behaviors. |
• Social Responsiveness Scale • Social Maturity Scale • Autism Diagnostic Observation Schedules |
2.2. Literature search and screening
Epidemiology studies were identified by conducting a single broad literature search on all six phthalates of interest (DEHP, DINP, DBP, DIBP, BBP, DEP). The Population, Exposure, Comparators, and Outcome (PECO) criteria are available in the protocol (Section 2.2) and is intentionally broad to capture any population with any epidemiologic study design, any exposure to one or more phthalates that were the focus of this review (without restriction by timing of exposure), any comparison population, and any examination of human health effects. The following databases were searched: PubMed, Web of Science, and Toxline, with the initial search in 2013, and updates every 6–12 months through March 2019. Forward and backward searches were also performed. Title/abstract and full text screening were performed by two independent reviewers. The broad inventory of epidemiology studies was then further refined for this analysis, focusing only on the studies that reported any neurodevelopmental outcomes.
2.3. Study evaluation
Study evaluation (protocol Section 4.1) was conducted by two independent reviewers (authors ER and RN, contributor in acknowledgements CL). Key concerns were risk of bias (factors that affect the magnitude or direction of effect) and insensitivity (factors that limit the ability of a study to detect a true effect). Evaluation was conducted for the following domains: exposure measurement, outcome ascertainment, participant selection, confounding, analysis, sensitivity, and selective reporting (Fig. 1). These domains were based on the Risk of Bias in Non-randomized Studies of Interventions (ROBINS-I) tool (Sterne et al., 2016), modified for use with environmental exposures.
Fig. 1.
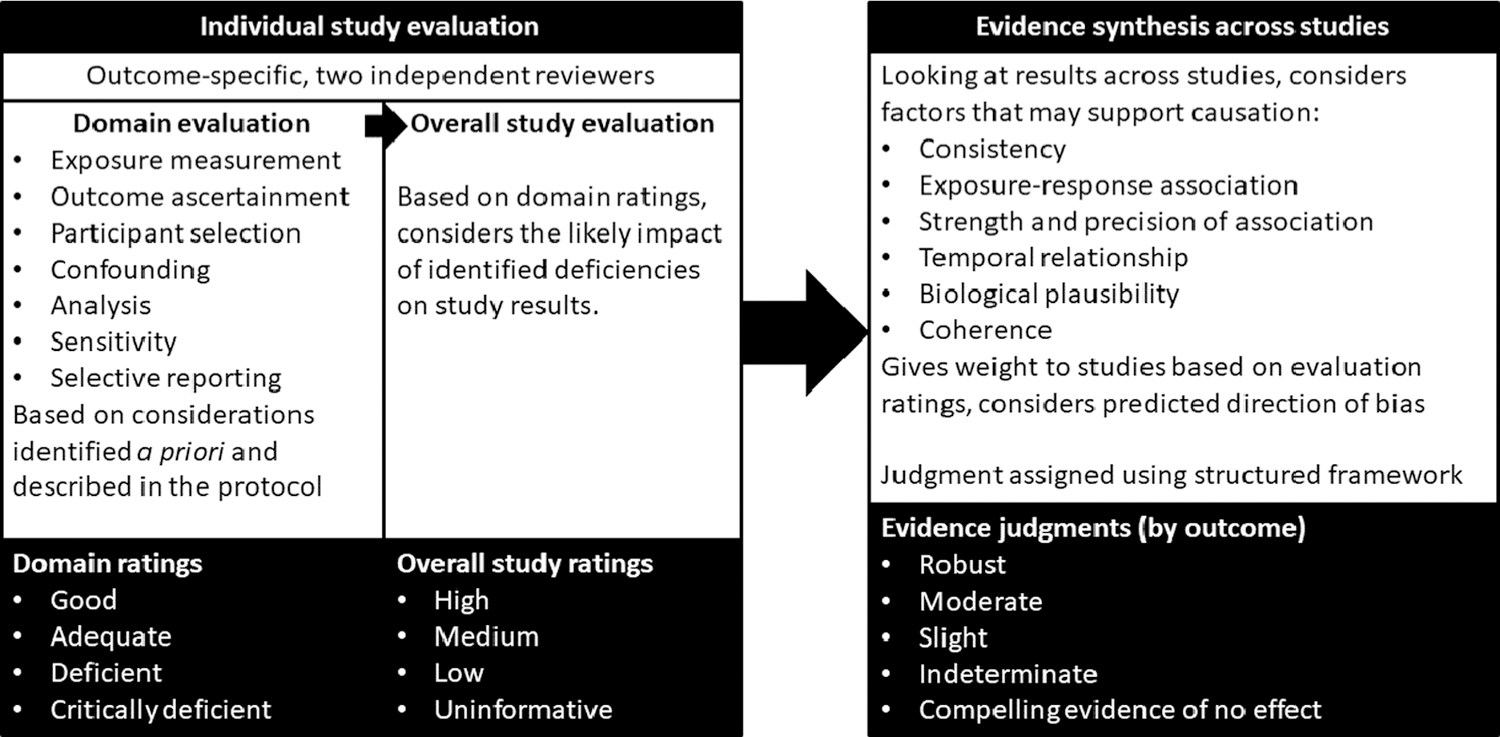
Summary of study evaluation and evidence synthesis process for the systematic review.
For each study, in each evaluation domain, reviewers reached a consensus rating regarding the utility of the study for hazard identification, with categories of Good, Adequate, Deficient, or Critically deficient. These ratings were then considered together to reach an overall study confidence classification of High, Medium, Low, or Uninformative (Fig. 1). This overall classification was not based on pre-defined weights of the domains, but rather on reviewer expert judgments, and include the likely impact the noted deficiencies in bias and sensitivity have on the results, which varies depending on the study and/or outcome. In general, high confidence studies reflect judgments of “good” across all or most domains, and medium confidence studies include adequate or good judgments across most domains, with the impact of any identified limitation not being judged as severe. Studies were evaluated for their suitability for each outcome investigated and could receive different ratings for each outcome. Descriptions of each of the ratings can be found in the protocol (Section 4) and the key methods supplement. Study evaluations were documented in Health Assessment Workspace Collaborative (HAWC).
Criteria and considerations for reaching the study evaluation ratings were developed a priori and are described in the protocol and the key methods supplement. This includes: (a) considerations that apply to all exposures and outcomes, (b) evaluation criteria for phthalate exposure measurement, and c) evaluation criteria for studies of neurodevelopment. The exposure- and outcome- specific considerations are summarized briefly here.
For exposure measurement, most of the available studies relied on phthalate metabolite biomarkers (a list of metabolites for each phthalate is provided in the protocol, Section 1.3). Different criteria were developed for short-chain (DEP, DBP, DIBP, BBP) and long-chain (DEHP, DINP) phthalates due to greater reliability of single biomarker measures for short-chain phthalates. Measurement in urine was considered to be the best proxy of exposure (Johns et al., 2015). Biomarker measures based on samples other than urine (e.g., blood, amniotic fluid, breast milk) were considered to be critically deficient for all short-chain phthalates and for primary metabolites (e.g., MEHP, MINP) of long-chain phthalates (Johns et al., 2015) due to the potential for metabolism of phthalate contaminants in other sample types. This critical deficiency was used as a basis for excluding studies from subsequent analyses. In addition, for timing of exposure measures, because of the short half-lives of phthalates, concurrent measurement of exposure was considered not likely to represent exposure at an etiologically relevant period for this set of outcomes, and thus cross-sectional studies were considered uninformative and excluded.
In the other domains, there were several outcome-specific considerations. These are described in detail in the “Evaluation of Studies of Neurodevelopment” criteria in supplemental materials. For outcome ascertainment, tests used in a study should be appropriate for the age range being studied and to the culture language. Any relevant factors such as time of day, computer use, or sleep, should have been considered in the analysis, and some description of the testing environment provided. If there were multiple raters, there should have been some consideration of this (e.g., adjustment for rater, or analysis of interrater reliability). Studies preferably reported results for subscales as well as summary scales. A combination of parent/teacher/self-rating scales with performance-based tests was preferred, but either was acceptable alone. While blinding to exposure is ideal, this information was not commonly reported and it was considered unlikely that participants or the outcome assessors would have knowledge of exposure levels during testing, and thus not blinding or lack of information on blinding was acceptable. Evaluation of confounding was based on the approach used to identify potential confounders; confounders that were considered potentially relevant included child age and sex, maternal age, socio-economic status, quality of caregiving environment, prenatal tobacco exposure, marital status of parents, and maternal mental health and IQ. It was considered preferable for analyses to use the outcome scales as continuous variables to minimize misclassification and improve statistical power (Sagiv et al., 2015).
2.4. Evidence synthesis
After study evaluation, the evidence across studies for each outcome was synthesized separately for each phthalate using a structured framework (protocol Section 6 and key methods supplement), using the following aspects of an association that may support causation: consistency, exposure-response relationship, strength of association, temporal relationship, biological plausibility, and coherence (Fig. 1), based on the Bradford Hill considerations. In evaluating the evidence for each of these considerations, syntheses also considered study evaluation decisions, with high confidence studies carrying the most weight and consideration of specific strengths and limitations of individual studies described where relevant. Low confidence studies were primarily used only to evaluate consistency. Based on the synthesis, the evidence for each phthalate-outcome pair was assigned a strength of evidence conclusion of Robust, Moderate, Slight, Indeterminate, or Compelling evidence of no effect. Robust and Moderate describe evidence that supports a hazard, differentiated by the quantity and quality of information available to rule out alternative explanations for the results. Slight and Indeterminate describe evidence for which uncertainties prevent drawing a causal conclusion in either direction. These categories are generally limited in terms of quantity or confidence level of studies and indicate a need for additional research across the exposure range experienced by humans. Compelling evidence of no effect requires several high confidence studies with consistent null results. This structured framework is conceptually similar to and is informed by the Grading of Recommendations, Assessment, Development and Evaluations (GRADE) approach (Schunemann et al., 2013), but is designed to address the challenges specific to the analysis of environmental health data rather than clinical evidence. In the syntheses in this review, only the considerations that contributed to the determination of strength of evidence are explicitly described, but all considerations were applied to each phthalate-outcome combination.
2.5. Meta-analysis
All phthalate-outcome combinations included in this review were considered for meta-analysis, and those with a sufficient proportion of studies that were similar enough with regards to psychometric tests and analysis techniques were selected. These decisions were made using expert judgment rather than a priori criteria. For most outcomes, a variety of different psychometric tests were used in the studies (Table 1), which reduced the ability to directly compare the results, and made meta-analyses for most outcomes inappropriate. For very young children (≤4 years old), most studies used a version of Bayley Scales for Infant Development, and this group of studies was considered similar enough for meta-analysis to be used. For each phthalate, a random-effects model was run separately for cognition (Mental Development Index [MDI]) and motor (Psychomotor Development Index [PDI]) effects using the metafor package in R, on medium and high confidence studies with outcomes measured using Bayley Scales of Infant and Toddler Development (BSID). Analyses were repeated with stratification by sex.
3. Results
The literature flow diagram, depicting the identification and disposition of the literature search records, is shown in Fig. 2. The number of publications does not represent the number of studies as in some cases there are multiple publications from the same cohort. In addition, some publications reported on more than one outcome. A list of all the publications identified in the search that met the PECO criteria (i.e., the 52 articles in the final box) is available in the supplement; for each publication this includes the outcomes examined, the status in the review (included, uninformative based on study evaluation, or not reviewed), the rationale for not including, the study name, and the neurodevelopmental tests used. Outcomes with only 1 or 2 available studies were not reviewed further.
Fig. 2.
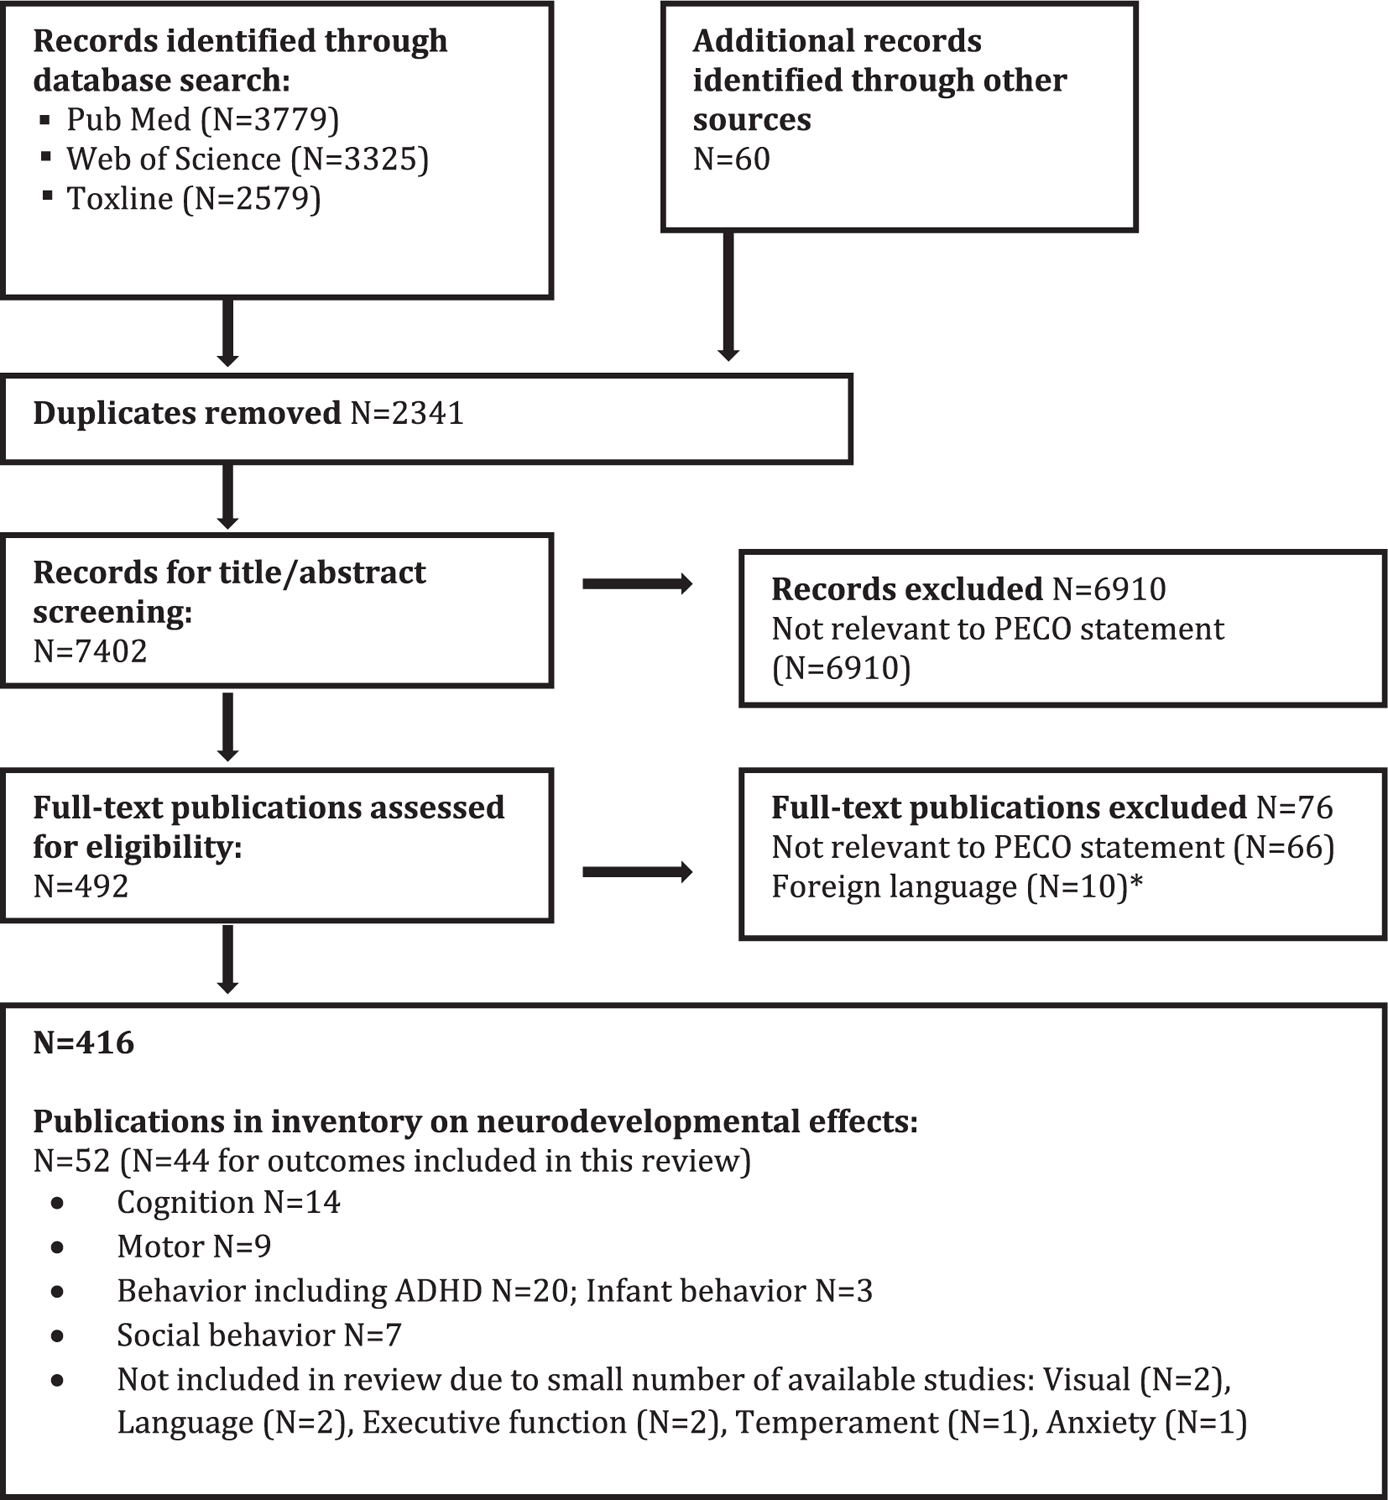
Literature flow diagram for neurodevelopmental effects of phthalates. *Did not include studies on neuropsychological and behavioral effects.
3.1. Study selection and evaluation
Due to temporality issues and/or the exposure measurement issues described in the phthalate measurement criteria, we excluded 18 epidemiology studies (2 on cognition, 11 on behavior including ADHD, and 5 on social behavior) identified in the search with data on neurodevelopment and phthalate exposure (Table 2). This included most studies with postnatal exposure measures. The specific phthalate metabolites and outcomes examined in the remaining 26 papers (17 studies) and the study evaluations are summarized in Table 2. Full rationales for the ratings are available in HAWC (https://hawcprd.epa.gov/summary/visual/100500036/).
Table 2.
Epidemiology studies of neurodevelopmental effects of phthalates.
| Study description | Outcomes | Includes metabolites of: | Study evaluation | ||||||||||||||||
|---|---|---|---|---|---|---|---|---|---|---|---|---|---|---|---|---|---|---|---|
| Reference(S) | Population | Exposure | Cognition | Motor | Behavior | Infant | Social | DEHP | DINP | DBP | DIBP | BBP | DEP | Exposure | Outcome | Selection | Confound | Analysis | Overall |
| Braun et at (2014); Yolton et al. (2011); Li et al. (2019) | Birth cohort (N=389) in U.S. | Two urine samples during gest (16 & 26 wk); additional yearly | C | I | C I | ✓ | ✓ | ✓ | ✓ | ✓ | G/A | G | A | G | G | High | |||
| Doherty et al. (2017); Mikodovnik et al. (2011); Engel et al. (2010); Engel et al. (2009) | Birth cohort (N=404) in U.S. | Single urine sample (25–40 wk gest) | C | M | B | I | S | ✓ | ✓ | ✓ | ✓ | ✓ | A/D | A | A | A | A | Medium | |
| Engel et al. (2018) | Nested case-control (N=802) in birth cohort in Norway | Single urine sample (17 wk gest) | B | ✓ | ✓ | ✓ | ✓ | ✓ | ✓ | A/D | A | A | G | G | Medium | ||||
| Factor-Litvak et al. (2014); Whyatt et al. (2012); Balalian et al. (2019) | Birth cohort (N=328) in U.S. | Single urine sample (33 wk gest) | C | M | B | ✓ | ✓ | ✓ | ✓ | ✓ | A/D | A | A | G | G | Medium | |||
| Gascon et al. (2015) | Birth cohort (N=657) in Spain | Two urine samples (12 & 32 wk gest) | C | M | B | ✓ | ✓ | ✓ | ✓ | ✓ | G/A | G | G | G | G | High | |||
| Huang et at (2015); Lien et al. (2015) | Birth cohort (N=430) in Taiwan | Single urine sample (28–36 wk gest) | C | B | ✓ | ✓ | ✓ | ✓ | A/D | A | D | A | G | Medium | |||||
| Kim et al. (2011) | Birth cohort (N=417) in Korea | Single urine sample (35–41 wk gest) | C | M | ✓ | ✓ | A/D | A | A | G | G | Medium | |||||||
| Kim et al. (2017) | Birth cohort (N=175) in Korea | Single urine sample (14–27 wk gest) | C | ✓ | ✓ | A/D | A | D | A | A | Medium | ||||||||
| Kim et al. (2018) | Birth cohort (N=86) in Korea | Single urine sample (at delivery) | C | M | B | S | ✓ | ✓ | ✓ | ✓ | D | D | D | A | A | Low | |||
| Kobrosly et at (2014) | Birth cohort (N=153) in U.S. | Single urine sample (10–39 wk gest) | B | ✓ | ✓ | ✓ | ✓ | ✓ | A/D | A | A | G | G | Medium | |||||
| Messerlian et al. (2017) | Preconception cohort (N=166) in U.S. | Multiple urine samples preconception | B | ✓ | ✓ | ✓ | ✓ | ✓ | G | A | A | G | G | High | |||||
| Nakiwala et al. (2018); Philippat et al. (2017) | Birth cohort (N=452 boys) in France | Single urine sample (22–29 wk gest) | C | B | ✓ | ✓ | ✓ | ✓ | ✓ | ✓ | A/D | G | G | G | G | Medium | |||
| Polanska et at (2014) | Birth cohort (N=165) in Poland | Single urine sample (30–34 wk gest) | C | M | ✓ | ✓ | ✓ | ✓ | ✓ | ✓ | A/D | A | A | A | A | Medium | |||
| Shin et al. (2018) | Birth cohort (N=201) in U.S. | Multiple samples per trimester | S | ✓ | ✓ | ✓ | ✓ | ✓ | ✓ | G | G | A | G | G | High | ||||
| Stroustrup et al. (2018) | NICU cohort (N=64) in U.S. | Weekly urine samples in NICU | I | ✓ | A | G | G | D | A | Low | |||||||||
| Téllez-Rojo et al. (2013) | Birth cohort (N=135) in Mexico | Single urine sample (3rd trim) | C | M | ✓ | ✓ | ✓ | ✓ | ✓ | A/D | A | A | A | G | Medium | ||||
| Verstraete et al. (2016) | NICU Cohort (N=549) in Mexico | Multiple plasma samples in NICU | M | ✓ | D | A | D | D | A | Low | |||||||||
| Total included studies per outcome or phthalate: | 11 | 8 | 9 | 3 | 3 | 17 | 4 | 15 | 12 | 12 | 13 | ||||||||
|
| |||||||||||||||||||
Excluded
Exposure measured concurrent with outcome - Arbuckle et al. (2016a), Arbuckle et al. (2016b), Cho et al. (2010), Chopra et al. (2014), Hu et al. (2017), Kardas et al. (2015), Kim et al. (2009), Kondolot et al. (2016), Oztop et al. (2018), Park et al. (2014), Park et al. (2015), Testa et al. (2012), Shoaff et al. (2018), Won et al. (2016);
Exposure measurement in blood - Kardas et al. (2015), Minatoya et al. (2016), Minatoya et al. (2018);
Exposure measurement based on type of flooring in home - Larsson et al. (2009);
Exposure measurement based on household dust, which likely does not represent total exposure - Philippat et al. (2015).
C=cognition; M=motor; B=behavior; 1=infant behavior; S=social behavior; G=good; A=adequate; D=deficient; G/A=good for short chain phthalates, adequate for long chain phthalates; A/D=adequate for short chain phthalates, deficient for long chain phthalates; wk gest=weeks gestation.
Sample sizes listed may not be accurate for all publications or results reported (the correct sample sizes for individual results are reflected in summary results tables). Studies may have examined additional outcomes not listed in this table (see supplemental file for full list).
C = cognition; M = motor; B = behavior; I = infant behavior; S = social behavior; G = good; A = adequate; D = deficient; G/A = good for short chain phthalates, adequate for long chain phthalates; A/D = adequate for short chain phthalates, deficient for long chain phthalates; wk gest = weeks gestation.
Sample sizes listed may not be accurate for all publications or results reported (the correct sample sizes for individual results are reflected in summary results tables). Studies may have examined additional outcomes not listed in this table (see supplemental file for full list). (See above-mentioned references for further information.)
With one exception, all the included studies are birth cohorts with follow-up in infancy to childhood (newborns to age 11 years), ranging in sample size between 135 and 657 children. The remaining study was a cohort of children admitted to the pediatric intensive care unit (ICU) and followed at 4 years post-admission (Verstraete et al., 2016). Potential for exposure misclassification was a common limitation because exposure was based on a single urine sample in all but three studies (Braun et al., 2014, Gascon et al., 2015, Yolton et al., 2011). The vast majority of the informative studies measured exposure during gestation. Timing of collection varied among studies but was most common in the 3rd trimester; we did not consider this variability to be a basis for downgrading the confidence in the results. One study (Messerlian et al., 2017) measured exposure in the preconception period and two studies measured exposure in neonates in the NICU (Stroustrup et al., 2018; Verstraete et al., 2016). In summary, four studies were classified as high confidence, ten studies were classified as medium confidence, and three studies were classified as low confidence.
3.2. Study results and synthesis by outcome
When discussing study results, we refer to associations with higher and lower exposure to individual phthalates, acknowledging that urinary phthalate metabolite concentrations are used to assess exposure and that exposure is only estimated.
3.3. Cognition
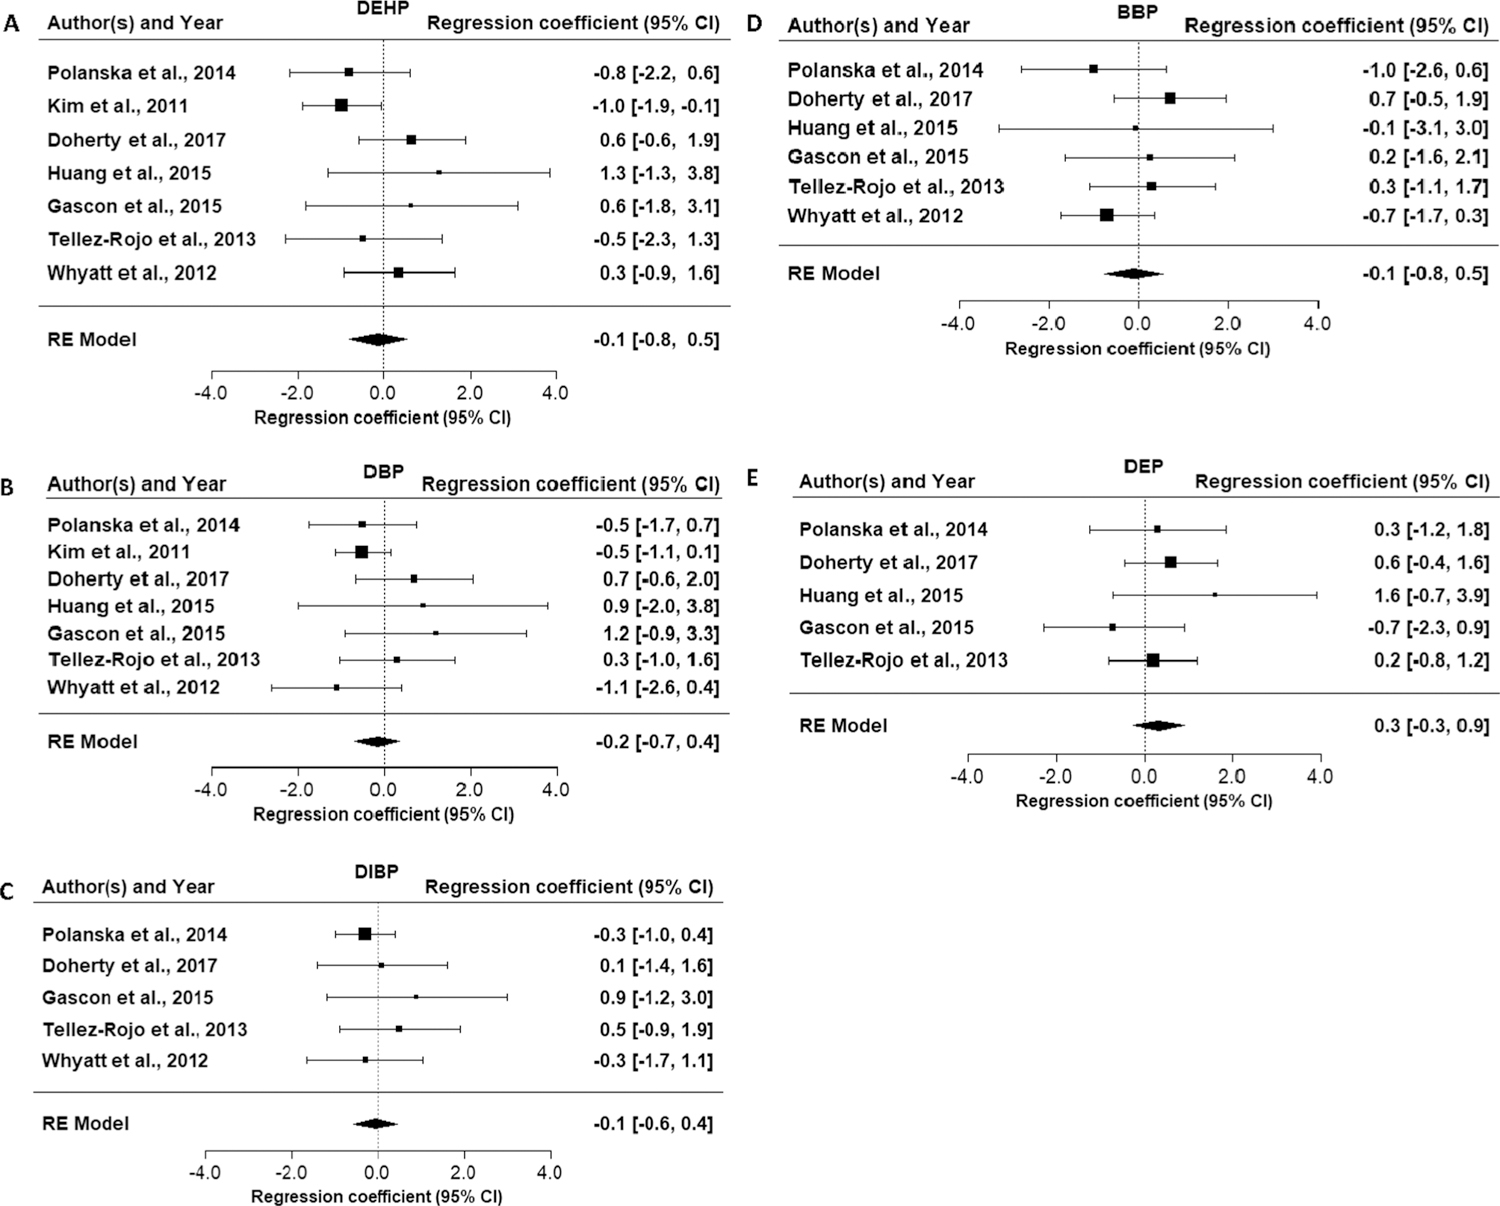
Evaluation of the association between exposure to DEHP and cognition is based on eleven included studies (twelve papers), with a focus on the ten medium and high confidence studies. Four studies (Kim et al., 2011, Téllez-Rojo et al., 2013, Polanska et al., 2014, Li et al., 2019), including one of the two high confidence studies, reported an inverse association, i.e., decreased cognition with increased DEHP exposure in the results unstratified by sex, with effect estimates (β) of −0.5, −0.8, −1.0, and −1.9 per 1 ln-unit increase in DEHP metabolites. In the two studies with the largest effect estimates (Kim et al., 2011; Li et al., 2019), these results were statistically significant (Table 3). Li et al. (2019) reported different associations based on timing of the exposure measure, and the inverse association was present with exposure measurement at 3 years of age but not during gestation (16 or 26 weeks) or at 1, 2, or 4 years. The remaining studies did not support this inverse association, and the other high confidence study (Gascon et al., 2015) reported a positive association at age 4. All the studies that reported inverse associations between DEHP and cognition assessed this domain in children ≤3 years old, with the exception of Li et al. (2019). There was no apparent trend of greater association in studies with higher exposure levels or wider range. There was some indication of modification by child sex, but the direction was not consistent across studies. Results in girls drove the inverse association in Téllez-Rojo et al. (2013), while the association was stronger in boys in Kim et al. (2011). The results of the meta-analysis of the MDI from the BSID in children 6 months to 3 years were essentially null (Fig. 3A, β = −0.1; 95% CI = −0.8, 0.5). Looking at the sex-specific meta-analyses, there was an inverse association in girls, but the estimate was imprecise (Table 4). Overall, there are indications of an association in some studies, but given the lack of consistency across the available studies, the evidence for cognition and DEHP exposure is considered slight.
Table 3.
Associations between DEHP metabolites and cognition.
| Reference; study confidence; N | Age at outcome measure | Median exposurea,b | Exposure IQR(or as specified) | Cognition overall effect estimate β (95% CI) | Cognition in boys β (95% CI) | Cognition in girls β (95% CI) |
|---|---|---|---|---|---|---|
| Included in meta-analysis (age ≤4 yrs, cognition measured using Bayley, medium or high confidence) | ||||||
| Polanska et al. (2014); medium; 150 | 2 yr | 0.02 nmol/mL | 0.3 (95th) | −0.8 (−2.2, 0.6) | NR | NR |
| Kim et al. (2011); medium; 460 | 6 mo | 8 ng/mL (MEOHP) | 3.8–17.1 | −1.0 (−1.9, −0.1)* | −1.6 (−2.9,−0.3)* | −0.5 (−1.9,0.9) |
| Doherty et al. (2017); medium; 258 | 1–3 yr | 0.3 nmol/mL | 3.2 (95th) | 0.6 (−0.,1.9) | 0.1 (−1.5,1.7) | 1.8 (−0.1,3.7) |
| Gascon et al. (2015); high; 367 | 1 yr | 100 μg/g | 68–146 | 0.6 (−1.8,3.1)c | 0.3 (−3.1,3.7)c | 0.2 (−3.4,3.7)c |
| 4 yr | 2.0 (−0.2,4.2) | 2.8 (−0.6,6.2) | 1.3 (−1.7,4.3) | |||
| Tellez-Rojo et al. (2013); medium; 135 | 2–3 yr | 0.4 nmol/mL (GM) | NR | −0.5 (−2.3, 1.3) | 1.5 (−0.8,3.7) | −3.4 (−5.3,−1.6)* |
| Whyatt et al. (2012); medium; 319 | 3 yr | 19 ng/mL (MEOHP GM) | 0.7–1,320 (range) | 0.4 (−0.9, 1.6) | 1.0 (−1.1,3.1) | −0.2 (−1.9,1.5) |
| Huang et al. (2015); medium; 251 | 2–3 yr | 59 μg/g (GM) | NR | 1.3 (−1.3,3.8) | NR | NR |
| Not included in meta-analysis | ||||||
| Kim et al. (2017); medium; 175 | 6 yr | 13 μg/g (MEOHP mean) | NR | 3.0 (−2.8,8.7) | NR | NR |
| Huang et al. (2015); medium; 251 | 2, 5, 8, and 11 yr | 59 μg/g (GM) | NR | −0.1 (−2.2, 2.0) | NR | NR |
| Naldwala et al. (2018); medium; 452 | 5 yr | 23 ng/mL (MEOHP) | 5.8–87 (5th-95th) | NR | −0.04 (−0.1, 0.06) | NR |
|
Factor-Litvak et al. (2014) (same study as Whyatt et al., 2012) |
7 yr | MEHHP | 0.2 (−1.2, 1.5) | 0.3 (−1.9,2.4) | 0.3 (−.14,2.0) | |
| Li et al. (2019); high; 253 | 5, 8 yr | 26 wk gest 87 ng/mL | 27–156 | 0.3 (−1.5,2.1) | NR | NR |
| 3 yr 94 ng/mL | 45–213 | −1.9 (−3.7,−0.2)* | NR | NR | ||
Maternal exposure measured during gestation unless otherwise noted.
Results are for summed DEHP metabolites unless specified. All studies used ln-transformed exposure and βs represent 1 ln-unit increase, except for Gascon, which used log2-transformation and β represent doubling of exposure.
Upon request, author provided re-calculated results with 1n-transformed exposure and β representing a ln-unit increase, to improve comparability with other studies
One low confidence study (Kim et al., 2018) not shown in table because results were incompletely reported.
Results that support an adverse association are shaded. This represents one or more of the following: p < 0.05, β ≥ 0.5, or exposure-response trend across categories of exposure. GM = geometric mean.
p < 0.05.
Fig. 3.
Forest plots for meta-analysis of phthalate exposure and Bayley Scales of Infant Development Mental Development Index in children ≤ 4 years of age.
Table 4.
Sex-specific meta-analysis results for Bayley Scales of Infant Development Mental (MDI) and Psychomotor Development Indices (PDI) in children ≤4 years of age by phthalate.
| Phthalate | Girls MDI | Boys MDI | Girls PDI | Boys PDI |
|---|---|---|---|---|
| DEHP | −0.5 (−2.2, 1.2) | 0.1 (−1.2, 1.3) | 0.2 (−0.8, 1.3) | 0.1 (−1.1, 1.3) |
| DBP | −0.8 (−2.2, 0.6) | 0.4 (−0.8, 1.6) | −0.7 (−1.8, 0.3) | 0.0 (−1.7, 1.8) |
| DIBP | −0.8 (−2.1, 0.6) | 0.8 (−0.3, 1.8) | −0.5 (−1.9, 0.9) | −0.1 (−1.4, 1.2) |
| BBP | −0.7 (−1.6, 0.2) | 0.8 (−0.3, 1.9) | −1.6 (−2.6, −0.6) | 0.8 (−0.2, 1.9) |
| DEP | 0.3 (−0.8, 1.4) | 0.0 (−1.1, 1.2) | 0.4 (−0.5, 1.4) | 0.4 (−0.5, 1.4) |
Three studies provided data on the association between DINP exposure and cognition (Polanska et al., 2014, Nakiwala et al., 2018; Li et al., 2019). An inverse relationship was observed by Polanska et al. (2014) (β = −0.6 (95% CI = −2.0,0.8) and no association was observed in Nakiwala et al. (2018) or Li et al. (2019). This evidence is considered indeterminate due to the small amount of available evidence.
Eleven studies reported on the association between DBP exposure and cognition (Table 5). Three studies (Kim et al., 2011, Polanska et al., 2014, Whyatt et al., 2012, Factor-Litvak et al., 2014) reported inverse associations with effect estimates (β) of −0.5, −0.5, −1.1, and −2.7 (statistically significant in Factor-Litvak et al. (2014)). Like DEHP, the association was primarily in children ≤3 years old, but an association was observed in older children in one study (Factor-Litvak et al., 2014). The two high confidence studies (Li et al., 2019; Gascon et al., 2015) reported no association. There is no apparent trend between exposure levels/range and strength of association across studies. There is a suggestion of effect modification by sex, i.e., that girls may be more susceptible to cognitive effects of DBP exposure than boys. Among studies with sex-specific results, girls had stronger associations in most studies (significant associations in girls were observed in two studies, including one (Doherty et al., 2017) in which no association was reported in the non-stratified population. However, there was some inconsistency as a stronger association was observed in boys in one study (Kim et al., 2011) and the association in the high confidence study was in the opposite direction. The results of the meta-analysis of the MDI from the BSID in children 6 months to 3 years were close to null (Fig. 3B, β = −0.2; 95% CI = −0.7, 0.4). Looking at the sex-specific meta-analyses, there was an inverse association in girls, but the estimate was imprecise (Table 4). Overall, given the lack of consistency across studies, the evidence for the association between DBP exposure and cognition is slight.
Table 5.
Associations between DBP exposure (measured by MBP) and cognition.
| Reference; study confidence; N | Age at outcome measure | Median exposuresa | Exposure IQR (or as specified) | Cognition overall effect estimate β (95% CI) | Cognition in boys β (95% CI) | Cognition in girls β (95% CI) |
|---|---|---|---|---|---|---|
| Included in meta-analysis (age ≤4 yrs, cognition measured using Bayley, medium or high confidence) | ||||||
| Polanska et al. (2014); medium; 150 | 2 yr | 4 ng/mL | 130 (95th) | −0.5 (−1.8, 0.7) | NR | NR |
| Kim et al. (2011); medium; 460 | 6 mo | 17 ng/mL | 5.4‒41.1 | −0.5 (−1.2, 0.1) | −0.9 (−1.8, −0.05)* | −0.2 (−1.2,0.8) |
| Gascon et al. (2015); high; 367 | 1 yr | 31 μg/g | 20‒49 | 1.2 (−0.9,3.3)b | 1.5 (−1.6,4.6)b | 1.4 (−1.5,4.2)b |
| 4 yr | 0.8 (−1.1,2.6)b | 1.7 (−1.4,4.7)b | 0.4 (−2.0,2.8)b | |||
| Doherty et al. (2017); medium; 258 | 1–3 yr | 35 ng/mL | 202 (95th) | 0.7 (−0.7,2.0) | 1.7 (0.1,3.3)* | −2.8 (−5.0,−0.5)* |
| Whyatt et al. (2012); medium, 319 | 38 ng/mL(GM) | 0.2‒785 (range) | −1.1 (−2.6, 0.4) | 0.3 (−2.0,2.6) | −2.7 (−4.7,−0.7)* | |
| Huang et al. (2015); medium, 251 | 2–3 yr | 78 μg/g (GM) | NR | 0.9 (−2.0,3.8) | NR | NR |
| Tellez-Rojo et al. (2013); medium; 135 | 2‒3 yr | 86 ng/mL | NR | 0.3 (−1.0, 1.7) | 0.5 (−1.3,2.4) | −0.2 (−2.2,1.8) |
| Not included in meta-analysis | ||||||
| Kim et al. (2017); medium; 175 | 6 yr | 30 ng/mL | NR | 4.0 (−1.3,9.2) | NR | NR |
| Factor-Litvak et al. (2014); medium, 328 (same study as Whyatt et al., 2012) | 7 yr | −2.7 (−4.3, −1.1)* | −1.9 (−4.3,0.6) | −3.2 (−5.4,−0.9)* | ||
| Li et al., 2019; high; 253 | 5, 8 yr | 26 wk gest 23 ng/mL | 9–49 | 0.6 (−0.9,2.2) | NR | NR |
| 4 yr 22 ng/mL | 11–43 | 2.1 (0.3,3.9) | NR | NR | ||
| Nakiwala et al. (2018); medium; 452 | 5 yr | 45 ng/mL | 12–444 (5th-95th) | −0.09 (−0.2,0.04) | NR | NR |
| Huang et al. (2015); medium, 251 | 2, 5, 8, 11 yr | 78 μg/g (GM) | −0.2 (−2.5, 2.1) | NR | NR | |
Maternal exposure measured during gestation unless otherwise noted.
Upon request, author provided re-calculated results with 1n-transformed exposure and β representing a ln-unit increase, to improve comparability with other studies
One low confidence study (Kim et al., 2018) not shown in table because results were incompletely reported.
All studies used ln-transformed exposure and βs represent 1 ln-unit increase, except for Gascon, which used log2-transformation and β represent doubling of exposure.
Results that support an adverse association are shaded. This represents one or more of the following: p < 0.05, β ≥ 0.5, or exposure-response trend across categories of exposure. NR = not reported. GM = geometric mean.
p < 0.05.
Eight studies reported on the association between DIBP exposure and cognition (Table 6). One medium confidence study (Factor-Litvak et al., 2014) reported an inverse association, which was statistically significant. Some studies had fairly low exposure levels (< 10 ng/mL) compared to other phthalates, which may have reduced sensitivity to observe an effect. However, the studies with the highest exposure levels did not observe an association. As with DBP, there were additional significant results in two of the three studies that examined an interaction with sex, with girls having stronger inverse associations. The results of the meta-analysis of the MDI from the BSID in children 6 months to 3 years were essentially null (Fig. 3C, β = −0.1; 95% CI = −0.6, 0.5). Looking at the sex-specific meta-analyses, there was an imprecise inverse association in girls (Table 4). This evidence is considered slight.
Table 6.
Associations between DIBP exposure (measured by MIBP) and cognition.
| Reference; study confidence; N | Age at outcome measure | Median exposuresa | Exposure IQR (or as specified) | Cognition overall effect estimate β (95% CI) | Cognition in boys β (95% CI) | Cognition in girls β (95% CI) |
|---|---|---|---|---|---|---|
| Included in meta-analysis (age ≤4 yrs, cognition measured using Bayley, medium or high confidence) | ||||||
| Téllez-Rojo et al. (2013); medium; 135 | 2‒3 yr | 2 ng/mL (GM) | 0.5 (−0.9, 1.9) | 0.3 (−1.6,2.3) | −0.1 (−1.9,1.7) | |
| Doherty et al. (2017); medium; 258 | 1–3 yr | 6 ng/mL | 35 (95th) | 0.1 (−1.4,1.6) | 1.6 (−0.4,3.5) | −2.3 (−4.3,−0.2) |
| Whyatt et al. (2012); medium; 319 | 3 yr | 9 ng/mL (GM) | <LOD-374 (range) | −0.3 (−1.6, 1.1) | 0.6 (−1.4,2.6) | −1.3 (−3.2,0.5) |
| Polanska et al. (2014); medium; 150 | 2 yr | 10 ng/mL | 359 (95th) | −0.3 (−1.0, 0.4) | NR | NR |
| Gascon et al. (2015); high; 367 | 1 yr | 32 μg/g | 22‒48 | 0.9 (−1.2,3.0)b | 0.4 (−2.4,3.2)b | 1.4 (−1.5,4.2)b |
| 4 yr | 1.1 (−0.8,3.0)b | 2.7 (−0.04,5.4)b | −0.4 (−3.1,2.4)b | |||
| Not included in meta-analysis | ||||||
| Li et al. (2019), high, 253 | 5, 8 yr | 26 wk gest 4 ng/mL | 2–11 | 1.4 (−0.3,3.1) | NR | NR |
| 4 yr 11 ng/mL | 5–23 | 1.8 (0.0,3.6) | NR | NR | ||
| Factor-Litvak et al. (2014); medium; 328 (same study as Whyatt et al., 2012) | 7 yr | −2.7 (−4.2, 1.2)* | −2.9 (−5.2,−0.7)* | −2.4 (−4.5,−0.26)* | ||
| Nakiwala et al. (2018); medium; 452 | 5 yr | 39 ng/mL | 12–168 (5th-95th) | 0.05 (−0.05,0.2) | NR | NR |
Maternal exposure measured during gestation unless otherwise noted.
Upon request, author provided re-calculated results with 1n-transformed exposure and β representing a ln-unit increase, to improve comparability with other studies.
One low confidence study (Kim et al., 2018) not shown in table because results were incompletely reported.
All studies used ln-transformed exposure and βs represent 1 ln-unit increase, except for Gascon, which used log2-transformation and β represent doubling of exposure.
Results that support an adverse association are shaded. This represents one or more of the following: p < 0.05, β ≥ 0.5, or exposure-response trend across categories of exposure. NR = not reported. GM = geometric mean
p < 0.05
Evaluation of the evidence for an association between exposure to BBP and cognition is based on nine studies (Table 7). Four studies (Polanska et al., 2014, Huang et al., 2015, Factor-Litvak et al., 2014, Whyatt et al., 2012, Li et al., 2019) reported inverse associations with BBP exposure in the overall populations. The latter study reported statistical significance with exposure measurement at 3 years of age, and a consistent inverse relationship with exposure measurement during gestation (at 16 and 26 weeks) and at 2 years of age; no association was observed with exposure measurement at 1 and 4 years of age. The remaining studies found no association. There was again some indication of modification by child sex, with a stronger indication of an association in girls. The results of the meta-analysis of the MDI from the BSID in children 6 months to 3 years was close to null (Fig. 3D, β = −0.1; 95% CI = −0.8, 0.5). Looking at the sex-specific meta-analyses, there was an inverse association in girls, but the estimate was imprecise (Table 4). Overall, given the lack of consistency, this evidence is considered slight.
Table 7.
Associations between BBP exposure (measured by MBzP) and cognition.
| Reference; study confidence; N | Age at outcome measure | Median exposuresa | Exposure IQR (or as specified) | Cognition overall effect estimate β (95% CI) | Cognition in boys β (95% CI) | Cognition in girls β (95% CI) |
|---|---|---|---|---|---|---|
| Included in meta-analysis (age ≤4 yrs, cognition measured using Bayley, medium or high confidence) | ||||||
| Polanska et al. (2014); medium; 150 | 2 yr | 0.03 ng/mL | 0.5 (95th) | −1.0 (−2.6, 0.6) | NR | NR |
| Tellez-Rojo et al. (2013); medium; 135 | 2‒3 yr | 3.5 ng/mL (GM) | 0.3 (−1.1, 1.7) | 1.3 (−0.4,3.0) | −0.7 (−2.5,1.0) | |
| Gascon et al. (2015); high; 367 | 1 yr | 12 μg/g | 7‒20 | 0.3 (−1.7,2.1)b | 0.4 (−2.1,2.8)b | 1.0 (−1.9,4.0)b |
| 4 yr | 0.5 (−1.3,2.2)b | 1.1 (−1.3,3.5)b | −0.5 (−3.1,2.1)b | |||
| Doherty et al. (2017); medium; 258 | 1–3 yr | 15 ng/mL | 124 (95th) | 0.7 (−0.5,2.0) | 1.8 (0.1,3.6) | −0.6 (−2.3,1.1) |
| Huang et al. (2015); medium; 251 | 2–3 yr | 17 μg/g (GM) | 0.2 (−3.8,3.6) | NR | NR | |
| Whyatt et al. (2012); medium; 319 | 3 yr | 19 ng/mL (GM) | <LOD‒1,110 (range) | −0.7 (−1.8, 0.3) | −0.5 (−2.2,1.3) | −1.1 (−2.5,0.3) |
| Not included in meta-analysis | ||||||
| Li et al. (2019); high; 253 | 5, 8 yr | 26 wk gest 8 ng/mL | 3–23 | −0.5 (−2.2, 1.2) | NR | NR |
| 3 yr 17 ng/mL | 5–42 | −2.5 (−4.4, −0.5)* | NR | NR | ||
| Huang et al. (2015); medium; 251 | 2, 5, 8, 11 Yr | 17 μg/g (GM) | −0.06 (−3.1, 3.0) | NR | NR | |
| Factor-Litvak et al. (2014); medium; 328 (same study as Whyatt et al., 2012) | 7 yr | −1.2 (−2.4, 0.1) | −1.5 (−3.4,0.4) | −0.8 (−2.5,0.8) | ||
| Nakiwala et al. (2018); medium; 452 | 5 yr | 19 ng/mL | 5–114 (5th-95th) | 0.02 (−0.1,0.1) | NR | NR |
Maternal exposure measured during gestation unless otherwise noted.
Upon request, author provided re-calculated results with ln-transformed exposure and f3 representing a ln-unit increase, to improve comparability with other studies
Nine studies reported on the association between DEP and cognition (Table 8). The two high confidence studies (Gascon et al., 2015, Li et al., 2019) reported an inverse association between cognition and DEP exposure. In Li et al. (2019), this association was observed with exposure measurement at 2 and 3 years of age, with the latter being statistically significant, but not with exposure measurement during gestation or at 1 and 4 yrs. The low confidence study also reported an inverse association at 1–2 yrs of age. The other studies did not support an association overall. The results of the meta-analysis of the MDI from the BSID in children 6 months to 3 years was null (Fig. 3E, β = 0.3, 95% CI −0.3, 0.9), as were the sex-specific results (Table 4). There were non-statistically significant associations for girls in one study (Factor-Litvak et al., 2014) and boys in one study (Téllez-Rojo et al., 2013). Because of the lack of association in most studies, even with high exposure levels, this evidence is considered slight.
Table 8.
Associations between DEP exposure (measured by MEP) and cognition.
| Reference; study confidence; N | Age at outcome measure | Median exposuresa | Exposure IQR (or as specified) | Cognition overall effect estimate β (95% CI) | Cognition in boys β (95% CI) | Cognition in girls β (95% CI) |
|---|---|---|---|---|---|---|
| Included in meta-analysis (age ≤4 yrs, cognition measured using Bayley, medium or high confidence) | ||||||
| Polanska et al. (2014); medium; 150 | 2 yr | 19 ng/mL | 336 (95th) | 0.3 (−1.3, 1.8) | NR | NR |
| Huang et al. (2015); medium; 251 | 2–3 yr | 67 μg/g (GM) | −0.3 (−2.4,1.8) | NR | NR | |
| Téllez-Rojo et al. (2013); medium; 135 | 2–3 yr | 138 ng/mL (GM) | 0.2 (−0.8, 1.2) | −0.6 (−2.3,1.0) | 1.1 (−0.1,2.2) | |
| Doherty et al. (2017); medium; 258 | 1–3 yr | 172 ng/mL | 3372 (95th) | 0.6 (−0.5,1.6) | 1.0 (−0.5,2.4) | −0.1 (−1.7,1.5) |
| Gascon et al. (2015); high; 367 | 1 yr | 403 μg/g | 199‒756 | −0.7 (−2.3,0.9)b | −0.7 (−2.9,1.4)b | −0.8 (−3.0,1.4)b |
| 4 yr | 1.0 (−0.4,2.4)b | 2.1 (−0.01,4.2)b | −0.2 (−2.2,1.8)b | |||
| Not included in meta-analysis | ||||||
| Huang et al. (2015); medium; 251 | 2, 5, 8, and 11 yr | 67 μg/g (GM) | 1.6 (−0.7, 3.9) | NR | NR | |
| Nakiwala et al. (2018); medium; 452 | 5 yr | 100 ng/mL | 22–591 (5th-95th) | −0.06 (−0.2,0.04) | NR | NR |
| Li et al. (2019); high; 253 | 5, 8 yr | 26 wk gest 114 ng/mL | 36–319 | 0.3 (−1.3,1.9) | NR | NR |
| 3 yr 40 ng/mL | 16–83 | −2.1 (−3.6,−0.6)* | NR | NR | ||
| Factor-Litvak et al. (2014); medium; 328 | 7 yr | 142 ng/mL | 70–334 | −0.2 (−1.5,1.1) | 0.4 (−1.5,2.3) | −0.8 (−2.5,1.0) |
Maternal exposure measured during gestation unless otherwise noted.
Upon request, author provided re-calculated results with ln-transformed exposure and β representing a ln-unit increase, to improve comparability with other studies.
One low confidence study (Kim et al., 2018) not shown in table because results were incompletely reported.
All studies used 1n-transformed exposure and βs represent 1 ln-unit increase, except for Gascon, which used log2-transformation and β represent doubling of exposure.
Results that support an adverse association are shaded. Thi represents one or more of the following: p < 0.05, β ≥ 0.5, or exposure-response trend across categories of exposure. NR = not reported. GM = geometric mean.
p < 0.05.
All studies used ln-transformed exposure and βs represent 1 ln-unit increase, except for Gascon, which used log2-transformation and β represent doubling of exposure. Results that support an adverse association are shaded. This represents one or more of the following: p < 0.05, β ≥ 0.5, or exposure-response trend across categories of exposure. NR = not reported. GM = geometric mean *p < 0.05
The evidence for cognitive effects is fairly similar across the phthalates in this review. For each phthalate, there are a minority of studies that report inverse associations with cognitive performance, but with considerable inconsistency within each body of evidence that results in low confidence that a causal effect exists. There is no recognizable pattern of association by study confidence, exposure levels or range, timing of exposure measurement, timing of cognitive assessment, or type of cognitive assessment used. For each phthalate, there is evidence suggestive of stronger associations in girls, but the small number of studies presenting this information hinders interpretation. There are also challenges in assessing coherence across the phthalates and considering whether the phthalates that are most structurally similar and highly correlated in exposure (e.g., DBP and DIBP) have the most similar associations, as exposure levels and thus study sensitivity varies across the phthalates.
3.4. Motor effects
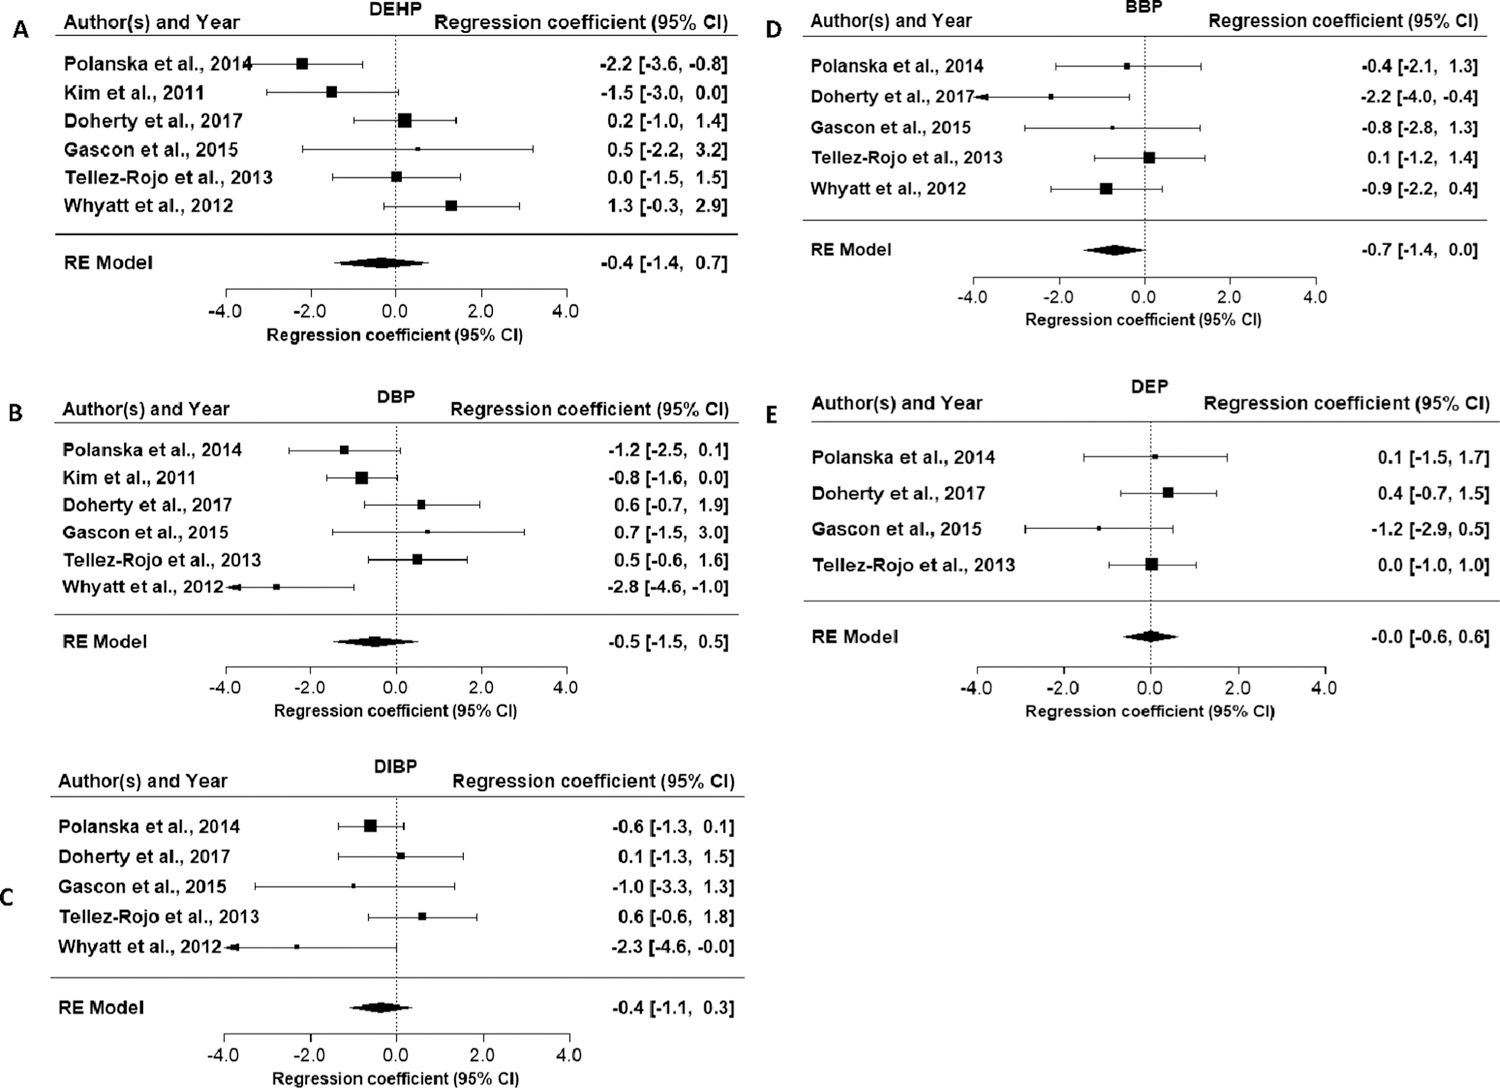
Evaluation of the association between exposure to DEHP and motor effects is based on eight studies (nine publications), with a focus on the six medium and high confidence studies (Table 9). All of these studies examined motor effect in young children (≤4 years), and one study (Balalian et al., 2019, an update of Whyatt et al. (2012)) looked at effects at 11 years. Two medium confidence studies reported an inverse association overall (both sexes combined), with effect estimates (β) of −1.5 and −2.2, the latter of which was statistically significant (Polanska et al. 2014). One low confidence study in children with DEHP exposure in the pediatric intensive care unit (Verstraete et al., 2016) also reported an inverse association. The remaining studies did not support this association. As with cognition, there was some indication of effect modification by child sex, but the direction was not consistent across studies. Results in girls drove the inverse association in Téllez-Rojo et al. (2013), while the association was stronger in boys in Kim et al. (2011). The results of the meta-analysis of the PDI in children 6 months to 3 years indicated a decrease in motor development, but the estimate was imprecise (Fig. 4A, β = −0.4; 95% CI = −1.4, 0.7). Overall, given the lack of consistency across studies, this evidence is considered slight.
Table 9.
Associations between summed DEHP metabolites and motor effects.
| Reference; study confidence; N | Age at outcome measure | Median maternal exposures | Exposure IQR (or as specified) | Motor overall effect estimate β (95% CI) | Motor in boys β (95% CI) | Motor in girls β (95% CI) |
|---|---|---|---|---|---|---|
| Polanska et al. (2014); medium; 150 | 2 yr | 0.02 nmol/mL | 0.3 (95th) | −2.2 (−3.6, −0.8)* | NR | NR |
| Kim et al. (2011); medium; 460 | 6 mo | 8 ng/mL (MEOHP), 10.1 (MEHHP) | 3.8‒17.1, 4.3‒21.4 | −1.5 (−3.0, 0.1) | −2.3 (−3.9,−0.6)* | −0.2 (−1.9,1.6) |
| Doherty et al. (2017); medium; 258 | 0.3 nmol/mL | 3.2 (95th) | 0.2 (−1.0,1.4) | 0.2 (−1.3,1.8) | 0.3 (−1.7,2.2) | |
| Gascon et al. (2015); high; 367 | 1 yr | 100 μg/g | 68‒146 | 0.5 (−2.2,3.2)^ | 0.5 (−3.4,4.4)^ | 0.5 (−3.4,4.4)^ |
| 4 yr | 0.4 (−2.1,2.8)^ | 0.9 (−3.0,4.8)^ | 0.02 (−3.1,3.1)^ | |||
| Téllez-Rojo et al. (2013); medium; 135 | 2–3 yr | 0.4 nmol/mL (GM) | NR | 0.01 (−1.5, 1.5) | 1.1 (−0.7,2.8) | −1.2 (−3.9,1.5) |
| Whyatt et al. (2012); medium; 319; Balalian et al. (2019); 209 | 3 yr | 265 ng/mL | 137–578 | 1.3 (−0.3, 2.9) | 0.7 (−1.4,2.7) | 2.3 (−0.2,4.9) |
| 11 yr | NR | −0.3 (−1.9,1.3) | −0.2 (−1.3,0.9) |
Two low confidence studies (Kim et al., 2018, Verstraete et al., 2016) not shown in table because results were incompletely reported (Kim et al., 2018) or were not summary estimates comparable to the other studies (Verstraete et al., 2016).
All studies used 1n-transformed exposure and βs represent 1 ln-unit increase, except for Gascon, which used log2-transformation and β represent doubling of exposure.
Results that support an adverse association are shaded. This represents one or more of the following: p < 0.05, β ≥ 0.5, or exposure-response trend across categories of exposure. NR = not reported. GM = geometric mean.
p < 0.05.
Upon request, author provided re-calculated results with ln-transformed exposure and β representing a ln-unit increase, to improve comparability with other studies.
Fig. 4.
Forest plots for meta-analyses of phthalate exposure and Bayley Scales of Infant Development Psychomotor Development Index in children ≤ 4 years of age.
Only one study (Polanska et al., 2014) provided results on the association between DINP exposure and motor skills. An inverse relationship between cognitive and DINP exposure was observed (β = −1.0 (95% CI = −2.5, 0.5), and without additional studies, this evidence is considered slight.
Seven studies (eight publications) reported on the association between DBP exposure and motor skills (Table 10). Three studies (Whyatt et al., 2012, Kim et al., 2011, Polanska et al., 2014) reported decreased in motor skills with higher exposure, with effect estimates (β) of −0.8, −1.2, −2.8 per 1 ln-unit increase in DBP metabolites. Results from one study were statistically significant in 3-year olds (Whyatt et al., 2012) and in an update at 11 years (Balalian et al., 2019). The remaining studies did not support this association. There was again some evidence of effect modification by child sex, but the direction was not consistent across studies. The results of the meta-analysis of the PDI in children 6 months to 3 years were consistent with a decrease in motor development, but the estimate was imprecise (Fig. 4B, β = −0.5; 95% CI = −1.5, 0.5)). Looking at the sex-specific meta-analyses, there was an inverse association in girls, but this estimate was also imprecise (Table 4). Overall, this evidence is considered slight.
Table 10.
Associations between DBP exposure (measured by MBP) and motor effects.
| Reference; study confidence; N | Age at outcome measure | Median maternal exposures | Exposure IQR (or as specified) | Motor overall effect estimate β (95% CI) | Motor in boys β (95% CI) | Motor in girls β (95% CI) |
|---|---|---|---|---|---|---|
| Polanska et al.(2014); medium; 150 | 2 yr | 4 ng/mL | 130 (95th) | −1.2 (−2.5, 0.1) | NR | NR |
| Kim et al. (2011); medium; 460 | 6 mo | 17 ng/mL | 5.4‒41.1 | −0.8 (−1.6, 0.03) | −1.3 (−2.4,−0.1) | −0.4 (−1.6,0.8) |
| Gascon et al. (2015); high; 367 | 1 yr | 31 μg/g | 20‒49 | 0.7 (−1.5,3.0)^ | 1.8 (−1.7,5.3)^ | 0.6 (−2.6,3.7)^ |
| 4 yr | −0.4 (−2.4,1.6)^ | 0.2 (−3.3,3.6)^ | 0.2 (−2.3,2.6)^ | |||
| Doherty et al. (2017); medium; 258 | 1–3 yr | 35 ng/mL | 202 (95th) | 0.6 (−0.8,1.9) | 1.9 (0.3,3.5) | −2.3 (−4.6,0.1) |
| Whyatt et al. (2012); medium; 319; Balalian et al. (2019); 209 | 3 yr | 37 ng/mL | 19–75 | −2.8 (−4.6, −1.0)* | −3.1 (−5.8,−0.3)* | −2.4 (−4.9,0.1) |
| 11 yr | NR | −0.6 (−2.0,0.7) | −2.1 (−3.4,−0.8)* | |||
| Tellez-Rojo et al. (2013); medium; 135 | 2–3 yr | 86 ng/mL (GM) | NR | 0.5 (−0.7, 1.6) | 0.9 (−0.5,2.3) | 0.5 (−1.7,2.7) |
One low confidence study (Kim et al., 2018) not shown in table because results were incompletely reported.
All studies used ln-transformed exposure and βs represent 1 ln-unit increase, except for Gascon, which used log2-transformation and β represent doubling of exposure.
Results that support an adverse association are shaded. This represents one or more of the following: p < 0.05, β ≥ 0.5, or exposure-response
trend across categories of exposure. NR = not reported. GM = geometric mean.
p < 0.05.
Upon request, author provided re-calculated results with ln-transformed exposure and β representing a ln-unit increase, to improve comparability with other studies.
Evaluation of the association between DIBP exposure and motor effects is based on six studies (seven publications). Three studies (Gascon et al., 2015, Polanska et al., 2014, Whyatt et al., 2012), including the single high confidence study, reported inverse associations with DIBP exposure and motor skills (Table 11). Results from one study were statistically significant in 3 year olds (Whyatt et al., 2012) and 11 year olds (Balalian et al., 2019). Two studies (Doherty et al., 2017, Téllez-Rojo et al., 2013) did not support this association but did have the lowest exposure levels among these studies. Results were generally consistent across the sexes, with the exception of Doherty et al. (2017). The results of the meta-analysis of the PDI in children 6 months to 3 years were consistent with a decrease in motor development, but the estimate was imprecise (Fig. 4C, β = −0.4; 95% CI = −1.1, 0.3)). Looking at the sex-specific meta-analyses, there was an inverse, though imprecise, association in girls (Table 4). Overall, this evidence is considered slight.
Table 11.
Associations between DIBP exposure (measured by MIBP) and motor effects.
| Reference; study confidence; N | Age at outcome measure | Median maternal exposure | Exposure IQR (or as specified) | Motor overall effect estimate β(95% CI) | Motor in boys β(95% CI) | Motor in girls β(95% CI) |
|---|---|---|---|---|---|---|
| Téllez-Rojo et al. (2013); medium; 135 | 2‒3 yr | 2 ng/mL (GM) | NR | 0.6 (−0.7, 1.8) | 0.6 (−0.7,2.0) | 0.4 (−1.7,2.4) |
| Doherty et al. (2017); medium; 258 | 1–3 yr | 6 ng/mL | 35 (95th) | 0.1 (−1.3,1.6) | 0.7 (−1.2,2.6) | −0.7 (−2.9,1.6) |
|
Whyatt et al. (2012); medium; 319 Balalian et al. (2019); 209 |
3 yr | 8 ng/mL | 4–16 | −2.3 (−3.9, 0.7)* | −2.2 (−4.6,0.2) | −2.3 (−4.6, −0.1)* |
| 11 yr | NR | −0.6 (−1.9,0.8) | −1.4 (−2.5,−0.2)* | |||
| Polanska et al. (2014); medium; 150 | 2 yr | 10 ng/mL | 359 (95th) | −0.6 (−1.3, 0.2) | NR | NR |
| Gascon et al. (2015); high; 367 | 1 yr | 32 μg/g | 22–48 | −1.0 (−3.3,1.3)^ | −0.8 (−3.9,2.4)^ | −0.9 (−4.4,2.7)^ |
| 4 yr | −2.0 (−4.1,0.1)^ | −2.0 (−5.1,1.1)^ | −1.8 (−4.6,1.0)^ |
One low confidence study (Kim et al., 2018) not shown in table because results were incompletely reported.
All studies used ln-transformed exposure and βs represent 1 ln-unit increase, except for Gascon, which used log2-transformation and β represent doubling of exposure.
Results that support an adverse association are shaded. This represents one or more of the following: p < 0.05, β ≥ 0.5, or exposure-response trend across categories of exposure. Light grey represents other supportive results. NR = not reported.
p < 0.05.
Upon request, author provided re-calculated results with ln-transformed exposure and β representing a ln-unit increase, to improve comparability with other studies.
Evaluation of the evidence for an association between exposure to BBP and motor skills is based on five medium and high confidence studies (Table 12). Four reported inverse associations with BBP exposure in young children, though in one study the inverse association was only in girls (Tellez-Rojo et al., 2013). The inverse effect estimates unstratified by sex were β = −0.4, −0.6, −0.9, −2.2 and results from the high confidence study were statistically significant (Gascon et al., 2015). The fact that the strongest associations were observed in the high confidence study, which may have had less exposure misclassification due to repeated phthalate measures increases confidence, though this study was also the only one that did not measure motor effects using the BSID instrument, which could also explain differences in results. Since most of the studies performed outcome testing at a similar age (1–4 yrs), it is not clear whether the association persists to older ages, but in one study, the update of Whyatt et al. (2012), there was an inverse association in older children (11 year olds) which was statistically significant in girls (Balaian et al., 2019). Across studies, there was an indication of a stronger association in girls than boys. The results of the meta-analysis of the PDI in children 6 months to 3 years were consistent with a decrease in motor development and approached statistical significance (Fig. 4D, β = −0.7; 95% CI = −1.4, 0.0). The sex-specific meta-analyses indicated a stronger association among girls (Table 4, β = −1.6 (95% CI = −2.6,−0.6)). Overall, given the consistency in the direction of the association across studies, including in the single high confidence study, and the support of the meta-analysis results, this evidence is considered moderate in girls and slight in boys.
Table 12.
Associations between BBP exposure (measured by MBzP) and motor skills.
| Reference; study confidence; N | Age at outcome measure | Median maternal exposure | Exposure IQR (or as specified) | Motor overall effect estimate β(95% CI) | Motor in boys β(95% CI) | Motor in girls β(95% CI) |
|---|---|---|---|---|---|---|
| Polanska et al. (2014); medium; 150 | 2 yr | 0.03 ng/mL | 0.5 (95th) | −0.4 (−2.1, 1.3) | NR | NR |
| Téllez-Rojo et al. (2013); medium; 135 | 2–3 yr | 4 ng/Ml (GM) | NR | 0.1 (−1.2, 1.4) | 1.8 (0.1,3.5)* | −1.2 (−3.3,0.9) |
| Gascon et al. (2015); high 367 | 1 yr | 12 μg/g | 7–20 | −0.8 (−2.8,1.3)^ | 1.3 (−1.5,4.2)^ | −2.8 (−6.0,0.5)^ |
| 4 yr | −2.2 (−4.0,−0.3)^* | −1.4 (−4.2,1.3)^ | −2.8 (−5.4,−0.2)^* | |||
|
Whyatt et al. (2012); medium; 319 Balalian et al. (2019); 209 |
3 yr | 13 ng/mL | 5–27 | −0.9 (−2.2,0.4) | −0.6 (−2.7,1.6) | −1.1 (−2.8,0.7) |
| 11 yr | NR | −0.9 (−1.8,0.1) | −1.1 (−2.1,−0.1)* | |||
| Doherty et al. (2017); medium; 258 | 1–3 yr | 15 ng/mL | 124(95th) | −0.6 (−1.8,0.6) | 0.6 (−1.2,2.3) | −2.1 (−3.8,−0.4) |
All studies used ln-transformed exposure and βs represent 1 ln-unit increase, except for Gascon, which used log2-transformation and β represent doubling of exposure. Results that support an adverse association are shaded. This represents one or more of the following: p < 0.05, β ≥ 0.5, or exposure-response trend across categories of exposure. NR = not reported. GM = geometric mean.
p < 0.05.
Upon request, author provided re-calculated results with ln-transformed exposure and β representing a ln-unit increase, to improve comparability with other studies.
Five studies reported on the association between DEP and motor skills (Table 13). The one high confidence study (Gascon et al., 2015) reported a non-significant inverse association in one-year olds, and a low confidence study (Kim et al., 2018) reported a significant association at 6 months. In addition, Balalian et al. (2019) reported an inverse association in 11 year old girls, but not boys. The other studies did not support an association. The results of the meta-analysis of the PDI in children 6 months to 3 years were null (Fig. 4E, β = 0.0; 95% CI = −0.6, 0.6). Because of the lack of association in most studies, even with high exposure levels, this evidence is considered indeterminate.
Table 13.
Associations between DEP exposure (measured by MEP) and motor skills.
| Reference; study confidence; N | Age at outcome measure | Median maternal exposures | Exposure IQR (or as specified) | Motor overall effect estimate β (95% CI) | Motor in boys β (95% CI) | Motor in girls β (95% CI) |
|---|---|---|---|---|---|---|
| Polanska et al. (2014); medium; 150 | 2 yr | 19 ng/mL | 336 (95th) | 0.1 (−1.5, 1.8) | NR | NR |
| Balalian et al., 2019; medium; 209 | 11 yr | 131 ng/mL | 67–302 | NR | 0.5 (−0.5,1.5) | −1.2 (−2.4,−0.1)* |
| Téllez-Rojo et al. (2013); medium; 135 | 2–3 yr | 138 ng/mL (GM) | NR | 0.02 (−1.0, 1.0) | 0.1 (−1.3,1.5) | 0.3 (−1.1,1.7) |
| Doherty et al. (2017); medium; 258 | 1–3 yr | 172 ng/mL | 3372 (95th) | 0.4 (−0.7,1.5) | 0.2 (−1.3,1.6) | 0.6 (−1.1,2.3) |
| Gascon et al. (2015); high; 367 | 1 yr | 403 μg/g | 199‒756 | −1.2 (−2.8,0.6)^ | −1.2 (−3.7,1.2)^ | −0.2 (−3.6,1.3)^ |
| 4 yr | 0.6 (−1.0,2.1)^ | 2.0 (−0.4,4.4)^ | 0.5 (−1.8,2.7)^ |
One low confidence study (Kim et al., 2018) not shown in table because results were incompletely reported.
All studies used 1n-transformed exposure and βs represent 1 ln-unit increase, except for Gascon, which used log2-transformation and β represent doubling of exposure.
Results that support an adverse association are shaded. This represents one or more of the following: p < 0.05, β ≥ 0.5, or exposure-response trend across categories of exposure. NR = not reported. GM = geometric mean.
p < 0.05.
Upon request, author provided re-calculated results with 1n-transformed exposure and β representing a ln-unit increase, to improve comparability with other studies.
The evidence of motor effects is stronger than the other outcomes included in this review, though uncertainty still remains. For BBP, the evidence is moderate in girls, and a larger proportion of studies for DBP and DIBP indicated an inverse association than in other outcomes, though both of these latter two also had studies that reported positive (though non-significant) associations. These three phthalates, particularly DBP and DIBP are the most similar structurally and in exposure sources among the phthalates in this review, which increases confidence in the causal association due to coherence across the correlated exposures, though there is remaining potential for confounding across the phthalates that can’t be ruled out with the current evidence. Evidence for DEHP, DINP, and DEP is less compelling. For all of the examined phthalates, outside of what was discussed for BBP above, there are no clear patterns of association by study confidence, exposure levels or range, timing of exposure measurement, timing of cognitive assessment, or type of cognitive assessment used. As with cognition, there is evidence suggestive of stronger associations in girls, but additional evidence is needed.
3.5. Behavior
Studies that examined the association between phthalate exposure and behavior generally assessed multiple dimensions of behavior. This included summary scales (i.e., global behavior score, internalizing behaviors, and externalizing behaviors) and clinical scales (e.g., hyperactivity, aggression, anxiety, etc.). This review focused on the summary scales of internalizing and externalizing behavior because they were the most consistently reported across studies. In addition, one prospective study of ADHD was reviewed (Engel et al., 2018).
Nine studies reported on the association between DEHP exposure and behavior, and eight medium to high confidence studies are presented in Table 14. One reported an association between higher exposure to DEHP and more frequent internalizing and externalizing problems (Lien et al., 2015), but other studies reported no association or, in the study based on preconception exposure, an inverse association (Messerlian et al., 2017). This different exposure window may contribute to the apparent inconsistency. The single medium confidence study of ADHD diagnosis (Engel et al., 2018) reported a significant association between summed DEHP metabolites and ADHD (OR: 1.5, 95% CI 1.1, 1.9), with an exposure-response gradient observed across quintiles of exposure. Based on these latter results, the evidence is considered slight; however, there is considerable uncertainty due to inconsistency and lack of association in high confidence studies and lack of additional studies on ADHD diagnosis.
Table 14.
Associations between DEHP metabolites and behavior.
| Reference; study confidence; N | Age at outcome measure | Median maternal exposures | Exposure IQR (or as specified) | Internalizing problems overall β (95% CI) | Externalizing problems overall β (95% CI) | Internalizing problems in boys β (95% CI) | Internalizing problems in girl β (95% CI) | Externalizing problems in boys β (95% CI) | Externalizing problems in girl β (95% CI) |
|---|---|---|---|---|---|---|---|---|---|
| Exposure measured during gestation | |||||||||
| Kobrosly et al. (2014); medium; 153 | 6–10 yr | 12 ng/mL (MEOHP), 13 (MEHHP)(GM) | 5‒22, 6‒24 | −0.02 (−0.2,0.1) | −0.04 (−0.2,0.1) | −0.1 (−0.1,0.3) | −0.1 (−0.3,0.1) | 0 (−0.2,0.2) | −0.1 (−0.3,0.1) |
| Gascon et al. (2015); high; 362 | 7 yr | 100 μg/g | 68‒146 | Emotional symptoms RR 1.0 (0.8,1.1) | Conduct problems RR 1.0 (0.8,1.1) | NR | NR | NR | NR |
| Whyatt et aL (2012); medium; 297 | 3 yr | 19 ng/mL (MEOHP), 40 (MEHHP)(GM) | 0.7‒1,320, 3‒1,840 (ranges) | 0.1 (−0.8, 1.0) | “No association” | 02 (−1.2,1.6) | 0.1 (−1.0,1.3) | NR | NR |
| Lien et al. (2015); medium; 122 | 8 yr | 39 μg/g | 1.8 (−0.4, 3.9) | 4.38 (2.07, 6.69)* | 1.3 (−1.5,4.1) | 0.7 (−2.9,4.4) | 3.7 (0.1,7.4)* | 3.7 (0.4,7.0)* | |
| Phillippat et al. (2017); medium; 546 | 3 yr | 0.3 μM/L | 0.2–0.4 (33rd-66th) | NR | NR | IRR 1.0 (1.0,1.1) | NR | IRR 1.0 (1.0,1.0) | NA |
| 5 yr | 1.0 (1.0,1.1) | 1.0 (1.0,1.1) | |||||||
| Engel et al. (2010); medium; 188 | 4–9 yr | 0.4 μM/L | 02‒0.9 | “No association” | “No association” | NR | NR | NR | NR |
| Exposure measured preconception | |||||||||
| Messerlian et al. (2017); high; 166 | 2–9 yr | Preconception Maternal 63 ng/mL | 32–99 | −2.0 (−32,−0.8)* | 0.3 (−1.0,1.7) | −5.0 (−9.3,−0.6)* | −2.2 (−3.7,−0.8)* | −0.7 (−2.8,1.3) | 02 (−1.1,1.5) |
| Paternal 93 ng/mL | 49–177 | −1.8 (−3.1,−0.4). | −0.4 (−1.7,0.8) | −3.1 (−5.9,−0.4)* | −1.6 (−3.1,−0.03)* | 0.2 (−1.5,1.8) | −0.5 (−1.7,0.6) | ||
| Attention-deficient hyperactivity disorder (ADHD), exposure measured during gestation | |||||||||
| Engel et al. (2018); medium; 802 | n/a | 0.2 μM/L | 0.2–0.3 | OR 1.5 (1.1,1.9) | OR 1.4 (1.0,2.0) | OR 1.6 (1.0,2.6) | |||
One low confidence study (Kim et al., 2018) not shown in table because results were incompletely reported.
All studies used 1n-transformed exposure and βs represent 1 ln-unit increase, except for Gascon et al. (2015), which used log2-transformation and β represent doubling of exposure and Philippat et al. (2017) which calculated incidence rate ratios (IRR) for a 1 unit change in test scores for a doubling of exposure. Results that support an adverse association are shaded. This represents one or more of the following: p < 0.05, β ≥ 0.5, OR ≥ 0.5, or exposure-response trend across categories of exposure. NR = not reported, GM = geometric mean.
p < 0.05.
Upon request, author provided re-calculated results with 1n-transformed exposure and 13 representing a ln-unit increase, to improve comparability with other studies.
One study examined DINP exposure and behavior in boys (Philippat et al., 2017), and reported no association, and the study of ADHD (Engel et al., 2018) reported no higher odds of ADHD with higher exposure. This evidence is considered indeterminate.
Nine studies examined the association between exposure to DBP and behavior (Table 15). Three studies (Whyatt et al., 2012, Lien et al., 2015, Philippat et al., 2017) reported an association between higher exposure and more frequent internalizing problems, with statistical significance reported in Whyatt et al. (2012) and Philippat et al. (2017). Two studies (Engel et al., 2010, Lien et al., 2015) reported statistically significant results for externalizing problems. The other studies reported no association or, in the study examining preconception exposure, an inverse association (Messerlian et al., 2017). The medium confidence study of ADHD diagnosis also reported no association (Engel et al., 2018). Overall, given the lack of consistency and the lack of positive association in the high confidence study (Gascon et al., 2015), the evidence is considered slight.
Table 15.
Associations between DBP exposure (measured by MBP) and behavior.
| Reference; study confidence; N | Age at outcome measure | Median maternal exposures | Exposure IQR (or as specified) | Internalizing problems overall β (95% CI) | Externalizing problems overall β (95% CI) | Internalizing problems in boys β (95% CI) | Internalizing problems in girl β (95% CI) | Externalizing problems in boys β (95% CI) | Externalizing problems in girl β (95% CI) |
|---|---|---|---|---|---|---|---|---|---|
| Exposure measured during gestation | |||||||||
| Kobrosly et aL (2014); medium; 153 | 6‒10 yr | 14 ng/mL (GM) | 8‒29 | −0.1 (−0.3,0.2) | 0.1 (−0.2,0.3) | −0.01 (−0.3,0.3) | −0.2 (−0.50.1) | 0.2 (−0.1,0.5) | −0.02 (−0.3,0.3) |
| Gascon et al. (2015); high; 362 | 7 yr | 31 μg/g | 20‒49 | Emotional symptoms RR 0.9 (0.8,1.1) | Conduct problems RR 0.9 (0.8,1.0) | NR | NR | NR | NR |
| Whyatt et al. (2012); medium; 297 | 3 yr | 38.0 ng/mL (GM) | 0.2‒785 | 1.5 (0.4, 2.5)* | “No association” | 2.2 (0.7,3.8)* | 1.3 (−0.2,2.7) | NR | NR |
| Philippat et al. (2017); medium; 546 | 3 yr | 44 ng/mL | 33–57 (33rd-66th) | NR | NR | IRR 1.1 (1.0,1.1)* | NR | IRR 1.0 (1.0,1.0) | NR |
| 5 yr | 1.0 (1.0,1.1) | 1.0 (1.0,1.1) | |||||||
| Lien et al. (2015); medium; 122 | 8 yr | 109 μg/g (mean) | 2.2 (−1.2, 5.5) | 4.3 (0.6, 8)* | 0.1 (−5.1,5.3) | 3.0 (−1.8,7.8) | −2.5 (−9.5,4.5) | 7.6 (3.5,11.8)* | |
| Engel et al. (2010); medium; 188 | 4‒9 yr | 0.2 μM/L (from Engel et al., 2009) | 0.1‒0.3 | 0.7 | 1.4* | NR | NR | NR | NR |
| Exposure measured preconception | |||||||||
| Messerlian et al. (2017); high; 166 | 2–9 yr | Preconception Maternal 12 ng/mL | 7–17 | −0.4 (−2.1,1.2) | 0.5 (−1.0,2.0) | 0.9 (−1.3, 3.1) | −0.8 (−2.4, 0.9) | 0.7 (−1.3,2.7) | 0.5 (−1.0,2.0) |
| Paternal 12 ng/mL | 8–19 | −0.9 (−2.9,1.1) | −1.2 (−2.5,0.1 | 2.1 (−1.3,5.4) | −4.5 (−8.0,−1.01* | −1.4 (−2.8,0.0)* | −1.0 (−2.6,0.6) | ||
| Attention-deficient hyperactivity disorder (ADHD), exposure measured during gestation | |||||||||
| Engel et al. (2018); medium; 802 | n/a | 17 ng/mL | 11–31 | OR 1.0 (0.8,1.4) | OR 1.0 (0.7,1.3) | OR 1.3 (0.8,2.2) | |||
One low confidence study (Kim et al., 2018) not shown in table because results were incompletely reported.
All studies used ln-transformed exposure and βs represent 1 ln-unit increase, except for Gascon et al. (2015), which used log2-transformation and β represent doubling of exposure and Philippat et al. (2017) which calculated incidence rate ratios (IRR) for a 1 unit change in test scores for a doubling of exposure. Results that support an adverse association are shaded. This represents one or more of the following: p < 0.05, β ≥ 0.5, or exposure-response trend across categories of exposure. NR = not reported; GM = geometric mean.
p < 0.05.
Upon request, author provided re-calculated results with ln-transformed exposure and β representing a ln-unit increase, to improve comparability with other studies.
Evaluation of the association between exposure to DIBP and behavior is based on eight studies (Table 16). One study reported an association between higher exposure to DIBP and increased internalizing problems (Whyatt et al., 2012). There were also sex-specific associations for internalizing problems in boys in two studies (Whyatt et al., 2012, Messerlian et al., 2017) and for externalizing problems in boys in one study (Kobrosly et al., 2014). The remaining studies reported no association or, in the study examining preconception exposure, an inverse association (Messerlian et al., 2017), but two of the studies did not report sex-specific associations, so the ability to assess consistency for these effects was limited. The medium confidence study of ADHD diagnosis also reported no association (Engel et al., 2018). This evidence is considered indeterminate.
Table 16.
Associations between DIBP exposure (measured by MIBP) and behavior.
| Reference; study confidence, N | Age at outcome measure | Median maternal exposure | Exposure IQR (or as specified) | Internalizing problems overall β (95% CI) | Externalizing problems overall β (95% CI) | Internalizing problems boys β (95% CI) | Internalizing problems girls β (95% CI) | Externalizing problems boys β (95% CI) | Externalizing problems girls β (95% CI) |
|---|---|---|---|---|---|---|---|---|---|
| Exposure measured during gestation | |||||||||
| Kobrosly et al. (2014); medium; 153 | 6–10 yr | 2 ng/mL (GM) | 1–5 | 0.02 (−0.2,0.3) | 0.2 (−0.02,0.4) | 0.1 (−0.2,0.4) | −0.1 (−0.4,0.2) | 0.3 (0,1,0.6)* | 0.1 (−0.2,0.3) |
| Gascon et al. (2015); high; 362 | 7 yr | 32 µg/g | 22–48 | Emotional symptoms RR 1.0 (0.9,1.2) | Conduct problems RR 1.1 (0.9,1.2) | NR | NR | NR | NR |
| Whyatt et al. (2012); medium; 297 | 3 yr | 9 ng/mL (GM) | <LOD-374 (range) | 1.0 (0, 1.9) | “No association” | 1.2 (−0.2,2.6) | 1.2 (−0.2,2.6) | NR | NR |
| Engel et al. (2010); medium; 188 | 4–9 yr | 0.03 µM/L (from Engel et al., 2009) | 0.01–0.05 | 0.5 | 0.3 | NR | NR | NR | NR |
| Philippat et al. (2017); medium; 546 | 3 yr | 40 ng/mL | 29–57 (33rd-66th) | NR | NR | IRR 1.0 (1.0,1.1) | NR | IRR 1.0 (0.9,1.0) | NR |
| 5 yr | 1.0 (0.9,1.1) | 1.0 (0.9,1.0) | |||||||
| Exposure measured preconception | |||||||||
| Messerlian et al. (2017); high; 166 | 2–9 yr | Preconception Maternal 6 ng/mL | 4–10 | −0.3 (−1.9,1.4) | 1.1 (−0.3,2.5) | 0.8 (−1.1,2.6) | −0.7 (−2.4,0.9) | 2.1 (0.5,3.8) | 0.7 (−0.7,2.0) |
| Paternal 6 ng/mL | 5–11 | −0.9 (−3.1,1.4) | −0.4 (−1.8,1.0) | 2.1 (−0.5,4.8) | −2.4 (−5.2,0.4) | −0.4 (−2.4,1.6) | −0.5 (−1.9,1.0) | ||
| Attention-deficient hyperactivity disorder (ADHD), exposure measured during gestation | |||||||||
| Engel et al. (2018); medium; 802 | n/a | 17 ng/mL | 10–31 | OR 0.9 (0.7,1.2) | OR 1.0 (0.7,1.3) | OR 0.9 (0.5,13) | |||
One low confidence study (Kim et al., 2018) not shown in table because results were incompletely reported.
All studies used ln-transformed exposure and βs represent 1 ln-unit increase, except for Gascon et al. (2015), which used log2-transformation and β represent doubling of exposure and Philippat et al. (2017) which calculated incidence rate ratios (IRR) for a 1 unit change in test scores for a doubling of exposure.. Results that support an adverse association are shaded. This represents one or more of the following: p < 0.05, β ≥ 0.5, OR ≥ 0.5, or exposure-response trend across categories of exposure. NR = not reported; GM = geometric mean.
p < 0.05.
Upon request, author provided re-calculated results with ln-transformed exposure and β representing a ln-unit increase, to improve comparability with other studies.
Evaluation of the association between exposure to BBP and behavior is based on seven studies (Table 17). Three studies reported positive associations between higher exposure to BBP and internalizing problems (Whyatt et al., 2012, Gascon et al., 2015, Philippat et al., 2017), and two were statistically significant, though only in 3 year olds for Philippat et al. (2017). One study (Lien et al., 2015) reported a positive association with externalizing problems in girls only, and two studies (Whyatt et al., 2012, Messerlian et al., 2017) reported a positive association with externalizing problems in boys only. One study (Lien et al., 2015) reported a strong inverse association, and the remaining study reported no association (Kobrosly et al., 2014). The single study of ADHD diagnosis (Engel et al., 2018) reported non-significantly higher odds of ADHD with higher exposure (OR: 1.2, 95% CI 0.9, 1.6). Given the lack of consistency within the specific behavior domains and sexes, this evidence is considered slight.
Table 17.
Associations between BBP exposure (measured by MBzP) and behavior.
| Reference; study confidence, N | Age at outcome measure | Median maternal exposure | Exposure IQR (or as specified) | Internalizing problems overall β (95% CI) | Externalizing problems overall β (95% CI) | Internalizing problems boys β (95% CI) | Internalizing problems girls β (95% CI) | Externalizing problems boys β (95% CI) | Externalizing problems girls β (95% CI) |
|---|---|---|---|---|---|---|---|---|---|
| Exposure measured during gestation | |||||||||
| Kobrosly et al. (2014); medium; 153 | 6–10 yr | 7 ng/mL (GM) | 3–163 | 0.1 (−0.3,0.1) | 0.1 (−0.1,0.2) | −0.04 (−0.3,0.2) | −0.2 (−0.4,0)* | 0.2 (−0.03,0.4) | −0.04 (−0.3,0.2) |
| Gascon et al. (2015); high; 362 | 7 yr | 12 µg/g | 7–20 | Emotional symptoms RR 1.1 (1.0,1.2) | Conduct problems RR 1.0 (0.9,1.2) | NR | NR | NR | NR |
| Philippat et al. (2017); medium; 546 | 3 yr | 18 ng/mL | 13–27 (33rd-66th) | NR | NR | IRR 1.0 (1.0,1.1)* | NR | IRR 1.0 (1.0,1.0) | NR |
| 5 yr | 1.0 (1.0,1.1) | 1.0 (1.0,1.0) | |||||||
| Whyatt et al. (2012); medium; 297 | 3 yr | 19 ng/mL (GM) | <LOD-1,110 (range) | 0.8 (0.1,1.6)* | “No association” | 1.8 (0.9,2.7)* | 03 (−0.8,1.4) | NR | NR |
| Lien et al. (2015); medium; 122 | 8 yr | 20 µg/g (mean) | −2.9 (−7.4,1.6) | −1.1 (−6.2,3.9) | −2.7 (−8.2,2.9) | −2.8 (−10.3,4.8) | −4.2 (−11.8,3.3) | 2.0 (−5.2,9.2) | |
| Exposure measured preconception | |||||||||
| Messerlian et al. (2017); high; 166 | 2–9 yr | Preconception Maternal 3 ng/mL | 2–6 | 0.2 (−1.3,1.7) | 0.4 (−1.1,1.8) | −1.4 (−6.0,3.1) | −0.1 (−1.9,1.7) | 0.4 (−1.7,2.4) | 0.4 (−1.1,1.8) |
| Paternal 4 ng/mL | 2–6 | 0.5 (−1.5,2.5) | −0.4 (−1.7,1.0) | 1.8 (−0.8,4.4) | −0.6 (−3.0,1.9) | −0.9 (−2.5,0.7) | −0.2 (−1.6,1.3) | ||
| Attention-deficient hyperactivity disorder (ADHD), exposure measured during gestation | |||||||||
| Engel et al. (2018); medium; 802 | n/a | 4 ng/mL | 3–8 | OR 1.2 (0.9,1.6) | OR 1.2 (0.9,1.6) | OR .1.2 (0.8,1.8) | |||
All studies used ln-transformed exposure and βs represent 1 ln-unit increase, except for Gascon et al. (2015), which used log2-transformation and β represent doubling of exposure and Philippat et al. (2017) which calculated incidence rate ratios (IRR) for a 1 unit change in test scores for a doubling of exposure. Results that support an adverse association are shaded. This represents one or more of the following: p < 0.05, β ≥ 0.5, OR ≥ 0.5, or exposure-response trend across categories of exposure. NR = not reported; GM = geometric mean.
p < 0.05.
Upon request, author provided re-calculated results with ln-transformed exposure and β representing a ln-unit increase, to improve comparability with other studies.
Eight studies reported on the association between DEP and behavior (Table 18). One study reported a statistically significant association between higher exposure to DEP and increased externalizing problems (Engel et al., 2010). The remaining studies reported no association or inverse associations (Messerlian et al., 2017, Lien et al., 2015), with Messerlian et al. (2017) examining preconception exposure. The medium confidence study of ADHD diagnosis also reported no association (Engel et al., 2018). This evidence is considered indeterminate.
Table 18.
Associations between DEP exposure (measured by MEP) and behavior.
| Reference; study confidence, N | Age at outcome measure | Median maternal exposure | Exposure IQR (or as specified) | Internalizing problems overall β (95% CI) | Externalizing problems overall β (95% CI) | Internalizing problems boys β (95% CI) | Internalizing problems girls β (95% CI) | Externalizing problems boys β (95% CI) | Externalizing problems girls β (95% CI) |
|---|---|---|---|---|---|---|---|---|---|
| Exposure measured during gastation | |||||||||
| Kobrosly et al. (2014); medium; 153 | 6–10 yr | 81 ng/mL (GM) | 26–231 | −0.1 (−0.2, 0.1) | −0.03 (−0.2,0.1) | −0.02 (−0.2,0.1) | −0.1 (−0.3,0.1) | −0.02 (−0.2,0.1) | −0.1 (−0.2,0.1) |
| Philippat et al. (2017); medium; 546 | 3 yr | 97 ng/mL | 65–154 | NR | NR | IRR 1.0 (1.0,1.0) | NR | IRR 1.0 (1.0,1.0) | NR |
| 5 yr | 1.0 (1.0,1.0) | 1.0 (1.0,1.1) | |||||||
| Lien et al. (2015); medium; 122 | 8 yr | 100 µg/g (mean) | −1.8 (−5.5, 2.0) | −0.5 (−4.6, 3.7) | −0.2 (−5.2,4.8) | −3.0 (−8.6,2.7) | −1.6 (−8.4,5.2) | 0.1 (−5.4,5.5) | |
| Gascon et al. (2015); high; 362 | 7 yr | 403 µg/g | 199–756 | Emotional symptoms RR 1.0 (0.9,1.1) | Conduct problems RR 1.0 (0.9,1.1) | NR | NR | NR | NR |
| Engel et al. (2010); medium; 188 | 4–9 yr | 2 µM/L (from Engel et al., 2009) | 0.8–5 | 0.8 | 1.3* | NR | NR | NR | NR |
| Exposure measured preconception | |||||||||
| Messerlian et al. (2017); high; 166 | 2–9 yr | Preconception Maternal 46 ng/mL | 27–126 | −0.6 (−1.9,0.6) | 0.3 (−0.8,1.4) | −2.9 (−4.7, −1.2)* | −0.6 (−2.0,0.8) | 0.1 (−1.3,1.5) | 0.3 (−0.8,1.4) |
| Paternal 53 ng/mL | 30–125 | 0.4 (−1.0,1.8) | −0.2 (−1.3,0.9) | 0.5 (−5.2,6.2) | 0.3 (−1.1,1.7) | −0.7 (−2.3,1.0) | −0.3 (−1.5,0.8) | ||
| Attention-deficient hyperactivity disorder (ADHD), exposure measured during gestation | |||||||||
| Engel et al. (2018); medium; 802 | n/a | 99 ng/mL | 32–297 | OR 1.0 (0.9,1.2) | OR 1.0 (0.9,1.2) | OR .1.1 (0.9,1.4) | |||
One low confidence study (Kim et al., 2018) not shown in table because results were incompletely reported.
All studies used ln-transformed exposure and βs represent 1 ln-unit increase, except for Gascon et al. (2015), which used log2-transformation and β represent doubling of exposure and Philippat et al. (2017) which calculated incidence rate ratios (IRR) for a 1 unit change in test scores for a doubling of exposure.. Results that support an adverse association are shaded. This represents one or more of the following: p < 0.05, β ≥ 0.5, OR ≥ 0.5, or exposure-response trend across categories of exposure. NR = not reported; GM = geometric mean.
p < 0.05.
Upon request, author provided re-calculated results with ln-transformed exposure and β representing a ln-unit increase, to improve comparability with other studies.
The evidence of behavioral effects of phthalate exposure is largely null. Few studies reported associations between higher exposure and more frequent internalizing or externalizing behaviors. No clear patterns for the observed associations were identified. Across the phthalates, there was some indication that studies using the Child Behavior Checklist (Whyatt et al., 2012, Kobrosly et al., 2014, Lien et al., 2015) were more likely to observe an inverse association, but the data were too sparse to evaluate this thoroughly. There were notable associations with some phthalates observed in the single study of ADHD (Engel et al., 2018), but the lack of additional evidence makes interpretation of these findings difficult.
3.6. Infant neurobehavior
Three studies reported on the association between any phthalate exposure and infant neurobehavior (Table 19). Because of the small number of available studies, the low confidence study is included in the table. There was little consistency in the reported associations across studies, and this evidence is considered indeterminate for all phthalates, with the exception of DBP, which is considered slight due to statistically significant, though small, associations in multiple domains of neurobehavior in a high confidence study.
Table 19.
Associations between phthalate exposure and infant neurobehavior.
| Reference | Age at outcome measure | Exposure | Median maternal exposure | Exposure IQR (or as specified) | Arousal/Range of state β (SE) or β (95% CI) | Movement/Motor β (SE) or β (95% CI) | Regulation of stste β (SE) or β (95% CI) | Nonoptimal Reflexes β (SE) or β (95% CI) |
|---|---|---|---|---|---|---|---|---|
| DEHP | ||||||||
| Yolton et al. (2011); high; 332 | 5 wk | Log2-trans ΣDEHP | 245 ng/mL (GM) | 0.03 (0.03) | −0.002 (0.03) | 0.03 (0.02) | 0.1 (0.1)* | |
| Engel et al. (2009); medium; 274 | Newborns | Log-trans high MWP | 0.5 µM/L | 0.2–0.9 | 0.1 (−0.04, 0.2) | 0.02 (−0.1, 0.1) | −0.1 (−0.2, 0.1) | −0.1 |
| Strousstrup et al. (2018); low; 64 | Discharge at 33–37 wk PMA | ΣDEHP postnatal | 12 ng/mL (MEOHP) | 6–25 (MEOHP) | 0.03 (−0.1,0.1) | 0.1 (0,0.2) | −0.2 (−0.4,0.1) | |
| DBP | ||||||||
| Yolton et al. (2011); high; 332 | 5 wk | Log2-trans MBP | 20 ng/mL (GM) | −0.1 (0.04)* | 0.1 (0.03)* | 0.1 (0.04)* | −0.1 (0.1) | |
| Low MWP | ||||||||
| Engel et al. (2009); medium; 274 | Newborns | Log-trans low MWP | 2 µM/L | 1.0–5.7 | 0.01 (−0.1,0.1) | 0.1 (−0.01,0.1) | 0.04 (−0.1,0.2) | 0.04 |
All studies used ln-transformed exposure and βs represent 1 ln-unit increase, except for Gascon, which used log2-transformation and β represent doubling of exposure. Results that support an adverse association are shaded. This represents one or more of the following: p < 0.05, β ≥ 0.5, OR ≥ 0.5, or exposure-response trend across categories of exposure. NR = not reported. PMA = post menstrual age. MWP = molecular weight phthalates. GM = geometric mean. (See above-mentioned references for further information.)
p < 0.05.
Upon request, author provided re-calculated results with 1n-transformed exposure and 13 representing a ln-unit increase, to improve comparability with other studies.
3.7. Social behaviors
Four studies, two high (Braun et al. 2014, Shin et al. 2018), one medium (Miodovnik et al. 2011), and one low confidence study (Kim et al., 2018) examined the association between phthalate exposure and autism/social impairment, with most looking at continuous social behaviors and one (Shin et al., 2018) looking at autism spectrum disorder (ASD) as a dichotomous outcome.
For DEHP, both higher confidence studies of social behaviors reported increased autistic behaviors with increasing DEHP exposure (MEHHP β = 1.1 (95% CI −0.8, 3.0) in Braun et al. (2014); ΣDEHP β = 0.8 (95% CI −0.7, 2.4) in Miodovnik et al. (2011), although neither was statistically significant. The high confidence study of ASD (Shin et al., 2018) reported no increased risk of ASD with higher exposure to DEHP (RR = 0.75, 95% CI 0.4, 2.3), though there was an increase in relative risk in a group classified as non-typically developing (RR = 1.4, 95% CI 0.9, 2.1). This group was a heterogenous group, representing children who had either low cognitive ability scores and/or high autism trait scores without reaching the cutoff for the ASD group, and thus the results are difficult to interpret. Overall, this evidence is considered slight.
For the remaining phthalates, the results reported by Braun et al. (2014) do not support an association between exposure and autistic behaviors (MIBP β = 0.3 [95% CI −1.5, 2.1]; MBzP β = −0.6 [95% CI −2.7, 1.5]; MBP β = −0.4 [95% CI −2.2, 1.4]; MEP β = −0.5 [95% CI −2.2, 1.3]), while results reported by Miodovnik et al. (2011) do support an association for some phthalates (MBP β = 1.4 [95% CI −0.4, 3.2]; MEP β = 1.4 [95% CI 0.2, 2.5, p < 0.05]; individual results for MBzP and MIBP were not reported). In Shin et al. (2018), only DEP had increased risk of ASD with higher exposure (RR = 1.2, 95% CI 0.8, 1.9 for ASD, RR = 1.4, 95% CI 1.0, 1.9 for non-typical development). Given the lack of consistency between the available studies, the evidence is considered slight for DBP and DEP and indeterminate for DIBP, BBP, and DINP.
4. Discussion
Based on systematic examination of the epidemiological studies of prenatal phthalate exposures and neurodevelopment, there is generally not a clear pattern of associations. Most of the phthalate-outcome pairs have only slight or indeterminate evidence of an association (Fig. 5), with only motor effects of BBP in girls having moderate evidence. This is despite the availability of several medium and high confidence studies examining these associations. There are several possible reasons for the observed null associations, particularly related to reduced sensitivity resulting from exposure misclassification in studies using single phthalate measures and periods of heightened susceptibility, and the effects of phthalate mixtures. These are each discussed further below and until these limitations are adequately addressed in the literature, these findings should not be interpreted as evidence that there are no neurodevelopmental effects of phthalate exposure.
Fig. 5.
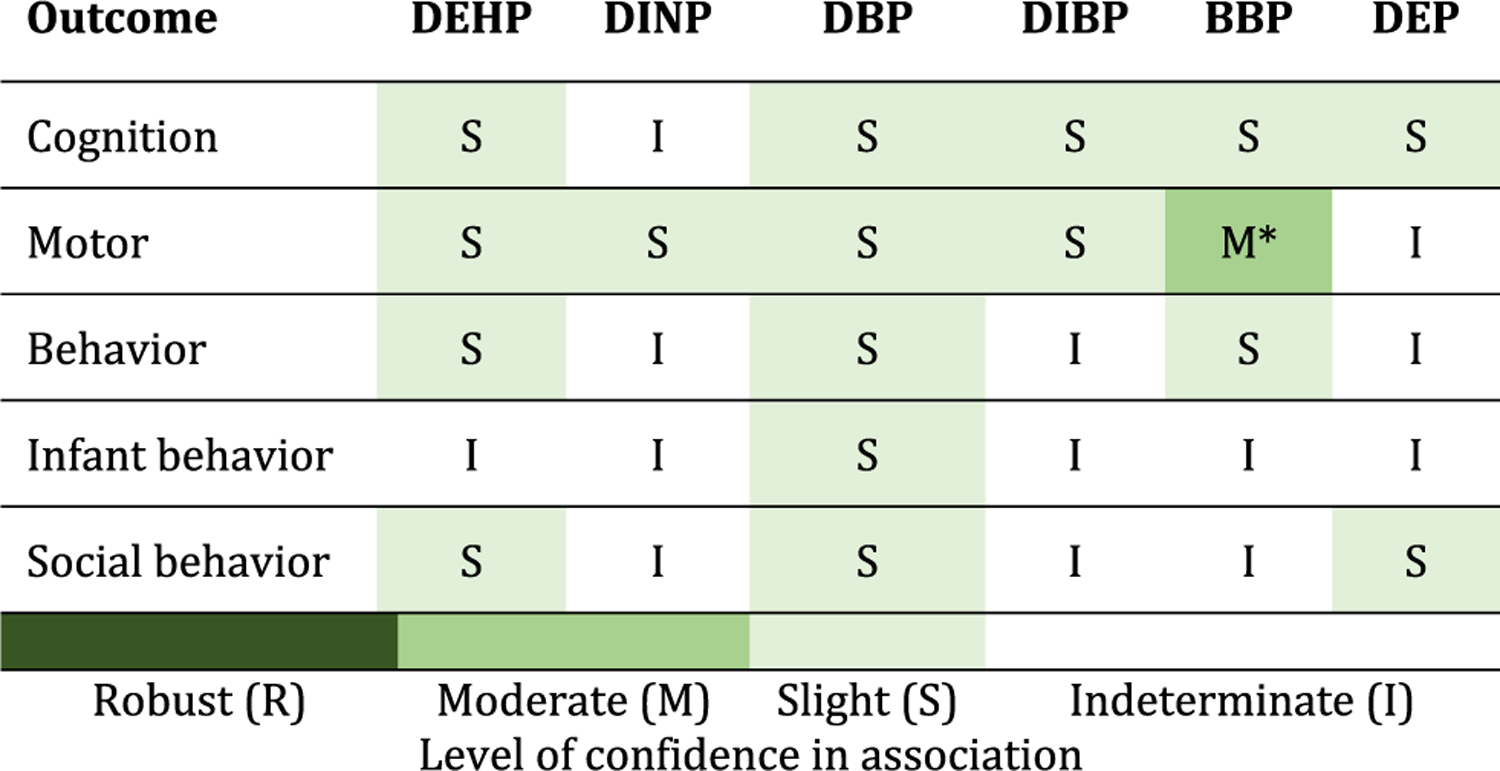
Summary of epidemiologic evidence of neurodevelopmental effects associated with phthalates. *In girls.
The potential for non-differential exposure misclassification to bias the estimates towards the null is one possible reason for the observed heterogeneity in these study’s findings (Perrier et al. 2016). When examining the association between continuous health outcomes and chemicals with substantial temporal within-person variation (e.g., DEHP), effect estimates derived from a study with a single urine sample can be attenuated by 80% and as many as 35 repeated urine samples from a single individual are needed to reduce this attenuation to < 10%. One way to address the issues related to phthalate exposure misclassification is to pool each individual’s multiple urine samples, as recommended by Perrier et al. and practiced by others (Perrier et al., 2016), but the majority of available studies rely on a single urine sample.
Studies examining the health effects of prenatal thalidomide and DES show that there are unique periods of susceptibility during development when exposure can cause adverse health effects (Kim and Scialli, 2011, Swan, 2000, Hoover et al. 2011). Thus, there may also be periods of heightened susceptibility to phthalate exposures, as suggested by one study examining the association between neurodevelopmental outcomes and repeated measures of urinary phthalate concentrations during both pregnancy and childhood (Li et al., 2019). If there are discrete periods of susceptibility to phthalate exposures, then the available studies may be unable to adequately assess these associations given that urine samples were collected at various times during development and neurodevelopmental processes during some of these periods of life may not be sensitive to phthalate exposures. One way to address this is to implement new studies with repeated phthalate exposure measures during multiple potentially susceptible periods of life.
Phthalate exposures do not occur in isolation, and individuals are chronically exposed to multiple phthalates on a daily basis across their lifespan. The presented epidemiological studies have examined phthalate exposures using an approach of “one chemical at a time” and one exposure period at a time where they are treated as if they occur in isolation from each other. Thus, these studies have not accurately considered the nature of human exposure to these phthalate “mixtures” or the potential for phthalates to have cumulative effects on human health. Indeed, studies in rodents show that phthalate mixtures can have additive effects on fetal testosterone production (Howdeshell et al., 2008). Future studies will need to employ newly developed statistical tools to quantify the potential neurodevelopmental effects of phthalate mixtures (Braun et al., 2016, Lazarevic et al., 2019).
The studies considered informative in this review were primarily birth cohorts with exposure measurement during gestation (Table 2). Several cross-sectional studies were excluded due to concerns about temporality. Because phthalates do not persist in the body and exposure measures have poor repeatability over time, current exposure was not considered an adequate measure of exposure for an etiologically relevant time period. Including these studies may have influenced the conclusions, particularly for social behaviors, but we felt it was most useful to focus on the highest confidence studies. However, there is potential that recent exposure to phthalates could be associated some neuropsychological outcomes such as cognition, including via a mechanism with thyroid function, and this review was not able to assess this possibility.
We did not undertake this review with an a priori expectation of sex-dependent associations. Some studies did report differences in strength and direction of associations for boys and girls. These were generally not consistent across studies, although there was some indication of greater effects for MDI in girls. Many of the studies either did not report or were not adequately powered to assess sex-dependent associations. Future studies should consider this issue and ensure that they are powered to assess a possible interaction with sex.
As mentioned in the introduction, past reviews have presented plausible mechanisms for the association between EDCs and neurodevelopmental effects. In rats, prenatal, pre-adolescent, and adult DEHP exposures cause alterations in learning and hyperactivity that are accompanied by decreased tyrosine hydroxylase neurons, lower brain derived neurotrophic factor levels, and suppression of neuronal excitability and synaptic plasticity in the hippocampus (Holahan et al., 2018) (Li et al., 2018) (Ran et al., 2019). Male rats exposed to DEHP from birth to adulthood had decreased γ-amino butyric acid (GABA) levels in their brain and increased anxiety behaviors that were reversed by the administration of GABA agonists (Carbone et al., 2018). DEHP exposure during puberty caused increased anxiety and reduced social behaviors in female mice (Wang et al., 2016). This was accompanied by decreases in estrogen and dopamine receptors in the striatum. Some phthalates are anti-androgenic and reduce testosterone levels by decreasing steroidogenesis and steroid trafficking gene expression (Hannas et al., 2011, Howdeshell et al., 2008). Gonadal hormones are critical for sex-specific neurodevelopment and also play an important role in adolescent brain remodeling (Cohen-Bendahan et al., 2005, Dahl et al., 2018). Some phthalates antagonize triiodothyroinine (T3) binding to thyroid receptor-β (Ghisari and Bonefeld-Jorgensen, 2009), reduce cellular T3 uptake (Shimada and Yamauchi, 2004), and affect transcription of the sodium-iodine transporter (Breous et al., 2005). Alterations in prenatal thyroid hormones has been associated with reduced cognition and brain volume (Korevaar et al., 2016).
There are other important limitations to note. There is potential for co-pollutant confounding by other phthalates due to the high correlations across some of the phthalates, and it is difficult to rule this out for estimates of effects of individual phthalates given the available evidence. This issue is related to the “one chemical at a time” issue described above and is discussed in more detail in a forthcoming editorial as an area of uncertainty for reviews of phthalates and other chemical mixtures. However, it is unlikely that it would significantly alter the conclusions of the review due to the amount of uncertainty already present in this evidence. In addition, for most outcomes, we reviewed only the summary measures of the testing instruments because they were the most consistently reported across studies and because of the plethora of data available on clinical subscales. It is possible that stronger conclusions could be reached in looking at a specific subscale or diagnosis, where there may be greater precision around the outcome. There is some support for this in the single study on ADHD diagnosis (Engel et al., 2018), which had a more narrowly defined clinical disorder and found stronger associations than many of the studies of behavior with summary measures of externalizing behavior. This is an important area for future research.
Overall, this detailed systematic review suggests that there is limited evidence that phthalates adversely affect the examined neurodevelopmental domains. However, there are considerable limitations in the existing literature related to exposure misclassification, periods of heightened susceptibility, sex-specific effects, and phthalate mixture effects. Future studies should consider examining additional endpoints, like clinical diagnosis with neurodevelopmental disorders with longitudinal design and repeated exposure measurement. Studies addressing these limitations may provide more compelling evidence of an effect of phthalate exposures on neurodevelopment.
Supplementary Material
Acknowledgements
We would like to thank Carolyn Gigot, Cheng-Kuan Lin, Sharon Sagiv, Cheryl Stein, Leonid Kopylev, Laura Dishaw, Amanda Persad, Kris Thayer, Sue Rieth, and Barbara Glenn for their contributions to this work.
Footnotes
Appendix A. Supplementary material
Supplementary data to this article can be found online at https://doi.org/10.1016/j.envint.2019.105408.
References
- Arbuckle TE, Davis K, Boylan K, Fisher M, Fu J, Processed data for chms 2007–2009: Bisphenol a, phthalates and lead and learning and behavioral problems in canadian children 6–19 years of age, 8 (2016) 784–802. [DOI] [PMC free article] [PubMed] [Google Scholar]
- Arbuckle TE, Davis K, Boylan K, Fisher M, Fu J, 2016b. Bisphenol a, phthalates and lead and learning and behavioral problems in canadian children 6–11 years of age: Chms 2007–2009. Neurotoxicology 54, 89–98. [DOI] [PubMed] [Google Scholar]
- Balalian AA, Whyatt RM, Liu X, Insel BJ, Rauh VA, Herbstman J, et al. , 2019. Prenatal and childhood exposure to phthalates and motor skills at age 11 years. Environ. Res 171, 416–427. [DOI] [PMC free article] [PubMed] [Google Scholar]
- Benjamin S, Masai E, Kamimura N, Takahashi K, Anderson RC, Faisal PA, 2017. Phthalates impact human health: Epidemiological evidences and plausible mechanism of action. J. Hazard Mater 340, 360–383. 10.1016/j.jhazmat.2017.06.036. Epub2017 Jun 19. [DOI] [PubMed] [Google Scholar]
- Braun JM, Kalkbrenner AE, Just AC, Yolton K, Calafat AM, Sjödin A, et al. , 2014. Gestational exposure to endocrine-disrupting chemicals and reciprocal social, repetitive, and stereotypic behaviors in 4- and 5-year-old children: The home study. Environ. Health. Perspect 122, 513–520. [DOI] [PMC free article] [PubMed] [Google Scholar]
- Braun JM, Gennings C, Hauser R, Webster TF, 2016. What can epidemiological studies tell us about the impact of chemical mixtures on human health? Environ. Health. Perspect 124, A6–A9. [DOI] [PMC free article] [PubMed] [Google Scholar]
- Braun JM, 2017. Early-life exposure to EDCs: role in childhood obesity and neurodevelopment. Nat. Rev. Endocrinol 13, 161–173. [DOI] [PMC free article] [PubMed] [Google Scholar]
- Breous E, Wenzel A, Loos U, 2005. The promoter of the human sodium/iodide symporter responds to certain phthalate plasticisers. Mol. Cell. Endocrinol 244, 75–78. [DOI] [PubMed] [Google Scholar]
- Carbone S, Ponzo OJ, Gobetto N, Samaniego YA, Reynoso R, Moguilevsky JA, et al. , 2018. Effect of di(2-ethylhexyl) phthalate on the neuroendocrine regulation of reproduction in adult male rats and its relationship to anxiogenic behavior: Participation of gabaergic system. Hum. Exp Toxicol:960327118774868. [DOI] [PubMed]
- Cho SC, Bhang SY, Hong YC, Shin MS, Kim BN, Kim JW, et al. , 2010. Relationship between environmental phthalate exposure and the intelligence of school-age children. Environ. Health. Perspect 118, 1027–1032. [DOI] [PMC free article] [PubMed] [Google Scholar]
- Chopra V, Harley K, Lahiff M, Eskenazi B, 2014. Association between phthalates and attention deficit disorder and learning disability in U.S. Children, 6–15 years. Environ. Res 128, 64–69. [DOI] [PMC free article] [PubMed] [Google Scholar]
- Cohen-Bendahan C, van de Beek C, Berenbaum S, 2005. Prenatal sex hormone effects on child and adult sex-typed behavior: Methods and findings. Neurosci. Biobehav. Rev 29, 353–384. [DOI] [PubMed] [Google Scholar]
- Dahl RE, Allen NB, Wilbrecht L, Suleiman AB, 2018. Importance of investing in adolescence from a developmental science perspective. Nature 554, 441–450. [DOI] [PubMed] [Google Scholar]
- Doherty BT, Engel SM, Buckley JP, Silva MJ, Calafat AM, Wolff MS, 2017. Prenatal phthalate biomarker concentrations and performance on the bayley scales of infant development-ii in a population of young urban children. Environ. Res 152, 51–58. [DOI] [PMC free article] [PubMed] [Google Scholar]
- Ejaredar M, Nyanza EC, Ten Eycke K, Dewey D, 2015. Phthalate exposure and childrens neurodevelopment: A systematic review. Environ. Res 142, 51–60. 10.1016/j.envres.2015.06.014. Epub2015 Jun 20. [DOI] [PubMed] [Google Scholar]
- Engel SM, Zhu C, Berkowitz GS, Calafat AM, Silva MJ, Miodovnik A, et al. , 2009. Prenatal phthalate exposure and performance on the neonatal behavioral assessment scale in a multiethnic birth cohort. Neurotoxicology 30, 522–528. [DOI] [PMC free article] [PubMed] [Google Scholar]
- Engel SM, Miodovnik A, Canfield RL, Zhu C, Silva MJ, Calafat AM, et al. , 2010. Prenatal phthalate exposure is associated with childhood behavior and executive functioning. Environ. Health. Perspect 118, 565–571. [DOI] [PMC free article] [PubMed] [Google Scholar]
- Engel SM, Villanger GD, Nethery RC, Thomsen C, Sakhi AK, Drover SSM, et al. , 2018. Prenatal phthalates, maternal thyroid function, and risk of attention-deficit hyperactivity disorder in the norwegian mother and child cohort. Environ. Health. Perspect 126, 057004. [DOI] [PMC free article] [PubMed] [Google Scholar]
- Factor-Litvak P, Insel B, Calafat AM, Liu X, Perera F, Rauh VA, et al. , 2014. Persistent associations between maternal prenatal exposure to phthalates on child iq at age 7 years. PLoS One 9, e114003. [DOI] [PMC free article] [PubMed] [Google Scholar]
- Gascon M, Valvi D, Forns J, Casas M, Martínez D, Júlvez J, et al. , 2015. Prenatal exposure to phthalates and neuropsychological development during childhood. Int. J. Hyg. Environ. Health 218, 550–558. [DOI] [PubMed] [Google Scholar]
- Ghisari M, Bonefeld-Jorgensen EC, 2009. Effects of plasticizers and their mixtures on estrogen receptor and thyroid hormone functions. Toxicol. Lett 189, 67–77. [DOI] [PubMed] [Google Scholar]
- Hannas BR, Lambright CS, Furr J, Howdeshell KL, Wilson VS, Gray LE, 2011. Dose-response assessment of fetal testosterone production and gene expression levels in rat testes following in utero exposure to diethylhexyl phthalate, diisobutyl phthalate, diisoheptyl phthalate, and diisononyl phthalate. Toxicol. Sci 123, 206–216. [DOI] [PubMed] [Google Scholar]
- Holahan MR, Smith CA, Luu BE, Storey KB, 2018. Preadolescent phthalate (dehp) exposure is associated with elevated locomotor activity and reward-related behavior and a reduced number of tyrosine hydroxylase positive neurons in post-adolescent male and female rats. Toxicol. Sci 165, 512–530. [DOI] [PubMed] [Google Scholar]
- Hoover RN, Hyer M, Pfeiffer RM, Adam E, Bond B, Cheville AL, et al. , 2011. Adverse health outcomes in women exposed in utero to diethylstilbestrol. N. Engl. J. Med 365, 1304–1314. [DOI] [PubMed] [Google Scholar]
- Howdeshell KL, Wilson VS, Furr J, Lambright CR, Rider CV, Blystone CR, et al. , 2008. A mixture of five phthalate esters inhibits fetal testicular testosterone production in the sprague-dawley rat in a cumulative, dose-additive manner. Toxicol. Sci 105, 153–165. [DOI] [PubMed] [Google Scholar]
- Hu D, Wang YX, Chen WJ, Zhang Y, Li HH, Xiong L, et al. , 2017. Associations of phthalates exposure with attention deficits hyperactivity disorder: A case-control study among chinese children. Environ. Pollut 229, 375–385. [DOI] [PubMed] [Google Scholar]
- Huang HB, Chen HY, Su PH, Huang PC, Sun CW, Wang CJ, et al. , 2015. Fetal and childhood exposure to phthalate diesters and cognitive function in children up to 12 years of age: Taiwanese maternal and infant cohort study. PLoS One 10, e0131910. [DOI] [PMC free article] [PubMed] [Google Scholar]
- Johns LE, Cooper GS, Galizia A, Meeker JD, 2015. Exposure assessment issues in epidemiology studies of phthalates. Environ. Int 85, 27–39. [DOI] [PMC free article] [PubMed] [Google Scholar]
- Kardas F, Bayram AK, Demirci E, Akin L, Ozmen S, Kendirci M, et al. , 2015. Increased serum phthalates (mehp, dehp) and bisphenol a concentrations in children with autism spectrum disorder: The role of endocrine disruptors in autism etiopathogenesis. J. Child. Neurol 31, 629–635. [DOI] [PubMed] [Google Scholar]
- Kim BN, Cho SC, Kim Y, Shin MS, Yoo HJ, Kim JW, et al. , 2009. Phthalates exposure and attention-deficit/hyperactivity disorder in school-age children. Biol. Psychiatry 66, 958–963. [DOI] [PubMed] [Google Scholar]
- Kim JH, Scialli AR, 2011. Thalidomide: The tragedy of birth defects and the effective treatment of disease. Toxicol. Sci 122, 1–6. [DOI] [PubMed] [Google Scholar]
- Kim JI, Hong YC, Shin CH, Lee YA, Lim YH, Kim BN, 2017. The effects of maternal and children phthalate exposure on the neurocognitive function of 6-year-old children. Environ. Res 156, 519–525. [DOI] [PubMed] [Google Scholar]
- Kim S, Eom S, Kim HJ, Lee JJ, Choi G, Choi S, et al. , 2018. Association between maternal exposure to major phthalates, heavy metals, and persistent organic pollutants, and the neurodevelopmental performances of their children at 1 to 2years of age- check cohort study. Sci. Total. Environ 624, 377–384. [DOI] [PubMed] [Google Scholar]
- Kim Y, Ha EH, Kim EJ, Park H, Ha M, Kim JH, et al. , 2011. Prenatal exposure to phthalates and infant development at 6 months: prospective mothers and children’s environmental health (moceh) study. Environ. Health. Perspect 119, 1495–1500. [DOI] [PMC free article] [PubMed] [Google Scholar]
- Kobrosly RW, Evans S, Miodovnik A, Barrett ES, Thurston SW, Calafat AM, et al. , 2014. Prenatal phthalate exposures and neurobehavioral development scores in boys and girls at 6–10 years of age. Environ. Health. Perspect 122, 521–528. [DOI] [PMC free article] [PubMed] [Google Scholar]
- Kondolot M, Ozmert EN, Ascı A, Erkekoglu P, Oztop DB, Gumus H, et al. , 2016. Plasma phthalate and bisphenol a levels and oxidant-antioxidant status in autistic children. Environ. Toxicol. Pharmacol 43, 149–158. [DOI] [PubMed] [Google Scholar]
- Korevaar TIM, Muetzel R, Medici M, Chaker L, Jaddoe VWV, de Rijke YB, et al. , 2016. Association of maternal thyroid function during early pregnancy with offspring iq and brain morphology in childhood: A population-based prospective cohort study. Lancet. Diabetes. Endocrinol 4, 35–43. [DOI] [PubMed] [Google Scholar]
- Langonne L, Saillenfait AM, Payan JP, 1998. Comparative embryotoxicity of di-n-butyl phthalate and its main metabolite mono-n-butyl phthalate at midgestations. Teratology 58, 22A. [Google Scholar]
- Larsson M, Weiss B, Janson S, Sundell J, Bornehag CG, 2009. Associations between indoor environmental factors and parental-reported autistic spectrum disorders in children 6–8 years of age. Neurotoxicology 30, 822–831. [DOI] [PMC free article] [PubMed] [Google Scholar]
- Lazarevic N, Barnett AG, Sly PD, Knibbs LD, 2019. Statistical methodology in studies of prenatal exposure to mixtures of endocrine-disrupting chemicals: A review of existing approaches and new alternatives. Environ. Health. Perspect. 127, 26001. [DOI] [PMC free article] [PubMed] [Google Scholar]
- Li L, Li H, Qu P, Xiao M, Zhang G, Zhang Q, et al. , 2018. An antagonism joint action of lead and di-2-ethylhexyl phthalate explains an improved ability of learning and memory after combined exposure in weaning rats. Biol. Trace. Elem. Res [DOI] [PubMed]
- Li N, Papandonatos GD, Calafat AM, Yolton K, Lanphear BP, Chen A, et al. , 2019. Identifying periods of susceptibility to the impact of phthalates on children’s cognitive abilities. Environ. Res 172, 604–614. [DOI] [PMC free article] [PubMed] [Google Scholar]
- Lien YJ, Ku HY, Su PH, Chen SJ, Chen HY, Liao PC, et al. , 2015. Prenatal exposure to phthalate esters and behavioral syndromes in children at eight years of age: Taiwan maternal and infant cohort study. Environ. Health. Perspect 123, 95–100. [DOI] [PMC free article] [PubMed] [Google Scholar]
- Messerlian C, Bellinger D, Mínguez-Alarcón L, Romano ME, Ford JB, Williams PL, et al. , 2017. Paternal and maternal preconception urinary phthalate metabolite concentrations and child behavior. Environ. Res 158, 720–728. [DOI] [PMC free article] [PubMed] [Google Scholar]
- Minatoya M, Naka Jima S, Sasaki S, Araki A, Miyashita C, Ikeno T, et al. , 2016. Effects of prenatal phthalate exposure on thyroid hormone levels, mental and psychomotor development of infants: the hokkaido study on environment and children’s health. Sci. Total. Environ 565, 1037–1043. [DOI] [PubMed] [Google Scholar]
- Minatoya M, Itoh S, Yamazaki K, Araki A, Miyashita C, Tamura N, et al. , 2018. Prenatal exposure to bisphenol a and phthalates and behavioral problems in children at preschool age: The hokkaido study on environment and children’s health. Environ. Health. Prev. Med 23, 43. [DOI] [PMC free article] [PubMed] [Google Scholar]
- Miodovnik A, Engel SM, Zhu C, Ye X, Soorya LV, Silva MJ, et al. , 2011. Endocrine disruptors and childhood social impairment. Neurotoxicology 32, 261–267. [DOI] [PMC free article] [PubMed] [Google Scholar]
- Nakiwala D, Peyre H, Heude B, Bernard JY, Béranger R, Slama R, et al. , 2018. Inutero exposure to phenols and phthalates and the intelligence quotient of boys at 5years. Environ. Health 17, 11. [DOI] [PMC free article] [PubMed] [Google Scholar]
- NAS, 2008. Phthalates and Cumulative Risk Assessment: The Tasks Ahead (2008) Board on Environmental Studies and Toxicology [PubMed]
- Oztop DB, Demirci E, Ozmen S, Kondolot M, Kardas F, Per H, 2018. Might bpa and phthalates have a role in etiopathogenesis of adhd? Anadolu Psikiyatri Dergisi 19, 300–306. [Google Scholar]
- Park S, Kim BN, Cho S, Kim Y, Kim J, Lee JY, et al. , 2014. Association between urine phthalate levels and poor attentional performance in children with attention-deficit hyperactivity disorder with evidence of dopamine gene-phthalate interaction. Int. J. Environ. Res. Public Health 11, 6743–6756. [DOI] [PMC free article] [PubMed] [Google Scholar]
- Park S, Lee JM, Kim JW, Cheong JH, Yun HJ, Hong YC, et al. , 2015.Association between phthalates and externalizing behaviors and cortical thickness in children with attention deficit hyperactivity disorder. Psychol. Med 45, 1601–1612. [DOI] [PubMed] [Google Scholar]
- Perrier F, Giorgis-Allemand L, Slama R, Philippat C, 2016. Within-subject pooling of biological samples to reduce exposure misclassification in biomarker-based studies. Epidemiology 27, 378–388. [DOI] [PMC free article] [PubMed] [Google Scholar]
- Philippat C, Bennett DH, Krakowiak P, Rose M, Hwang HM, Hertz-Picciotto I, 2015. Phthalate concentrations in house dust in relation to autism spectrum disorder and developmental delay in the childhood autism risks from genetics and the environment (charge) study. Environ. Health 14, 56. [DOI] [PMC free article] [PubMed] [Google Scholar]
- Philippat C, Nakiwala D, Calafat AM, Botton J, De Agostini M, Heude B, et al. , 2017. Prenatal exposure to nonpersistent endocrine disruptors and behavior in boys at 3 and 5 years. Environ. Health. Perspect 125097014–097011 097019. [DOI] [PMC free article] [PubMed] [Google Scholar]
- Polanska K, Ligocka D, Sobala W, Hanke W, 2014. Phthalate exposure and child development: the polish mother and child cohort study. Early. Hum. Dev 90, 477–485. [DOI] [PubMed] [Google Scholar]
- Ran D, Luo Y, Gan Z, Liu J, Yang J, 2019. Neural mechanisms underlying the deficit of learning and memory by exposure to di(2-ethylhexyl) phthalate in rats. Ecotoxicol. Environ. Saf 174, 58–65. [DOI] [PubMed] [Google Scholar]
- Sagiv SK, Kalkbrenner AE, Bellinger DC, 2015. Of decrements and disorders: Assessing impairments in neurodevelopment in prospective studies of environmental toxicant exposures. Environ. Health 14, 8. [DOI] [PMC free article] [PubMed] [Google Scholar]
- Shimada N, Yamauchi K, 2004. Characteristics of 3,5,3’-triiodothyronine (t3)-uptake system of tadpole red blood cells: Effect of endocrine-disrupting chemicals on cellular t3 response. J. Endocrinol 183, 627–637. [DOI] [PubMed] [Google Scholar]
- Shin HM, Schmidt RJ, Tancredi D, Barkoski J, Ozonoff S, Bennett DH, et al. , 2018. Prenatal exposure to phthalates and autism spectrum disorder in the marbles study. Environ. Health 17, 85. [DOI] [PMC free article] [PubMed] [Google Scholar]
- Shoaff JR, Calafat AM, Schantz SL, Korrick SA, 2018. Endocrine disrupting chemical exposure and maladaptive behavior during adolescence. Environ. Res 172, 231–241. [DOI] [PMC free article] [PubMed] [Google Scholar]
- Sterne JA, Hernán MA, Reeves BC, Savović J, Berkman ND, Viswanathan M, Henry D, Altman DG, Ansari MT, Boutron I, Carpenter JR, Chan AW, Churchill R, Deeks JJ, Hróbjartsson A, Kirkham J, Jüni P, Loke YK, Pigott TD, Ramsay CR, Regidor D, Rothstein HR, Sandhu L, Santaguida PL, Schünemann HJ, Shea B, Shrier I, Tugwell P, Turner L, Valentine JC, Waddington H, Waters E, Wells GA, Whiting PF, Higgins JP, 2016. ROBINS-I: a tool for assessing risk of bias in non-randomised studies of interventions. BMJ 355, i4919. 10.1136/bmj.i4919. [DOI] [PMC free article] [PubMed] [Google Scholar]
- Stroustrup A, Bragg JB, Andra SS, Curtin PC, Spear EA, Sison DB, et al. , 2018. Neonatal intensive care unit phthalate exposure and preterm infant neurobehavioral performance. PLoS One 13, e0193835. [DOI] [PMC free article] [PubMed] [Google Scholar]
- Swan SH, 2000. Intrauterine exposure to diethylstilbestrol: Long-term effects in humans. APMIS 108, 793–804. [DOI] [PubMed] [Google Scholar]
- Téllez-Rojo MM, Cantoral A, Cantonwine DE, Schnaas L, Peterson K, Hu H, et al. , 2013. Prenatal urinary phthalate metabolites levels and neurodevelopment in children at two and three years of age. Sci. Total. Environ 461–462, 386390. [DOI] [PMC free article] [PubMed] [Google Scholar]
- Testa C, Nuti F, Hayek J, De Felice C, Chelli M, Rovero P, et al. , 2012. Di-(2-ethylhexyl) phthalate and autism spectrum disorders. ASN Neuro 4, 223–229. [DOI] [PMC free article] [PubMed] [Google Scholar]
- Verstraete S, Vanhorebeek I, Covaci A, Güiza F, Malarvannan G, Jorens PG, et al. , 2016. Circulating phthalates during critical illness in children are associated with long-term attention deficit: a study of a development and a validation cohort. Intensive. Care. Med 42, 379–392. [DOI] [PubMed] [Google Scholar]
- Wang R, Xu X, Zhu Q, 2016. Pubertal exposure to di-(2-ethylhexyl) phthalate influences social behavior and dopamine receptor d2 of adult female mice. Chemosphere 144, 1771–1779. [DOI] [PubMed] [Google Scholar]
- White RF, Campbell R, Echeverria D, Knox SS, Janulewicz P, 2009. Assessment of neuropsychological trajectories in longitudinal population-based studies of children. J. Epidemiol. Community. Health 63 (Suppl 1), i15–i26. [DOI] [PMC free article] [PubMed] [Google Scholar]
- Whyatt RM, Liu XH, Rauh VA, Calafat AM, Just AC, Hoepner L, et al. , 2012. Maternal prenatal urinary phthalate metabolite concentrations and child mental, psychomotor, and behavioral development at 3 years of age. Environ. Health. Perspect 120, 290–295. [DOI] [PMC free article] [PubMed] [Google Scholar]
- Won EK, Kim Y, Ha M, Burm E, Kim YS, Lim H, et al. , 2016. Association of current phthalate exposure with neurobehavioral development in a national sample. Int. J. Hyg. Environ. Health 219, 364–371. [DOI] [PubMed] [Google Scholar]
- Yolton K, Xu Y, Strauss D, Altaye M, Calafat AM, Khoury J, 2011. Prenatal exposure to bisphenol a and phthalates and infant neurobehavior. Neurotoxicol. Teratol 33, 558–566. [DOI] [PMC free article] [PubMed] [Google Scholar]
Associated Data
This section collects any data citations, data availability statements, or supplementary materials included in this article.