Abstract
Background
The increased incidence of polymyxin-resistant MDR Klebsiella pneumoniae has become a major global health concern.
Objectives
To characterize the lipid A profiles and metabolome differences between paired polymyxin-susceptible and -resistant MDR K. pneumoniae clinical isolates.
Methods
Three pairs of K. pneumoniae clinical isolates from the same patients were examined [ATH 7 (polymyxin B MIC 0.25 mg/L) versus ATH 8 (64 mg/L); ATH 15 (0.5 mg/L) versus ATH 16 (32 mg/L); and ATH 17 (0.5 mg/L) versus ATH 18 (64 mg/L)]. Lipid A and metabolomes were analysed using LC-MS and bioinformatic analysis was conducted.
Results
The predominant species of lipid A in all three paired isolates were hexa-acylated and 4-amino-4-deoxy-l-arabinose-modified lipid A species were detected in the three polymyxin-resistant isolates. Significant metabolic differences were evident between the paired isolates. Compared with their corresponding polymyxin-susceptible isolates, the levels of metabolites in amino sugar metabolism (UDP-N-acetyl-α-d-glucosamine and UDP-N-α-acetyl-d-mannosaminuronate) and central carbon metabolism (e.g. pentose phosphate pathway and tricarboxylic acid cycle) were significantly reduced in all polymyxin-resistant isolates [fold change (FC) > 1.5, P < 0.05]. Similarly, nucleotides, amino acids and key metabolites in glycerophospholipid metabolism, namely sn-glycerol-3-phosphate and sn-glycero-3-phosphoethanolamine, were significantly reduced across all polymyxin-resistant isolates (FC > 1.5, P < 0.05) compared with polymyxin-susceptible isolates. However, higher glycerophospholipid levels were evident in polymyxin-resistant ATH 8 and ATH 16 (FC > 1.5, P < 0.05) compared with their corresponding susceptible isolates.
Conclusions
To our knowledge, this study is the first to reveal significant metabolic perturbations associated with polymyxin resistance in K. pneumoniae.
Introduction
Klebsiella pneumoniae is an opportunistic Gram-negative pathogen that causes nosocomial infections including pneumonia, urinary tract infections, bacteraemia and meningitis.1 , 2 Infections caused by MDR K. pneumoniae are often associated with high mortality rates.1–4 WHO has highlighted carbapenem-resistant Enterobacteriaceae, including K. pneumoniae, as one of the three top-priority pathogens that urgently require novel therapeutics.5 IDSA and the CDC also identified MDR K. pneumoniae as a top-priority pathogen due to the lack of novel antibiotics.2 , 6
Polymyxin B and E (also known as colistin) are lipopeptide antibiotics that were seldom used between the 1970s and 1990s due to potential nephrotoxicity.7–9 However, over the last decade both polymyxins have been increasingly used as a last-line therapy against Gram-negative ‘superbugs’ because of resistance to all other classes of antibiotics.8 , 10–12 Polymyxins carry five positive charges at physiological pH, which drive their initial electrostatic interaction with the negatively charged phosphate groups on the lipid A component of LPS in the Gram-negative bacterial outer membrane.8 , 13 This specific interaction results in the displacement of cations (e.g. Mg2+ or Ca2+) that bridge adjacent LPS molecules, followed by the insertion of polymyxin molecules into the fatty acyl layer of the outer membrane.8 , 13 In addition, it is purported that the antibacterial activity of polymyxins is also due to the inhibition of a vital bacterial respiratory chain enzyme, type II NADH-quinone oxidoreductase,14 and the production of hydroxyl radicals.15 Worryingly, in recent years, polymyxin-resistant MDR K. pneumoniae has been increasingly reported worldwide, particularly in several eastern European countries.16 , 17 Most commonly, K. pneumoniae can acquire polymyxin resistance by modifications of lipid A with positively charged moieties such as 4-amino-4-deoxy-l-arabinose (l-Ara4N) and phosphoethanolamine (pEtN), which diminish the electrostatic interaction with polymyxins.8 The phoPQ and pmrAB two-component systems (TCSs) and the mgrB gene (a negative regulator of phoPQ) play a key role in controlling polymyxin resistance in K. pneumoniae.18–20 However, the metabolic perturbations associated with polymyxin resistance in K. pneumoniae remain unclear. Over the last decade, systems biology has been employed to investigate bacterial cellular processes and responses to antibiotic treatment.21–24 Global metabolic changes have been revealed between paired polymyxin-susceptible and -resistant Acinetobacter baumannii isolates, including perturbations in carbohydrate, amino acid, nucleotide and lipid metabolism.25 In the present study, we examined the lipid A profiles and metabolomic differences between paired polymyxin-susceptible and -resistant MDR clinical isolates of K. pneumoniae from the same patients. Three pairs of isolates were selected in this study as their mechanisms of polymyxin resistance were different, i.e. the inactivation of mgrB in ATH 8 and the inactivation of mgrB plus intragenic suppressor mutation in phoQ in ATH 16 and ATH 18.20
Materials and methods
Bacterial isolates
Three pairs of K. pneumoniae clinical isolates used in this study were obtained from the Hygeia General Hospital, Greece. These isolates were collected in 2016 from stool samples of patients infected with carbapenemase-producing K. pneumoniae prior to and after colistin therapy.20 Polymyxin B MICs were determined using broth microdilution (Table 1). No breakpoints for polymyxin B against the Enterobacteriaceae have been established, although susceptibility and resistance breakpoints for colistin have been set at ≤2 mg/L and >2 mg/L, respectively, according to EUCAST.26 In this study, we applied the colistin breakpoint to polymyxin B given the comparable activity of each polymyxin.27 Bacteria were grown in CAMHB (Oxoid, Australia; 20–25 mg/L Ca2+ and 10–12.5 mg/L Mg2+). Polymyxin B (sulphate; Sigma–Aldrich, Castle Hill, New South Wales, Australia) was dissolved in Milli-Q water (Millipore Australia, North Ryde, New South Wales, Australia) and the solution was sterilized by filtration with a 0.22 μm Millex GP filter (Millipore, Bedford, MA, USA).
Table 1.
Polymyxin B MICs of three paired K. pneumoniae clinical isolates obtained before and after polymyxin B treatment of patients in Hygeia General Hospital, Greece
| Isolate | Susceptibility | MIC (mg/L) |
|---|---|---|
| Kp ATH 7 | S | 0.25 |
| Kp ATH 8 | R | 64 |
| Kp ATH 15 | S | 0.5 |
| Kp ATH 16 | R | 32 |
| Kp ATH 17 | S | 0.5 |
| Kp ATH 18 | R | 64 |
Kp, K. pneumoniae; S, susceptible; R, resistant.
Lipid A structural analysis
Lipid A profiling was performed as previously described.25 , 28 In brief, a single colony was inoculated in 10 mL of CAMHB and incubated in a shaking water bath (180 rpm) at 37°C overnight then 2 mL of overnight culture was inoculated into 198 mL of CAMHB and grown to an OD600 of 0.5 at 37°C with a shaking speed of 180 rpm. Cells were collected via centrifugation at 3220 g for 30 min and washed twice with PBS. For LPS extraction, the cell pellet was resuspended in 5 mL of chloroform, 10 mL of methanol and 4 mL of PBS (chloroform:methanol:PBS, 1:2:0.8, v/v). The single-phase Bligh–Dyer mixture was then centrifuged at 3220 g for 15 min and the LPS pellet was collected and washed with chloroform:methanol:water (1:2:0.8, v/v). The washed LPS pellet was resuspended in hydrolysis buffer (5 mM sodium acetate pH 4, 1% SDS) and incubated in a boiling water bath for 45 min. Lipid A was extracted with the two-phase Bligh–Dyer mixture converted by combining 6 mL chloroform and 6 mL methanol to SDS solution (chloroform:methanol:1% SDS, 1:1:0.9, v/v). Finally, the lower phase containing lipid A was extracted, dried and stored at −20°C. Lipid A profiling was performed using a Q-Exactive hybrid Quadrupole-Orbitrap mass spectrometer operating in negative mode.25
Preparation of bacterial cultures for metabolome analysis
Bacterial isolates were subcultured from −80°C stocks onto nutrient agar and a single colony was inoculated into 10 mL of CAMHB and incubated overnight at 37°C with constant shaking (180 rpm) then 500 μL of the overnight culture was inoculated into 50 mL of CAMHB and grown at 37°C with constant shaking (180 rpm) to obtain an OD600 of 0.5 (mid-exponential growth phase). Bacterial cultures in CAMHB were standardized based on OD600 values. Subsequently, 10 mL of mid-exponential culture (OD600 = 0.5) was collected into a 15 mL Falcon tube and cell pellets were collected by centrifugation at 3220 g and 4°C for 10 min. Four biological replicates were performed on different days and all samples were analysed by LC-MS in a single batch. The analytical variation within the experiments was expressed as median relative standard deviation (RSD).
Extraction and LC-MS analysis of cellular metabolites
The cellular metabolites were extracted using a reported method.25 The cell pellet for each sample was washed twice with 2 mL of cold 0.9% sodium chloride, to remove the extracellular metabolites and media components, and samples were centrifuged at 3220 g and 4°C for 5 min. For the extraction of intracellular metabolites, cell pellets were resuspended in 0.5 mL of dry-ice cold chloroform:methanol:water (1:2:0.8, v/v) extraction solvent containing each internal standard at 1 μM {3-[(3-cholamidopropyl)dimethylammonio]-1-propanesulfonate (CHAPS), N-cyclohexyl-3-aminopropanesulfonic acid (CAPS), piperazine-N, N′-bis(2-ethanesulfonic acid) (PIPES) and 2-amino-2-(hydroxymethyl)propane-1,3-diol (TRIS)}. Samples were frozen in liquid nitrogen and thawed on ice, and the freeze–thaw process was repeated three times for the release of intracellular metabolites. The mixture was centrifuged at 3220 g and 4°C for 10 min. The supernatant was collected in 1.5 mL centrifuge tubes; this was followed by further centrifugation at 14 400 g and 4°C for 10 min to obtain particle-free metabolite samples. The samples were stored at −80°C prior to LC-MS analysis.
Metabolite samples (10 μL) were analysed on a Q-Exactive Orbitrap mass spectrometer (Thermo Fisher) equipped with a Dionex high-performance liquid chromatograph (U3000 RSLC HPLC, Thermo Fisher) coupled to a ZIC-pHILIC column (5 μm, polymeric, 150 × 4.6 mm; SeQuant, Merck). The LC solvent system consisted of 20 mM ammonium carbonate (A) and acetonitrile (B) as mobile phases. The multi-step gradient system was programmed as follows: first, 20% of solvent A and 80% B to 50% B over 15 min, and then to 5% B at 18 min; second, the system was washed by 95% A with 5% B for 3 min; finally, the column was re-equilibrated with 20% A and 80% B for 8 min. The flow rate was 0.3 mL/min and all samples were run in a single batch of LC-MS to avoid any potential batch-to-batch variability.29 Metabolites were identified by comparing the mixture of pure standards containing over 200 metabolites analysed within the same batch. Pooled biological quality control samples containing 10 μL of each sample were examined periodically throughout the batch for the assessment of analytical reproducibility and sample stability.
Data processing, bioinformatic and statistical analyses
Raw LC-MS data were analysed using mzMatch30 and IDEOM.31 Chromatographic peak detection was performed using Xcalibur (version 2.1).32 Metabolites were putatively identified by exact mass within 2 ppm and confirmed using the retention time based on the authentic standards (or on predicted retention time if authentic standards were not available). The amount of each metabolite was quantified using peak height. MetaboAnalyst 3.0 was used for univariate and multivariate statistical analyses and the relative peak intensity data were normalized by the median and log-transformed.33 To identify the global metabolome differences between polymyxin-susceptible and -resistant isolates, principal component analysis (PCA) was applied. Welch’s t-test (P < 0.05) was utilized for univariate statistical analysis to identify significant changes between the isolate pairs. Significant metabolites with ≥1.5-fold change (FC) (i.e. 0.6 log2 FC) and a confidence score of ≥7 in IDEOM were selected to compare metabolic changes between polymyxin-resistant versus polymyxin-susceptible isolates. Metabolic pathway analysis was performed based on the significantly perturbed metabolites using the KEGG pathway and BioCyc (http://biocyc.org).34
Results
Lipid A structural analysis of polymyxin-susceptible and -resistant MDR clinical isolates of K. pneumoniae
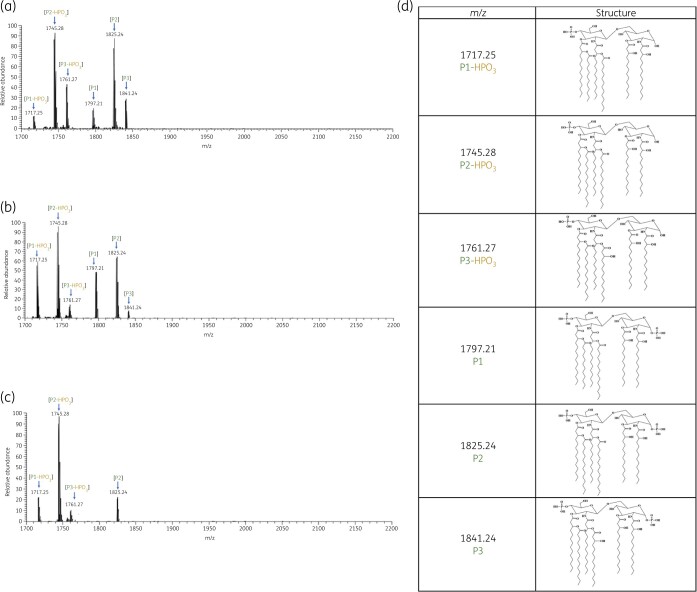
Substantial differences were observed in the lipid A structures between the three pairs of polymyxin-susceptible and -resistant strains (Figures 1 and 2). The mass spectra of all polymyxin-susceptible strains (ATH 7, ATH 15 and ATH 17) were dominated by two peaks at m/z 1745.28 and 1825.24 (Figure 1). The predominant peak at m/z 1825.24 corresponds to a hexa-acylated lipid A containing four primary acyl chains [3-hydroxymyristate C14:0(3-OH)] and two secondary acyl chains (myristate C14:0), while the peak at m/z 1745.28 represents the dephosphorylated form of the aforementioned hexa-acylated lipid A (m/z 1825.24, Δm/z = −80). In addition, other peaks (m/z 1717.25 and 1761.27) were identified in all three polymyxin-susceptible isolates (Figure 1) and two peaks at m/z 1797.21 and 1841.24 were observed in two polymyxin-susceptible isolates (ATH 7 and ATH 15). The peak at m/z 1797.21 corresponds to a hexa-acylated diphosphoryl lipid A containing four C14:0(3-OH) and two secondary acyl chains (one C12:0 and one C14:0). The peak at m/z 1717.24 was the dephosphorylated form of the lipid A at m/z 1797.21 (Δm/z = −80), whereas the peak at m/z 1761.27 represents the dephosphorylated form of lipid A at m/z 1841.24 containing four primary acyl chains [3-hydroxymyristate C14:0(3-OH)] and two secondary acyl chains [one C14:0(3-OH) and one myristate C14:0].
Figure 1.
Mass spectra of lipid A from the polymyxin-susceptible K. pneumoniae clinical isolates (a) ATH 7, (b) ATH 15 and (c) ATH 17; (d) chemical structures of lipid A. This figure appears in colour in the online version of JAC and in black and white in the print version of JAC.
Figure 2.
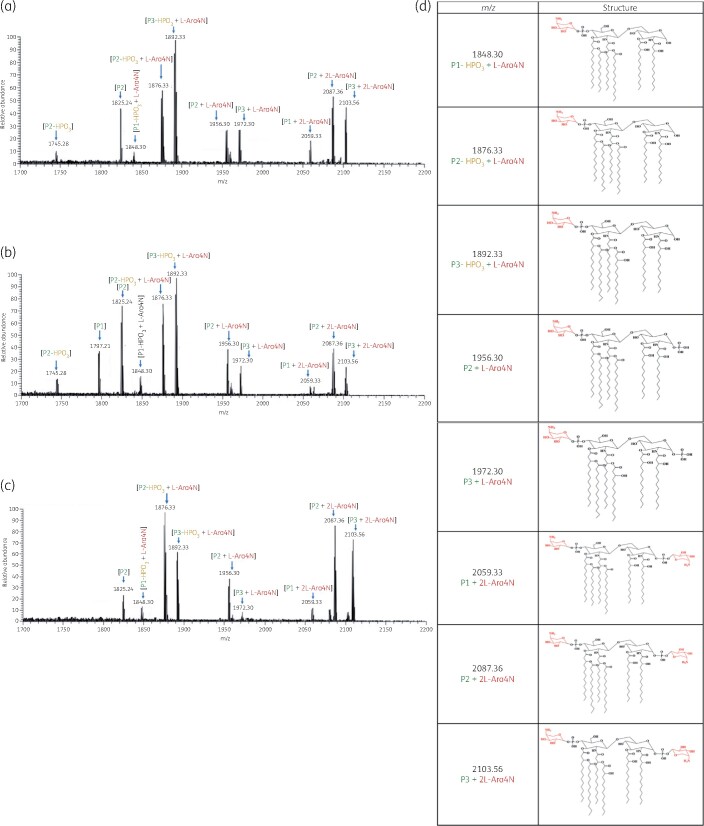
Mass spectra of lipid A from the polymyxin-resistant K. pneumoniae clinical isolates (a) ATH 8, (b) ATH 16 and (c) ATH 18; (d) chemical structures of lipid A modified with l-Ara4N. This figure appears in colour in the online version of JAC and in black and white in the print version of JAC.
Compared with the polymyxin-susceptible isolates, the mass spectra of lipid A from polymyxin-resistant K. pneumoniae clinical isolates (ATH 8, ATH 16 and ATH 18) revealed eight additional major peaks at m/z 1848.30, 1876.33, 1892.33, 1956.30, 1972.30, 2059.33, 2087.36 and 2103.56 (Figure 2). The peaks at m/z 1848.30, 1876.33 and 1892.33 correspond to the addition of an aminoarabinose to the hexa-acylated monophosphoryl lipid A at m/z 1717.25, 1745.28 and 1761.28, respectively (Δm/z = +131); while the peaks at m/z 1956.30 and 1972.30 represent modified lipid A through addition of one aminoarabinose to hexa-acylated diphosphoryl lipid A at m/z 1825.25 and 1841.24, respectively (Δm/z = +131). Furthermore, the peaks at m/z 2059.33, 2087.36 and 2103.56 correspond to the addition of two aminoarabinose moieties to the hexa-acylated diphosphoryl lipid A at m/z 1797.21, 1825.25 and 1841.24 (Δm/z = +262).
Metabolic changes in polymyxin-resistant MDR K. pneumoniae isolates
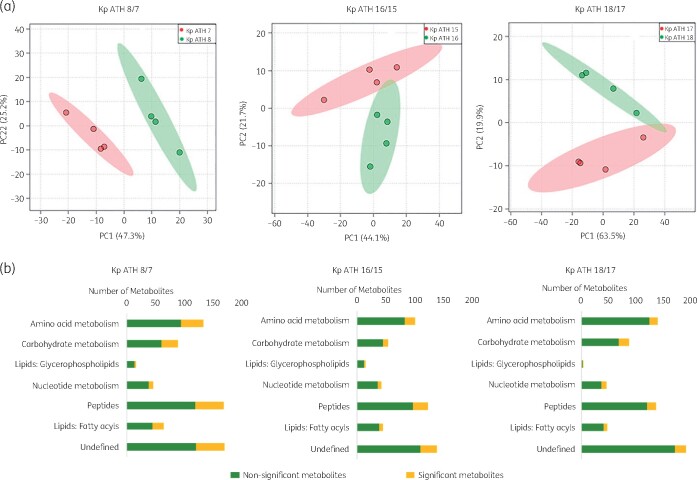
In addition to lipid A modifications, distinct clustering of the metabolite profiles was evident in paired polymyxin-susceptible and -resistant isolates using PCA (PC1 = 44.1%–66.7%; Figure 3a). In particular, significant perturbations were evident across cell envelope biogenesis, lipid levels and central carbon, nucleotide, amino acid and peptide metabolism in the polymyxin-resistant isolates compared with their paired polymyxin-susceptible strains (Figure 3b). The overall metabolic differences between three pairs of polymyxin-susceptible (ATH 7, ATH 15 and ATH 17) and polymyxin-resistant (ATH 8, ATH 16 and ATH 18) clinical isolates of K. pneumoniae are shown in Figure S1 (available as Supplementary data at JAC Online); the %RSD values of pooled quality control samples and the three pairs of isolates are presented in Table S1.
Figure 3.
Multivariate and univariate statistical analyses of metabolome perturbations between the polymyxin-susceptible and -resistant K. pneumoniae clinical isolates. (a) PCA score plots of three pairs of K. pneumoniae isolates. Pink, polymyxin-susceptible isolates (ATH 7, ATH 15 and ATH 17); green, polymyxin-resistant isolates (ATH 8, ATH 16 and ATH 18); (b) number of significantly and non-significantly perturbed metabolites (FC ≥ 1.5, P < 0.05). This figure appears in colour in the online version of JAC and in black and white in the print version of JAC.
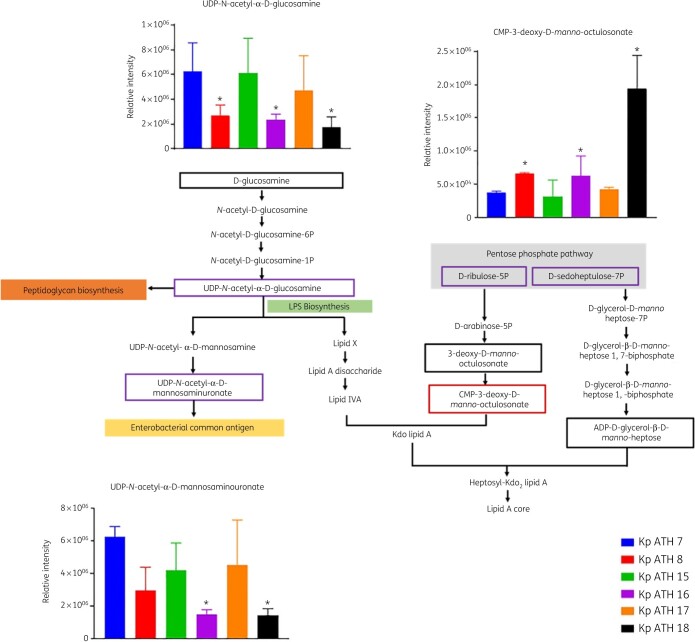
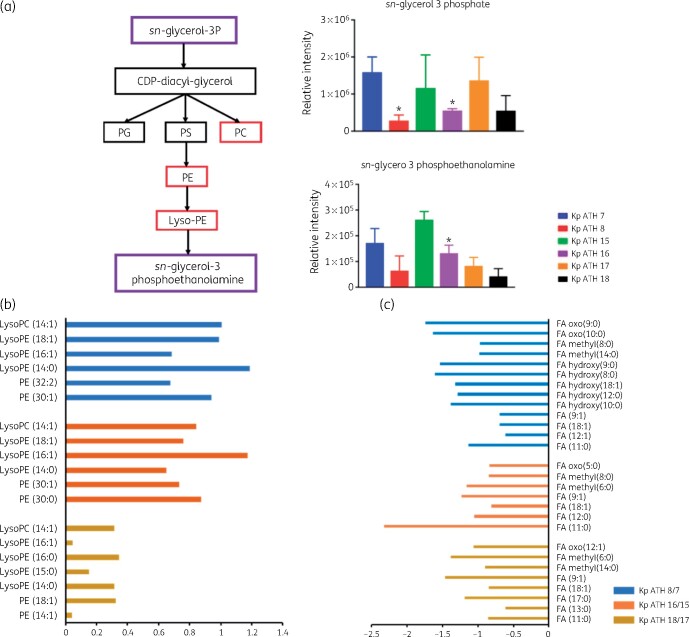
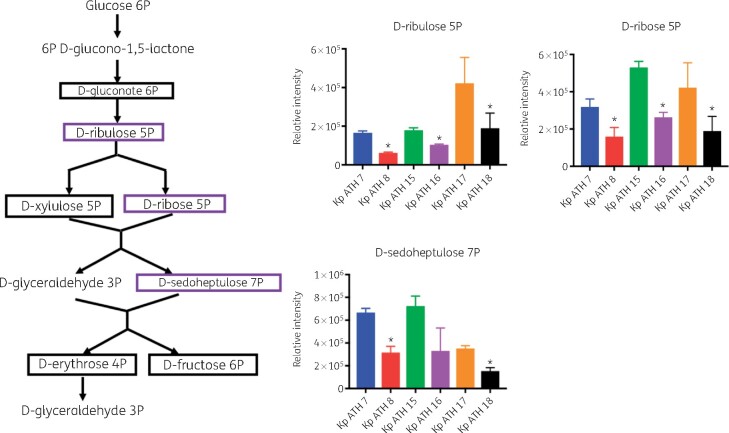
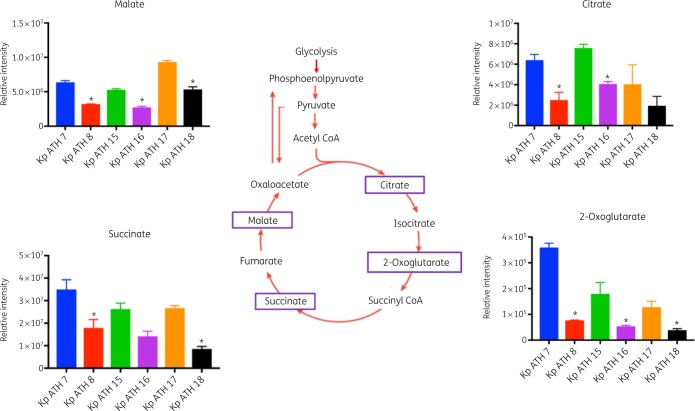
Across the LPS and cell wall biosynthetic pathways, the key precursors, UDP-N-acetyl-α-d-glucosamine and UDP-N-acetyl-α-d-mannosaminuronate, were significantly depleted in all three polymyxin-resistant isolates (FC > 1.5, P < 0.05) compared with their paired polymyxin-susceptible isolates (Figure 4). However, the level of CMP-3-deoxy-d-manno-octulosonate (Kdo), an essential intermediate metabolite in the biosynthesis of the LPS inner core, was elevated in all polymyxin-resistant isolates compared with their paired polymyxin-susceptible isolates (FC > 1.5, P < 0.05; Figure 4). With regard to the perturbation of lipid metabolism, sn-glycerol-3-phosphate and sn-glycero-3-phosphoethanolamine (Figure 5a) were significantly reduced (FC > 1.5, P < 0.05) across all three polymyxin-resistant isolates. However, a number of phosphatidylethanolamine (PE), lysophosphatidylethanolamine (lyso-PE) and lysophosphatidylcholine (lyso-PC) were significantly higher (FC > 1.5, P < 0.05) in polymyxin-resistant isolates ATH 8 and ATH 16, compared with their paired polymyxin-susceptible isolates ATH 7 and ATH 15, respectively; a similar trend was observed with glycerophospholipids (PE, lyso-PE and lyso-PC) in ATH 18/17, but the differences between ATH 18 and ATH 17 were not significant (Figure 5b). Interestingly, the levels of several fatty acids were substantially decreased in all polymyxin-resistant isolates (FC > 1.5, P < 0.05; Figure 5c). Furthermore, a significant depletion of metabolites in central carbon metabolism was also evident in all three polymyxin-resistant isolates compared with their corresponding susceptible isolates. In particular, in all polymyxin-resistant isolates d-ribulose 5-phosphate, d-ribose 5-phosphate and d-sedoheptulose 7-phosphate in the pentose phosphate pathway (PPP) and 2-oxoglutarate, citrate, succinate and malate in the tricarboxylic acid (TCA) cycle, were significantly decreased by at least 2-fold in their abundance (FC ≥ 2, P < 0.05; Figures 6 and 7). Consistently, nucleotide pools were lower across all polymyxin-resistant isolates compared with their corresponding susceptible isolates (FC > 1.5, P < 0.05; Figure S2). Interestingly, amino acid metabolism in arginine, proline, glycine, serine, threonine, histidine, lysine, methionine, phenylalanine, tyrosine, valine, leucine and isoleucine were perturbed in three polymyxin-resistant isolates (FC > 1.5, P < 0.05; Figure S3). In polymyxin-resistant isolates, the levels of five major metabolites (i.e. methylimidazoleacetic acid, 4-imidazolone-5-propanoate, N-formyl-l-aspartate, formyl-isoglutamine and urocanate) related to histidine metabolism were lower than in their corresponding polymyxin-susceptible isolates. Interestingly, in the PPP two precursors (i.e. d-ribulose 5-phosphate and d-ribose 5-phosphate) of these five major metabolites were also significantly depleted (FC > 1.5, P < 0.05).
Figure 4.
Perturbations of cell envelope biosynthesis in the polymyxin-resistant K. pneumoniae clinical isolates. Purple boxes show the metabolites that were approximately 2-fold less abundant in the polymyxin-resistant isolates than in their respective susceptible isolates; red boxes show the metabolites that were at least 2-fold more abundant in the polymyxin-resistant isolates than in their respective susceptible isolates. *FC ≥ 2, P < 0.05. Black boxes indicate the detected metabolites across three paired isolates but not different between polymyxin-resistant and -susceptible isolates. This figure appears in colour in the online version of JAC and in black and white in the print version of JAC.
Figure 5.
(a) Perturbations of phospholipid biosynthesis in the polymyxin-resistant K. pneumoniae clinical isolates. Purple and red boxes show metabolites that were relatively less and more abundant, respectively, in polymyxin-resistant isolates than in their paired susceptible isolates (*FC ≥ 2, P < 0.05). (b) Log2 FCs of glycerophospholipids in the polymyxin-resistant isolates. Blue and red bars indicate metabolites that were more abundant in ATH 8 and ATH 16, compared with their corresponding susceptible isolates ATH 7 and ATH 15 (FC ≥ 1.5, P < 0.05). Gold bars represent the metabolites that were relatively more abundant in ATH 18 compared with its susceptible isolate ATH 17 but not significant. (c) Log2 FCs of fatty acids in the polymyxin-resistant isolates. Blue, red and gold bars show the metabolites that were less abundant in ATH 8, ATH 16 and ATH 18, compared with their corresponding susceptible isolates ATH 7, ATH 15 and ATH 17 (FC ≥ 1.5, P < 0.05). This figure appears in colour in the online version of JAC and in black and white in the print version of JAC.
Figure 6.
Perturbations of the PPP in the polymyxin-resistant K. pneumoniae clinical isolates. Purple boxes indicate the metabolites that were significantly reduced in polymyxin-resistant isolates, compared with their susceptible isolates (*FC ≥ 2, P < 0.05). Black boxes indicate the detected metabolites across three paired isolates but not different between polymyxin-resistant and -susceptible isolates. This figure appears in colour in the online version of JAC and in black and white in the print version of JAC.
Figure 7.
Perturbations of TCA cycle metabolites in the polymyxin-resistant K. pneumoniae clinical isolates. Purple boxes indicate the metabolite decreased at least 2-fold in polymyxin-resistant isolates, compared with their paired susceptible isolates (*FC ≥ 2, P < 0.05). This figure appears in colour in the online version of JAC and in black and white in the print version of JAC.
Discussion
Polymyxin-resistant MDR K. pneumoniae in both community and nosocomial settings has left clinicians with very limited therapeutic options.35 As polymyxins are a last-line defence, understanding the mechanisms of polymyxin resistance is of paramount importance. Metabolomics is of considerable utility for elucidating the mechanisms of metabolic changes in antibiotic-resistant A. baumannii, Pseudomonas aeruginosa, Nocardiopsis spp. and protozoan parasites (e.g. Trypanosoma brucei and Leishmania donovani).25 , 36–42 Modifications of lipid A by the addition of l-Ara4N and pEtN are the primary mechanisms of polymyxin resistance in Gram-negative bacteria through protecting their outer membrane against the binding of polymyxins.43 , 44 Therefore, in the first tier of the present study, we investigated the structural differences of lipid A between three pairs of polymyxin-susceptible and -resistant K. pneumoniae clinical isolates obtained from the same patients before and after colistin treatment.20 Lipid A species from the polymyxin-susceptible isolates were mainly hexa-acylated, which are commonly found in polymyxin-susceptible K. pneumoniae.45–47 The predominant peaks at m/z 1825.24 and 1841.24 in the present study were reported in the literature.45–47 Moreover, it is evident that hexa-acylated lipid A molecules modified with one or two l-Ara4N were the most common species in all three polymyxin-resistant isolates (Figure 2). The peaks at m/z 1956.30 and 1972.30 represented the modified lipid A through addition of one aminoarabinose to hexa-acylated diphosphoryl lipid A at m/z 1825.25 and 1841.24, respectively (Δm/z = +131) and our results are consistent with the previous studies undertaken in K. pneumoniae.45–47 Our recent genomic analysis revealed that the mechanism of polymyxin resistance was mainly due to the inactivation of mgrB in ATH 8 and the inactivation of mgrB plus intragenic suppressor mutation in phoQ in ATH 16 and ATH 18.20 The phoPQ TCSs and the mgrB gene (a negative regulator of phoPQ) play a key role in controlling polymyxin resistance in K. pneumoniae by regulating the synthesis and transfer of l-Ara4N and/or pEtN to the lipid A moiety of LPS.18–20 These genomic results supported our lipid A profiles, which revealed l-Ara4N modifications in polymyxin-resistant isolates (Figure 2). It is known that mutational inactivation of the mgrB gene in K. pneumoniae is usually associated with lipid A remodelling, mainly by the addition of l-Ara4N to lipid A, which confers resistance to polymyxins.45–47
The cell envelope of Gram-negative bacteria is composed of two membranes, the inner membrane consisting of a phospholipid bilayer and the outer membrane containing LPS and phospholipids.48 These two membranes are separated by a thin peptidoglycan layer.48 In our study, two major amino sugar metabolites (UDP-N-acetyl-α-d-glucosamine and UDP-N-acetyl-α-d-mannosaminuronate) were significantly depleted in all polymyxin-resistant strains. Both metabolites are essential precursors of LPS and peptidoglycan biosynthesis.49–51 The inner core of LPS usually comprises two Kdo and three l-glycero-d-manno-heptose (HEP) units,52 which are synthesized from d-ribulose 5-phosphate and d-sedoheptulose 7-phosphate in the PPP, respectively.53 In our study, compared with polymyxin-susceptible isolates, all polymyxin-resistant clinical isolates showed a significantly increased level of Kdo and decreased levels of d-ribulose 5-phosphate and d-sedoheptulose 7-phosphate (Figure 4). This result was consistent with the previous findings that the PPP metabolites were depleted in A. baumannii clinical isolates that were resistant to polymyxins due to the modification of lipid A with pEtN.25 However, in LPS-deficient A. baumannii the d-sedoheptulose 7-phosphate pool was 2-fold higher compared with its polymyxin-susceptible isolate, which could be due to the blockage in the downstream lipid A biosynthesis.25 In contrast, in K. pneumoniae polymyxin resistance is mainly mediated by lipid A modifications with l-Ara4N, not LPS loss. The much lower abundance of d-sedoheptulose 7-phosphate and d-ribulose 5-phosphate suggests that K. pneumoniae requires more modified lipid A in order to diminish the initial interaction with polymyxin molecules.
Glycerophospholipids are critical components of bacterial membranes, including the outer and inner membranes in Gram-negative bacteria.54 PE and phosphatidylglycerol (PG) are primary membrane phospholipids and cardiolipin (CL) and phosphatidylcholine (PC) are present as minor components of bacterial membranes.55 , 56 Alterations in bacterial glycerophospholipid levels and membrane compositions are a major strategy that bacteria employ to survive adverse environmental stresses such as when antibiotics are present or when changes in temperature, osmolarity and pH occur.57 , 58 In our study, intracellular levels of glycerophospholipids (largely PE and PC) were much higher in the polymyxin-resistant isolates ATH 8 and ATH 16 than their paired susceptible isolates ATH 7 and ATH 15, respectively. It is likely that upon membrane damage due to polymyxin treatment, more glycerophospholipid molecules were transported to the outer leaflet to fortify the outer membrane barrier. Moreover, significantly higher levels of lyso-PE with unsaturated fatty acids were observed in polymyxin-resistant isolates ATH 8 and ATH 16, when compared with their paired susceptible isolates. The increased level of lyso-PE in polymyxin-resistant isolates suggested that significant glycerophospholipid turnover occurred in these resistant isolates. Previous reports showed that polymyxin-resistant LPS-deficient Neisseria meningitidis 59 and A. baumannii mutants25 preferentially incorporated PE with shorter fatty acyl chains. This is consistent with our finding of alteration of PE with shorter fatty acyl chains in polymyxin-resistant K. pneumoniae isolates. Taken together, it is very likely that the increased production of glycerophospholipids and the decreased short-chain fatty acid levels might be associated with the cell envelope remodelling in polymyxin-resistant ATH 8 and ATH 16. However, when compared with its paired susceptible strain ATH 17, the changes in the glycerophospholipid levels in polymyxin-resistant ATH 18 were trending in the same direction but were not significant, indicating that polymyxin resistance can potentially involve diverse mechanisms across different bacterial strains of the same species.
In addition to the biosynthesis of LPS (especially the lipid A core via d-ribulose 5-phosphate and d-sedoheptulose 7-phosphate), the PPP also provides a source of precursors for nucleotide and amino acid biosynthesis.60 Our findings revealed significantly lower levels of three key PPP metabolites (d-ribose 5-phosphate, d-ribulose 5-phosphate and d-sedoheptulose 7-phosphate) in the polymyxin-resistant isolates (Figure 6). d-ribulose 5-phosphate and d-ribose 5-phosphate are essential precursors for purine and pyrimidine de novo biosynthesis and histidine amino acid biosynthesis.61 The much lower levels of d-ribose 5-phosphate and d-ribulose 5-phosphate in polymyxin-resistant ATH 8, ATH 16 and ATH 18 might influence the flux into nucleotide and amino acid biosynthesis. Consistently, depletions of several major purine and pyrimidine nucleotide metabolites and histidine metabolites were observed in all three polymyxin-resistant isolates in our study (Figures S2 and S3). The TCA cycle plays a crucial role in bacterial metabolism for energy generation and biosynthetic reactions including the provision of precursors for lipid and amino acid biosynthesis.62 In our study, the intracellular concentrations of TCA metabolites, malate, 2-oxoglutarate, citrate and succinate were all significantly decreased in all polymyxin-resistant isolates (Figure 7), which was similar to the results from polymyxin-resistant A. baumannii isolates.25 Collectively, the decrease of TCA cycle metabolites in polymyxin-resistant isolates demonstrated perturbed bacterial energy production.
In conclusion, to our knowledge this is the first study to reveal significant metabolic differences between polymyxin-susceptible and -resistant K. pneumoniae. In addition to the lipid A modifications with l-Ara4N, substantial perturbations were revealed in cell envelope biosynthesis, glycerophospholipid metabolism, the PPP, energy metabolism, nucleotide metabolism and amino acid metabolism in polymyxin-resistant K. pneumoniae isolates. This study provides novel metabolomic information on polymyxin resistance in K. pneumoniae, which may benefit the optimization of polymyxin use in patients.
Supplementary Material
Acknowledgements
Part of this work was presented at the 29th European Congress of Clinical Microbiology & Infectious Diseases, Amsterdam, The Netherlands, 13–16 April 2019 (Abstract O0512). S.M.A. is thankful to the Myanmar Government for providing the Presidential Scholarship. We appreciate the LC-MS support from the Monash Proteomics and Metabolomics Facility.
Funding
This study was supported by an internal fund and a research grant from the National Institute of Allergy and Infectious Diseases of the National Institutes of Health (R01 AI132681, J.L. and T.V.). J.L., D.J.C. and T.V. are also supported by the Australian National Health and Medical Research Council (NHMRC) as Principal Research Fellow (J.L.) and Career Development Level 2 Fellows (T.V. and D.J.C.).
Transparency declarations
None to declare.
Disclaimer
The content is solely the responsibility of the authors and does not necessarily represent the official views of the National Institute of Allergy and Infectious Diseases or the National Institutes of Health.
References
- 1.Kontopidou F, Giamarellou H, Katerelos P et al. Infections caused by carbapenem-resistant Klebsiella pneumoniae among patients in intensive care units in Greece: a multi-centre study on clinical outcome and therapeutic options. Clin Microbiol Infect 2014; 20: O117–23. [DOI] [PubMed] [Google Scholar]
- 2.CDC. Antibiotic Resistance Threats in the United States. 2019. https://www.cdc.gov/drugresistance/pdf/threats-report/2019-ar-threats-report-508.pdf.
- 3.Ben-David D, Kordevani R, Keller N et al. Outcome of carbapenem resistant Klebsiella pneumoniae bloodstream infections. Clin Microbiol Infect 2012; 18: 54–60. [DOI] [PubMed] [Google Scholar]
- 4.Giacobbe DR, Del Bono V, Bruzzi P et al. Previous bloodstream infections due to other pathogens as predictors of carbapenem-resistant Klebsiella pneumoniae bacteraemia in colonized patients: results from a retrospective multicentre study. Eur J Clin Microbiol Infect Dis 2017; 36: 663–9. [DOI] [PubMed] [Google Scholar]
- 5.Tacconelli E, Magrini N, Kahlmeter G et al. Global Priority List of Antibiotic-Resistant Bacteria to Guide Research, Discovery and Development of New Antibiotics. WHO. 2017. https://www.who.int/medicines/publications/WHO-PPL-Short_Summary_25Feb-ET_NM_WHO.pdf.
- 6.Spellberg B, Blaser M, Guidos RJ et al. Combating antimicrobial resistance: policy recommendations to save lives. Clin Infect Dis 2011; 52: S397–428. [DOI] [PMC free article] [PubMed] [Google Scholar]
- 7.Falagas ME, Kasiakou SK. Toxicity of polymyxins: a systematic review of the evidence from old and recent studies. Crit Care 2006; 10: R27. [DOI] [PMC free article] [PubMed] [Google Scholar]
- 8.Velkov T, Roberts KD, Nation RL et al. Pharmacology of polymyxins: new insights into an ‘old’ class of antibiotics. Future Microbiol 2013; 8: 711–24. [DOI] [PMC free article] [PubMed] [Google Scholar]
- 9.Tran TB, Velkov T, Nation RL et al. Pharmacokinetics/pharmacodynamics of colistin and polymyxin B: are we there yet? Int J Antimicrob Agents 2016; 48: 592–7. [DOI] [PMC free article] [PubMed] [Google Scholar]
- 10.Zavascki AP, Goldani LZ, Li J et al. Polymyxin B for the treatment of multidrug-resistant pathogens: a critical review. J Antimicrob Chemother 2007; 60: 1206–15. [DOI] [PubMed] [Google Scholar]
- 11.Poirel L, Jayol A, Nordmann P. Polymyxins: antibacterial activity, susceptibility testing, and resistance mechanisms encoded by plasmids or chromosomes. Clin Microbiol Rev 2017; 30: 557–96. [DOI] [PMC free article] [PubMed] [Google Scholar]
- 12.Lenhard JR, Bulman ZP, Tsuji BT et al. Shifting gears: the future of polymyxin antibiotics. Antibiotics (Basel) 2019; 8: 42. [DOI] [PMC free article] [PubMed] [Google Scholar]
- 13.Velkov T, Thompson PE, Nation RL et al. Structure—activity relationships of polymyxin antibiotics. J Med Chem 2010; 53: 1898–916. [DOI] [PMC free article] [PubMed] [Google Scholar]
- 14.Deris ZZ, Akter J, Sivanesan S et al. A secondary mode of action of polymyxins against Gram-negative bacteria involves the inhibition of NADH-quinone oxidoreductase activity. J Antibiot (Tokyo ) 2014; 67: 147–51. [DOI] [PMC free article] [PubMed] [Google Scholar]
- 15.Yu Z, Qin W, Lin J et al. Antibacterial mechanisms of polymyxin and bacterial resistance. BioMed Res Int 2015; 2015: 679109. [DOI] [PMC free article] [PubMed] [Google Scholar]
- 16.ECDC. Surveillance of Antimicrobial Resistance in Europe. 2017. https://www.ecdc.europa.eu/sites/default/files/documents/EARS-Net-report-2017-update-jan-2019.pdf.
- 17.Granata G, Petrosillo N. Resistance to colistin in Klebsiella pneumoniae: a 4.0 strain? Infect Dis Rep 2017; 9: 7104. [DOI] [PMC free article] [PubMed] [Google Scholar]
- 18.Cannatelli A, D’Andrea MM, Giani T et al. In vivo emergence of colistin resistance in Klebsiella pneumoniae producing KPC-type carbapenemase mediated by insertional inactivation of the PhoQ/PhoP mgrB regulator. Antimicrob Agents Chemother 2013; 57: 5521–6. [DOI] [PMC free article] [PubMed] [Google Scholar]
- 19.Cannatelli A, Giani T, D’Andrea MM et al. MgrB inactivation is a common mechanism of colistin resistance in KPC-producing Klebsiella pneumoniae of clinical origin. Antimicrob Agents Chemother 2014; 58: 5696–703. [DOI] [PMC free article] [PubMed] [Google Scholar]
- 20.Zhu Y, Galani I, Karaiskos I et al. Multifaceted mechanisms of colistin resistance revealed by genomic analysis of multidrug-resistant Klebsiella pneumoniae isolates from individual patients before and after colistin treatment. J Infect 2019; 79: 312–21. [DOI] [PMC free article] [PubMed] [Google Scholar]
- 21.Mastrangelo A, Armitage EG, Garcia A et al. Metabolomics as a tool for drug discovery and personalised medicine. A review. Curr Top Med Chem 2014; 14: 2627–36. [DOI] [PubMed] [Google Scholar]
- 22.Oh J, Yi S, Gu N et al. Utility of integrated analysis of pharmacogenomics and pharmacometabolomics in early phase clinical trial: a case study of a new molecular entity. Genomics Inform 2018; 16: 52–8. [DOI] [PMC free article] [PubMed] [Google Scholar]
- 23.Burt T, Nandal S. Pharmacometabolomics in early-phase clinical development. Clin Transl Sci 2016; 9: 128–38. [DOI] [PMC free article] [PubMed] [Google Scholar]
- 24.Vincent IM, Ehmann DE, Mills SD et al. Untargeted metabolomics to ascertain antibiotic modes of action. Antimicrob Agents Chemother 2016; 60: 2281–91. [DOI] [PMC free article] [PubMed] [Google Scholar]
- 25.Maifiah MH, Cheah S-E, Johnson MD et al. Global metabolic analyses identify key differences in metabolite levels between polymyxin-susceptible and polymyxin-resistant Acinetobacter baumannii. Sci Rep 2016; 6: 22287. [DOI] [PMC free article] [PubMed] [Google Scholar]
- 26.EUCAST. Breakpoint Tables for Interpretation of MICs and Zone Diameters, Version 10.0. 2020. http://www.eucast.org/fileadmin/src/media/PDFs/EUCAST_files/Breakpoint_tables/v_10.0_Breakpoint_Tables.pdf.
- 27.Gales AC, Jones RN, Sader HS. Contemporary activity of colistin and polymyxin B against a worldwide collection of Gram-negative pathogens: results from the SENTRY Antimicrobial Surveillance Program (2006–09). J Antimicrob Chemother 2011; 66: 2070–4. [DOI] [PubMed] [Google Scholar]
- 28.Henderson JC, O’Brien JP, Brodbelt JS et al. Isolation and chemical characterization of lipid A from gram-negative bacteria. J Vis Exp 2013; 16: e50623. [DOI] [PMC free article] [PubMed] [Google Scholar]
- 29.Maifiah MHM, Creek DJ, Nation RL et al. Untargeted metabolomics analysis reveals key pathways responsible for the synergistic killing of colistin and doripenem combination against Acinetobacter baumannii. Sci Rep 2017; 7: 45527. [DOI] [PMC free article] [PubMed] [Google Scholar]
- 30.Scheltema RA, Jankevics A, Jansen RC et al. PeakML/mzMatch: a file format, Java library, R library, and tool-chain for mass spectrometry data analysis. Anal Chem 2011; 83: 2786–93. [DOI] [PubMed] [Google Scholar]
- 31.Creek DJ, Jankevics A, Burgess KE et al. IDEOM: an Excel interface for analysis of LC-MS-based metabolomics data. Bioinformatics 2012; 28: 1048–9. [DOI] [PubMed] [Google Scholar]
- 32.Smith CA, Want EJ, O’Maille G et al. XCMS: processing mass spectrometry data for metabolite profiling using nonlinear peak alignment, matching, and identification. Anal Chem 2006; 78: 779–87. [DOI] [PubMed] [Google Scholar]
- 33.Xia J, Sinelnikov IV, Han B et al. MetaboAnalyst 3.0—making metabolomics more meaningful. Nucleic Acids Res 2015; 43: W251–7. [DOI] [PMC free article] [PubMed] [Google Scholar]
- 34.Caspi R, Billington R, Ferrer L et al. The MetaCyc database of metabolic pathways and enzymes and the BioCyc collection of pathway/genome databases. Nucleic Acids Res 2016; 44: D471–80. [DOI] [PMC free article] [PubMed] [Google Scholar]
- 35.Navon-Venezia S, Kondratyeva K, Carattoli A. Klebsiella pneumoniae: a major worldwide source and shuttle for antibiotic resistance. FEMS Microbiol Rev 2017; 41: 252–75. [DOI] [PubMed] [Google Scholar]
- 36.Derewacz DK, Goodwin CR, McNees CR et al. Antimicrobial drug resistance affects broad changes in metabolomic phenotype in addition to secondary metabolism. Proc Natl Acad Sci U S A 2013; 110: 2336–41. [DOI] [PMC free article] [PubMed] [Google Scholar]
- 37.Vincent IM, Creek D, Watson DG et al. A molecular mechanism for eflornithine resistance in African trypanosomes. PLoS Pathog 2010; 6: e1001204. [DOI] [PMC free article] [PubMed] [Google Scholar]
- 38.t’Kindt R, Scheltema RA, Jankevics A et al. Metabolomics to unveil and understand phenotypic diversity between pathogen populations. PLoS Negl Trop Dis 2010; 4: e904. [DOI] [PMC free article] [PubMed] [Google Scholar]
- 39.Gjersing EL, Herberg JL, Horn J et al. NMR metabolomics of planktonic and biofilm modes of growth in Pseudomonas aeruginosa. Anal Chem 2007; 79: 8037–45. [DOI] [PubMed] [Google Scholar]
- 40.Nandakumar M, Nathan C, Rhee KY. Isocitrate lyase mediates broad antibiotic tolerance in Mycobacterium tuberculosis. Nat Commun 2014; 5: 4306. [DOI] [PubMed] [Google Scholar]
- 41.Han M-L, Zhu Y, Creek DJ et al. Alterations of metabolic and lipid profiles in polymyxin-resistant Pseudomonas aeruginosa. Antimicrob Agents Chemother 2018; 62: e02656–17. [DOI] [PMC free article] [PubMed] [Google Scholar]
- 42.Yeom J, Shin JH, Yang JY et al. 1H NMR-based metabolite profiling of planktonic and biofilm cells in Acinetobacter baumannii 1656-2. PLoS One 2013; 8: e57730. [DOI] [PMC free article] [PubMed] [Google Scholar]
- 43.Raetz CR, Reynolds CM, Trent MS et al. Lipid A modification systems in gram-negative bacteria. Annu Rev Biochem 2007; 76: 295–329. [DOI] [PMC free article] [PubMed] [Google Scholar]
- 44.Olaitan AO, Morand S, Rolain J-M. Mechanisms of polymyxin resistance: acquired and intrinsic resistance in bacteria. Front Microbiol 2014; 5: 643. [DOI] [PMC free article] [PubMed] [Google Scholar]
- 45.Leung LM, Cooper VS, Rasko DA et al. Structural modification of LPS in colistin-resistant, KPC-producing Klebsiella pneumoniae. J Antimicrob Chemother 2017; 72: 3035–42. [DOI] [PMC free article] [PubMed] [Google Scholar]
- 46.Dortet L, Broda A, Bernabeu S et al. Optimization of the MALDIxin test for the rapid identification of colistin resistance in Klebsiella pneumoniae using MALDI-TOF MS. J Antimicrob Chemother 2020; 75: 110–6. [DOI] [PMC free article] [PubMed] [Google Scholar]
- 47.Kidd TJ, Mills G, Sá-Pessoa J et al. A Klebsiella pneumoniae antibiotic resistance mechanism that subdues host defences and promotes virulence. EMBO Mol Med 2017; 9: 430–47. [DOI] [PMC free article] [PubMed] [Google Scholar]
- 48.Bos MP, Robert V, Tommassen J. Biogenesis of the gram-negative bacterial outer membrane. Annu Rev Microbiol 2007; 61: 191–214. [DOI] [PubMed] [Google Scholar]
- 49.Kotnik M, Anderluh PS, Prezelj A. Development of novel inhibitors targeting intracellular steps of peptidoglycan biosynthesis. Curr Pharm Des 2007; 13: 2283–309. [DOI] [PubMed] [Google Scholar]
- 50.Samuel G, Reeves P. Biosynthesis of O-antigens: genes and pathways involved in nucleotide sugar precursor synthesis and O-antigen assembly. Carbohydr Res 2003; 338: 2503–19. [DOI] [PubMed] [Google Scholar]
- 51.Delcour AH. Outer membrane permeability and antibiotic resistance. Biochim Biophys Acta 2009; 1794: 808–16. [DOI] [PMC free article] [PubMed] [Google Scholar]
- 52.Holst O. The structures of core regions from enterobacterial lipopolysaccharides–an update. FEMS Microbiol Lett 2007; 271: 3–11. [DOI] [PubMed] [Google Scholar]
- 53.Kneidinger B, Marolda C, Graninger M et al. Biosynthesis pathway of ADP-l-glycero-β-d-manno-heptose in Escherichia coli. J Bacteriol 2002; 184: 363–9. [DOI] [PMC free article] [PubMed] [Google Scholar]
- 54.Dalebroux ZD. Cues from the membrane: bacterial glycerophospholipids. J Bacteriol 2017; 199: e00136–17. [DOI] [PMC free article] [PubMed] [Google Scholar]
- 55.Martinez-Morales F, Schobert M, Lopez-Lara IM et al. Pathways for phosphatidylcholine biosynthesis in bacteria. Microbiology 2003; 149: 3461–71. [DOI] [PubMed] [Google Scholar]
- 56.Geiger O, Lopez-Lara IM, Sohlenkamp C. Phosphatidylcholine biosynthesis and function in bacteria. Biochim Biophys Acta 2013; 1831: 503–13. [DOI] [PubMed] [Google Scholar]
- 57.Crompton MJ, Dunstan RH, Macdonald MM et al. Small changes in environmental parameters lead to alterations in antibiotic resistance, cell morphology and membrane fatty acid composition in Staphylococcus lugdunensis. PLoS One 2014; 9: e92296. [DOI] [PMC free article] [PubMed] [Google Scholar]
- 58.McMahon MAS, Xu J, Moore JE et al. Environmental stress and antibiotic resistance in food-related pathogens. Appl Environ Microbiol 2007; 73: 211–7. [DOI] [PMC free article] [PubMed] [Google Scholar]
- 59.Steeghs L, de Cock H, Evers E et al. Outer membrane composition of a lipopolysaccharide-deficient Neisseria meningitidis mutant. EMBO J 2001; 20: 6937–45. [DOI] [PMC free article] [PubMed] [Google Scholar]
- 60.Stincone A, Prigione A, Cramer T et al. The return of metabolism: biochemistry and physiology of the pentose phosphate pathway. Biol Rev Camb Philos Soc 2015; 90: 927–63. [DOI] [PMC free article] [PubMed] [Google Scholar]
- 61.Armenta-Medina D, Segovia L, Perez-Rueda E. Comparative genomics of nucleotide metabolism: a tour to the past of the three cellular domains of life. BMC Genomics 2014; 15: 800. [DOI] [PMC free article] [PubMed] [Google Scholar]
- 62.Tian J, Bryk R, Itoh M et al. Variant tricarboxylic acid cycle in Mycobacterium tuberculosis: identification of α-ketoglutarate decarboxylase. Proc Natl Acad Sci U S A 2005; 102: 10670–5. [DOI] [PMC free article] [PubMed] [Google Scholar]
Associated Data
This section collects any data citations, data availability statements, or supplementary materials included in this article.


