Abstract
Background
Osteoporosis is a condition that results in an increased risk of fractures due to the reduction of bone volume, which is caused by an imbalance between bone formation and bone resorption. Because of this property, fluoride has been used for over 30 years as a treatment for osteoporosis.
Objectives
To assess the efficacy of fluoride therapy on bone loss, vertebral and non‐vertebral fractures and side effects in postmenopausal women.
Search methods
We searched MEDLINE, Current Contents and the Cochrane Controlled Trial Registry up to December 1998.
Selection criteria
Two independent reviewers selected RCTs which met predetermined inclusion criteria.
Data collection and analysis
Two reviewers independently extracted data using predetermined forms and assessed the methodological quality of the trials using a validated scale. For dichotomous outcomes, relative risks (RR) were calculated and for continuous outcomes, weighted mean differences (WMD) of percentage change from baseline were calculated. Where heterogeneity existed (determined by a chi‐square test) a random effects model was used.
Main results
Eleven studies (1429 subjects) met the inclusion criteria. The increase in lumbar spine bone mineral density (BMD) was found to be higher in the treatment group than in the control group with a WMD 8.1% (95%CI: 7.15,9.09) after two years of treatment and 16.1%(95%CI: 14.65,17.5) after four years. The RR for new vertebral fractures was not significant at two years [0.87 (95%CI: 0.51,1.46)] or at four years [0.9(95%CI: 0.71,1.14)]. The RR for new non‐vertebral fractures was not significant at two years 1.2(95%CI: 0.68,2.1) but was increased at four years in the treated group 1.85(95%CI: 1.36,2.5), especially if used at high doses and in a non slow release form. The RR for gastrointestinal side effects was not significant at two years 2.18(95%CI: 0.86,1.21) but was increased at four years in the treated group 2.18(95%CI: 1.69,4.57) especially if fluoride was used at high doses and in a non slow release form. There is no evidence of an important difference in the number of withdrawals and dropouts between treated and control groups at two and four years.
Authors' conclusions
Although fluoride has an ability to increase BMD at lumbar spine, it does not result in a reduction of vertebral fractures. In increasing the dose of fluoride, one increases the risk of non‐vertebral fracture and gastrointestinal side effects without any effect on the vertebral fracture rate.
Plain language summary
Fluoride can increase bone mineral density at the lumbar spine, it does not reduce vertebral fractures.
When considering that other therapies have been shown to reduce vertebral fracture rates, fluoride may not be the first choice of therapy for the treatment and prevention of osteoporotic fractures. The evidence showed an increase risk of gastrointestinal side effects and non vertebral fractures with fluoride.
Background
Osteoporosis is a condition that results in an increased risk of fractures due to the reduction of bone volume, which is caused by an imbalance between bone formation and bone resorption. It is defined as a disease characterized by low bone mass with micro‐architectural deterioration of bone tissue leading to increased bone fragility and consequent increase in fracture risk (CDC 1994). Because of the aging of the general population, osteoporosis is a significant public health problem (Papadimitroupoulos). Furthermore the burden of osteoporotic fractures, in terms of pain, disability and mortality represents a large cost to society (Goeree 1996).
Fluoride is known to stimulate osteoblast activity in humans in contrast to most other drugs used for the prevention and treatment of osteoporosis which inhibit bone resorption (Merz 1981). Because of this property, fluoride has been used for over 30 years as a treatment for osteoporosis (Rich 1961). Histomorphometric studies suggest that although fluoride increases bone mineral density (BMD), there is a corresponding decrease in elasticity and strength of the bone tissue (Aaron 1991), and fluoride is thought to alter the crystalline structure of the bone tissue (Eriksen 1985). The ability of fluoride to increase BMD has been shown in several randomized controlled trials, as well as a recent systematic review by the National Osteoporosis Foundation (NOF 1998). However, other studies have demonstrated an increase in periarticular pain due to stress fractures (Orcel 1990, Schnitzler 1985) and an increase in the non‐vertebral fracture rate with fluoride therapy (Riggs 1994). These side‐effects are thought to be related to the type and dosage of fluoride (van Kesteren 1982).
Objectives
The purpose was to examine the effects of fluoride for the treatment and prevention of postmenopausal osteoporosis in women, with emphasis on the effects of different dosages and types of fluoride.
Methods
Criteria for considering studies for this review
Types of studies
According to an a priori protocol, we included studies which fulfilled the following eligibility criteria: randomized clinical trials involving women with primary osteoporosis in which the intervention was fluoride in any form or dosage. For practical reasons, studies published in languages other than English, French or German were not included in the analysis but they were retrieved for further translation. For duplicate or complementary reports of the same trial, the most complete results were used.
Types of participants
We included trials of women with primary osteoporosis.
Types of interventions
We accepted trials of fluoride in any form or dosage, compared to a control group. Acceptable control groups included calcium and vitamin D combinations, if they were given in equal doses to both the control and treatment groups.
Types of outcome measures
Outcome measures included vertebral or non‐vertebral fractures, BMD (at any site), pain or height. The selection of outcome measures was based on the consensus report of OMERACT 3 which defined a potential core set of outcomes for osteoporosis (Wells 1997). Biochemical markers were not considered as outcomes for this meta‐analysis (Delmas 1993). Where possible, toxicity was analyzed by considering total withdrawals due to adverse reactions and withdrawals for system specific side effects. Individual patient and overall measures of side effects were tabulated, including gastrointestinal side effects (nausea, vomiting, gastritis, diarrhea, gastrointestinal irritation or bleeding) and musculoskeletal side effects (pain and stress fractures). Withdrawals and dropouts were analyzed both overall and for those due to side effects.
Search methods for identification of studies
We searched MEDLINE from January 1966 up to January 1998, the Cochrane Controlled Trials Register (CCTR), Issue 1, 1998 and Current Contents back for six months prior to Jan 1998, using the sensitive search strategy for randomized controlled trials (RCT) recommended by the Cochrane Collaboration Musculoskeletal Group (Haynes 1994). The key words used for this search are described in the appendix and included fluoride, monofluorophosphate, fluoridation, osteoporosis, fractures, bone density and bone loss. Since not all trials are indexed on these electronic data bases, we conducted a hand search of the reference sections of each of the articles retrieved by these searches. We also contacted experts in the field of osteoporosis for help in identifying additional missed studies, unpublished studies, conference proceedings and abstracts.
Data collection and analysis
Two independent reviewers extracted the data, from the original articles (DH, SM). In case of disagreement, a third reviewer (VW) helped reach consensus after consulting the original article. Data extraction was performed using a pre‐established form which included aspects of the study design and methodology, intervention characteristics, participant characteristics, adverse events, outcome measures and quality assessment.
Where possible, the mean percent of baseline and the corresponding standard deviation were extracted. In several studies these values were not directly available. Letters were sent to three authors for additional data, and one author of two trials replied (Riggs 1982, Riggs 1990). If only the initial and final bone density was presented, a Taylor's series expansion was used to approximate the standard deviation of the percent change, based on the mean and standard deviation of the initial and final bone density.
Studies with the same comparator were considered together in the meta‐analysis. Relative risks (RR) were calculated for dichotomous outcomes such as fractures. For continuous outcomes such as BMD, weighted mean differences (WMD) were calculated. Fixed effects models were used throughout, but random effect models were used for outcomes with significant heterogeneity. Side effects were tabulated and assessed using relative risks. All results using chi square test for heterogeneity were significant if p<0.05.
We investigated whether the differences between individual trials were greater than expected by chance using the Cochran's Q test for heterogeneity (Fleiss 1993). We explored significant heterogeneity using two approaches. First, we conducted an influence analysis in which we assessed whether only one study was responsible for the heterogeneity, by removing each study from the analysis. If only one study led to heterogeneity, we separated the results from the pooled analysis and considered them separately. If more than one study led to heterogeneity, we used a random effects model to present the overall results.
We then explored whether the following factors explained heterogeneity by comparing subgroups: 1) fluoride dosage (low or high dose of fluoride); 2) type of fluoride (monofluorophosphate or sodium fluoride); 3) type and dose of comparator (low dose calcium < 500 mg/day), high dose calcium (>500 mg/day), vitamin D or hormone replacement therapy); 4) inclusion of males; 5) methodological quality (<3 versus > 3); and 6) slow‐release and enteric coated formulations. Low dose fluoride was defined as less than 30 mg of elemental fluoride, based on clinical experience (Bardin 1995). The elemental fluoride of sodium fluoride preparations was calculated by the rule: 2.2 mg sodium fluoride are equivalent to 1 mg elemental fluoride. Elemental fluoride composition of MFP was generally given in the corresponding articles.
Results
Description of studies
A total of 752 references were identified using the search strategy in MEDLINE. A further 39 were identified in the CCTR search list. Three additional references were found by searching the reference sections and updating the search strategy. Of these, we retrieved the full articles of 44 studies which appeared to meet the inclusion criteria (Figure 1).
Eleven RCTs met the eligibility criteria for this review (Christiansen 1980, Gambacciani 1995, Grove 1981, Hansson 1987, Kleerekoper 1991, Meunier 1998, Pak 1995, Pak 1995, Reginster 1998, Riggs 1982, Riggs 1990, Sebert 1995). One of these studies (Sebert 1995) included males in its study population, but the men accounted for less than 10% of the population. Therefore this study was included in the analysis and a subgroup analysis was conducted on inclusion of males.
A total of 32 trials were not randomized or did not meet the criteria regarding the intervention group, the control group, the population or the outcomes. Of the excluded trials, 11 were not randomized controlled clinical trials (Dambacher 1976, Dambacher 1986, Harrison 1981, Inkovaara 1973, Inkovaara 1975, Jowsey 1971, Kuntz 1984, Lundy 1995, Pouilles 1991, Power 1986, Resch 1994), nine were retrospective cohort or cross‐sectional studies (Affinito 1993, Antich 1993, Dure‐Smith 1996, Franke 1974, Jowsey 1972, Jowsey 1975, Resch 1993, Riggs 1973, Zerwekh 1994), six had only histological or biochemical outcomes (Battmann 1997, Eriksen 1985, Erlacher 1994, Gron 1966, Stamp 1990, Zerwekh 1997), two trials compared two active interventions with no placebo group (Hedlund 1989,Mamelle 1988), three trials used only men (Ringe 1987, Ringe 1998, Vose 1978) and one was a non‐randomized follow‐up of an earlier RCT (Riggs 1994). The other trial was written in Japanese and has not been translated (Takizawa 1980). This trial randomized 87 patients to eight groups with various combinations of sodium fluoride (50 mg), estriol, calcium, vitamin D and one untreated group. After 12 months, significant increases in forearm bone density were found for NaF in combination with calcium and vitamin D as well as for estriol and calcium alone.
The included trials are described in Table 1. The studies included 702 and 727 patients in the intervention and placebo groups, respectively. The women in these trials were all defined as osteoporotic, according to the definition of osteoporosis at the time of the trials (presence of vertebral fractures in earlier trials and low BMD in more recent trials).
Seven trials used sodium fluoride (Na F), three used monofluorophosphate (MFP) and one used both types of fluoride. Two used high dosages of fluoride. All trials used doses of calcium ranging from 400 to 2000 mg per day as an associated treatment. Of these, five used low dose calcium (< 500 mg) and three used high doses (>1000 mg/day) . In general, the trials with low dose fluoride also used low dose calcium, with the exception of one study (Hansson). One used enteric‐coated fluoride and another used slow release fluoride . Only three used vitamin D. One study included a small proportion of men. Three trials included some women taking hormone replacement therapy . Of these, one study was stratified on HRT, one was not and the Riggs 1982 study, HRT was one of the randomized groups. Christiansen 1980 used three placebo groups to maintain the blinding for ten treatment arms. We considered this trial as two separate trials (one used calcium alone and the other calcium plus vitamin D).
Because the most common study duration was 24 and 48 months, all outcomes were analyzed at these two time points, and when possible, two year data were extracted from the four year studies. Since the differential effect of osteoporosis treatment over time has been shown in a previous meta‐analysis (Mackerras 1997), we decided not to combine outcomes for different treatment durations. The fracture and withdrawal data of one three‐year trial were pooled with four year data. Only one trial was shorter than 24 months (12 weeks) (Grove 1981), and it was analyzed separately.
One trial achieved the lowest quality score (1), seven trials scored two points, and two trials scored four points. One of the included trials achieved the highest score of five. The median quality score of the included trials was two.
Risk of bias in included studies
Two independent reviewers (DH, SM), using a validated quality assessment instrument (Jadad 1996), assessed the methodological quality of each trial including the quality of randomization, blinding and reporting of withdrawals. The score was given as follows: if the study was described as randomized, one point; if the study was described as double blinded, one point; if there was a description of withdrawals and dropouts, one point; if the method of randomization was described and appropriate, one point ; if the method of double blinding was described and appropriate, one point ; if the method of randomization was not appropriate or if the method of blinding was not appropriate, deduct one point. Differences were resolved by consensus. If needed, a third reviewer was consulted (BS). Quality assessment was not used as a criterion for including studies.
Effects of interventions
BONE MINERAL DENSITY PERCENT OF BASELINE Bone density was increased in the fluoride group at the lumbar spine. The weighted mean difference at this site at two years was WMD 8.1 % (95% CI: 7.15, 9.09) and at four years, WMD 16.1% (95% CI: 14.65, 17.5)(random effects model). At the hip at two years the WMD was 3.4% (95% CI: ‐0.17, 6.91) (random effects model) and at four years it was 5.4% (95% CI: ‐3.01, 13.93) (random effect model). At the forearm, the fluoride treated group had lower bone density at both two and four years, with WMD of ‐1.7% (95% CI: ‐3.09, ‐3.33) and ‐3.3%(95% CI: ‐6.19, ‐0.46) (random effect model), respectively. The data for total body and trochanter BMD were available in single studies. The WMD difference was in favour of fluoride at both sites: 7.1% (95% CI: 1.06, 13.14) for total body and 15.6% (95% CI: 13.03, 18.18) for femoral trochanter.
Heterogeneity was significant for the lumbar spine at both two and four years. For the analysis at two years, the Riggs 1990 trial (Riggs 1990) led to the heterogeneity. This trial used high doses of both fluoride and calcium. The sensitivity analysis for fluoride dosage indicated that dosage could be an explanation for this heterogeneity with a WMD 8.1% (95% CI: 7.1, 9.1) for low doses of fluoride and WMD 20.5% (95% CI: 18.5, 22.6) for high doses. The sensitivity analysis on calcium dosage led to a similar result, mostly due to the fact that trials which used low dose calcium also used low dose fluoride. In the low calcium dose subgroup analysis the WMD was 8.1% (95% CI: 7.0, 9.1). It was 20.1% (95% CI: 18.1, 22.1) in the high calcium dose subgroup analysis. For the four year analysis none of the three trials (Pak 1995, Reginster 1998, Riggs 1990, Sebert 1995), alone, could explain the heterogeneity. The included trials and their distribution between high or low dose fluoride and presence or absence of concurrent HRT (as well as the statistical results) were identical. High dose fluoride, as well as absence of HRT, showed a difference in spine BMD of 36.9% (95% CI: 33.7, 40.01) compared to a WMD of 13.8% (95% CI: 5.8, 21.8) for the two studies with low dose fluoride and presence of HRT. The study with a calcium dose of 1500 mg found a larger increase in spine BMD of 36.9% (95% CI: 33.7, 40.01) compared to a WMD of 10.8% (95% CI: 9.2, 12.4) for calcium 500‐1000 mg per day. Here again, the included studies and their distribution between NaF or MFP and low or high quality score as well as the statistical results were identical. The WMD was higher in the NaF low quality subgroup 28.15% (95%CI: 10.2, 45.9) than in the MFP/high quality subgroup 10.4% (95% CI: 8.8, 12.0).
FRACTURES
The overall analysis did not demonstrate a significant difference in the pooled relative risk for vertebral fractures: RR 0.87 (95% CI: 0.51, 1.46) at two years (4 RCTs, N=742) and 0.90 (95% CI: 0.71, 1.14) at four years with 5 RCTs and a total of 646 patients randomized. Significant heterogeneity could not be explained by any subgroup analyses at two years. However, the subgroup analysis at four years showed that the dose of calcium, dose of fluoride, and concurrent HRT treatment were significant. The trials which used low dose fluoride also used low‐dose calcium (Pak 1995, Pak 1995, Reginster 1998), with the exception of (Hansson 1987) where 1000 mg/day of calcium was classified as high dose for this comparison. Low dose calcium and low dose fluoride were associated with a reduced risk of fracture (RR 0.29 (95%CI: 0.14, 0.58), and there was no evidence of an important effect of higher dose of fluoride and calcium, compared to placebo (RR 1.0 (95%CI: 0.8, 1.3). For the three trials where HRT was allowed in some women (i.e. not an exclusion criteria)(Pak 1995, Pak 1995, Reginster 1998, Riggs 1982), the pooled fluoride arm demonstrated a reduction in vertebral fractures with a RR 0.30 (95%CI: 0.15, 0.71). There was no statistical difference between fluoride and the control group for height with a WMD 0.36 (95%CI: ‐0.10, 0.82).
For non‐vertebral fractures, the relative risk was not significantly different from placebo at two years (RR 1.20 (95%CI: 0.68, 2.10). No subgroup analysis led to different results. However, at four years, the relative risk of non vertebral fractures was increased with fluoride with a RR 1.85 (95%CI: 1.36, 2.50). However, the relative risk of non vertebral fracture was not significantly different than placebo for low‐dose fluoride, low dose calcium (as for vertebral fractures, the trials with high dose fluoride also used high dose calcium), high quality trials, use of HRT or use of slow released fluoride.
WITHDRAWALS AND SIDE EFFECTS Overall, 19% of patients in these trials withdrew from the study by the end of two years and 28% by the end of four years. Fluoride withdrawals were not statistically different from control with a RR 1.0 (95%CI: 0.64, 1.56) at two years and 1.0 (95%CI: 0.78, 1.29) at four years.
At two years, there was no significant increase in the risk of gastrointestinal side effects, including dyspepsia, nausea, diarrhea, and vomiting with a RR of 1.02 (95% CI: 0.86, 1.21) and no significant heterogeneity. No subgroup analyses were significant. At four years, the fluoride group was at a higher risk for GI side effects with an RR of 2.18 (95%CI: 1.69, 4.57). The risk for GI side effects was not statistically different when compared to placebo for low dose fluoride as well as low dose calcium (which correspond to the same studies), presence of HRT in the treatment groups, high quality and slow‐release fluoride.
Lower limb pain syndrome was significantly increased with fluoride with a RR of 3.5 (95%CI: 1.74, 7.04) without heterogeneity at two years but at 3.11 (95%CI: 0.81, 11.87) at four years with significant heterogeneity (chi‐square =21.9, df=3). This heterogeneity is likely due to the wide variety of definitions of lower limb pain. Because of doubt about clinical relevance and similarity of these various definitions, no subgroup analyses were attempted.
Discussion
In this meta‐analysis we found that fluoride increased the bone mineral density without any efficacy on the incidental vertebral fractures. Since no trial compared fluoride to placebo without calcium, it is more difficult to assess the true effect of fluoride on BMD or fractures. Furthermore, the subgroup analysis conducted on dosage of calcium provided different results than the overall analysis. This meta‐analysis confirmed the well‐known increase in lumbar BMD with fluoride (Hansson 1987). The heterogeneity in this outcome is easily explained by the presence of Riggs's trial (Riggs 1990) in which fluoride was used at high dose, as shown in the subgroup analysis on fluoride or calcium dosage. Forearm bone density was actually lower in the fluoride groups at both two and four years. Since the forearm has a different composition of trabecular and cortical tissue, this differential effect might be expected. There was no effect of fluoride on BMD at the femoral neck. Furthermore, the measurement of BMD at forearm is now more precise and changes at this site may be detected. By comparison, the measurement at the hip is less precise. A greater number of patients may be needed to show differences.
Fluoride showed no effect on vertebral fracture rate, neither after two years of treatment nor after four years. At the two years period, the subgroup analysis did not show any different results. But, at four years there was a statistically significant reduction in the risk with 1) low dose fluoride; 2) presence of HRT in the treatment groups; 3) use of a slow‐release formulation and 4) low dose calcium. The effects of the dosage of calcium and fluoride cannot be determined independently in this meta‐analysis, as low dose fluoride was always administered with low dose calcium with the exception of one small trial (Hansson 1987). As Shea et al have shown, (Shea 1999), calcium has a small but significant effect on bone loss and the magnitude of the reduction in fracture risk due to calcium alone remains uncertain. We would suggest that most of the effect on fracture risk was attributable to fluoride and that both fluoride and calcium were required to reduce the risk of vertebral fracture. Furthermore, the effects of HRT cannot be determined independently, as it is present in the two largest trials with low dose calcium and fluoride (Pak 1995, Pak 1994a, Reginster 1998). The positive effect on vertebral fractures was significant in only one trial (and two publications) by Pak (Pak 1995, Pak 1994a). This trial used a low dose, slow‐release, sodium fluoride, with low dose calcium (500 mg/day) and allowed the presence of HRT in the treatment groups. For the women taking HRT, there was no difference between fluoride and control (75% in 16 vs 76.9% in 13). In contrast, in the women not taking HRT, there was a higher vertebral fracture‐free rate in the fluoride compared to the control group (85.7% in 35 vs 60% in 35 which is significant).
A possible explanation for the lack of effect of high dose fluoride on non vertebral fracture rates is that fluoride increases the thickness of bone, but decreases bone quality (Aaron 1991). Therefore, fluoride would not be expected to prevent fractures, but would increase bone density. The most plausible explanation of the differential effect of different doses of fluoride is that high dose and non‐enteric coated fluoride have twice the under curve surface, which leads to toxic concentrations of fluoride in the bone tissue (Sakhaee 1991). Patients treated for four years with such high doses of fluoride could have a toxic bone concentrations of fluoride which could modify both trabecular and compact bone leading to an increase in both the non vertebral and vertebral fracture rate (Lees 1992). Height is known to be a responsive endpoint for osteoporosis (Cranney 1999) and it is correlated with the number of crushed vertebrae. Therefore, it is not surprising that the results about the effect on height in our analysis went in the same direction as the results on vertebral fracture.
Furthermore, low dose calcium and fluoride (as well as the uncontrolled presence of HRT) were not associated with an increased risk of non vertebral fractures or GI side effects. In contrast, high doses of fluoride and concurrent calcium were associated with an increased risk of non vertebral fractures and GI side effects.
Heterogeneity was significant for bone density and fracture outcomes. The main differences between studies could be explained by the dose of concurrent calcium and the dose of fluoride. Unfortunately, since the same trials with high‐dose fluoride also used a high dose of calcium, it is impossible to determine which factors are responsible for the differential effect with lower dosages.
By using percentage change of BMD, we attempted to control for different machines, baseline BMD and assessment methods (Faulkner 1996). We were able to use figures to extrapolate the mean % change at two and four years. This technique increases the sample size, at the risk of inaccurate results. In one case (Riggs 1990), we received the numerical data in tabular form from the author and found the estimated values from the graph were within 4% of the results provided by the author.
All participants had established osteoporosis defined by either low BMD or prevalent fractures. A subgroup analysis conducted on the definition of osteoporosis (incident fractures versus BMD criteria) demonstrated no significant difference in the effect on vertebral fractures, non vertebral fractures or lumbar BMD at two or four years. In one study (Sebert 1995), the population included 4% men. We found no difference in the results of this trial compared to the pooled analysis for any outcome. Duration of treatment was not explored as an explanation of the differences between the trials since the effect of time on bone mineral density measurement has been demonstrated by Mackerras et al (Mackerras 1997). Therefore, data was analyzed separately at two major endpoints: two and four years. The results of this meta‐analysis suggest that the difference in bone density is higher after four years than after two years of treatment, confirming longitudinal follow‐up studies which have also demonstrated this (Pak 1995, Riggs 1994).
Some of the between‐trial differences for lower limb pain are likely due to different definitions of lower limb pain which included "lower extremity pain", "joint pain", "lower limb pain" and "osteoarticular minor manifestation". Although differences existed between trials, fluoride was associated with significantly more lower limb pain in this meta‐analysis, but subgroup analysis were not attempted due to uncertainty about the clinical similarity of the various definitions of this outcome. Some histomorphometric studies (Boivin 1991) have confirmed that the accumulation of fluoride in certain bone sites worsens microfractures due to fluoride‐induced hyperosteoidosis, which interferes with the normal bone healing processes. It is now widely recognized that the lower limb pain syndrome (Orcel 1990) is related to the presence of bone fissures. This was confirmed in the study by Meunier et al (Meunier 1998), where lower limb pain syndrome was related to the presence of radiological evidence of microfractures or fractures on bone scintigraphy. Since high dose fluoride was associated with an increased risk of non vertebral and vertebral fractures, it is not surprising that a high rate of fluoride‐associated lower limb pain was reported by the Riggs et al 1990 (Riggs 1990) study which used a high fluoride dose. We were unable to validate previous hypotheses that lower limb pain is more frequent with NaF than MFP (Delmas 1990).
Sodium fluoride, especially at high doses and in a non‐enteric coated form, is converted to fluoric acid and adheres on the gastric wall (Muller 1992). Therefore, the enteric‐coated sodium fluoride should cause less gastrointestinal side effects than plain sodium fluoride. In our analysis we have shown that there was no difference between treated and controlled patients when considering the gastrointestinal minor side effects. At two years, no subgroup analyses were significant, including those examining the type of fluoride and enteric preparation. The slow‐release formulation was associated with a lower risk for GI side effects at four years. At four years, the high dose fluoride was associated with a significantly higher risk compared to placebo, in contrast to the low dose trials.
In this meta‐analysis of 11 RCTs, including 1429 patients, on the efficacy and side effects of fluoride in the postmenopausal osteoporosis, we can conclude that fluoride increases significantly the BMD at the lumbar spine after two and four years of treatment. The number of patients with a new vertebral fracture was not different from placebo after two or four years of fluoride treatment, but the concurrent use of HRT and/or of low fluoride doses led to better results for fluoride. Furthermore there was no evidence that the use of MFP versus NaF affected the RR. The RR of non‐vertebral fracture was not influenced by fluoride after two years of treatment. After four years of treatment, the risk of non‐vertebral fractures was increased, except in the case of the use of HRT, low fluoride doses and/or slow released fluoride. At two years, the frequency of GI side effects was not influenced by fluoride but after four years of treatment the results were different with an increased risk of GI side effect, except when HRT, low fluoride doses and slow released fluoride were used. In conclusion, fluoride increases BMD without any evidence of important impact on vertebral fracture rate. This occurs even if the use of low doses or of slow released fluoride does not increase the risk of non‐vertebral fracture (or GI side effects). Considering that other therapies, such as estrogens, raloxifene (Ettinger 1999) and bisphosphonates, have been shown to reduce vertebral fracture rates (NOF 1998), fluoride may not be the first choice of therapy for the treatment or prevention of osteoporotic fractures.
Authors' conclusions
Implications for practice.
Considering that other therapies, such as estrogens, raloxifene and bisphosphonates, have been shown to reduce vertebral fracture rates (NOF), fluoride may not be the first choice of therapy for the treatment or prevention of osteoporotic fractures.
Implications for research.
Although fluoride increases bone mineral density, the evidence from randomized controlled trials shows that fluoride does not reduce the risk of vertebral fractures. This conclusion was consistent for both monofluorophosphate and sodium fluoride. Furthermore, we found evidence of increased risk of gastrointestinal side effects and non vertebral fractures with fluoride.
What's new
| Date | Event | Description |
|---|---|---|
| 17 September 2008 | Amended | Converted to new review format. C038‐R |
Acknowledgements
The authors would like to Dr. Riggs who provided the numerical results of his 1990 and 1982 trials. Thanks to Michelle Losos and Sonia Mirmiran for assistance with the document, the CMSG editorial team for their helpful comments and suggestion and Dr. Ann Cranney and Candyce Hamel for their editorial comments.
Data and analyses
Comparison 1. Fluoride vs Placebo ‐ Overall.
| Outcome or subgroup title | No. of studies | No. of participants | Statistical method | Effect size |
|---|---|---|---|---|
| 1 No. People with new vertebral fractures ‐ 2 years | 4 | 742 | Peto Odds Ratio (Peto, Fixed, 95% CI) | 0.95 [0.68, 1.32] |
| 2 No. People with new vertebral fractures ‐ 4 years | 5 | 646 | Peto Odds Ratio (Peto, Fixed, 95% CI) | 0.64 [0.43, 0.94] |
| 3 Forearm BMD/C % 2 years from baseline | 2 | 233 | Mean Difference (IV, Fixed, 95% CI) | ‐1.90 [‐3.45, ‐0.35] |
| 4 Forearm BMD/C% 4 years from baseline | 2 | 268 | Mean Difference (IV, Fixed, 95% CI) | ‐3.49 [‐4.79, ‐2.20] |
| 5 Total body BMD% from baseline | 1 | 42 | Mean Difference (IV, Fixed, 95% CI) | 7.10 [1.06, 13.14] |
| 6 Legs BMD % from baseline | 1 | 42 | Mean Difference (IV, Fixed, 95% CI) | 6.5 [‐0.87, 13.87] |
| 7 Arms BMD % from baseline | 1 | 42 | Mean Difference (IV, Fixed, 95% CI) | 9.0 [2.59, 15.41] |
| 8 Femoral trochanter BMD % from baseline 4 years | 1 | 191 | Mean Difference (IV, Fixed, 95% CI) | 15.61 [12.98, 18.24] |
| 9 Pain mobility score‐ change from baseline | 1 | 22 | Mean Difference (IV, Fixed, 95% CI) | 2.23 [0.59, 3.87] |
| 10 Best available hip % from baseline 2 years | 3 | 650 | Mean Difference (IV, Fixed, 95% CI) | 2.65 [1.93, 3.38] |
| 11 Best available hip % from baseline 4 years | 2 | 393 | Mean Difference (IV, Fixed, 95% CI) | 3.42 [2.62, 4.22] |
| 12 Height % from baseline 4 years | 2 | 194 | Mean Difference (IV, Fixed, 95% CI) | 0.36 [‐0.10, 0.82] |
| 13 Lumbar BMD % from baseline 2 years | 7 | 907 | Mean Difference (IV, Fixed, 95% CI) | 10.38 [9.50, 11.25] |
| 14 Lumbar BMD % from baseline 4 years | 3 | 500 | Mean Difference (IV, Fixed, 95% CI) | 16.04 [14.61, 17.47] |
1.1. Analysis.

Comparison 1 Fluoride vs Placebo ‐ Overall, Outcome 1 No. People with new vertebral fractures ‐ 2 years.
1.2. Analysis.
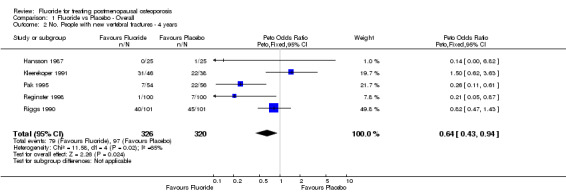
Comparison 1 Fluoride vs Placebo ‐ Overall, Outcome 2 No. People with new vertebral fractures ‐ 4 years.
1.3. Analysis.

Comparison 1 Fluoride vs Placebo ‐ Overall, Outcome 3 Forearm BMD/C % 2 years from baseline.
1.4. Analysis.

Comparison 1 Fluoride vs Placebo ‐ Overall, Outcome 4 Forearm BMD/C% 4 years from baseline.
1.5. Analysis.

Comparison 1 Fluoride vs Placebo ‐ Overall, Outcome 5 Total body BMD% from baseline.
1.6. Analysis.

Comparison 1 Fluoride vs Placebo ‐ Overall, Outcome 6 Legs BMD % from baseline.
1.7. Analysis.

Comparison 1 Fluoride vs Placebo ‐ Overall, Outcome 7 Arms BMD % from baseline.
1.8. Analysis.

Comparison 1 Fluoride vs Placebo ‐ Overall, Outcome 8 Femoral trochanter BMD % from baseline 4 years.
1.9. Analysis.

Comparison 1 Fluoride vs Placebo ‐ Overall, Outcome 9 Pain mobility score‐ change from baseline.
1.10. Analysis.

Comparison 1 Fluoride vs Placebo ‐ Overall, Outcome 10 Best available hip % from baseline 2 years.
1.11. Analysis.

Comparison 1 Fluoride vs Placebo ‐ Overall, Outcome 11 Best available hip % from baseline 4 years.
1.12. Analysis.

Comparison 1 Fluoride vs Placebo ‐ Overall, Outcome 12 Height % from baseline 4 years.
1.13. Analysis.
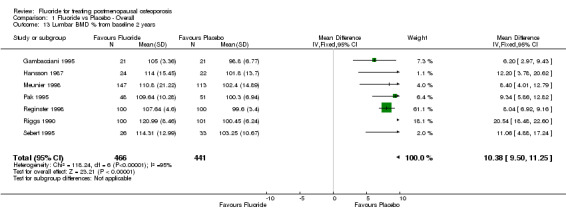
Comparison 1 Fluoride vs Placebo ‐ Overall, Outcome 13 Lumbar BMD % from baseline 2 years.
1.14. Analysis.

Comparison 1 Fluoride vs Placebo ‐ Overall, Outcome 14 Lumbar BMD % from baseline 4 years.
Comparison 2. Side effects.
| Outcome or subgroup title | No. of studies | No. of participants | Statistical method | Effect size |
|---|---|---|---|---|
| 1 GI Minor Overall | 9 | 1145 | Peto Odds Ratio (Peto, Fixed, 95% CI) | 1.56 [1.15, 2.11] |
| 2 GI minor overall 2 years | 4 | 536 | Peto Odds Ratio (Peto, Fixed, 95% CI) | 1.04 [0.71, 1.51] |
| 3 GI minor overall 4 years | 4 | 559 | Peto Odds Ratio (Peto, Fixed, 95% CI) | 3.17 [1.87, 5.39] |
| 4 GI Minor Nausea | 1 | 28 | Peto Odds Ratio (Peto, Fixed, 95% CI) | 1.0 [0.06, 16.85] |
| 5 GI Minor pain | 1 | 60 | Peto Odds Ratio (Peto, Fixed, 95% CI) | 1.21 [0.36, 4.10] |
| 6 GI Minor Dyspepsia | 1 | 28 | Peto Odds Ratio (Peto, Fixed, 95% CI) | 1.0 [0.06, 16.85] |
| 7 GI major Overall | 2 | 252 | Peto Odds Ratio (Peto, Fixed, 95% CI) | 0.89 [0.35, 2.28] |
2.1. Analysis.
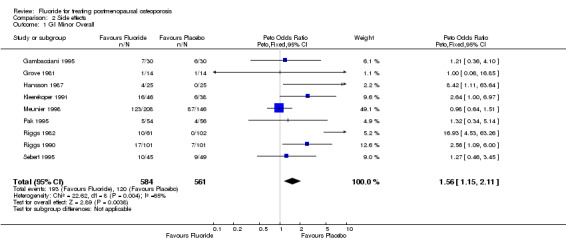
Comparison 2 Side effects, Outcome 1 GI Minor Overall.
2.2. Analysis.

Comparison 2 Side effects, Outcome 2 GI minor overall 2 years.
2.3. Analysis.

Comparison 2 Side effects, Outcome 3 GI minor overall 4 years.
2.4. Analysis.

Comparison 2 Side effects, Outcome 4 GI Minor Nausea.
2.5. Analysis.

Comparison 2 Side effects, Outcome 5 GI Minor pain.
2.6. Analysis.

Comparison 2 Side effects, Outcome 6 GI Minor Dyspepsia.
2.7. Analysis.

Comparison 2 Side effects, Outcome 7 GI major Overall.
Comparison 3. Number of patients with new nonvertebral fractures.
| Outcome or subgroup title | No. of studies | No. of participants | Statistical method | Effect size |
|---|---|---|---|---|
| 1 Nonvertebral fractures overall | 5 | 950 | Peto Odds Ratio (Peto, Fixed, 95% CI) | 1.96 [1.39, 2.75] |
| 2 Pelvis 4 years | 2 | 312 | Peto Odds Ratio (Peto, Fixed, 95% CI) | 4.69 [1.15, 19.09] |
| 3 Proximal Femur 4 years | 1 | 202 | Peto Odds Ratio (Peto, Fixed, 95% CI) | 2.73 [0.95, 7.79] |
| 4 Hip 2 years | 1 | 354 | Peto Odds Ratio (Peto, Fixed, 95% CI) | 1.39 [0.27, 7.16] |
| 5 Foot 2 years | 1 | 354 | Peto Odds Ratio (Peto, Fixed, 95% CI) | 0.35 [0.03, 3.49] |
| 6 Tibia 2 years | 1 | 354 | Peto Odds Ratio (Peto, Fixed, 95% CI) | 5.48 [0.10, 293.94] |
| 7 Humerus 4 years | 3 | 422 | Peto Odds Ratio (Peto, Fixed, 95% CI) | 2.20 [0.51, 9.51] |
| 8 Wrist 2 years | 1 | 354 | Peto Odds Ratio (Peto, Fixed, 95% CI) | 0.87 [0.23, 3.34] |
| 9 Rib 2 years | 1 | 354 | Peto Odds Ratio (Peto, Fixed, 95% CI) | 1.05 [0.18, 6.31] |
| 10 Fissures or microfractures | 4 | 608 | Peto Odds Ratio (Peto, Fixed, 95% CI) | 4.57 [2.31, 9.05] |
| 11 Bone spurs | 1 | 202 | Peto Odds Ratio (Peto, Fixed, 95% CI) | 0.74 [0.17, 3.35] |
| 12 Traumatic fractures | 1 | 110 | Peto Odds Ratio (Peto, Fixed, 95% CI) | 1.04 [0.06, 16.81] |
| 13 Non vertebral fracture overall 2 years | 1 | 354 | Peto Odds Ratio (Peto, Fixed, 95% CI) | 1.22 [0.65, 2.30] |
| 14 Non vertebral fracture overall 4 years | 4 | 596 | Peto Odds Ratio (Peto, Fixed, 95% CI) | 2.38 [1.59, 3.58] |
| 15 Rib 4 years | 3 | 512 | Peto Odds Ratio (Peto, Fixed, 95% CI) | 1.33 [0.57, 3.11] |
| 16 Hip 4 years | 2 | 310 | Peto Odds Ratio (Peto, Fixed, 95% CI) | 0.52 [0.05, 5.00] |
| 17 Wrist 4 years | 3 | 512 | Peto Odds Ratio (Peto, Fixed, 95% CI) | 1.00 [0.35, 2.90] |
| 18 Foot 4 years | 3 | 512 | Peto Odds Ratio (Peto, Fixed, 95% CI) | 2.19 [0.81, 5.98] |
| 19 Tibia 4 years | 1 | 202 | Peto Odds Ratio (Peto, Fixed, 95% CI) | 8.30 [2.59, 26.57] |
3.1. Analysis.
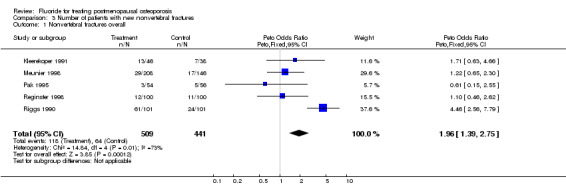
Comparison 3 Number of patients with new nonvertebral fractures, Outcome 1 Nonvertebral fractures overall.
3.2. Analysis.

Comparison 3 Number of patients with new nonvertebral fractures, Outcome 2 Pelvis 4 years.
3.3. Analysis.

Comparison 3 Number of patients with new nonvertebral fractures, Outcome 3 Proximal Femur 4 years.
3.4. Analysis.

Comparison 3 Number of patients with new nonvertebral fractures, Outcome 4 Hip 2 years.
3.5. Analysis.

Comparison 3 Number of patients with new nonvertebral fractures, Outcome 5 Foot 2 years.
3.6. Analysis.

Comparison 3 Number of patients with new nonvertebral fractures, Outcome 6 Tibia 2 years.
3.7. Analysis.

Comparison 3 Number of patients with new nonvertebral fractures, Outcome 7 Humerus 4 years.
3.8. Analysis.

Comparison 3 Number of patients with new nonvertebral fractures, Outcome 8 Wrist 2 years.
3.9. Analysis.

Comparison 3 Number of patients with new nonvertebral fractures, Outcome 9 Rib 2 years.
3.10. Analysis.

Comparison 3 Number of patients with new nonvertebral fractures, Outcome 10 Fissures or microfractures.
3.11. Analysis.

Comparison 3 Number of patients with new nonvertebral fractures, Outcome 11 Bone spurs.
3.12. Analysis.

Comparison 3 Number of patients with new nonvertebral fractures, Outcome 12 Traumatic fractures.
3.13. Analysis.

Comparison 3 Number of patients with new nonvertebral fractures, Outcome 13 Non vertebral fracture overall 2 years.
3.14. Analysis.

Comparison 3 Number of patients with new nonvertebral fractures, Outcome 14 Non vertebral fracture overall 4 years.
3.15. Analysis.

Comparison 3 Number of patients with new nonvertebral fractures, Outcome 15 Rib 4 years.
3.16. Analysis.

Comparison 3 Number of patients with new nonvertebral fractures, Outcome 16 Hip 4 years.
3.17. Analysis.

Comparison 3 Number of patients with new nonvertebral fractures, Outcome 17 Wrist 4 years.
3.18. Analysis.

Comparison 3 Number of patients with new nonvertebral fractures, Outcome 18 Foot 4 years.
3.19. Analysis.

Comparison 3 Number of patients with new nonvertebral fractures, Outcome 19 Tibia 4 years.
Comparison 4. Musculoskeletal pain.
| Outcome or subgroup title | No. of studies | No. of participants | Statistical method | Effect size |
|---|---|---|---|---|
| 1 Lower limb pain 2 years | 2 | 448 | Peto Odds Ratio (Peto, Fixed, 95% CI) | 3.20 [1.77, 5.78] |
| 2 Lower limb pain 4 years | 4 | 559 | Peto Odds Ratio (Peto, Fixed, 95% CI) | 4.00 [2.57, 6.22] |
| 3 Finger paresthesia | 1 | 28 | Peto Odds Ratio (Peto, Fixed, 95% CI) | 0.14 [0.00, 6.82] |
4.1. Analysis.

Comparison 4 Musculoskeletal pain, Outcome 1 Lower limb pain 2 years.
4.2. Analysis.

Comparison 4 Musculoskeletal pain, Outcome 2 Lower limb pain 4 years.
4.3. Analysis.

Comparison 4 Musculoskeletal pain, Outcome 3 Finger paresthesia.
Comparison 5. Withdrawals and dropouts.
| Outcome or subgroup title | No. of studies | No. of participants | Statistical method | Effect size |
|---|---|---|---|---|
| 1 Withdrawals and dropouts overall | 9 | 865 | Peto Odds Ratio (Peto, Fixed, 95% CI) | 0.97 [0.71, 1.33] |
| 2 Withdrawals and dropouts 2 years | 4 | 219 | Peto Odds Ratio (Peto, Fixed, 95% CI) | 1.03 [0.54, 1.96] |
| 3 Withdrawals and dropouts 4 years | 4 | 562 | Peto Odds Ratio (Peto, Fixed, 95% CI) | 1.00 [0.69, 1.47] |
5.1. Analysis.
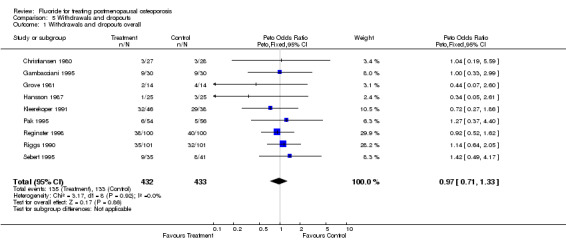
Comparison 5 Withdrawals and dropouts, Outcome 1 Withdrawals and dropouts overall.
5.2. Analysis.

Comparison 5 Withdrawals and dropouts, Outcome 2 Withdrawals and dropouts 2 years.
5.3. Analysis.

Comparison 5 Withdrawals and dropouts, Outcome 3 Withdrawals and dropouts 4 years.
Comparison 6. Subgroup Analysis: Type of Fluoride.
| Outcome or subgroup title | No. of studies | No. of participants | Statistical method | Effect size |
|---|---|---|---|---|
| 1 No. People with new vertebral fractures‐2 years | 4 | 1033 | Peto Odds Ratio (Peto, Fixed, 95% CI) | 0.96 [0.72, 1.28] |
| 1.1 NaF | 3 | 531 | Peto Odds Ratio (Peto, Fixed, 95% CI) | 0.87 [0.60, 1.28] |
| 1.2 MFP | 2 | 502 | Peto Odds Ratio (Peto, Fixed, 95% CI) | 1.08 [0.70, 1.68] |
| 2 No. People with new vertebral fractures 4 years | 5 | 646 | Peto Odds Ratio (Peto, Fixed, 95% CI) | 0.81 [0.55, 1.20] |
| 2.1 NaF | 4 | 446 | Peto Odds Ratio (Peto, Fixed, 95% CI) | 0.70 [0.46, 1.05] |
| 2.2 MFP | 1 | 200 | Peto Odds Ratio (Peto, Fixed, 95% CI) | 4.73 [1.15, 19.41] |
| 3 Lumbar BMD % 2 years from baseline | 7 | 1094 | Mean Difference (IV, Fixed, 95% CI) | 8.95 [8.18, 9.72] |
| 3.1 NaF | 4 | 533 | Mean Difference (IV, Fixed, 95% CI) | 10.48 [9.24, 11.71] |
| 3.2 MFP | 4 | 561 | Mean Difference (IV, Fixed, 95% CI) | 7.99 [7.01, 8.97] |
| 4 Lumbar BMD % 4 years from baseline | 3 | 501 | Mean Difference (IV, Fixed, 95% CI) | 14.87 [13.39, 16.35] |
| 4.1 NaF | 2 | 301 | Mean Difference (IV, Fixed, 95% CI) | 34.57 [31.13, 38.01] |
| 4.2 MFP | 1 | 200 | Mean Difference (IV, Fixed, 95% CI) | 10.40 [8.76, 12.04] |
| 5 GI minor overall | 9 | 1291 | Peto Odds Ratio (Peto, Fixed, 95% CI) | 1.46 [1.11, 1.92] |
| 5.1 NaF | 7 | 856 | Peto Odds Ratio (Peto, Fixed, 95% CI) | 2.02 [1.38, 2.94] |
| 5.2 MFP | 3 | 435 | Peto Odds Ratio (Peto, Fixed, 95% CI) | 1.01 [0.67, 1.51] |
| 6 GI minor 2 years | 4 | 682 | Peto Odds Ratio (Peto, Fixed, 95% CI) | 1.03 [0.74, 1.43] |
| 6.1 NaF | 2 | 247 | Peto Odds Ratio (Peto, Fixed, 95% CI) | 1.09 [0.62, 1.90] |
| 6.2 MFP | 3 | 435 | Peto Odds Ratio (Peto, Fixed, 95% CI) | 1.01 [0.67, 1.51] |
| 7 GI minor 4 years | 5 | 609 | Peto Odds Ratio (Peto, Fixed, 95% CI) | 3.38 [2.02, 5.64] |
| 7.1 NaF | 5 | 609 | Peto Odds Ratio (Peto, Fixed, 95% CI) | 3.38 [2.02, 5.64] |
| 7.2 MFP | 0 | 0 | Peto Odds Ratio (Peto, Fixed, 95% CI) | 0.0 [0.0, 0.0] |
| 8 Non vertebral fractures overall | 5 | 1096 | Peto Odds Ratio (Peto, Fixed, 95% CI) | 1.87 [1.35, 2.60] |
| 8.1 NaF | 4 | 615 | Peto Odds Ratio (Peto, Fixed, 95% CI) | 2.42 [1.61, 3.63] |
| 8.2 MFP | 2 | 481 | Peto Odds Ratio (Peto, Fixed, 95% CI) | 1.19 [0.69, 2.04] |
| 9 Non vertebral fractures 2 years | 1 | 500 | Peto Odds Ratio (Peto, Fixed, 95% CI) | 1.23 [0.72, 2.11] |
| 9.1 NaF | 1 | 219 | Peto Odds Ratio (Peto, Fixed, 95% CI) | 1.21 [0.52, 2.83] |
| 9.2 MFP | 1 | 281 | Peto Odds Ratio (Peto, Fixed, 95% CI) | 1.24 [0.62, 2.50] |
| 10 Non vertebral fractures 4 years | 4 | 596 | Peto Odds Ratio (Peto, Fixed, 95% CI) | 2.38 [1.59, 3.58] |
| 10.1 NaF | 3 | 396 | Peto Odds Ratio (Peto, Fixed, 95% CI) | 2.96 [1.87, 4.70] |
| 10.2 MFP | 1 | 200 | Peto Odds Ratio (Peto, Fixed, 95% CI) | 1.10 [0.46, 2.62] |
| 11 Lower limb pain syndrome | 6 | 1153 | Peto Odds Ratio (Peto, Fixed, 95% CI) | 3.97 [2.81, 5.61] |
| 11.1 NaF | 5 | 778 | Peto Odds Ratio (Peto, Fixed, 95% CI) | 4.19 [2.81, 6.26] |
| 11.2 MFP | 2 | 375 | Peto Odds Ratio (Peto, Fixed, 95% CI) | 3.41 [1.73, 6.72] |
| 12 Withdrawals and dropouts overall | 8 | 805 | Peto Odds Ratio (Peto, Fixed, 95% CI) | 0.97 [0.70, 1.34] |
| 12.1 NaF | 6 | 529 | Peto Odds Ratio (Peto, Fixed, 95% CI) | 0.94 [0.62, 1.44] |
| 12.2 MFP | 2 | 276 | Peto Odds Ratio (Peto, Fixed, 95% CI) | 1.01 [0.61, 1.67] |
| 13 Withdrawals and dropouts 2 years | 4 | 219 | Peto Odds Ratio (Peto, Fixed, 95% CI) | 1.03 [0.54, 1.96] |
| 13.1 NaF | 2 | 83 | Peto Odds Ratio (Peto, Fixed, 95% CI) | 0.69 [0.20, 2.35] |
| 13.2 MFP | 2 | 136 | Peto Odds Ratio (Peto, Fixed, 95% CI) | 1.20 [0.56, 2.58] |
| 14 Withdrawals and dropouts 4 years | 5 | 646 | Peto Odds Ratio (Peto, Fixed, 95% CI) | 0.96 [0.67, 1.36] |
| 14.1 NaF | 4 | 446 | Peto Odds Ratio (Peto, Fixed, 95% CI) | 0.98 [0.63, 1.54] |
| 14.2 MFP | 1 | 200 | Peto Odds Ratio (Peto, Fixed, 95% CI) | 0.92 [0.52, 1.62] |
6.1. Analysis.
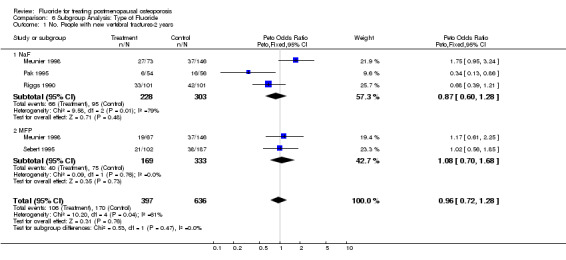
Comparison 6 Subgroup Analysis: Type of Fluoride, Outcome 1 No. People with new vertebral fractures‐2 years.
6.2. Analysis.
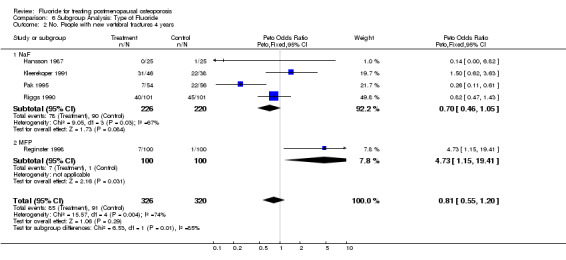
Comparison 6 Subgroup Analysis: Type of Fluoride, Outcome 2 No. People with new vertebral fractures 4 years.
6.3. Analysis.
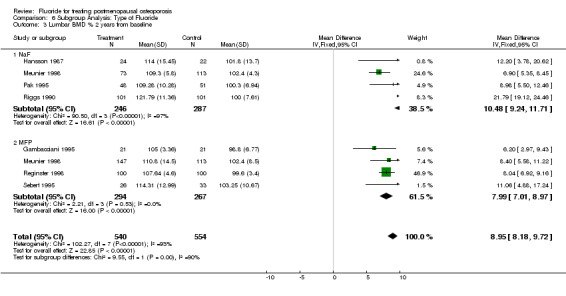
Comparison 6 Subgroup Analysis: Type of Fluoride, Outcome 3 Lumbar BMD % 2 years from baseline.
6.4. Analysis.
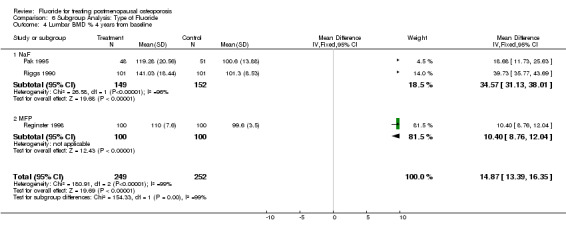
Comparison 6 Subgroup Analysis: Type of Fluoride, Outcome 4 Lumbar BMD % 4 years from baseline.
6.5. Analysis.
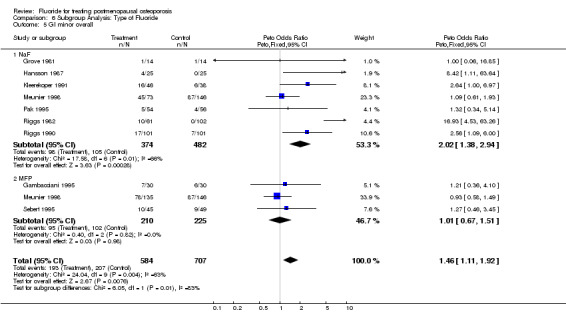
Comparison 6 Subgroup Analysis: Type of Fluoride, Outcome 5 GI minor overall.
6.6. Analysis.
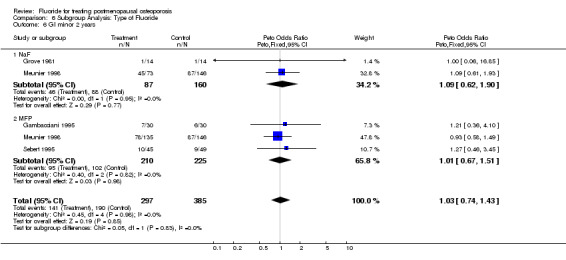
Comparison 6 Subgroup Analysis: Type of Fluoride, Outcome 6 GI minor 2 years.
6.7. Analysis.
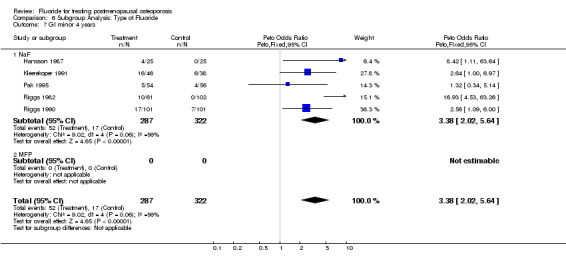
Comparison 6 Subgroup Analysis: Type of Fluoride, Outcome 7 GI minor 4 years.
6.8. Analysis.
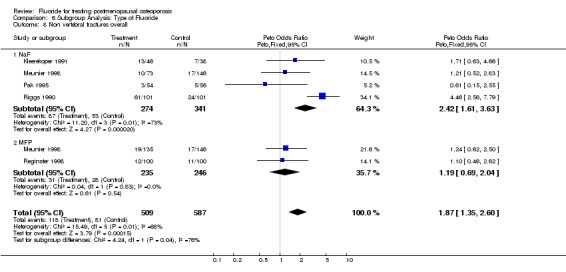
Comparison 6 Subgroup Analysis: Type of Fluoride, Outcome 8 Non vertebral fractures overall.
6.9. Analysis.
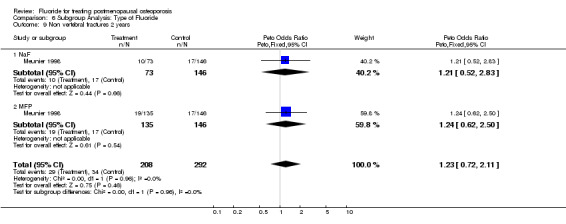
Comparison 6 Subgroup Analysis: Type of Fluoride, Outcome 9 Non vertebral fractures 2 years.
6.10. Analysis.
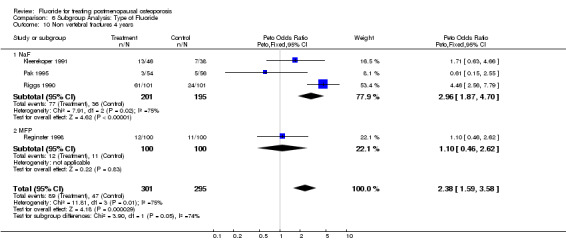
Comparison 6 Subgroup Analysis: Type of Fluoride, Outcome 10 Non vertebral fractures 4 years.
6.11. Analysis.
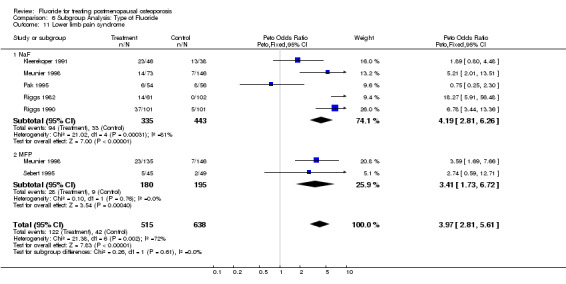
Comparison 6 Subgroup Analysis: Type of Fluoride, Outcome 11 Lower limb pain syndrome.
6.12. Analysis.
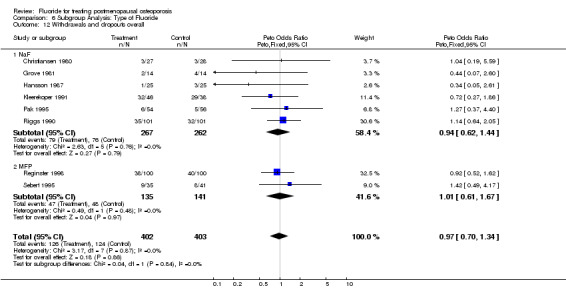
Comparison 6 Subgroup Analysis: Type of Fluoride, Outcome 12 Withdrawals and dropouts overall.
6.13. Analysis.
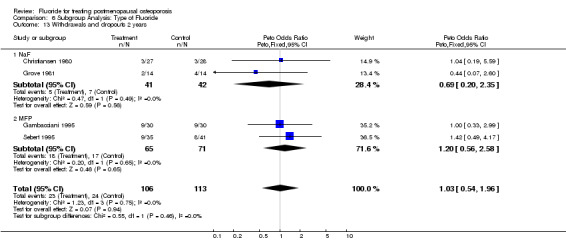
Comparison 6 Subgroup Analysis: Type of Fluoride, Outcome 13 Withdrawals and dropouts 2 years.
6.14. Analysis.
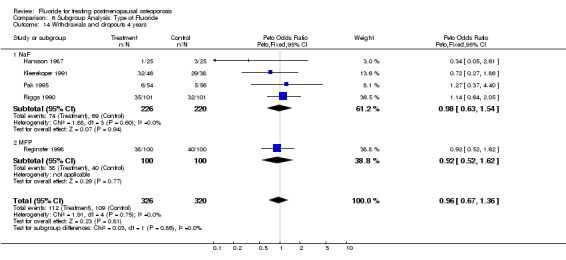
Comparison 6 Subgroup Analysis: Type of Fluoride, Outcome 14 Withdrawals and dropouts 4 years.
Comparison 7. Sensitivity Dosage: Fluoride vs Placebo.
| Outcome or subgroup title | No. of studies | No. of participants | Statistical method | Effect size |
|---|---|---|---|---|
| 1 No. People with new vertebral fractures‐2 years | 4 | 742 | Peto Odds Ratio (Peto, Fixed, 95% CI) | 0.95 [0.68, 1.32] |
| 1.1 Low dose | 3 | 540 | Peto Odds Ratio (Peto, Fixed, 95% CI) | 1.12 [0.74, 1.68] |
| 1.2 High dose | 1 | 202 | Peto Odds Ratio (Peto, Fixed, 95% CI) | 0.68 [0.39, 1.21] |
| 2 No. People with new vertebral fractures 4 years | 5 | 646 | Peto Odds Ratio (Peto, Fixed, 95% CI) | 0.64 [0.43, 0.94] |
| 2.1 Low dose | 3 | 360 | Peto Odds Ratio (Peto, Fixed, 95% CI) | 0.24 [0.12, 0.49] |
| 2.2 High dose | 2 | 286 | Peto Odds Ratio (Peto, Fixed, 95% CI) | 0.97 [0.61, 1.55] |
| 3 Lumbar BMD % 2 years from baseline | 7 | 1002 | Mean Difference (IV, Fixed, 95% CI) | 9.73 [8.82, 10.65] |
| 3.1 Low dose | 6 | 800 | Mean Difference (IV, Fixed, 95% CI) | 8.12 [7.14, 9.09] |
| 3.2 High dose | 1 | 202 | Mean Difference (IV, Fixed, 95% CI) | 21.79 [19.12, 24.46] |
| 4 Lumbar BMD % 4 years from baseline | 3 | 501 | Mean Difference (IV, Fixed, 95% CI) | 14.87 [13.39, 16.35] |
| 4.1 Low dose | 2 | 299 | Mean Difference (IV, Fixed, 95% CI) | 10.84 [9.24, 12.43] |
| 4.2 High dose | 1 | 202 | Mean Difference (IV, Fixed, 95% CI) | 39.73 [35.77, 43.69] |
| 5 GI minor overall | 9 | 1145 | Peto Odds Ratio (Peto, Fixed, 95% CI) | 1.56 [1.15, 2.11] |
| 5.1 Low dose | 7 | 859 | Peto Odds Ratio (Peto, Fixed, 95% CI) | 1.35 [0.96, 1.90] |
| 5.2 High dose | 2 | 286 | Peto Odds Ratio (Peto, Fixed, 95% CI) | 2.60 [1.37, 4.92] |
| 6 GI minor 2 years | 4 | 536 | Peto Odds Ratio (Peto, Fixed, 95% CI) | 1.04 [0.71, 1.51] |
| 6.1 Low dose | 4 | 536 | Peto Odds Ratio (Peto, Fixed, 95% CI) | 1.04 [0.71, 1.51] |
| 6.2 High dose | 0 | 0 | Peto Odds Ratio (Peto, Fixed, 95% CI) | 0.0 [0.0, 0.0] |
| 7 GI minor 4 years | 5 | 609 | Peto Odds Ratio (Peto, Fixed, 95% CI) | 3.38 [2.02, 5.64] |
| 7.1 Low dose | 3 | 323 | Peto Odds Ratio (Peto, Fixed, 95% CI) | 5.41 [2.30, 12.75] |
| 7.2 High dose | 2 | 286 | Peto Odds Ratio (Peto, Fixed, 95% CI) | 2.60 [1.37, 4.92] |
| 8 Non vertebral fractures overall | 5 | 950 | Peto Odds Ratio (Peto, Fixed, 95% CI) | 1.96 [1.39, 2.75] |
| 8.1 Low dose | 3 | 664 | Peto Odds Ratio (Peto, Fixed, 95% CI) | 1.10 [0.68, 1.77] |
| 8.2 High dose | 2 | 286 | Peto Odds Ratio (Peto, Fixed, 95% CI) | 3.56 [2.19, 5.79] |
| 9 Non vertebral fractures 2 years | 1 | 354 | Peto Odds Ratio (Peto, Fixed, 95% CI) | 1.22 [0.65, 2.30] |
| 9.1 Low dose | 1 | 354 | Peto Odds Ratio (Peto, Fixed, 95% CI) | 1.22 [0.65, 2.30] |
| 9.2 High dose | 0 | 0 | Peto Odds Ratio (Peto, Fixed, 95% CI) | 0.0 [0.0, 0.0] |
| 10 Non vertebral fractures 4 years | 4 | 596 | Peto Odds Ratio (Peto, Fixed, 95% CI) | 2.38 [1.59, 3.58] |
| 10.1 Low dose | 2 | 310 | Peto Odds Ratio (Peto, Fixed, 95% CI) | 0.94 [0.45, 1.97] |
| 10.2 High dose | 2 | 286 | Peto Odds Ratio (Peto, Fixed, 95% CI) | 3.56 [2.19, 5.79] |
| 11 Lower limb pain syndrome | 6 | 1007 | Peto Odds Ratio (Peto, Fixed, 95% CI) | 3.69 [2.59, 5.26] |
| 11.1 Low dose | 4 | 721 | Peto Odds Ratio (Peto, Fixed, 95% CI) | 3.35 [2.09, 5.39] |
| 11.2 High dose | 2 | 286 | Peto Odds Ratio (Peto, Fixed, 95% CI) | 4.17 [2.44, 7.10] |
| 12 Withdrawals and dropouts overall | 9 | 865 | Peto Odds Ratio (Peto, Fixed, 95% CI) | 0.86 [0.63, 1.17] |
| 12.1 Low dose | 7 | 579 | Peto Odds Ratio (Peto, Fixed, 95% CI) | 0.95 [0.64, 1.42] |
| 12.2 High dose | 2 | 286 | Peto Odds Ratio (Peto, Fixed, 95% CI) | 0.71 [0.43, 1.19] |
| 13 Withdrawals and dropouts 2 yeras | 4 | 219 | Peto Odds Ratio (Peto, Fixed, 95% CI) | 1.03 [0.54, 1.96] |
| 13.1 Low dose | 4 | 219 | Peto Odds Ratio (Peto, Fixed, 95% CI) | 1.03 [0.54, 1.96] |
| 13.2 High dose | 0 | 0 | Peto Odds Ratio (Peto, Fixed, 95% CI) | 0.0 [0.0, 0.0] |
| 14 Withdrawals and dropouts 4 years | 5 | 646 | Peto Odds Ratio (Peto, Fixed, 95% CI) | 0.96 [0.67, 1.36] |
| 14.1 Low dose | 3 | 360 | Peto Odds Ratio (Peto, Fixed, 95% CI) | 0.91 [0.55, 1.50] |
| 14.2 High dose | 2 | 286 | Peto Odds Ratio (Peto, Fixed, 95% CI) | 1.01 [0.61, 1.66] |
7.1. Analysis.
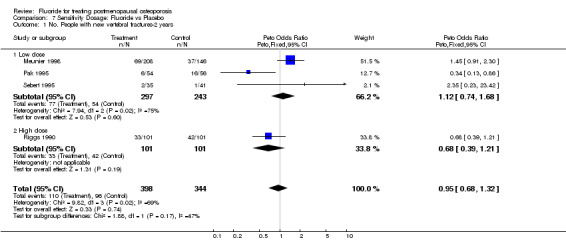
Comparison 7 Sensitivity Dosage: Fluoride vs Placebo, Outcome 1 No. People with new vertebral fractures‐2 years.
7.2. Analysis.
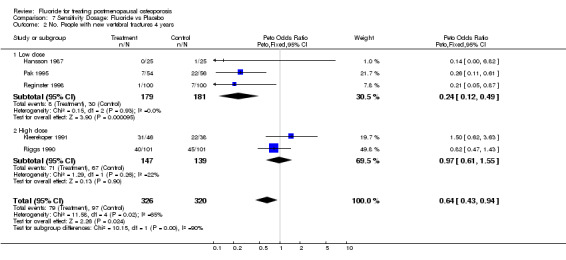
Comparison 7 Sensitivity Dosage: Fluoride vs Placebo, Outcome 2 No. People with new vertebral fractures 4 years.
7.3. Analysis.
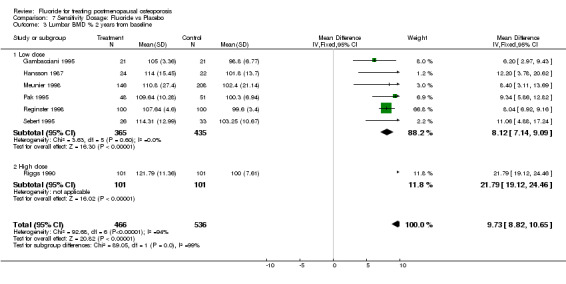
Comparison 7 Sensitivity Dosage: Fluoride vs Placebo, Outcome 3 Lumbar BMD % 2 years from baseline.
7.4. Analysis.
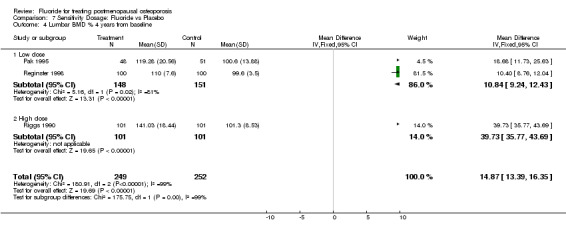
Comparison 7 Sensitivity Dosage: Fluoride vs Placebo, Outcome 4 Lumbar BMD % 4 years from baseline.
7.5. Analysis.
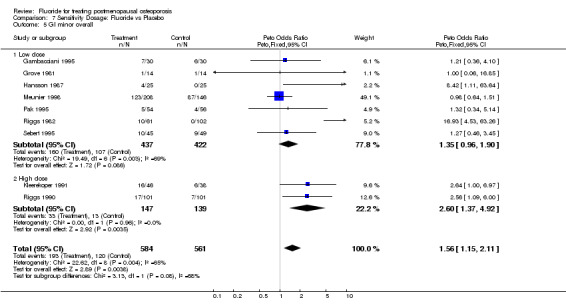
Comparison 7 Sensitivity Dosage: Fluoride vs Placebo, Outcome 5 GI minor overall.
7.6. Analysis.
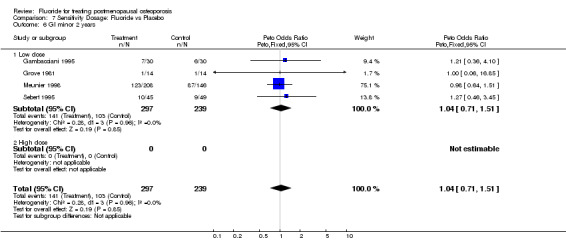
Comparison 7 Sensitivity Dosage: Fluoride vs Placebo, Outcome 6 GI minor 2 years.
7.7. Analysis.
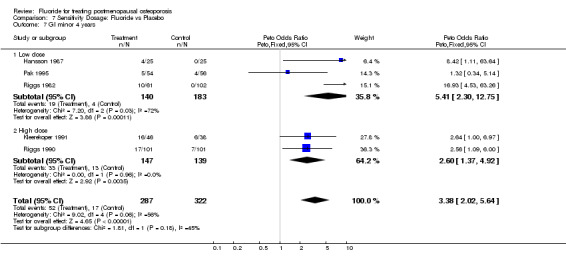
Comparison 7 Sensitivity Dosage: Fluoride vs Placebo, Outcome 7 GI minor 4 years.
7.8. Analysis.
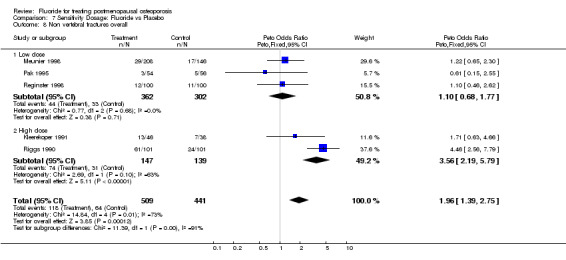
Comparison 7 Sensitivity Dosage: Fluoride vs Placebo, Outcome 8 Non vertebral fractures overall.
7.9. Analysis.
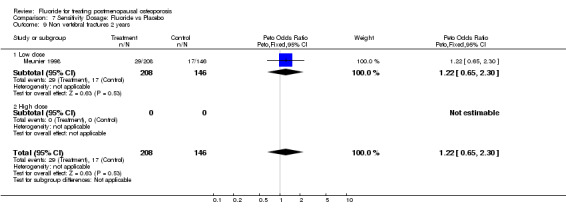
Comparison 7 Sensitivity Dosage: Fluoride vs Placebo, Outcome 9 Non vertebral fractures 2 years.
7.10. Analysis.
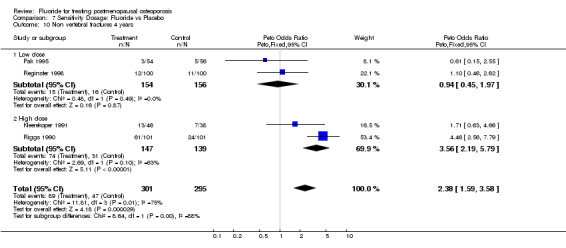
Comparison 7 Sensitivity Dosage: Fluoride vs Placebo, Outcome 10 Non vertebral fractures 4 years.
7.11. Analysis.
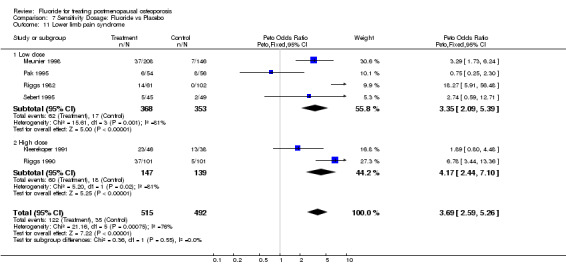
Comparison 7 Sensitivity Dosage: Fluoride vs Placebo, Outcome 11 Lower limb pain syndrome.
7.12. Analysis.
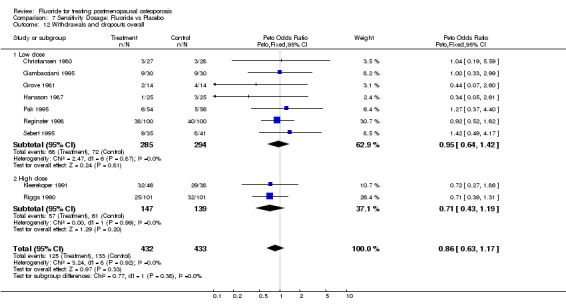
Comparison 7 Sensitivity Dosage: Fluoride vs Placebo, Outcome 12 Withdrawals and dropouts overall.
7.13. Analysis.
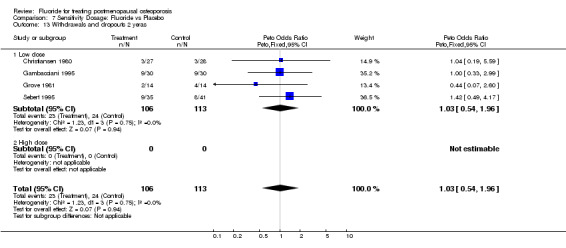
Comparison 7 Sensitivity Dosage: Fluoride vs Placebo, Outcome 13 Withdrawals and dropouts 2 yeras.
7.14. Analysis.
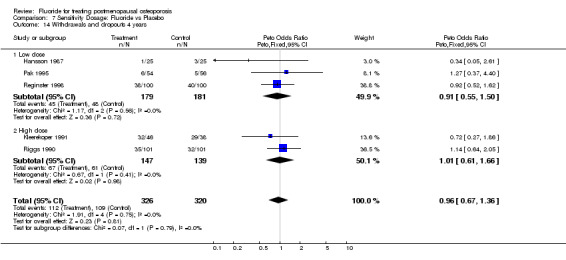
Comparison 7 Sensitivity Dosage: Fluoride vs Placebo, Outcome 14 Withdrawals and dropouts 4 years.
Comparison 8. Sensitivity Quality.
| Outcome or subgroup title | No. of studies | No. of participants | Statistical method | Effect size |
|---|---|---|---|---|
| 1 No. People with new vertebral fractures‐2 years | 4 | 742 | Peto Odds Ratio (Peto, Fixed, 95% CI) | 0.95 [0.68, 1.32] |
| 1.1 Low quality | 4 | 742 | Peto Odds Ratio (Peto, Fixed, 95% CI) | 0.95 [0.68, 1.32] |
| 1.2 High quality | 0 | 0 | Peto Odds Ratio (Peto, Fixed, 95% CI) | 0.0 [0.0, 0.0] |
| 2 No. Peiple with new vertebral fractures 4 years | 5 | 646 | Peto Odds Ratio (Peto, Fixed, 95% CI) | 0.64 [0.43, 0.94] |
| 2.1 Low quality | 3 | 362 | Peto Odds Ratio (Peto, Fixed, 95% CI) | 0.57 [0.36, 0.90] |
| 2.2 High quality | 2 | 284 | Peto Odds Ratio (Peto, Fixed, 95% CI) | 0.86 [0.41, 1.82] |
| 3 Lumbar BMD % 2 years from baseline | 7 | 1002 | Mean Difference (IV, Fixed, 95% CI) | 9.73 [8.82, 10.65] |
| 3.1 Low quality | 6 | 802 | Mean Difference (IV, Fixed, 95% CI) | 13.14 [11.55, 14.73] |
| 3.2 High quality | 1 | 200 | Mean Difference (IV, Fixed, 95% CI) | 8.04 [6.92, 9.16] |
| 4 Lumbar BMD % 4 years from baseline | 3 | 501 | Mean Difference (IV, Fixed, 95% CI) | 14.87 [13.39, 16.35] |
| 4.1 Low quality | 2 | 301 | Mean Difference (IV, Fixed, 95% CI) | 34.57 [31.13, 38.01] |
| 4.2 High quality | 1 | 200 | Mean Difference (IV, Fixed, 95% CI) | 10.40 [8.76, 12.04] |
| 5 GI minor overall | 9 | 1145 | Peto Odds Ratio (Peto, Fixed, 95% CI) | 1.56 [1.15, 2.11] |
| 5.1 Low quality | 8 | 1061 | Peto Odds Ratio (Peto, Fixed, 95% CI) | 1.48 [1.07, 2.03] |
| 5.2 High quality | 1 | 84 | Peto Odds Ratio (Peto, Fixed, 95% CI) | 2.64 [1.00, 6.97] |
| 6 GI minor 2 years | 4 | 536 | Peto Odds Ratio (Peto, Fixed, 95% CI) | 1.04 [0.71, 1.51] |
| 6.1 Low quality | 4 | 536 | Peto Odds Ratio (Peto, Fixed, 95% CI) | 1.04 [0.71, 1.51] |
| 6.2 High quality | 0 | 0 | Peto Odds Ratio (Peto, Fixed, 95% CI) | 0.0 [0.0, 0.0] |
| 7 GI minor 4 years | 5 | 609 | Peto Odds Ratio (Peto, Fixed, 95% CI) | 3.38 [2.02, 5.64] |
| 7.1 Low quality | 4 | 525 | Peto Odds Ratio (Peto, Fixed, 95% CI) | 3.71 [2.03, 6.79] |
| 7.2 High quality | 1 | 84 | Peto Odds Ratio (Peto, Fixed, 95% CI) | 2.64 [1.00, 6.97] |
| 8 Non vertebral fractures overall | 5 | 950 | Peto Odds Ratio (Peto, Fixed, 95% CI) | 1.96 [1.39, 2.75] |
| 8.1 Low quality | 3 | 666 | Peto Odds Ratio (Peto, Fixed, 95% CI) | 2.26 [1.51, 3.37] |
| 8.2 High quality | 2 | 284 | Peto Odds Ratio (Peto, Fixed, 95% CI) | 1.33 [0.69, 2.56] |
| 9 Non vertebral fractures 2 years | 1 | 354 | Peto Odds Ratio (Peto, Fixed, 95% CI) | 1.22 [0.65, 2.30] |
| 9.1 Low quality | 1 | 354 | Peto Odds Ratio (Peto, Fixed, 95% CI) | 1.22 [0.65, 2.30] |
| 9.2 High quality | 0 | 0 | Peto Odds Ratio (Peto, Fixed, 95% CI) | 0.0 [0.0, 0.0] |
| 10 Non vertebral fractures 4 years | 4 | 596 | Peto Odds Ratio (Peto, Fixed, 95% CI) | 2.38 [1.59, 3.58] |
| 10.1 Low quality | 2 | 312 | Peto Odds Ratio (Peto, Fixed, 95% CI) | 3.43 [2.04, 5.77] |
| 10.2 High quality | 2 | 284 | Peto Odds Ratio (Peto, Fixed, 95% CI) | 1.33 [0.69, 2.56] |
| 11 Withdrawals and dropouts overall | 9 | 865 | Peto Odds Ratio (Peto, Fixed, 95% CI) | 0.97 [0.71, 1.33] |
| 11.1 Low quality | 6 | 526 | Peto Odds Ratio (Peto, Fixed, 95% CI) | 1.06 [0.70, 1.60] |
| 11.2 High quality | 3 | 339 | Peto Odds Ratio (Peto, Fixed, 95% CI) | 0.87 [0.55, 1.40] |
| 12 Lower limb pain syndrome | 6 | 1007 | Peto Odds Ratio (Peto, Fixed, 95% CI) | 3.69 [2.59, 5.26] |
| 12.1 Low quality | 5 | 923 | Peto Odds Ratio (Peto, Fixed, 95% CI) | 4.23 [2.87, 6.23] |
| 12.2 High quality | 1 | 84 | Peto Odds Ratio (Peto, Fixed, 95% CI) | 1.89 [0.80, 4.48] |
| 13 Withdrawals and dropouts 2 years | 4 | 219 | Peto Odds Ratio (Peto, Fixed, 95% CI) | 1.03 [0.54, 1.96] |
| 13.1 Low quality | 3 | 164 | Peto Odds Ratio (Peto, Fixed, 95% CI) | 1.02 [0.51, 2.07] |
| 13.2 High quality | 1 | 55 | Peto Odds Ratio (Peto, Fixed, 95% CI) | 1.04 [0.19, 5.59] |
| 14 Withdrawals and dropouts 4 years | 5 | 646 | Peto Odds Ratio (Peto, Fixed, 95% CI) | 0.96 [0.67, 1.36] |
| 14.1 Low quality | 3 | 362 | Peto Odds Ratio (Peto, Fixed, 95% CI) | 1.08 [0.65, 1.80] |
| 14.2 High quality | 2 | 284 | Peto Odds Ratio (Peto, Fixed, 95% CI) | 0.86 [0.53, 1.40] |
8.1. Analysis.
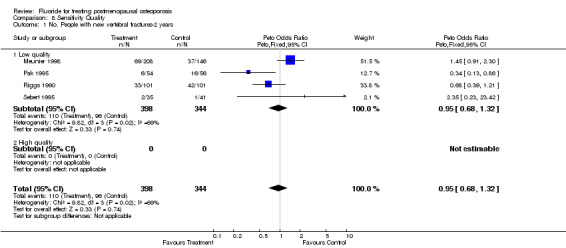
Comparison 8 Sensitivity Quality, Outcome 1 No. People with new vertebral fractures‐2 years.
8.2. Analysis.
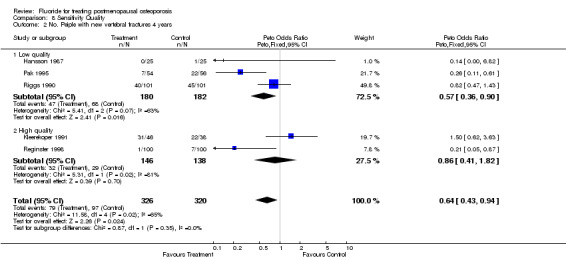
Comparison 8 Sensitivity Quality, Outcome 2 No. Peiple with new vertebral fractures 4 years.
8.3. Analysis.
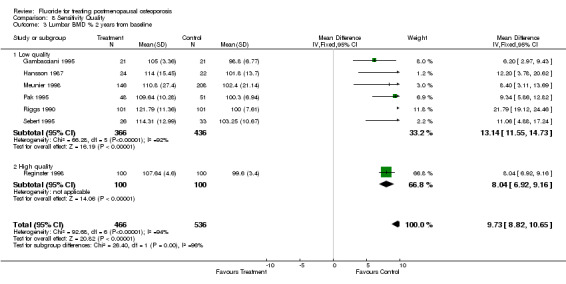
Comparison 8 Sensitivity Quality, Outcome 3 Lumbar BMD % 2 years from baseline.
8.4. Analysis.
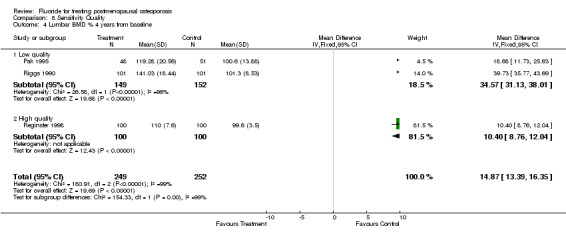
Comparison 8 Sensitivity Quality, Outcome 4 Lumbar BMD % 4 years from baseline.
8.5. Analysis.
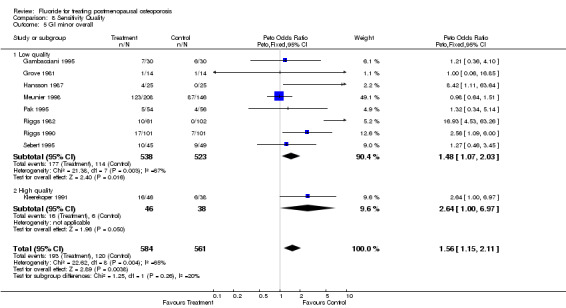
Comparison 8 Sensitivity Quality, Outcome 5 GI minor overall.
8.6. Analysis.
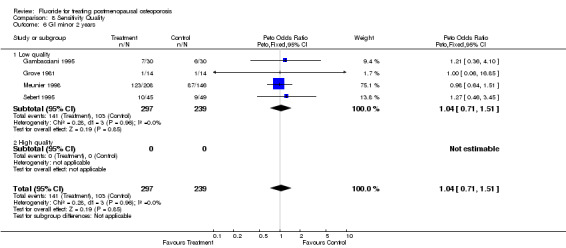
Comparison 8 Sensitivity Quality, Outcome 6 GI minor 2 years.
8.7. Analysis.
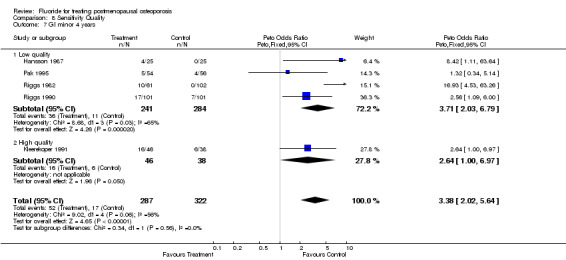
Comparison 8 Sensitivity Quality, Outcome 7 GI minor 4 years.
8.8. Analysis.
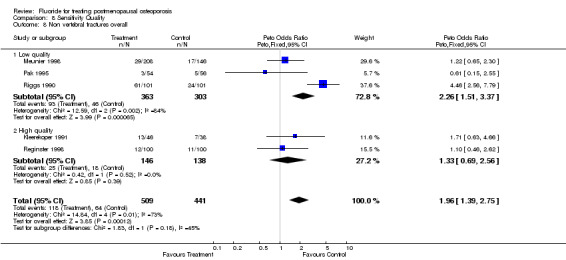
Comparison 8 Sensitivity Quality, Outcome 8 Non vertebral fractures overall.
8.9. Analysis.
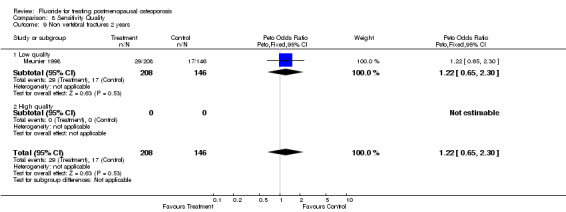
Comparison 8 Sensitivity Quality, Outcome 9 Non vertebral fractures 2 years.
8.10. Analysis.
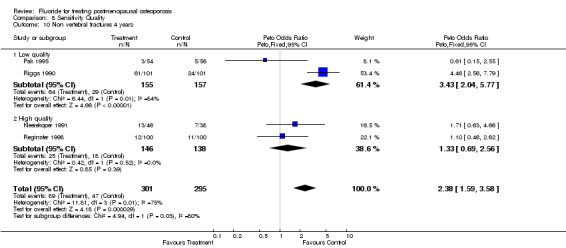
Comparison 8 Sensitivity Quality, Outcome 10 Non vertebral fractures 4 years.
8.11. Analysis.
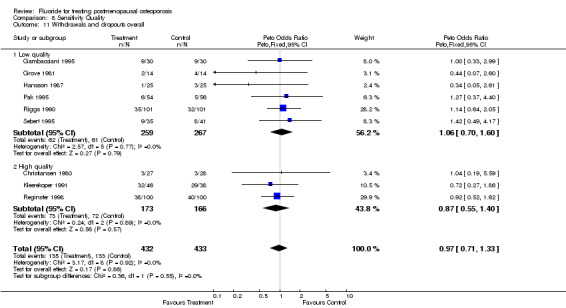
Comparison 8 Sensitivity Quality, Outcome 11 Withdrawals and dropouts overall.
8.12. Analysis.
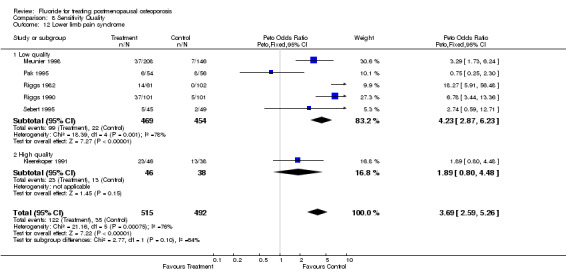
Comparison 8 Sensitivity Quality, Outcome 12 Lower limb pain syndrome.
8.13. Analysis.
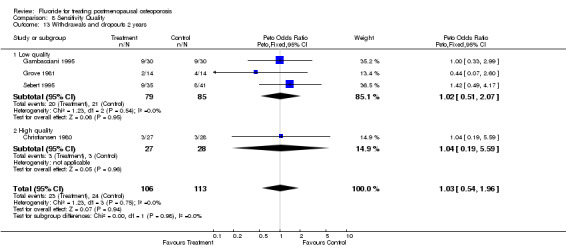
Comparison 8 Sensitivity Quality, Outcome 13 Withdrawals and dropouts 2 years.
8.14. Analysis.
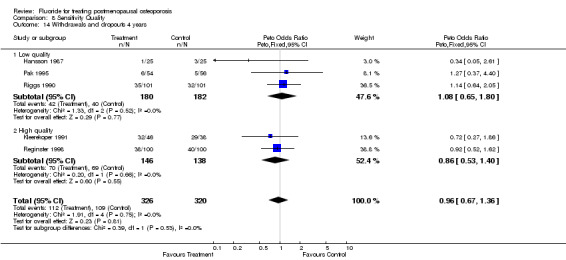
Comparison 8 Sensitivity Quality, Outcome 14 Withdrawals and dropouts 4 years.
Comparison 9. Subgroup men/women.
| Outcome or subgroup title | No. of studies | No. of participants | Statistical method | Effect size |
|---|---|---|---|---|
| 1 No. People with new vertebral fractures‐2 years | 4 | 742 | Peto Odds Ratio (Peto, Fixed, 95% CI) | 0.95 [0.68, 1.32] |
| 1.1 With men | 1 | 76 | Peto Odds Ratio (Peto, Fixed, 95% CI) | 2.35 [0.23, 23.42] |
| 1.2 Without men | 3 | 666 | Peto Odds Ratio (Peto, Fixed, 95% CI) | 0.93 [0.66, 1.30] |
| 2 No. People with new vertebral fractures 4 years | 5 | 646 | Peto Odds Ratio (Peto, Fixed, 95% CI) | 0.68 [0.46, 1.01] |
| 2.1 With men | 0 | 0 | Peto Odds Ratio (Peto, Fixed, 95% CI) | 0.0 [0.0, 0.0] |
| 2.2 Without men | 5 | 646 | Peto Odds Ratio (Peto, Fixed, 95% CI) | 0.68 [0.46, 1.01] |
| 3 Lumbar BMD % 2 years from baseline | 7 | 1002 | Mean Difference (IV, Fixed, 95% CI) | 9.73 [8.82, 10.65] |
| 3.1 With men | 1 | 59 | Mean Difference (IV, Fixed, 95% CI) | 11.06 [4.88, 17.24] |
| 3.2 Without men | 6 | 943 | Mean Difference (IV, Fixed, 95% CI) | 9.70 [8.78, 10.63] |
| 4 Lumbar BMD % 4 years from baseline | 3 | 501 | Mean Difference (IV, Fixed, 95% CI) | 14.87 [13.39, 16.35] |
| 4.1 With men | 0 | 0 | Mean Difference (IV, Fixed, 95% CI) | 0.0 [0.0, 0.0] |
| 4.2 Without men | 3 | 501 | Mean Difference (IV, Fixed, 95% CI) | 14.87 [13.39, 16.35] |
| 5 GI minor overall | 9 | 1145 | Peto Odds Ratio (Peto, Fixed, 95% CI) | 1.56 [1.15, 2.11] |
| 5.1 With men | 1 | 94 | Peto Odds Ratio (Peto, Fixed, 95% CI) | 1.27 [0.46, 3.45] |
| 5.2 Without men | 8 | 1051 | Peto Odds Ratio (Peto, Fixed, 95% CI) | 1.59 [1.16, 2.19] |
| 6 GI minor 2 years | 4 | 536 | Peto Odds Ratio (Peto, Fixed, 95% CI) | 1.04 [0.71, 1.51] |
| 6.1 With men | 1 | 94 | Peto Odds Ratio (Peto, Fixed, 95% CI) | 1.27 [0.46, 3.45] |
| 6.2 Without men | 3 | 442 | Peto Odds Ratio (Peto, Fixed, 95% CI) | 1.00 [0.67, 1.50] |
| 7 GI minor 4 years | 5 | 609 | Peto Odds Ratio (Peto, Fixed, 95% CI) | 3.38 [2.02, 5.64] |
| 7.1 With men | 0 | 0 | Peto Odds Ratio (Peto, Fixed, 95% CI) | 0.0 [0.0, 0.0] |
| 7.2 Without men | 5 | 609 | Peto Odds Ratio (Peto, Fixed, 95% CI) | 3.38 [2.02, 5.64] |
| 8 Non vertebral fractures overall | 5 | 950 | Peto Odds Ratio (Peto, Fixed, 95% CI) | 1.96 [1.39, 2.75] |
| 8.1 With men | 0 | 0 | Peto Odds Ratio (Peto, Fixed, 95% CI) | 0.0 [0.0, 0.0] |
| 8.2 Without men | 5 | 950 | Peto Odds Ratio (Peto, Fixed, 95% CI) | 1.96 [1.39, 2.75] |
| 9 Non vertebral fractures 2 years | 1 | 354 | Peto Odds Ratio (Peto, Fixed, 95% CI) | 1.22 [0.65, 2.30] |
| 9.1 With men | 0 | 0 | Peto Odds Ratio (Peto, Fixed, 95% CI) | 0.0 [0.0, 0.0] |
| 9.2 Without men | 1 | 354 | Peto Odds Ratio (Peto, Fixed, 95% CI) | 1.22 [0.65, 2.30] |
| 10 Non vertebral fractures 4 years | 4 | 596 | Peto Odds Ratio (Peto, Fixed, 95% CI) | 2.38 [1.59, 3.58] |
| 10.1 With men | 0 | 0 | Peto Odds Ratio (Peto, Fixed, 95% CI) | 0.0 [0.0, 0.0] |
| 10.2 Without men | 4 | 596 | Peto Odds Ratio (Peto, Fixed, 95% CI) | 2.38 [1.59, 3.58] |
| 11 Lower limb pain syndrome | 6 | 1007 | Peto Odds Ratio (Peto, Fixed, 95% CI) | 3.69 [2.59, 5.26] |
| 11.1 With men | 1 | 94 | Peto Odds Ratio (Peto, Fixed, 95% CI) | 2.74 [0.59, 12.71] |
| 11.2 Without men | 5 | 913 | Peto Odds Ratio (Peto, Fixed, 95% CI) | 3.75 [2.61, 5.40] |
| 12 Withdrawals and dropouts overall | 9 | 865 | Peto Odds Ratio (Peto, Fixed, 95% CI) | 0.97 [0.71, 1.33] |
| 12.1 With men | 1 | 76 | Peto Odds Ratio (Peto, Fixed, 95% CI) | 1.42 [0.49, 4.17] |
| 12.2 Without men | 8 | 789 | Peto Odds Ratio (Peto, Fixed, 95% CI) | 0.94 [0.68, 1.30] |
| 13 Withdrawals and dropouts 2 years | 4 | 219 | Peto Odds Ratio (Peto, Fixed, 95% CI) | 1.03 [0.54, 1.96] |
| 13.1 With men | 1 | 76 | Peto Odds Ratio (Peto, Fixed, 95% CI) | 1.42 [0.49, 4.17] |
| 13.2 Without men | 3 | 143 | Peto Odds Ratio (Peto, Fixed, 95% CI) | 0.85 [0.38, 1.92] |
| 14 Withdrawals and dropouts 4 years | 5 | 646 | Peto Odds Ratio (Peto, Fixed, 95% CI) | 0.96 [0.67, 1.36] |
| 14.1 With men | 0 | 0 | Peto Odds Ratio (Peto, Fixed, 95% CI) | 0.0 [0.0, 0.0] |
| 14.2 Without men | 5 | 646 | Peto Odds Ratio (Peto, Fixed, 95% CI) | 0.96 [0.67, 1.36] |
9.1. Analysis.
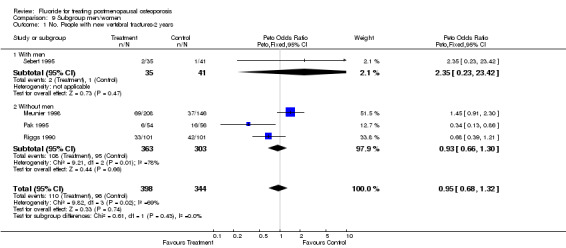
Comparison 9 Subgroup men/women, Outcome 1 No. People with new vertebral fractures‐2 years.
9.2. Analysis.
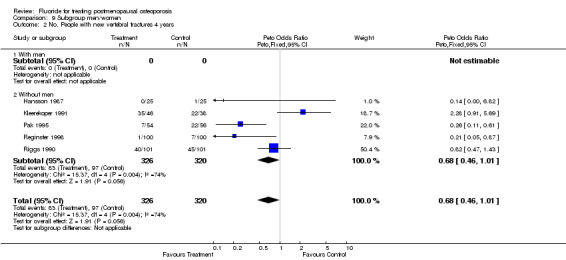
Comparison 9 Subgroup men/women, Outcome 2 No. People with new vertebral fractures 4 years.
9.3. Analysis.
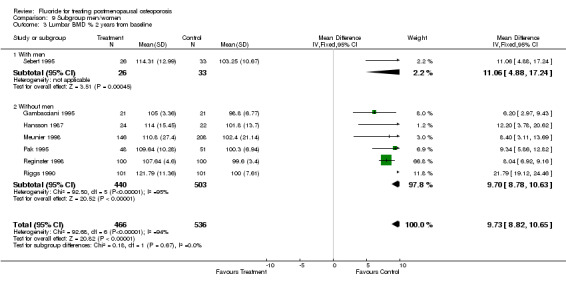
Comparison 9 Subgroup men/women, Outcome 3 Lumbar BMD % 2 years from baseline.
9.4. Analysis.
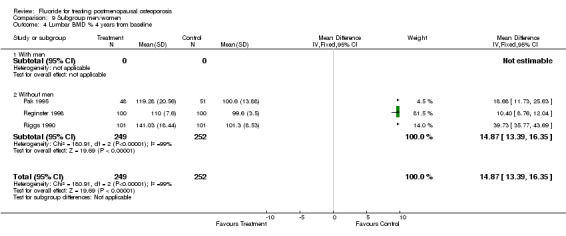
Comparison 9 Subgroup men/women, Outcome 4 Lumbar BMD % 4 years from baseline.
9.5. Analysis.
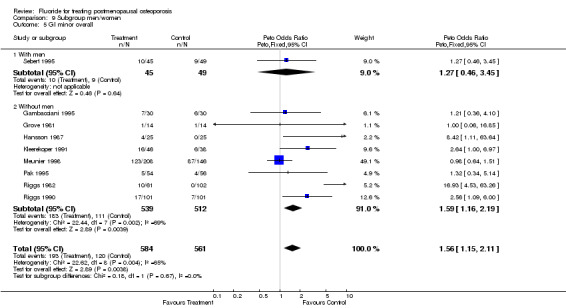
Comparison 9 Subgroup men/women, Outcome 5 GI minor overall.
9.6. Analysis.
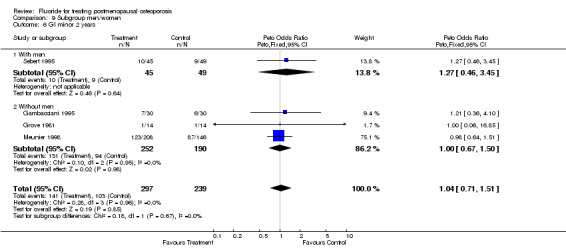
Comparison 9 Subgroup men/women, Outcome 6 GI minor 2 years.
9.7. Analysis.
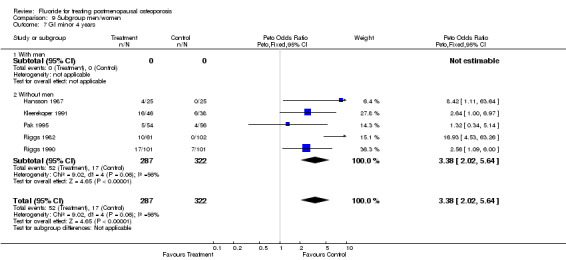
Comparison 9 Subgroup men/women, Outcome 7 GI minor 4 years.
9.8. Analysis.
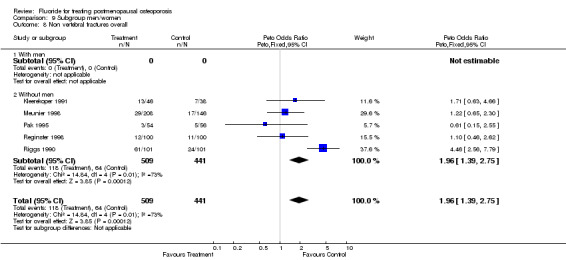
Comparison 9 Subgroup men/women, Outcome 8 Non vertebral fractures overall.
9.9. Analysis.
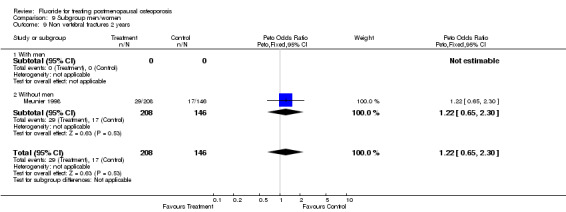
Comparison 9 Subgroup men/women, Outcome 9 Non vertebral fractures 2 years.
9.10. Analysis.
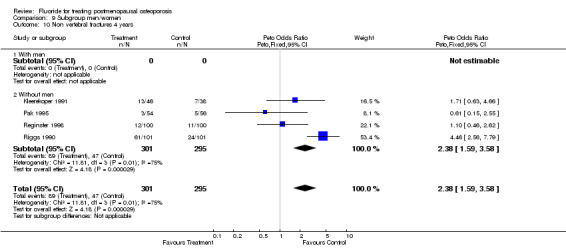
Comparison 9 Subgroup men/women, Outcome 10 Non vertebral fractures 4 years.
9.11. Analysis.
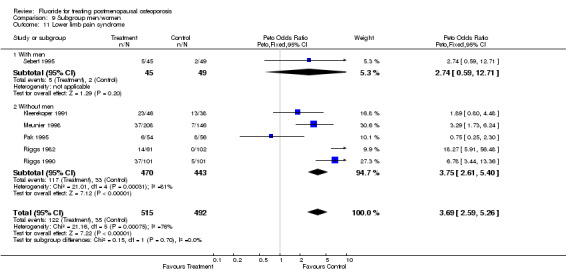
Comparison 9 Subgroup men/women, Outcome 11 Lower limb pain syndrome.
9.12. Analysis.
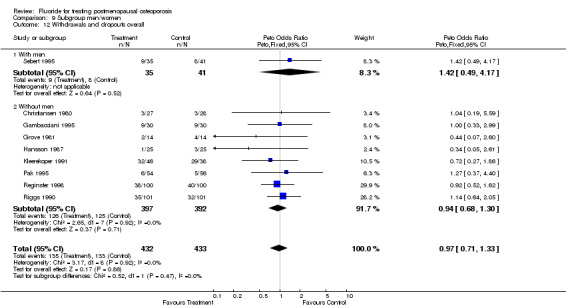
Comparison 9 Subgroup men/women, Outcome 12 Withdrawals and dropouts overall.
9.13. Analysis.
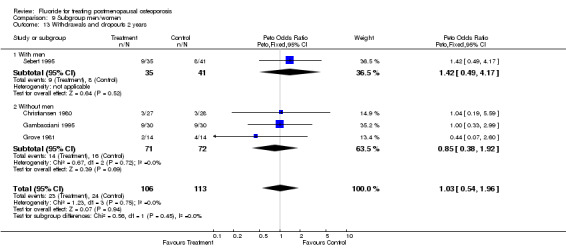
Comparison 9 Subgroup men/women, Outcome 13 Withdrawals and dropouts 2 years.
9.14. Analysis.
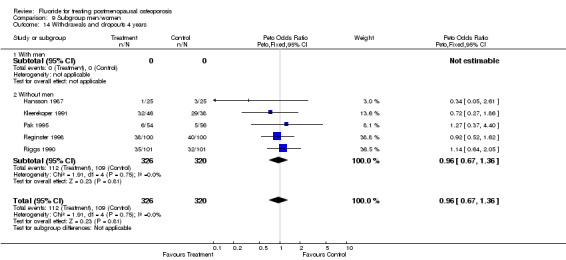
Comparison 9 Subgroup men/women, Outcome 14 Withdrawals and dropouts 4 years.
Comparison 10. Subgroup Vit D/ no vit D = EC/Non EC.
| Outcome or subgroup title | No. of studies | No. of participants | Statistical method | Effect size |
|---|---|---|---|---|
| 1 No. People with new vertebral fractures‐2 years | 4 | 742 | Peto Odds Ratio (Peto, Fixed, 95% CI) | 0.95 [0.68, 1.32] |
| 1.1 With vit D = EC | 1 | 354 | Peto Odds Ratio (Peto, Fixed, 95% CI) | 1.45 [0.91, 2.30] |
| 1.2 Without vit D = non EC | 3 | 388 | Peto Odds Ratio (Peto, Fixed, 95% CI) | 0.60 [0.37, 0.97] |
| 2 No. People with new vertebral fractures 4 years | 5 | 646 | Peto Odds Ratio (Peto, Fixed, 95% CI) | 0.64 [0.43, 0.94] |
| 2.1 With vit D = EC | 0 | 0 | Peto Odds Ratio (Peto, Fixed, 95% CI) | 0.0 [0.0, 0.0] |
| 2.2 Without vit D = non EC | 5 | 646 | Peto Odds Ratio (Peto, Fixed, 95% CI) | 0.64 [0.43, 0.94] |
| 3 Lumbar BMD % 2 years from baseline | 7 | 1002 | Mean Difference (IV, Fixed, 95% CI) | 9.73 [8.82, 10.65] |
| 3.1 With vit D = EC | 1 | 354 | Mean Difference (IV, Fixed, 95% CI) | 8.40 [3.11, 13.69] |
| 3.2 Without vit D = non EC | 6 | 648 | Mean Difference (IV, Fixed, 95% CI) | 9.77 [8.84, 10.70] |
| 4 Lumbar BMD % 4 years from baseline | 3 | 501 | Mean Difference (IV, Fixed, 95% CI) | 14.87 [13.39, 16.35] |
| 4.1 With vit D = EC | 0 | 0 | Mean Difference (IV, Fixed, 95% CI) | 0.0 [0.0, 0.0] |
| 4.2 Without vit D = non EC | 3 | 501 | Mean Difference (IV, Fixed, 95% CI) | 14.87 [13.39, 16.35] |
| 5 GI minor overall | 9 | 1145 | Peto Odds Ratio (Peto, Fixed, 95% CI) | 1.56 [1.15, 2.11] |
| 5.1 With vit D = EC | 1 | 354 | Peto Odds Ratio (Peto, Fixed, 95% CI) | 0.98 [0.64, 1.51] |
| 5.2 Without vit D = non EC | 8 | 791 | Peto Odds Ratio (Peto, Fixed, 95% CI) | 2.44 [1.60, 3.72] |
| 6 GI minor 2 years | 4 | 536 | Peto Odds Ratio (Peto, Fixed, 95% CI) | 1.04 [0.71, 1.51] |
| 6.1 With vit D = EC | 1 | 354 | Peto Odds Ratio (Peto, Fixed, 95% CI) | 0.98 [0.64, 1.51] |
| 6.2 Without vit D = non EC | 3 | 182 | Peto Odds Ratio (Peto, Fixed, 95% CI) | 1.23 [0.58, 2.59] |
| 7 GI minor 4 years | 5 | 609 | Peto Odds Ratio (Peto, Fixed, 95% CI) | 3.38 [2.02, 5.64] |
| 7.1 With vit D = EC | 0 | 0 | Peto Odds Ratio (Peto, Fixed, 95% CI) | 0.0 [0.0, 0.0] |
| 7.2 Without vit D = Non EC | 5 | 609 | Peto Odds Ratio (Peto, Fixed, 95% CI) | 3.38 [2.02, 5.64] |
| 8 Non vertebral fractures overall | 5 | 950 | Peto Odds Ratio (Peto, Fixed, 95% CI) | 1.96 [1.39, 2.75] |
| 8.1 With vit D = EC | 1 | 354 | Peto Odds Ratio (Peto, Fixed, 95% CI) | 1.22 [0.65, 2.30] |
| 8.2 Without vit D = non EC | 4 | 596 | Peto Odds Ratio (Peto, Fixed, 95% CI) | 2.38 [1.59, 3.58] |
| 9 Non vertebral fractures 2 years | 1 | 354 | Peto Odds Ratio (Peto, Fixed, 95% CI) | 1.22 [0.65, 2.30] |
| 9.1 With vit D = EC | 1 | 354 | Peto Odds Ratio (Peto, Fixed, 95% CI) | 1.22 [0.65, 2.30] |
| 9.2 Without vit D = non EC | 0 | 0 | Peto Odds Ratio (Peto, Fixed, 95% CI) | 0.0 [0.0, 0.0] |
| 10 Non vertebral fractures 4 years | 4 | 596 | Peto Odds Ratio (Peto, Fixed, 95% CI) | 2.38 [1.59, 3.58] |
| 10.1 With vit D = EC | 0 | 0 | Peto Odds Ratio (Peto, Fixed, 95% CI) | 0.0 [0.0, 0.0] |
| 10.2 Without vit D = non EC | 4 | 596 | Peto Odds Ratio (Peto, Fixed, 95% CI) | 2.38 [1.59, 3.58] |
| 11 Lower limb pain syndrome | 6 | 1007 | Peto Odds Ratio (Peto, Fixed, 95% CI) | 3.69 [2.59, 5.26] |
| 11.1 With vit D = EC | 1 | 354 | Peto Odds Ratio (Peto, Fixed, 95% CI) | 3.29 [1.73, 6.24] |
| 11.2 Without vit D = non EC | 5 | 653 | Peto Odds Ratio (Peto, Fixed, 95% CI) | 3.88 [2.54, 5.94] |
| 12 Withdrawals and dropouts overall | 9 | 865 | Peto Odds Ratio (Peto, Fixed, 95% CI) | 0.97 [0.71, 1.33] |
| 12.1 With vit D = EC | 0 | 0 | Peto Odds Ratio (Peto, Fixed, 95% CI) | 0.0 [0.0, 0.0] |
| 12.2 Without vit D = non EC | 9 | 865 | Peto Odds Ratio (Peto, Fixed, 95% CI) | 0.97 [0.71, 1.33] |
| 13 Withdrawals and dropouts 2 years | 4 | 219 | Peto Odds Ratio (Peto, Fixed, 95% CI) | 1.03 [0.54, 1.96] |
| 13.1 With vit D = EC | 0 | 0 | Peto Odds Ratio (Peto, Fixed, 95% CI) | 0.0 [0.0, 0.0] |
| 13.2 Without vit D = non EC | 4 | 219 | Peto Odds Ratio (Peto, Fixed, 95% CI) | 1.03 [0.54, 1.96] |
| 14 Withdrawals and dropouts 4 years | 5 | 646 | Peto Odds Ratio (Peto, Fixed, 95% CI) | 0.96 [0.67, 1.36] |
| 14.1 With vit D = EC | 0 | 0 | Peto Odds Ratio (Peto, Fixed, 95% CI) | 0.0 [0.0, 0.0] |
| 14.2 Without vit D = non EC | 5 | 646 | Peto Odds Ratio (Peto, Fixed, 95% CI) | 0.96 [0.67, 1.36] |
10.1. Analysis.
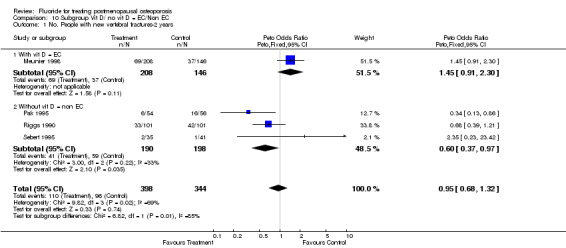
Comparison 10 Subgroup Vit D/ no vit D = EC/Non EC, Outcome 1 No. People with new vertebral fractures‐2 years.
10.2. Analysis.
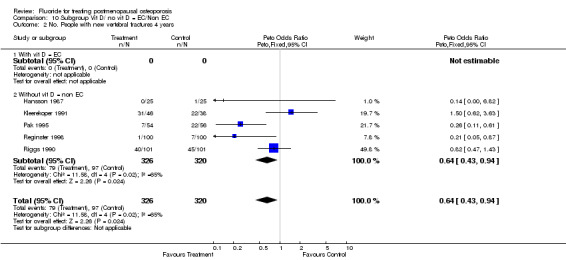
Comparison 10 Subgroup Vit D/ no vit D = EC/Non EC, Outcome 2 No. People with new vertebral fractures 4 years.
10.3. Analysis.
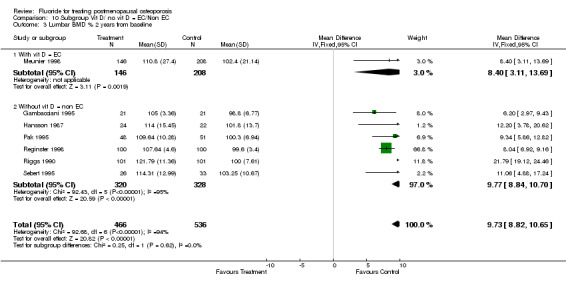
Comparison 10 Subgroup Vit D/ no vit D = EC/Non EC, Outcome 3 Lumbar BMD % 2 years from baseline.
10.4. Analysis.
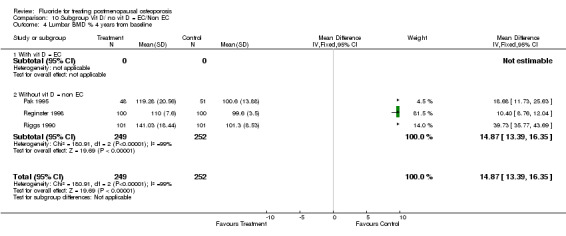
Comparison 10 Subgroup Vit D/ no vit D = EC/Non EC, Outcome 4 Lumbar BMD % 4 years from baseline.
10.5. Analysis.
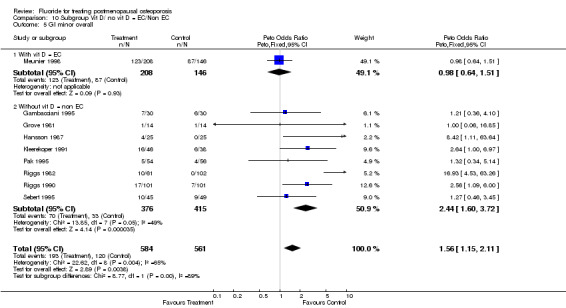
Comparison 10 Subgroup Vit D/ no vit D = EC/Non EC, Outcome 5 GI minor overall.
10.6. Analysis.
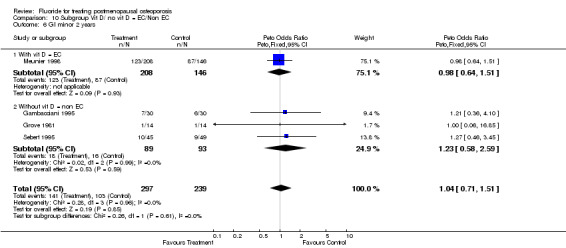
Comparison 10 Subgroup Vit D/ no vit D = EC/Non EC, Outcome 6 GI minor 2 years.
10.7. Analysis.
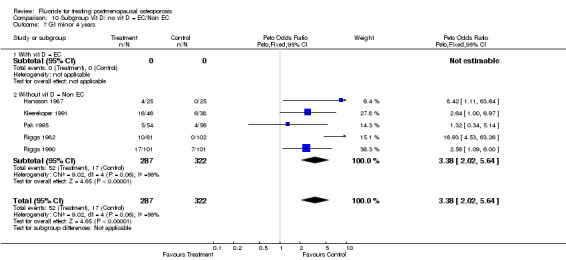
Comparison 10 Subgroup Vit D/ no vit D = EC/Non EC, Outcome 7 GI minor 4 years.
10.8. Analysis.
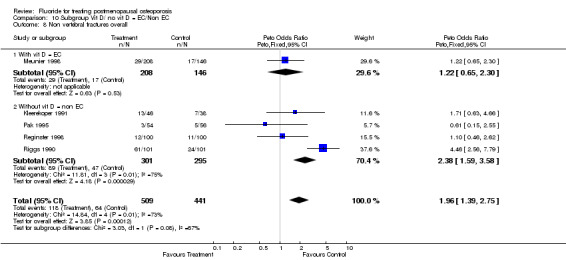
Comparison 10 Subgroup Vit D/ no vit D = EC/Non EC, Outcome 8 Non vertebral fractures overall.
10.9. Analysis.
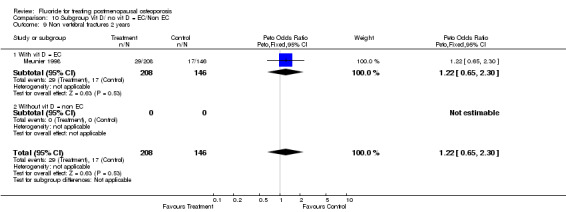
Comparison 10 Subgroup Vit D/ no vit D = EC/Non EC, Outcome 9 Non vertebral fractures 2 years.
10.10. Analysis.
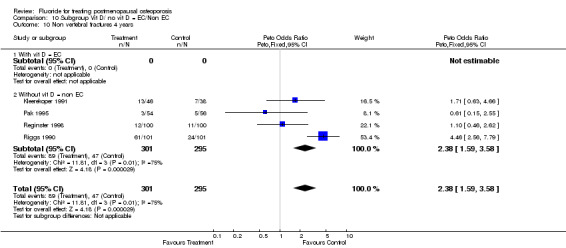
Comparison 10 Subgroup Vit D/ no vit D = EC/Non EC, Outcome 10 Non vertebral fractures 4 years.
10.11. Analysis.
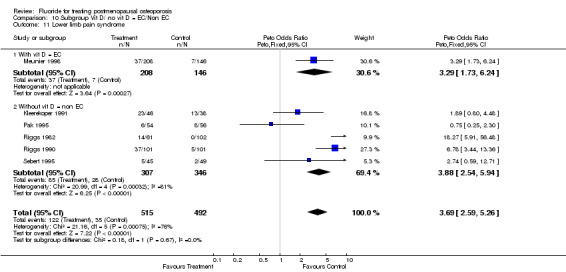
Comparison 10 Subgroup Vit D/ no vit D = EC/Non EC, Outcome 11 Lower limb pain syndrome.
10.12. Analysis.
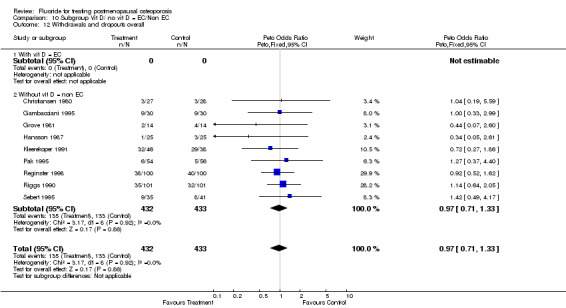
Comparison 10 Subgroup Vit D/ no vit D = EC/Non EC, Outcome 12 Withdrawals and dropouts overall.
10.13. Analysis.
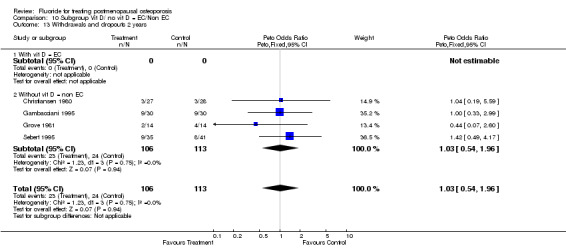
Comparison 10 Subgroup Vit D/ no vit D = EC/Non EC, Outcome 13 Withdrawals and dropouts 2 years.
10.14. Analysis.
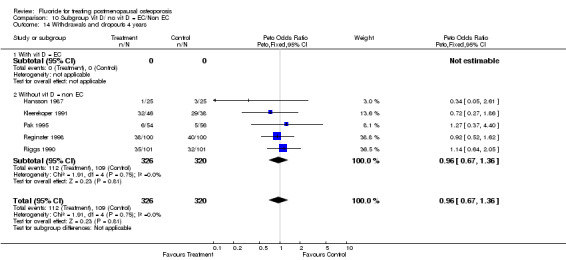
Comparison 10 Subgroup Vit D/ no vit D = EC/Non EC, Outcome 14 Withdrawals and dropouts 4 years.
Comparison 11. Subgroup HRT/non HRT.
| Outcome or subgroup title | No. of studies | No. of participants | Statistical method | Effect size |
|---|---|---|---|---|
| 1 No. People with new vertebral fractures‐2 years | 4 | 742 | Peto Odds Ratio (Peto, Fixed, 95% CI) | 0.95 [0.68, 1.32] |
| 1.1 HRT | 1 | 110 | Peto Odds Ratio (Peto, Fixed, 95% CI) | 0.34 [0.13, 0.86] |
| 1.2 Non HRT | 3 | 632 | Peto Odds Ratio (Peto, Fixed, 95% CI) | 1.10 [0.77, 1.56] |
| 2 No. People with new vertebral fractures 4 years | 5 | 646 | Peto Odds Ratio (Peto, Fixed, 95% CI) | 0.64 [0.43, 0.94] |
| 2.1 HRT | 2 | 310 | Peto Odds Ratio (Peto, Fixed, 95% CI) | 0.25 [0.12, 0.51] |
| 2.2 Non HRT | 3 | 336 | Peto Odds Ratio (Peto, Fixed, 95% CI) | 0.94 [0.59, 1.51] |
| 3 Lumbar BMD % 2 years from baseline | 7 | 1002 | Mean Difference (IV, Fixed, 95% CI) | 9.73 [8.82, 10.64] |
| 3.1 HRT | 2 | 299 | Mean Difference (IV, Fixed, 95% CI) | 8.17 [7.11, 9.23] |
| 3.2 Non HRT | 5 | 703 | Mean Difference (IV, Fixed, 95% CI) | 14.15 [12.36, 15.94] |
| 4 Lumbar BMD % 4 years from baseline | 3 | 501 | Mean Difference (IV, Fixed, 95% CI) | 14.87 [13.39, 16.35] |
| 4.1 HRT | 2 | 299 | Mean Difference (IV, Fixed, 95% CI) | 10.84 [9.24, 12.43] |
| 4.2 Non HRT | 1 | 202 | Mean Difference (IV, Fixed, 95% CI) | 39.73 [35.77, 43.69] |
| 5 GI minor overall | 9 | 1145 | Peto Odds Ratio (Peto, Fixed, 95% CI) | 1.56 [1.15, 2.11] |
| 5.1 HRT | 2 | 273 | Peto Odds Ratio (Peto, Fixed, 95% CI) | 4.91 [1.91, 12.65] |
| 5.2 Non HRT | 7 | 872 | Peto Odds Ratio (Peto, Fixed, 95% CI) | 1.37 [1.00, 1.88] |
| 6 GI minor 2 years | 4 | 536 | Peto Odds Ratio (Peto, Fixed, 95% CI) | 1.04 [0.71, 1.51] |
| 6.1 HRT | 0 | 0 | Peto Odds Ratio (Peto, Fixed, 95% CI) | 0.0 [0.0, 0.0] |
| 6.2 Non HRT | 4 | 536 | Peto Odds Ratio (Peto, Fixed, 95% CI) | 1.04 [0.71, 1.51] |
| 7 GI minor 4 years | 5 | 609 | Peto Odds Ratio (Peto, Fixed, 95% CI) | 3.38 [2.02, 5.64] |
| 7.1 HRT | 2 | 273 | Peto Odds Ratio (Peto, Fixed, 95% CI) | 4.91 [1.91, 12.65] |
| 7.2 Non HRT | 3 | 336 | Peto Odds Ratio (Peto, Fixed, 95% CI) | 2.89 [1.57, 5.32] |
| 8 Non vertebral fractures overall | 5 | 950 | Peto Odds Ratio (Peto, Fixed, 95% CI) | 1.96 [1.39, 2.75] |
| 8.1 HRT | 2 | 310 | Peto Odds Ratio (Peto, Fixed, 95% CI) | 0.94 [0.45, 1.97] |
| 8.2 Non HRT | 3 | 640 | Peto Odds Ratio (Peto, Fixed, 95% CI) | 2.38 [1.62, 3.50] |
| 9 Non vertebral fractures 2 years | 1 | 354 | Peto Odds Ratio (Peto, Fixed, 95% CI) | 1.22 [0.65, 2.30] |
| 9.1 HRT | 0 | 0 | Peto Odds Ratio (Peto, Fixed, 95% CI) | 0.0 [0.0, 0.0] |
| 9.2 Non HRT | 1 | 354 | Peto Odds Ratio (Peto, Fixed, 95% CI) | 1.22 [0.65, 2.30] |
| 10 Non vertebral fractures 4 years | 4 | 596 | Peto Odds Ratio (Peto, Fixed, 95% CI) | 2.38 [1.59, 3.58] |
| 10.1 HRT | 2 | 310 | Peto Odds Ratio (Peto, Fixed, 95% CI) | 0.94 [0.45, 1.97] |
| 10.2 Non HRT | 2 | 286 | Peto Odds Ratio (Peto, Fixed, 95% CI) | 3.56 [2.19, 5.79] |
| 11 Lower limb pain syndrome | 6 | 1007 | Peto Odds Ratio (Peto, Fixed, 95% CI) | 3.69 [2.59, 5.26] |
| 11.1 HRT | 2 | 273 | Peto Odds Ratio (Peto, Fixed, 95% CI) | 3.65 [1.65, 8.06] |
| 11.2 Non HRT | 4 | 734 | Peto Odds Ratio (Peto, Fixed, 95% CI) | 3.70 [2.49, 5.50] |
| 12 Withdrawals and dropouts overall | 9 | 865 | Peto Odds Ratio (Peto, Fixed, 95% CI) | 0.97 [0.71, 1.33] |
| 12.1 HRT | 2 | 310 | Peto Odds Ratio (Peto, Fixed, 95% CI) | 0.97 [0.58, 1.63] |
| 12.2 Non HRT | 7 | 555 | Peto Odds Ratio (Peto, Fixed, 95% CI) | 0.97 [0.66, 1.44] |
| 13 Withdrawals and dropouts 2 years | 4 | 219 | Peto Odds Ratio (Peto, Fixed, 95% CI) | 1.03 [0.54, 1.96] |
| 13.1 HRT | 0 | 0 | Peto Odds Ratio (Peto, Fixed, 95% CI) | 0.0 [0.0, 0.0] |
| 13.2 Non HRT | 4 | 219 | Peto Odds Ratio (Peto, Fixed, 95% CI) | 1.03 [0.54, 1.96] |
| 14 Withdrawals and dropouts 4 years | 5 | 646 | Peto Odds Ratio (Peto, Fixed, 95% CI) | 0.96 [0.67, 1.36] |
| 14.1 HRT | 2 | 310 | Peto Odds Ratio (Peto, Fixed, 95% CI) | 0.97 [0.58, 1.63] |
| 14.2 Non HRT | 3 | 336 | Peto Odds Ratio (Peto, Fixed, 95% CI) | 0.95 [0.58, 1.54] |
11.1. Analysis.
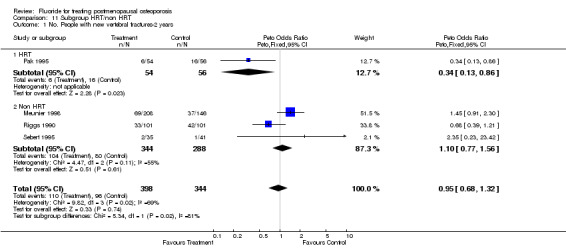
Comparison 11 Subgroup HRT/non HRT, Outcome 1 No. People with new vertebral fractures‐2 years.
11.2. Analysis.
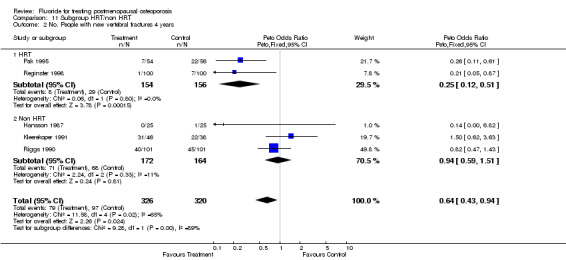
Comparison 11 Subgroup HRT/non HRT, Outcome 2 No. People with new vertebral fractures 4 years.
11.3. Analysis.
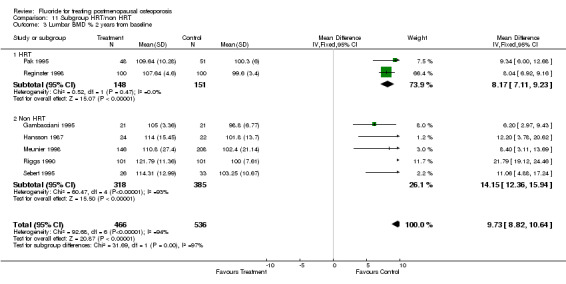
Comparison 11 Subgroup HRT/non HRT, Outcome 3 Lumbar BMD % 2 years from baseline.
11.4. Analysis.
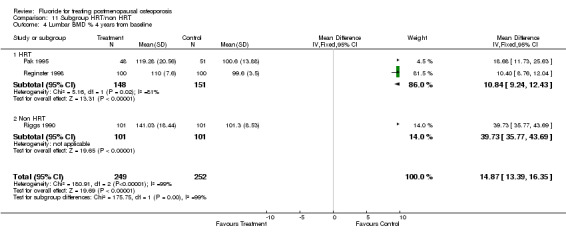
Comparison 11 Subgroup HRT/non HRT, Outcome 4 Lumbar BMD % 4 years from baseline.
11.5. Analysis.
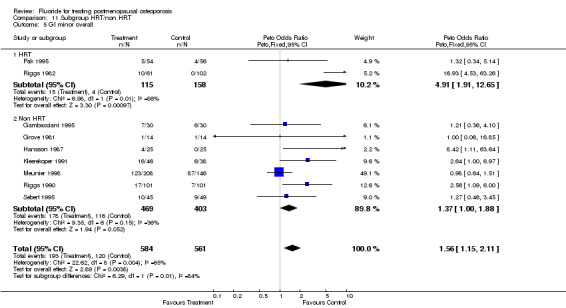
Comparison 11 Subgroup HRT/non HRT, Outcome 5 GI minor overall.
11.6. Analysis.
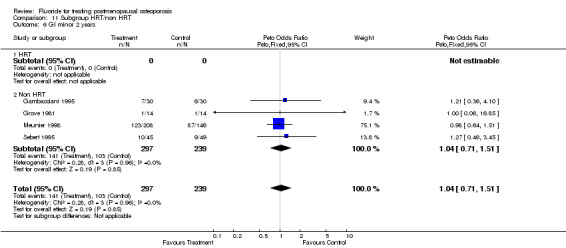
Comparison 11 Subgroup HRT/non HRT, Outcome 6 GI minor 2 years.
11.7. Analysis.
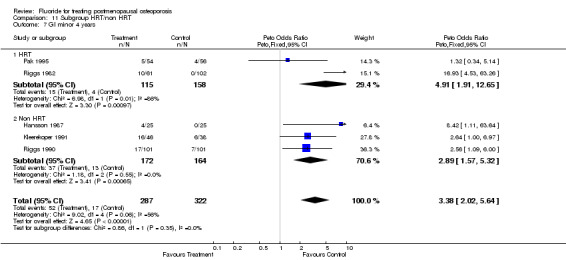
Comparison 11 Subgroup HRT/non HRT, Outcome 7 GI minor 4 years.
11.8. Analysis.
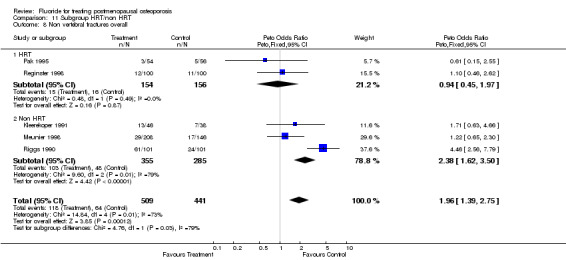
Comparison 11 Subgroup HRT/non HRT, Outcome 8 Non vertebral fractures overall.
11.9. Analysis.
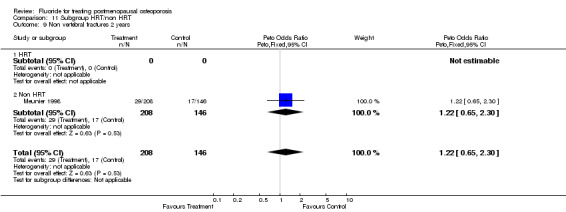
Comparison 11 Subgroup HRT/non HRT, Outcome 9 Non vertebral fractures 2 years.
11.10. Analysis.
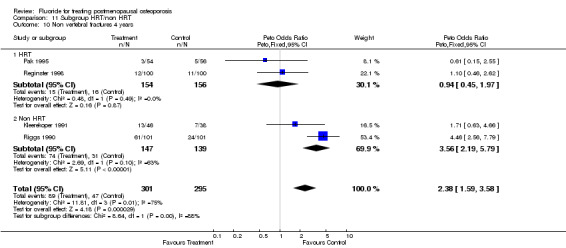
Comparison 11 Subgroup HRT/non HRT, Outcome 10 Non vertebral fractures 4 years.
11.11. Analysis.
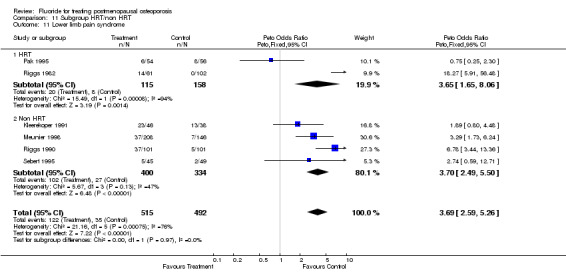
Comparison 11 Subgroup HRT/non HRT, Outcome 11 Lower limb pain syndrome.
11.12. Analysis.
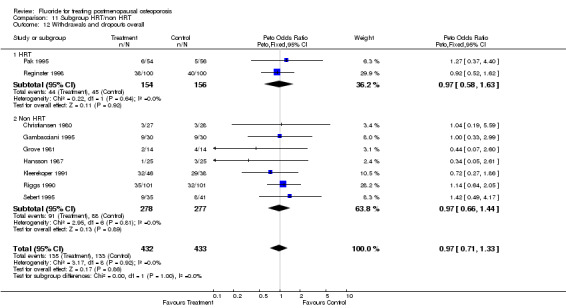
Comparison 11 Subgroup HRT/non HRT, Outcome 12 Withdrawals and dropouts overall.
11.13. Analysis.
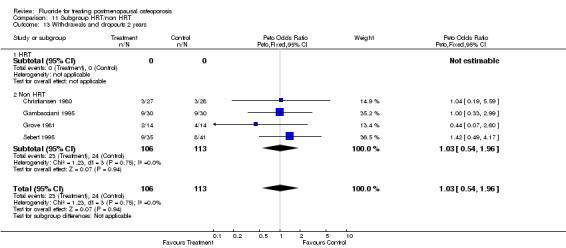
Comparison 11 Subgroup HRT/non HRT, Outcome 13 Withdrawals and dropouts 2 years.
11.14. Analysis.
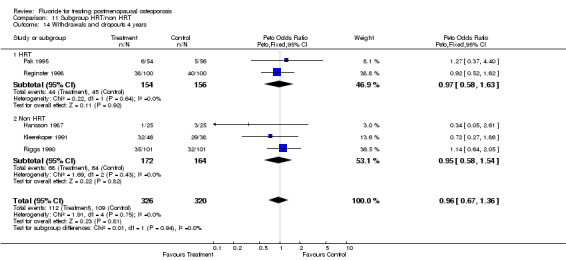
Comparison 11 Subgroup HRT/non HRT, Outcome 14 Withdrawals and dropouts 4 years.
Comparison 12. Subgroup SR/non SR.
| Outcome or subgroup title | No. of studies | No. of participants | Statistical method | Effect size |
|---|---|---|---|---|
| 1 No. People with new vertebral fractures‐2 years | 4 | 742 | Peto Odds Ratio (Peto, Fixed, 95% CI) | 0.95 [0.68, 1.32] |
| 1.1 SR | 1 | 110 | Peto Odds Ratio (Peto, Fixed, 95% CI) | 0.34 [0.13, 0.86] |
| 1.2 Non SR | 3 | 632 | Peto Odds Ratio (Peto, Fixed, 95% CI) | 1.10 [0.77, 1.56] |
| 2 No. People with new vertebral fractures 4 years | 5 | 646 | Peto Odds Ratio (Peto, Fixed, 95% CI) | 0.64 [0.43, 0.94] |
| 2.1 SR | 1 | 110 | Peto Odds Ratio (Peto, Fixed, 95% CI) | 0.26 [0.11, 0.61] |
| 2.2 Non SR | 4 | 536 | Peto Odds Ratio (Peto, Fixed, 95% CI) | 0.81 [0.52, 1.27] |
| 3 Lumbar BMD % 2 years from baseline | 7 | 1002 | Mean Difference (IV, Fixed, 95% CI) | 9.73 [8.82, 10.64] |
| 3.1 SR | 1 | 99 | Mean Difference (IV, Fixed, 95% CI) | 9.34 [6.00, 12.68] |
| 3.2 Non SR | 6 | 903 | Mean Difference (IV, Fixed, 95% CI) | 9.76 [8.81, 10.71] |
| 4 Lumbar BMD % 4 years from baseline | 3 | 501 | Mean Difference (IV, Fixed, 95% CI) | 14.87 [13.39, 16.35] |
| 4.1 SR | 1 | 99 | Mean Difference (IV, Fixed, 95% CI) | 18.68 [11.73, 25.63] |
| 4.2 Non SR | 2 | 402 | Mean Difference (IV, Fixed, 95% CI) | 14.69 [13.17, 16.20] |
| 5 GI minor overall | 9 | 1145 | Peto Odds Ratio (Peto, Fixed, 95% CI) | 1.56 [1.15, 2.11] |
| 5.1 SR | 1 | 110 | Peto Odds Ratio (Peto, Fixed, 95% CI) | 1.32 [0.34, 5.14] |
| 5.2 Non SR | 8 | 1035 | Peto Odds Ratio (Peto, Fixed, 95% CI) | 1.57 [1.16, 2.14] |
| 6 GI minor 2 years | 4 | 536 | Peto Odds Ratio (Peto, Fixed, 95% CI) | 1.04 [0.71, 1.51] |
| 6.1 SR | 0 | 0 | Peto Odds Ratio (Peto, Fixed, 95% CI) | 0.0 [0.0, 0.0] |
| 6.2 Non SR | 4 | 536 | Peto Odds Ratio (Peto, Fixed, 95% CI) | 1.04 [0.71, 1.51] |
| 7 GI minor 4 years | 4 | 559 | Peto Odds Ratio (Peto, Fixed, 95% CI) | 3.17 [1.87, 5.39] |
| 7.1 SR | 1 | 110 | Peto Odds Ratio (Peto, Fixed, 95% CI) | 1.32 [0.34, 5.14] |
| 7.2 Non SR | 3 | 449 | Peto Odds Ratio (Peto, Fixed, 95% CI) | 3.71 [2.09, 6.60] |
| 8 Non vertebral fractures overall | 5 | 950 | Peto Odds Ratio (Peto, Fixed, 95% CI) | 1.96 [1.39, 2.75] |
| 8.1 SR | 1 | 110 | Peto Odds Ratio (Peto, Fixed, 95% CI) | 0.61 [0.15, 2.55] |
| 8.2 Non SR | 4 | 840 | Peto Odds Ratio (Peto, Fixed, 95% CI) | 2.10 [1.48, 2.99] |
| 9 Non vertebral fractures 2 years | 1 | 354 | Peto Odds Ratio (Peto, Fixed, 95% CI) | 1.22 [0.65, 2.30] |
| 9.1 SR | 0 | 0 | Peto Odds Ratio (Peto, Fixed, 95% CI) | 0.0 [0.0, 0.0] |
| 9.2 Non SR | 1 | 354 | Peto Odds Ratio (Peto, Fixed, 95% CI) | 1.22 [0.65, 2.30] |
| 10 Non vertebral fractures 4 years | 4 | 596 | Peto Odds Ratio (Peto, Fixed, 95% CI) | 2.38 [1.59, 3.58] |
| 10.1 SR | 1 | 110 | Peto Odds Ratio (Peto, Fixed, 95% CI) | 0.61 [0.15, 2.55] |
| 10.2 Non SR | 3 | 486 | Peto Odds Ratio (Peto, Fixed, 95% CI) | 2.69 [1.76, 4.11] |
| 11 Lower limb pain syndrome | 6 | 1007 | Peto Odds Ratio (Peto, Fixed, 95% CI) | 3.69 [2.59, 5.26] |
| 11.1 SR | 1 | 110 | Peto Odds Ratio (Peto, Fixed, 95% CI) | 0.75 [0.25, 2.30] |
| 11.2 Non SR | 5 | 897 | Peto Odds Ratio (Peto, Fixed, 95% CI) | 4.41 [3.03, 6.41] |
| 12 Withdrawals and dropouts overall | 9 | 865 | Peto Odds Ratio (Peto, Fixed, 95% CI) | 0.97 [0.71, 1.33] |
| 12.1 SR | 1 | 110 | Peto Odds Ratio (Peto, Fixed, 95% CI) | 1.27 [0.37, 4.40] |
| 12.2 Non SR | 8 | 755 | Peto Odds Ratio (Peto, Fixed, 95% CI) | 0.96 [0.69, 1.32] |
| 13 Withdrawals and dropouts 2 years | 4 | 219 | Peto Odds Ratio (Peto, Fixed, 95% CI) | 1.03 [0.54, 1.96] |
| 13.1 SR | 0 | 0 | Peto Odds Ratio (Peto, Fixed, 95% CI) | 0.0 [0.0, 0.0] |
| 13.2 Non SR | 4 | 219 | Peto Odds Ratio (Peto, Fixed, 95% CI) | 1.03 [0.54, 1.96] |
| 14 Withdrawals and dropouts 4 years | 5 | 646 | Peto Odds Ratio (Peto, Fixed, 95% CI) | 0.96 [0.67, 1.36] |
| 14.1 SR | 1 | 110 | Peto Odds Ratio (Peto, Fixed, 95% CI) | 1.27 [0.37, 4.40] |
| 14.2 Non SR | 4 | 536 | Peto Odds Ratio (Peto, Fixed, 95% CI) | 0.93 [0.65, 1.35] |
12.1. Analysis.
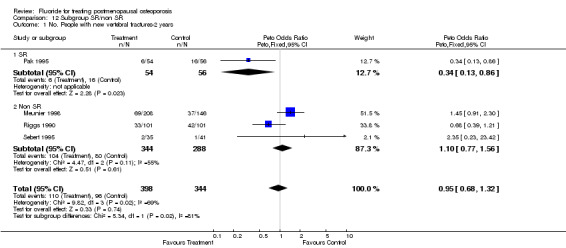
Comparison 12 Subgroup SR/non SR, Outcome 1 No. People with new vertebral fractures‐2 years.
12.2. Analysis.
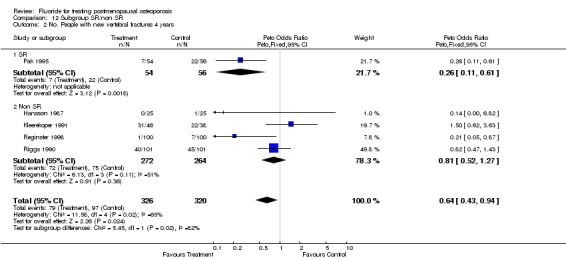
Comparison 12 Subgroup SR/non SR, Outcome 2 No. People with new vertebral fractures 4 years.
12.3. Analysis.
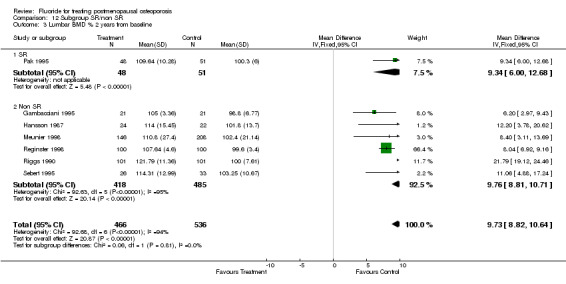
Comparison 12 Subgroup SR/non SR, Outcome 3 Lumbar BMD % 2 years from baseline.
12.4. Analysis.
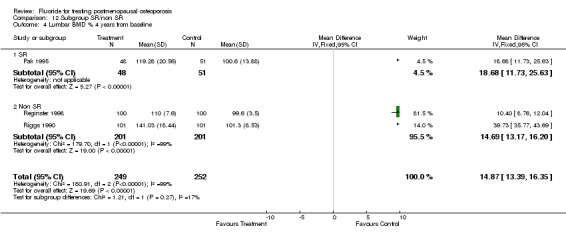
Comparison 12 Subgroup SR/non SR, Outcome 4 Lumbar BMD % 4 years from baseline.
12.5. Analysis.
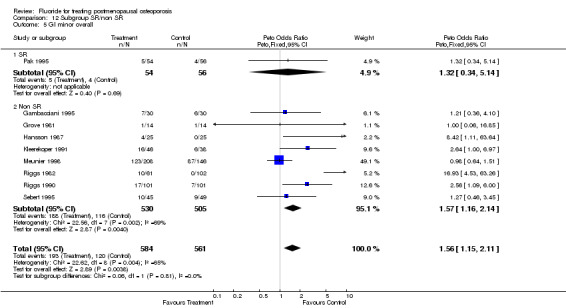
Comparison 12 Subgroup SR/non SR, Outcome 5 GI minor overall.
12.6. Analysis.
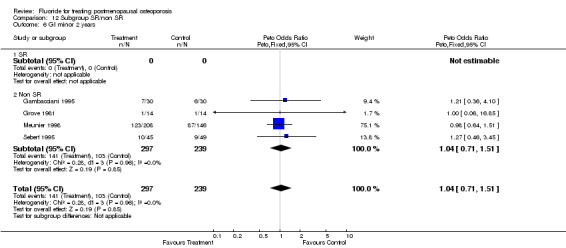
Comparison 12 Subgroup SR/non SR, Outcome 6 GI minor 2 years.
12.7. Analysis.
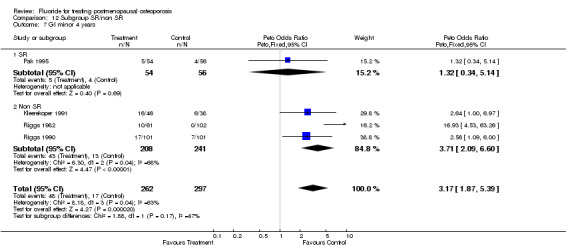
Comparison 12 Subgroup SR/non SR, Outcome 7 GI minor 4 years.
12.8. Analysis.
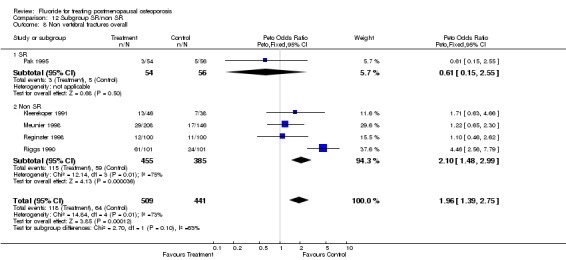
Comparison 12 Subgroup SR/non SR, Outcome 8 Non vertebral fractures overall.
12.9. Analysis.
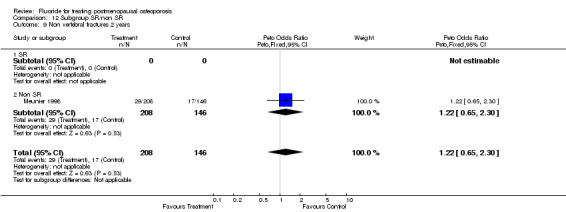
Comparison 12 Subgroup SR/non SR, Outcome 9 Non vertebral fractures 2 years.
12.10. Analysis.
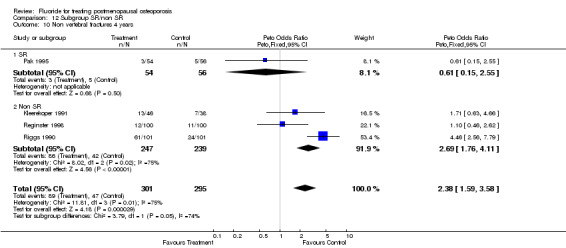
Comparison 12 Subgroup SR/non SR, Outcome 10 Non vertebral fractures 4 years.
12.11. Analysis.
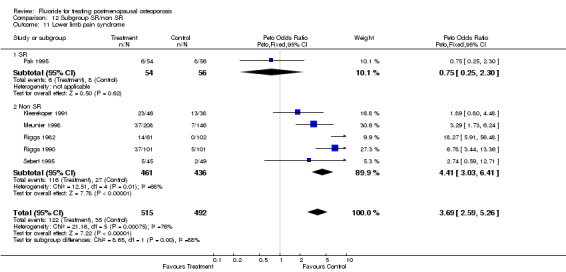
Comparison 12 Subgroup SR/non SR, Outcome 11 Lower limb pain syndrome.
12.12. Analysis.
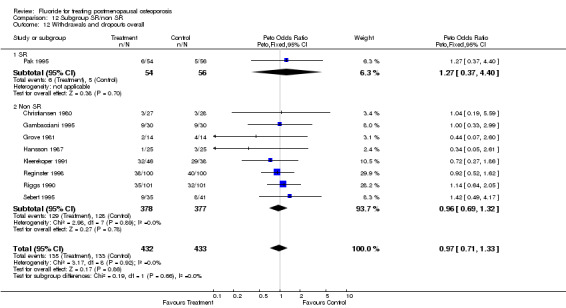
Comparison 12 Subgroup SR/non SR, Outcome 12 Withdrawals and dropouts overall.
12.13. Analysis.
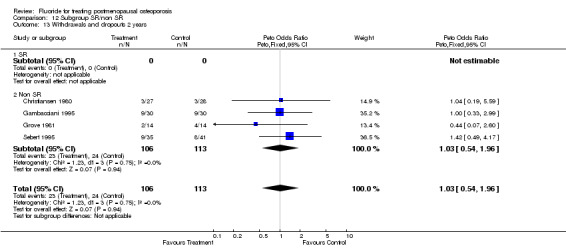
Comparison 12 Subgroup SR/non SR, Outcome 13 Withdrawals and dropouts 2 years.
12.14. Analysis.
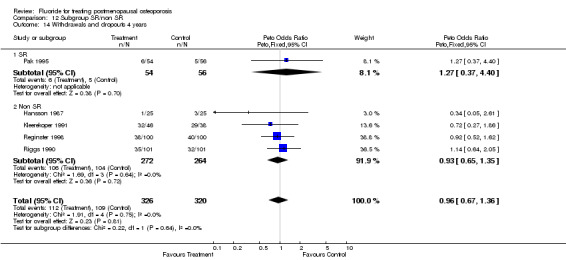
Comparison 12 Subgroup SR/non SR, Outcome 14 Withdrawals and dropouts 4 years.
Comparison 13. Subgroup Ca dosage and/or vit D.
| Outcome or subgroup title | No. of studies | No. of participants | Statistical method | Effect size |
|---|---|---|---|---|
| 1 No. people with new vertebral fracture 2 years | 4 | 742 | Peto Odds Ratio (Peto, Fixed, 95% CI) | 0.95 [0.68, 1.32] |
| 1.1 Ca 500 | 2 | 186 | Peto Odds Ratio (Peto, Fixed, 95% CI) | 0.44 [0.19, 1.05] |
| 1.2 Ca 1000 | 1 | 202 | Peto Odds Ratio (Peto, Fixed, 95% CI) | 0.68 [0.39, 1.21] |
| 1.3 Ca and vit D | 1 | 354 | Peto Odds Ratio (Peto, Fixed, 95% CI) | 1.45 [0.91, 2.30] |
| 2 No. people with new vertebral fracture 4 years | 5 | 646 | Peto Odds Ratio (Peto, Fixed, 95% CI) | 0.64 [0.43, 0.94] |
| 2.1 Ca 500 | 2 | 310 | Peto Odds Ratio (Peto, Fixed, 95% CI) | 0.25 [0.12, 0.51] |
| 2.2 Ca 1000 | 3 | 336 | Peto Odds Ratio (Peto, Fixed, 95% CI) | 0.94 [0.59, 1.51] |
| 2.3 Ca and vit D | 0 | 0 | Peto Odds Ratio (Peto, Fixed, 95% CI) | 0.0 [0.0, 0.0] |
| 3 Lumbar BMD % 2 years from baseline | 6 | 648 | Mean Difference (IV, Fixed, 95% CI) | 9.77 [8.84, 10.70] |
| 3.1 Ca 500 | 4 | 400 | Mean Difference (IV, Fixed, 95% CI) | 8.06 [7.06, 9.06] |
| 3.2 Ca 1000 | 2 | 248 | Mean Difference (IV, Fixed, 95% CI) | 20.92 [18.37, 23.46] |
| 3.3 Ca and vit D | 0 | 0 | Mean Difference (IV, Fixed, 95% CI) | 0.0 [0.0, 0.0] |
| 4 Lumbar BMD % 4 years from baseline | 3 | 501 | Mean Difference (IV, Fixed, 95% CI) | 14.87 [13.39, 16.35] |
| 4.1 Ca 500 | 2 | 299 | Mean Difference (IV, Fixed, 95% CI) | 10.84 [9.24, 12.43] |
| 4.2 Ca 1000 | 1 | 202 | Mean Difference (IV, Fixed, 95% CI) | 39.73 [35.77, 43.69] |
| 4.3 Ca and vit D | 0 | 0 | Mean Difference (IV, Fixed, 95% CI) | 0.0 [0.0, 0.0] |
| 5 GI minor overall | 7 | 932 | Peto Odds Ratio (Peto, Fixed, 95% CI) | 1.31 [0.96, 1.79] |
| 5.1 Ca 500 | 3 | 264 | Peto Odds Ratio (Peto, Fixed, 95% CI) | 1.26 [0.64, 2.47] |
| 5.2 Ca 1000 | 2 | 286 | Peto Odds Ratio (Peto, Fixed, 95% CI) | 2.60 [1.37, 4.92] |
| 5.3 Ca and vit D | 2 | 382 | Peto Odds Ratio (Peto, Fixed, 95% CI) | 0.98 [0.64, 1.50] |
| 6 GI minor 2 years | 4 | 536 | Peto Odds Ratio (Peto, Fixed, 95% CI) | 1.04 [0.71, 1.51] |
| 6.1 Ca 500 | 2 | 154 | Peto Odds Ratio (Peto, Fixed, 95% CI) | 1.24 [0.57, 2.70] |
| 6.2 Ca 1000 | 0 | 0 | Peto Odds Ratio (Peto, Fixed, 95% CI) | 0.0 [0.0, 0.0] |
| 6.3 Ca and vit D | 2 | 382 | Peto Odds Ratio (Peto, Fixed, 95% CI) | 0.98 [0.64, 1.50] |
| 7 GI minor 4 years | 3 | 396 | Peto Odds Ratio (Peto, Fixed, 95% CI) | 2.30 [1.29, 4.10] |
| 7.1 Ca 500 | 1 | 110 | Peto Odds Ratio (Peto, Fixed, 95% CI) | 1.32 [0.34, 5.14] |
| 7.2 Ca 1000 | 2 | 286 | Peto Odds Ratio (Peto, Fixed, 95% CI) | 2.60 [1.37, 4.92] |
| 7.3 Ca and vit D | 0 | 0 | Peto Odds Ratio (Peto, Fixed, 95% CI) | 0.0 [0.0, 0.0] |
| 8 Non vertebral fractures overall | 5 | 950 | Peto Odds Ratio (Peto, Fixed, 95% CI) | 1.96 [1.39, 2.75] |
| 8.1 Ca 500 | 1 | 110 | Peto Odds Ratio (Peto, Fixed, 95% CI) | 0.61 [0.15, 2.55] |
| 8.2 Ca 1000 | 2 | 286 | Peto Odds Ratio (Peto, Fixed, 95% CI) | 3.56 [2.19, 5.79] |
| 8.3 Ca and vit D | 2 | 554 | Peto Odds Ratio (Peto, Fixed, 95% CI) | 1.18 [0.71, 1.96] |
| 9 Non vertebral fractures 2 years | 1 | 354 | Peto Odds Ratio (Peto, Fixed, 95% CI) | 1.22 [0.65, 2.30] |
| 9.1 Ca 500 | 0 | 0 | Peto Odds Ratio (Peto, Fixed, 95% CI) | 0.0 [0.0, 0.0] |
| 9.2 Ca 1000 | 0 | 0 | Peto Odds Ratio (Peto, Fixed, 95% CI) | 0.0 [0.0, 0.0] |
| 9.3 Ca and vit D | 1 | 354 | Peto Odds Ratio (Peto, Fixed, 95% CI) | 1.22 [0.65, 2.30] |
| 10 Non vertebral fractures 4 years | 4 | 596 | Peto Odds Ratio (Peto, Fixed, 95% CI) | 2.38 [1.59, 3.58] |
| 10.1 Ca 500 | 2 | 310 | Peto Odds Ratio (Peto, Fixed, 95% CI) | 0.94 [0.45, 1.97] |
| 10.2 Ca 1000 | 2 | 286 | Peto Odds Ratio (Peto, Fixed, 95% CI) | 3.56 [2.19, 5.79] |
| 10.3 Ca and vit D | 0 | 0 | Peto Odds Ratio (Peto, Fixed, 95% CI) | 0.0 [0.0, 0.0] |
| 11 Lower limb pain syndrome | 5 | 844 | Peto Odds Ratio (Peto, Fixed, 95% CI) | 3.10 [2.13, 4.50] |
| 11.1 Ca 500 | 2 | 204 | Peto Odds Ratio (Peto, Fixed, 95% CI) | 1.18 [0.48, 2.91] |
| 11.2 Ca 1000 | 2 | 286 | Peto Odds Ratio (Peto, Fixed, 95% CI) | 4.17 [2.44, 7.10] |
| 11.3 Ca and vit D | 1 | 354 | Peto Odds Ratio (Peto, Fixed, 95% CI) | 3.29 [1.73, 6.24] |
| 12 Withdrawals and dropouts overall | 9 | 865 | Peto Odds Ratio (Peto, Fixed, 95% CI) | 0.97 [0.71, 1.33] |
| 12.1 Ca 500 | 4 | 446 | Peto Odds Ratio (Peto, Fixed, 95% CI) | 1.04 [0.68, 1.59] |
| 12.2 Ca 1000 | 3 | 336 | Peto Odds Ratio (Peto, Fixed, 95% CI) | 0.95 [0.58, 1.54] |
| 12.3 Ca and vit D | 2 | 83 | Peto Odds Ratio (Peto, Fixed, 95% CI) | 0.69 [0.20, 2.35] |
| 13 Withdrawals and dropouts 2 years | 4 | 219 | Peto Odds Ratio (Peto, Fixed, 95% CI) | 1.03 [0.54, 1.96] |
| 13.1 Ca 500 | 2 | 136 | Peto Odds Ratio (Peto, Fixed, 95% CI) | 1.20 [0.56, 2.58] |
| 13.2 Ca 1000 | 0 | 0 | Peto Odds Ratio (Peto, Fixed, 95% CI) | 0.0 [0.0, 0.0] |
| 13.3 Ca and vit D | 2 | 83 | Peto Odds Ratio (Peto, Fixed, 95% CI) | 0.69 [0.20, 2.35] |
| 14 Withdrawals and dropouts 4 years | 5 | 646 | Peto Odds Ratio (Peto, Fixed, 95% CI) | 0.96 [0.67, 1.36] |
| 14.1 Ca 500 | 2 | 310 | Peto Odds Ratio (Peto, Fixed, 95% CI) | 0.97 [0.58, 1.63] |
| 14.2 Ca 1000 | 3 | 336 | Peto Odds Ratio (Peto, Fixed, 95% CI) | 0.95 [0.58, 1.54] |
| 14.3 Ca and vit D | 0 | 0 | Peto Odds Ratio (Peto, Fixed, 95% CI) | 0.0 [0.0, 0.0] |
13.1. Analysis.
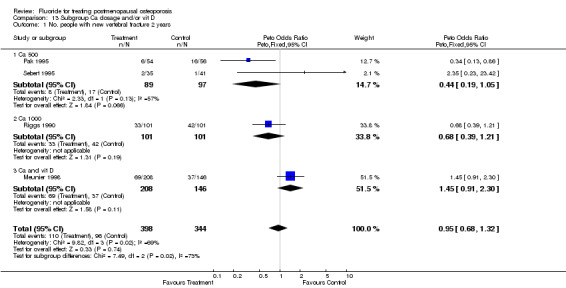
Comparison 13 Subgroup Ca dosage and/or vit D, Outcome 1 No. people with new vertebral fracture 2 years.
13.2. Analysis.
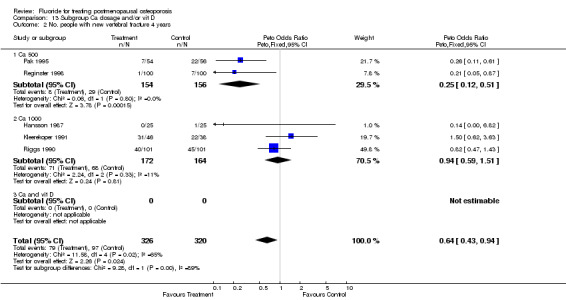
Comparison 13 Subgroup Ca dosage and/or vit D, Outcome 2 No. people with new vertebral fracture 4 years.
13.3. Analysis.
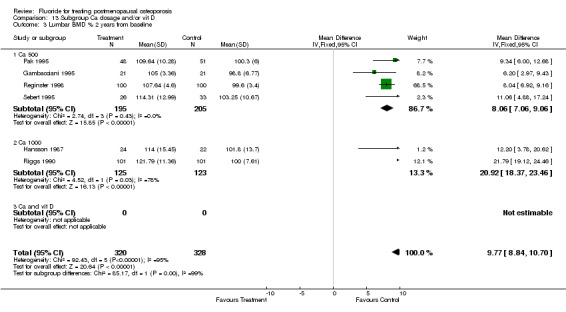
Comparison 13 Subgroup Ca dosage and/or vit D, Outcome 3 Lumbar BMD % 2 years from baseline.
13.4. Analysis.
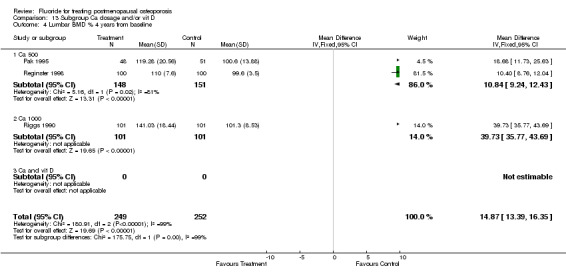
Comparison 13 Subgroup Ca dosage and/or vit D, Outcome 4 Lumbar BMD % 4 years from baseline.
13.5. Analysis.
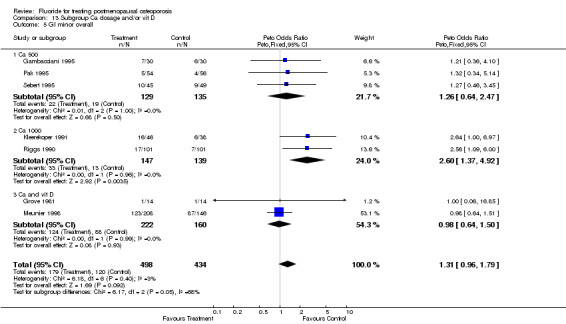
Comparison 13 Subgroup Ca dosage and/or vit D, Outcome 5 GI minor overall.
13.6. Analysis.
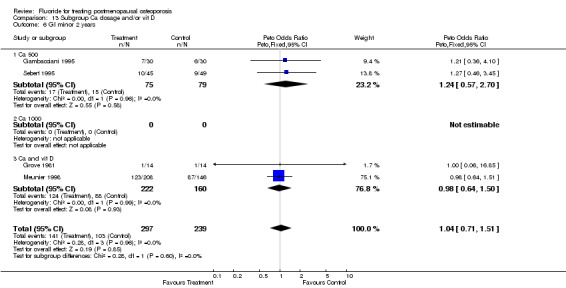
Comparison 13 Subgroup Ca dosage and/or vit D, Outcome 6 GI minor 2 years.
13.7. Analysis.
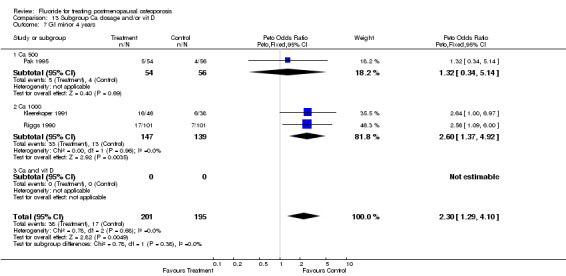
Comparison 13 Subgroup Ca dosage and/or vit D, Outcome 7 GI minor 4 years.
13.8. Analysis.
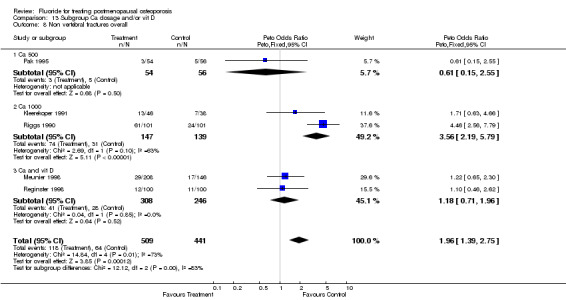
Comparison 13 Subgroup Ca dosage and/or vit D, Outcome 8 Non vertebral fractures overall.
13.9. Analysis.
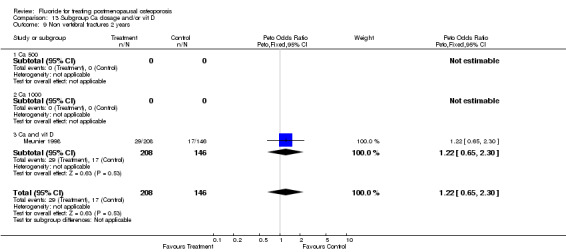
Comparison 13 Subgroup Ca dosage and/or vit D, Outcome 9 Non vertebral fractures 2 years.
13.10. Analysis.
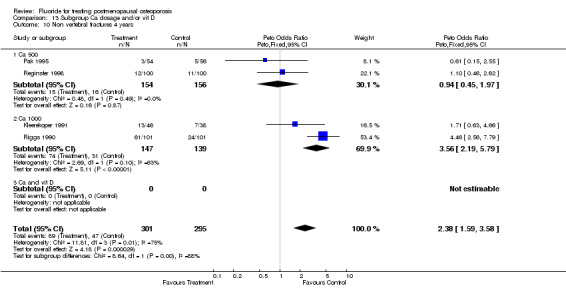
Comparison 13 Subgroup Ca dosage and/or vit D, Outcome 10 Non vertebral fractures 4 years.
13.11. Analysis.
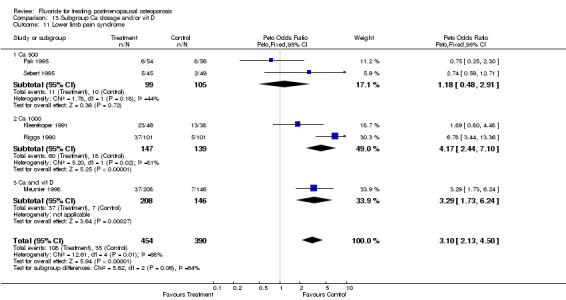
Comparison 13 Subgroup Ca dosage and/or vit D, Outcome 11 Lower limb pain syndrome.
13.12. Analysis.
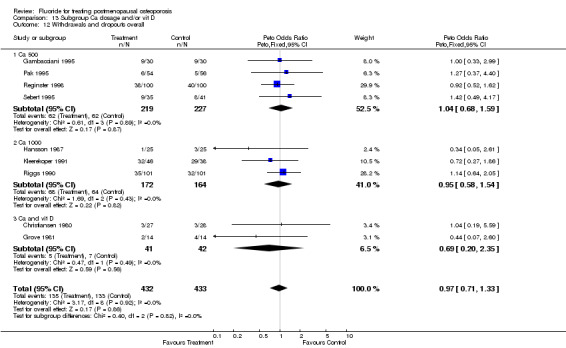
Comparison 13 Subgroup Ca dosage and/or vit D, Outcome 12 Withdrawals and dropouts overall.
13.13. Analysis.
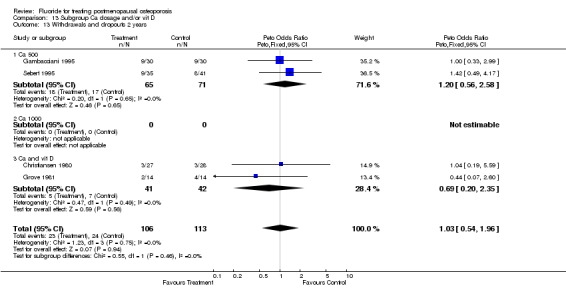
Comparison 13 Subgroup Ca dosage and/or vit D, Outcome 13 Withdrawals and dropouts 2 years.
13.14. Analysis.
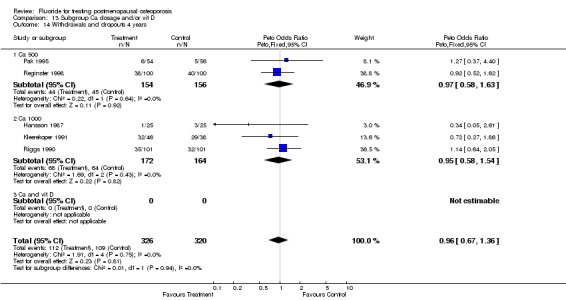
Comparison 13 Subgroup Ca dosage and/or vit D, Outcome 14 Withdrawals and dropouts 4 years.
Comparison 14. Subgroup Osteoporosis definition.
| Outcome or subgroup title | No. of studies | No. of participants | Statistical method | Effect size |
|---|---|---|---|---|
| 1 No. People with new vertebral fractures ‐ 2 years | 4 | 1054 | Peto Odds Ratio (Peto, Fixed, 95% CI) | 0.80 [0.61, 1.06] |
| 1.1 Incident fractures | 3 | 666 | Peto Odds Ratio (Peto, Fixed, 95% CI) | 0.93 [0.66, 1.30] |
| 1.2 BMD | 1 | 76 | Peto Odds Ratio (Peto, Fixed, 95% CI) | 2.35 [0.23, 23.42] |
| 1.3 Fractures or BMD | 2 | 312 | Peto Odds Ratio (Peto, Fixed, 95% CI) | 0.56 [0.35, 0.92] |
| 2 No. People with new vertebral fractures ‐ 4 years | 5 | 958 | Peto Odds Ratio (Peto, Fixed, 95% CI) | 0.61 [0.45, 0.82] |
| 2.1 Incident fractures | 4 | 446 | Peto Odds Ratio (Peto, Fixed, 95% CI) | 0.70 [0.46, 1.05] |
| 2.2 BMD | 1 | 200 | Peto Odds Ratio (Peto, Fixed, 95% CI) | 0.21 [0.05, 0.87] |
| 2.3 Fractures or BMD | 2 | 312 | Peto Odds Ratio (Peto, Fixed, 95% CI) | 0.58 [0.36, 0.92] |
| 3 Lumbar BMD % from baseline 2 years | 7 | 1207 | Mean Difference (IV, Fixed, 95% CI) | 11.80 [11.02, 12.59] |
| 3.1 incident fractures | 4 | 606 | Mean Difference (IV, Fixed, 95% CI) | 16.19 [14.58, 17.81] |
| 3.2 BMD | 3 | 301 | Mean Difference (IV, Fixed, 95% CI) | 7.93 [6.89, 8.98] |
| 3.3 Fractures or BMD | 2 | 300 | Mean Difference (IV, Fixed, 95% CI) | 17.64 [15.87, 19.41] |
| 4 Lumbar BMD % from baseline 4 years | 3 | 800 | Mean Difference (IV, Fixed, 95% CI) | 19.48 [18.20, 20.76] |
| 4.1 Incident fractures | 2 | 300 | Mean Difference (IV, Fixed, 95% CI) | 33.73 [30.82, 36.63] |
| 4.2 BMD | 1 | 200 | Mean Difference (IV, Fixed, 95% CI) | 10.40 [8.76, 12.04] |
| 4.3 Fractures or BMD | 2 | 300 | Mean Difference (IV, Fixed, 95% CI) | 33.73 [30.82, 36.63] |
| 5 GI minor overall | 9 | 1620 | Peto Odds Ratio (Peto, Fixed, 95% CI) | 1.81 [1.38, 2.37] |
| 5.1 Incident fractures | 7 | 991 | Peto Odds Ratio (Peto, Fixed, 95% CI) | 1.62 [1.17, 2.25] |
| 5.2 BMD | 2 | 154 | Peto Odds Ratio (Peto, Fixed, 95% CI) | 1.24 [0.57, 2.70] |
| 5.3 Fractures or BMD | 3 | 475 | Peto Odds Ratio (Peto, Fixed, 95% CI) | 3.43 [1.82, 6.45] |
| 6 GI minor 2 years | 4 | 536 | Peto Odds Ratio (Peto, Fixed, 95% CI) | 1.04 [0.71, 1.51] |
| 6.1 Incident fractures | 2 | 382 | Peto Odds Ratio (Peto, Fixed, 95% CI) | 0.98 [0.64, 1.50] |
| 6.2 BMD | 2 | 154 | Peto Odds Ratio (Peto, Fixed, 95% CI) | 1.24 [0.57, 2.70] |
| 6.3 Fractures or BMD | 0 | 0 | Peto Odds Ratio (Peto, Fixed, 95% CI) | 0.0 [0.0, 0.0] |
| 7 GI minor 4 years | 4 | 1034 | Peto Odds Ratio (Peto, Fixed, 95% CI) | 3.28 [2.18, 4.92] |
| 7.1 Incident fractures | 4 | 559 | Peto Odds Ratio (Peto, Fixed, 95% CI) | 3.17 [1.87, 5.39] |
| 7.2 BMD | 0 | 0 | Peto Odds Ratio (Peto, Fixed, 95% CI) | 0.0 [0.0, 0.0] |
| 7.3 Fractures or BMD | 3 | 475 | Peto Odds Ratio (Peto, Fixed, 95% CI) | 3.43 [1.82, 6.45] |
| 8 Non vertebral fractures overall | 5 | 1262 | Peto Odds Ratio (Peto, Fixed, 95% CI) | 2.32 [1.74, 3.09] |
| 8.1 Incident fractures | 4 | 750 | Peto Odds Ratio (Peto, Fixed, 95% CI) | 2.18 [1.50, 3.15] |
| 8.2 BMD | 1 | 200 | Peto Odds Ratio (Peto, Fixed, 95% CI) | 1.10 [0.46, 2.62] |
| 8.3 Fractures or BMD | 2 | 312 | Peto Odds Ratio (Peto, Fixed, 95% CI) | 3.43 [2.04, 5.77] |
| 9 Non vertebral fractures 2 years | 1 | 354 | Peto Odds Ratio (Peto, Fixed, 95% CI) | 1.22 [0.65, 2.30] |
| 9.1 Incident fractures | 1 | 354 | Peto Odds Ratio (Peto, Fixed, 95% CI) | 1.22 [0.65, 2.30] |
| 9.2 BMD | 0 | 0 | Peto Odds Ratio (Peto, Fixed, 95% CI) | 0.0 [0.0, 0.0] |
| 9.3 Fractures or BMD | 0 | 0 | Peto Odds Ratio (Peto, Fixed, 95% CI) | 0.0 [0.0, 0.0] |
| 10 Non vertebral fractures 4 years | 4 | 908 | Peto Odds Ratio (Peto, Fixed, 95% CI) | 2.74 [1.99, 3.77] |
| 10.1 Incident fractures | 3 | 396 | Peto Odds Ratio (Peto, Fixed, 95% CI) | 2.96 [1.87, 4.70] |
| 10.2 BMD | 1 | 200 | Peto Odds Ratio (Peto, Fixed, 95% CI) | 1.10 [0.46, 2.62] |
| 10.3 Fractures or BMD | 2 | 312 | Peto Odds Ratio (Peto, Fixed, 95% CI) | 3.43 [2.04, 5.77] |
| 11 Lower limb pain syndrome | 6 | 1482 | Peto Odds Ratio (Peto, Fixed, 95% CI) | 4.12 [3.08, 5.52] |
| 11.1 BMD | 5 | 913 | Peto Odds Ratio (Peto, Fixed, 95% CI) | 3.75 [2.61, 5.40] |
| 11.2 BMD | 1 | 94 | Peto Odds Ratio (Peto, Fixed, 95% CI) | 2.74 [0.59, 12.71] |
| 11.3 Fractures or BMD | 3 | 475 | Peto Odds Ratio (Peto, Fixed, 95% CI) | 5.22 [3.12, 8.74] |
| 12 Withdrawals and dropouts overall | 8 | 1122 | Peto Odds Ratio (Peto, Fixed, 95% CI) | 1.02 [0.78, 1.34] |
| 12.1 Incident fractures | 5 | 474 | Peto Odds Ratio (Peto, Fixed, 95% CI) | 0.94 [0.61, 1.45] |
| 12.2 BMD | 3 | 336 | Peto Odds Ratio (Peto, Fixed, 95% CI) | 1.01 [0.64, 1.59] |
| 12.3 Fractures or BMD | 2 | 312 | Peto Odds Ratio (Peto, Fixed, 95% CI) | 1.17 [0.69, 1.98] |
| 13 Withdrawals and dropouts 2 years | 3 | 164 | Peto Odds Ratio (Peto, Fixed, 95% CI) | 1.02 [0.51, 2.07] |
| 13.1 Incident fractures | 1 | 28 | Peto Odds Ratio (Peto, Fixed, 95% CI) | 0.44 [0.07, 2.60] |
| 13.2 BMD | 2 | 136 | Peto Odds Ratio (Peto, Fixed, 95% CI) | 1.20 [0.56, 2.58] |
| 13.3 Fractures or BMD | 0 | 0 | Peto Odds Ratio (Peto, Fixed, 95% CI) | 0.0 [0.0, 0.0] |
| 14 Withdrawals and dropouts 4 years | 4 | 874 | Peto Odds Ratio (Peto, Fixed, 95% CI) | 1.06 [0.78, 1.44] |
| 14.1 Incident fractures | 3 | 362 | Peto Odds Ratio (Peto, Fixed, 95% CI) | 1.08 [0.65, 1.80] |
| 14.2 BMD | 1 | 200 | Peto Odds Ratio (Peto, Fixed, 95% CI) | 0.92 [0.52, 1.62] |
| 14.3 Fractures or BMD | 2 | 312 | Peto Odds Ratio (Peto, Fixed, 95% CI) | 1.17 [0.69, 1.98] |
14.1. Analysis.
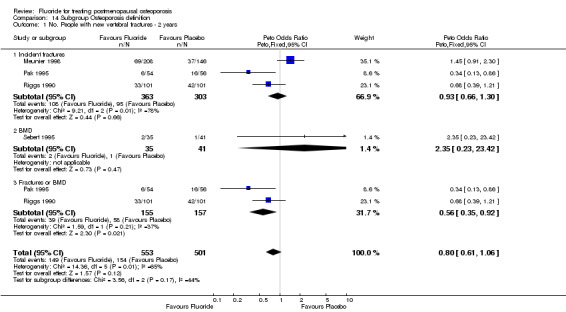
Comparison 14 Subgroup Osteoporosis definition, Outcome 1 No. People with new vertebral fractures ‐ 2 years.
14.2. Analysis.
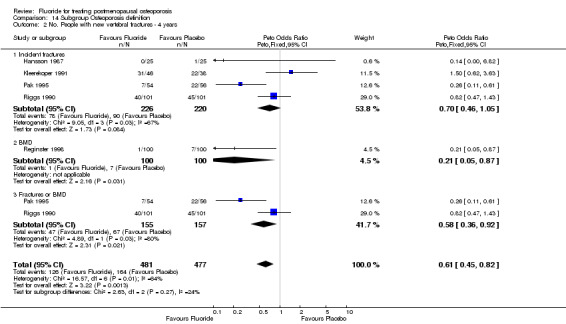
Comparison 14 Subgroup Osteoporosis definition, Outcome 2 No. People with new vertebral fractures ‐ 4 years.
14.3. Analysis.
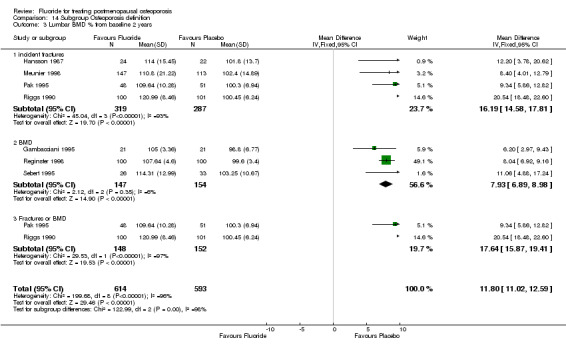
Comparison 14 Subgroup Osteoporosis definition, Outcome 3 Lumbar BMD % from baseline 2 years.
14.4. Analysis.
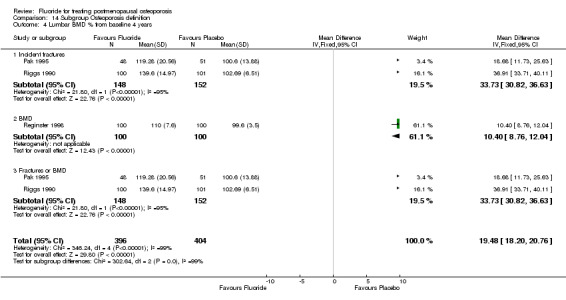
Comparison 14 Subgroup Osteoporosis definition, Outcome 4 Lumbar BMD % from baseline 4 years.
14.5. Analysis.
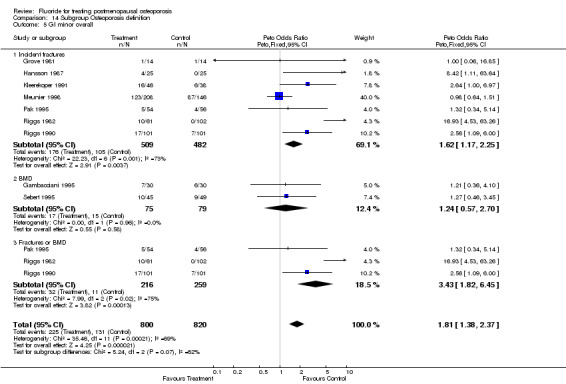
Comparison 14 Subgroup Osteoporosis definition, Outcome 5 GI minor overall.
14.6. Analysis.
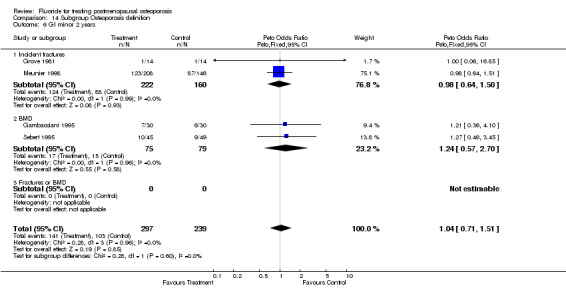
Comparison 14 Subgroup Osteoporosis definition, Outcome 6 GI minor 2 years.
14.7. Analysis.
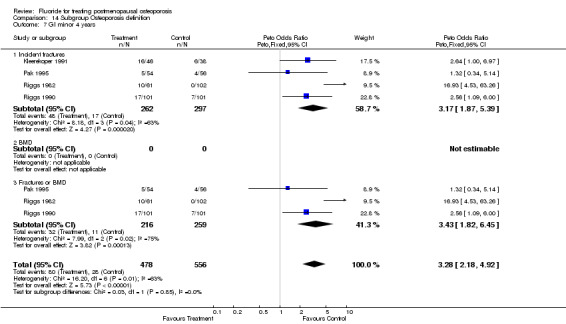
Comparison 14 Subgroup Osteoporosis definition, Outcome 7 GI minor 4 years.
14.8. Analysis.
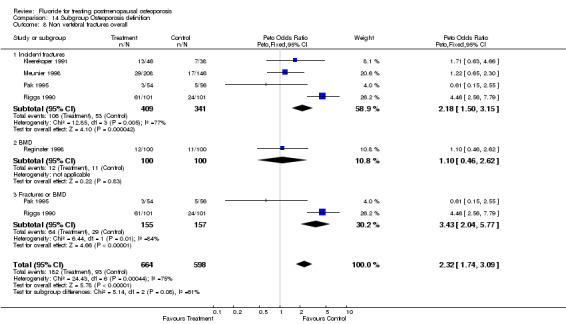
Comparison 14 Subgroup Osteoporosis definition, Outcome 8 Non vertebral fractures overall.
14.9. Analysis.
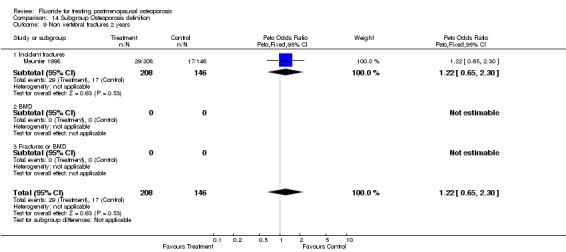
Comparison 14 Subgroup Osteoporosis definition, Outcome 9 Non vertebral fractures 2 years.
14.10. Analysis.
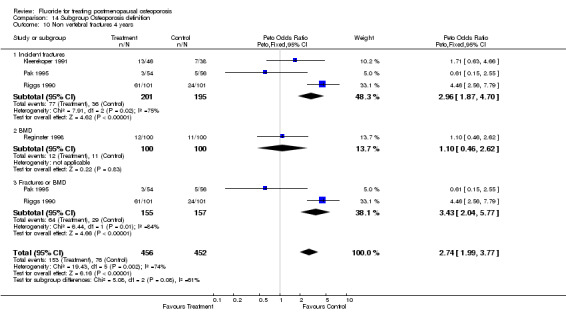
Comparison 14 Subgroup Osteoporosis definition, Outcome 10 Non vertebral fractures 4 years.
14.11. Analysis.
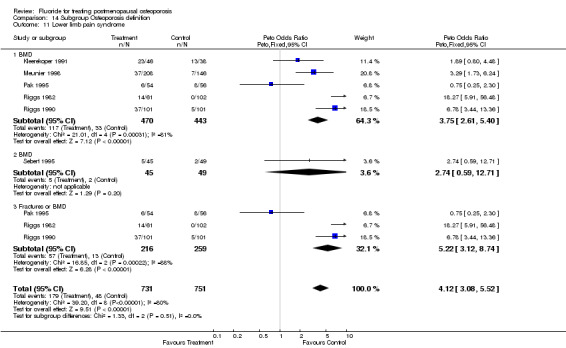
Comparison 14 Subgroup Osteoporosis definition, Outcome 11 Lower limb pain syndrome.
14.12. Analysis.
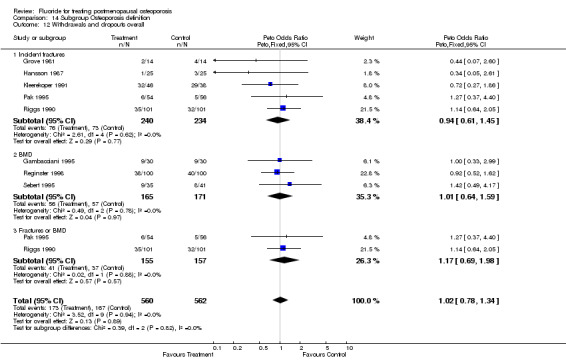
Comparison 14 Subgroup Osteoporosis definition, Outcome 12 Withdrawals and dropouts overall.
14.13. Analysis.
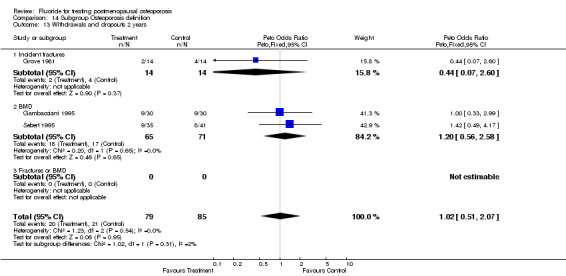
Comparison 14 Subgroup Osteoporosis definition, Outcome 13 Withdrawals and dropouts 2 years.
14.14. Analysis.
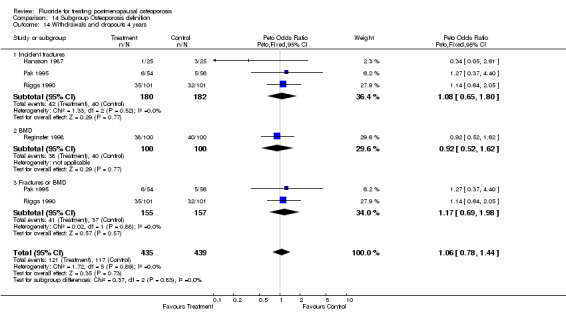
Comparison 14 Subgroup Osteoporosis definition, Outcome 14 Withdrawals and dropouts 4 years.
Characteristics of studies
Characteristics of included studies [ordered by study ID]
Christiansen 1980.
| Methods | RCT duration 24 months10 groups for randomisation. 56 patients in 2 fluoride groups and 259 in 8 control groups | |
| Participants | 315 post menopausal women Denmark age 50.1 time since menopause 19.1 months race NA |
|
| Interventions | Na F 9 mg element (low dose), non enteric coated, non slow‐releaseassociated treatment calciumversus HRT Thiazides, vit D or 1 alpha vit D | |
| Outcomes | %change in BMC forearm | |
| Notes | quality score 4 randomization 2 blinding 1 withdrawals and dropouts 1 | |
| Risk of bias | ||
| Bias | Authors' judgement | Support for judgement |
| Allocation concealment? | Unclear risk | B ‐ Unclear |
Gambacciani 1995.
| Methods | RCT duration 24 months30 patients in the fluoride group, 30 in the control group | |
| Participants | 60 postmenopausal osteopenic women in Italy age 51.6 52.3 in each group race NA years since menopause [2‐5] natural menopause 100% | |
| Interventions | MFP 20 mg element fluoride (low dose), non enteric‐coated, non slow‐release associated treatment calciumversus placebo | |
| Outcomes | BMD lumbar, total body, legs, arms GI side effects | |
| Notes | quality score 2 randomization 1 blinding 0 withdrawals and dropouts 1 | |
| Risk of bias | ||
| Bias | Authors' judgement | Support for judgement |
| Allocation concealment? | Unclear risk | B ‐ Unclear |
Grove 1981.
| Methods | RCT duration 3 months14 patients in each group | |
| Participants | 28 postmenopausal women with backpain and vertebral fracture age 73.9 menopause duration NA race NA |
|
| Interventions | NaF 9 mg fluoride element (low dose), non enteric‐coated, non slow‐release associated treatment calcium plus vitamine Dversus placebo | |
| Outcomes | forearm cnange in BMC, pain sore, strenght score, metacarpal index | |
| Notes | quality score 2 randomization 1 blinding 0 withdrawals and dropouts 1 | |
| Risk of bias | ||
| Bias | Authors' judgement | Support for judgement |
| Allocation concealment? | Unclear risk | B ‐ Unclear |
Hansson 1987.
| Methods | RCT duration 36 months25 patients in each treated and placebo group | |
| Participants | 100 osteoporotic postmenopausal women in Sweden age 66 duration of menopause NA race NA |
|
| Interventions | Na F 4.5 or 13.6 fluoride element (low dose), non enteric‐coated, non slow‐release associated treatment calcium versus placebo or calcium | |
| Outcomes | Lumbar BMC | |
| Notes | quality score 2 randomization 1 blinding 0 withdrawals and dropouts 1 | |
| Risk of bias | ||
| Bias | Authors' judgement | Support for judgement |
| Allocation concealment? | Unclear risk | B ‐ Unclear |
Kleerekoper 1991.
| Methods | RCT duration 48 months46 patients in fluoride group, 38 in control group | |
| Participants | 84 post menopausal osteoporotic women, in USA age 66.2 duration of menopause 21.4 race 100% caucasian | |
| Interventions | Na F 34 mg fluoride element (high dose), non enteric‐coated, non slow release associated treatment calciumversus placebo | |
| Outcomes | vertebral fractures, non vertebral fractures, height, forearm BMD, GI side effects | |
| Notes | quality score 4 randomization 1 blinding 2 withdrawals and dropouts 1 | |
| Risk of bias | ||
| Bias | Authors' judgement | Support for judgement |
| Allocation concealment? | Unclear risk | B ‐ Unclear |
Meunier 1998.
| Methods | RCT duration 24 months208 patients in fluoride group and146 in control group | |
| Participants | 354 postmenopausal osteoporotic women in France age 65.7 durtation of menopause NA race 100% caucasian | |
| Interventions | Na F 22.6 mg fluoride element (low dose) enteric coated, non slow release,versus MFP 19.8 mg or 26.4 mg element fluoride (low doses), non enteric coated, non slow‐releaseassociated treatment calcium plus vitamine Dversus placebo | |
| Outcomes | vertebral and non vertebral fractures, lumbar and femoral neck BMD, lower limb pain syndrome and GI side effects | |
| Notes | quality score 2 randomization 1 blinding 0 withdrawals and dropouts 1 | |
| Risk of bias | ||
| Bias | Authors' judgement | Support for judgement |
| Allocation concealment? | Unclear risk | B ‐ Unclear |
Pak 1994a.
| Methods | ||
| Participants | ||
| Interventions | ||
| Outcomes | ||
| Notes | ||
| Risk of bias | ||
| Bias | Authors' judgement | Support for judgement |
| Allocation concealment? | Unclear risk | D ‐ Not used |
Pak 1995.
| Methods | RCT duration 48 months54 patients in fluoride group and 56 in control group | |
| Participants | 110 postmenopausal osteoporotic women in USA age 67.6 duration of menopause 19.2 race NA | |
| Interventions | Na F 27.5 mg element (low dose), non enteric‐coated, slow ‐releaseassociated treatment calcium with or without HRTversus placebo | |
| Outcomes | vertebral and non vertebral fractures , BMD femoral neck and forearm, BMC lumbar, GI side effects | |
| Notes | quality score 2 randomization 1 blinding 0 withdrawals and dropouts 1 | |
| Risk of bias | ||
| Bias | Authors' judgement | Support for judgement |
| Allocation concealment? | Unclear risk | B ‐ Unclear |
Reginster 1998.
| Methods | RCT duration 4 years in Belgium ; outpatients100 patients in each treated and control groups | |
| Participants | 200 White postmenopausal women : ; with BMD <= 2.5 T‐Score regardless to any previous fractures except hip ; mean age 63.5 ; mean age at menopause 48.5 | |
| Interventions | MPF 20 mg Fluoride element (low dose), non enteric‐coated, non slow‐release associated treatment calcium 1000mgversus placebo | |
| Outcomes | Fractures : ‐ vertebral and non vertebral BMD : ‐ lumbar and total hip | |
| Notes | Quality score 5 randomization 2 blinding 2 withdrawals and dropouts 1 | |
| Risk of bias | ||
| Bias | Authors' judgement | Support for judgement |
| Allocation concealment? | Low risk | A ‐ Adequate |
Riggs 1982.
| Methods | RCT duration 4 years approximatively61 patient in 2 fluoride groups and 104 in 3 control groups | |
| Participants | 165 postmenopausal osteoporotic women in USA 5 groups of randomization | |
| Interventions | Na F 27.5 mg element (low dose), non enteric‐coated, non slow‐releasewith or without calciumversus placebo, calcium, or ostrogen | |
| Outcomes | vertebral fractures, GI side effects | |
| Notes | quality score 1 randomization 0 blinding 0 withdrawals and dropouts 1 | |
| Risk of bias | ||
| Bias | Authors' judgement | Support for judgement |
| Allocation concealment? | Unclear risk | B ‐ Unclear |
Riggs 1990.
| Methods | RCT duration 48 months101 patients in each fluoride and control group | |
| Participants | 202 postmenopausal osteoporotic women in USA age 68 duration of menopause 21.25 race 100% caucasian | |
| Interventions | Na F, 41.25 mg fluoride element (high dose), non enteric‐coated, non slow‐releaseversus placebo associated treatment calcium | |
| Outcomes | lumbar BMD, vertebral and non vertebral fractures, BMD femoral neck and femoral trochanter , GI side effects | |
| Notes | quality score 2 randomization 1 blinding 0 withdrawals and dropouts 1 | |
| Risk of bias | ||
| Bias | Authors' judgement | Support for judgement |
| Allocation concealment? | Unclear risk | B ‐ Unclear |
Sebert 1995.
| Methods | RCT duration 24 months35 patients in fluoride group and 41 in control group | |
| Participants | 94 osteoporotic men and women (% of men 4) in France age 60.35 duration of menopause NA race NA | |
| Interventions | MFP 26.4 mg fluoride element (low dose), non‐enteric‐coated, non slow‐releaseversus placebo associated treatment calcium | |
| Outcomes | lumbar BMD, vertebral and non vertebral fractures, lwr limb pain syndrome, GI side effects | |
| Notes | quality score 2 randomization 1 blinding 1 withdrawals and dropouts 0 | |
| Risk of bias | ||
| Bias | Authors' judgement | Support for judgement |
| Allocation concealment? | Unclear risk | B ‐ Unclear |
Characteristics of excluded studies [ordered by study ID]
| Study | Reason for exclusion |
|---|---|
| Affinito 1993 | Opened trial |
| Antich 1993 | Cohort study |
| Battmann 1997 | Biochemical outcomes only |
| Dambacher 1976 | Opened trial |
| Dambacher 1986 | Not an RCT |
| Eriksen 1985 | Not an RCT |
| Erlacher 1994 | Biochemical outcomes only |
| Hedlund 1989 | Fluoride therapy present in both groups of randomization. |
| Inkovaara 1973 | Not an RCT |
| Inkovaara 1975 | Not an RCT |
| Jowsey 1971 | Duplicate publication |
| Jowsey 1972 | Duplicate publication |
| Jowsey 1975 | Not an RCT |
| Riggs 1973 | Not an RCT |
| Riggs 1994 | Non randomized end of a RCT |
| Ringe 1987 | Combination therapy |
| Ringe 1998 | Population : only men |
| Takizawa 1980 | Written in Japanese |
| Vose 1978 | Population : men only |
Contributions of authors
DH was responsible for the development of the protocol and the overall content for the review.
VW was involved in the selection of the articles, data abstraction, drafting in the final review.
BS was involved in the quality assessment, provided methodological advice and contributed to the development of the review and the final version.
PT was responsible for the content development throughout the protocol and review stage.
GW provided statistical support throughout the review process, and had extensive input into the analytic section of the review.
Sources of support
Internal sources
University of Ottawa, Canada.
Loeb Health Research Institute, Canada.
External sources
No sources of support supplied
Declarations of interest
None known.
Edited (no change to conclusions)
References
References to studies included in this review
Christiansen 1980 {published data only}
- Christiansen C, Christensen MS, McNair P, et al. Prevention of early postmenopausal bone loss: controlled 2‐year study in 315 normal females.. Eur J Clin Invest 1980;10(4):273‐279. [DOI] [PubMed] [Google Scholar]
Gambacciani 1995 {published data only}
- Gambacciani M, Spinetti A, Taponeco F, et al. Treatment of postmenopausal vertebral osteopenia with monofluorophospate: a long‐term calcium‐controlled study. Osteoporosis International 1995;5(6):467‐471. [DOI] [PubMed] [Google Scholar]
Grove 1981 {published data only}
- Grove O, Halver B. Relief of osteoporotic backache with fluoride, calcium, and calciferol. Acta Med Scand 1981;209(6):469‐471. [DOI] [PubMed] [Google Scholar]
Hansson 1987 {published data only}
- Hansson T, Roos B. The effect of fluoride and calcium on spinal bone mineral content: a controlled, prospective (3 years) study. Calcif Tissue Int 1987;40(6):315‐317. [DOI] [PubMed] [Google Scholar]
Kleerekoper 1991 {published data only}
- Kleerekoper M, Peterson EL, Nelson DA, et al. A randomized trial of sodium fluoride as a treatment for postmenopausal osteoporosis. Osteoporos Int 1991;1(3):155‐161. [DOI] [PubMed] [Google Scholar]
Meunier 1998 {published data only}
- Meunier PJ, Sebert JL, Reginster JY, et al. Fluoride salts are no better at preventing new vertebral fractures than calcium‐vitamin D in postmenopausal osteoporosis: the FAVOStudy. Osteoporos Int 1998;8:4‐12. [DOI] [PubMed] [Google Scholar]
Pak 1994a {published data only}
- Pak CY, Sakhaee K, Piziak V, et al. Slow‐release sodium fluoride in the management of postmenopausal osteoporosis. A randomized controlled trial [see comments]. Ann Intern Med 1994;120(8):625‐632. [DOI] [PubMed] [Google Scholar]
Pak 1995 {published data only}
- Pak CY, Sakhaee K, Adams‐Huet B, et al. Treatment of postmenopausal osteoporosis with slow‐release sodium fluoride. Final report of a randomized controlled trial [see comments]. Ann Intern Med 1995b;123(6):401‐408. [DOI] [PubMed] [Google Scholar]
Reginster 1998 {published data only}
- Reginster JY, Meurmans L, Zegels B, et al. The effect of sodium monofluorophosphate plus calcium on vertebral fracture rate in postmenopausal women with moderate osteoporosis. A randomized, controlled trial. Ann Intern Med 1998;129(1):1‐8. [DOI] [PubMed] [Google Scholar]
Riggs 1982 {published data only}
- Riggs BL, Seeman E, Hodgson SF, Taves DR, O'Fallon WM. Effect of the fluoride/calcium regimen on vertebral fracture occurrence in postmenopausal osteoporosis. Comparison with conventional therapy. N Engl J Med 1982;306(8):446‐450. [DOI] [PubMed] [Google Scholar]
Riggs 1990 {published data only}
- Riggs BL, Hodgson SF, O'Fallon WM, et al. Effect of fluoride treatment on the fracture rate in postmenopausal women with osteoporosis. N Engl J Med 1990;322(12):802‐809. [DOI] [PubMed] [Google Scholar]
Sebert 1995 {published data only}
- Sebert JL, Richard P, Mennecier I, Bisset JP, Loeb G. Monofluorophosphate increases lumbar bone density in osteopenic patients: a double‐masked randomized study. Osteoporos Int 1995;5(2):108‐114. [DOI] [PubMed] [Google Scholar]
References to studies excluded from this review
Affinito 1993 {published data only}
- Affinito P, Di CC, Primizia M, et al. A new fluoride preparation for the prevention of postmenopausal osteoporosis: calcium monofluorophosphate. Gynecological Endocrinology 1993;7(3):201‐205. [DOI] [PubMed] [Google Scholar]
Antich 1993 {published data only}
- Antich PP, Pak CY, Gonzales J, et al. Measurement of intrinsic bone quality in vivo by reflection ultrasound: correction of impaired quality with slow‐release sodium fluoride and calcium citrate.. Journal of Bone & Mineral Research 1993;8(3):301‐311. [DOI] [PubMed] [Google Scholar]
Battmann 1997 {published data only}
- Battmann A, Resch H, Libanati CR, et al. Serum fluoride and serum osteocalcin levels in response to a novel sustained‐release monofluorophosphate preparation: comparison with plain monofluorophosphate. Osteoporosis International 1997;7(1):48‐51. [DOI] [PubMed] [Google Scholar]
Dambacher 1976 {published data only}
- Dambacher MA, Haas HG. [Fluoride therapy of osteoporosis]. [German].. Deutsche Medizinische Wochenschrift 1976;101(13):504‐506. [DOI] [PubMed] [Google Scholar]
Dambacher 1986 {published data only}
- Dambacher MA, Ittner J, Ruegsegger P. Long‐term fluoride therapy of postmenopausal osteoporosis. Bone 1986;7(3):199‐205. [DOI] [PubMed] [Google Scholar]
Eriksen 1985 {published data only}
- Eriksen EF, Mosekilde L, Melsen F. Effect of sodium fluoride, calcium, phosphate, and vitamin D2 on trabecular bone balance and remodeling in osteoporotics. Bone 1985;6(5):381‐389. [DOI] [PubMed] [Google Scholar]
Erlacher 1994 {published data only}
- Erlacher L, Teufelsbauer H, Bernecker P, Pietschmann P, Weissel M. Comparison of serum fluoride levels after administration of monofluorophosphate‐calcium carbonate or sodium fluoride: differences in peak serum concentrations. Clinical Investigator 1994;72(12):1082‐1085. [DOI] [PubMed] [Google Scholar]
Hedlund 1989 {published data only}
- Hedlund LR, Gallagher JC. Increased incidence of hip fracture in osteoporotic women treated with sodium fluoride. Journal of Bone & Mineral Research 1989;4(2):223‐225. [DOI] [PubMed] [Google Scholar]
Inkovaara 1973 {published data only}
- Inkovaara J, Hanhijarvi H, Iisalo E, Jarvinen K. Fluoride and osteoporosis. British Medical Journal 1973;1(853):613‐. [DOI] [PMC free article] [PubMed] [Google Scholar]
Inkovaara 1975 {published data only}
- Inkovaara J, Heikinheimo R, Jarvinen K, et al. Prophylactic fluoride treatment and aged bones. British Medical Journal 1975;3(5975):73‐74. [DOI] [PMC free article] [PubMed] [Google Scholar]
Jowsey 1971 {published data only}
- Jowsey J, Riggs BL, Kelly PJ, Hoffman DL. Effect of combined therapy with sodium fluoride, vitamin D, and calcium in osteoporosis. Journal of Laboratory & Clinical Medicine 1971;78(6):994‐995. [PubMed] [Google Scholar]
Jowsey 1972 {published data only}
- Jowsey J, Riggs BL, Kelly PJ, Hoffmann DL. Effect of combined therapy with sodium fluoride, vitamin D and calcium in osteoporosis. American Journal of Medicine 1972;53(1):43‐49. [DOI] [PubMed] [Google Scholar]
Jowsey 1975 {published data only}
- Jowsey J, Riggs BL. Letter: Prophylactic fluoride treatment and aged bones. British Medical Journal 1975;3(5986):766‐. [DOI] [PMC free article] [PubMed] [Google Scholar]
Riggs 1973 {published data only}
- Riggs BL, Jowsey J, Kelly PJ, Hoffman DL, Arnaud CD. Studies on pathogenesis and treatment in postmenopausal and senile osteoporosis. Clinics in Endocrinology & Metabolism 1973;2(2):317‐332. [DOI] [PubMed] [Google Scholar]
Riggs 1994 {published data only}
- Riggs BL, O'Fallon WM, Lane A, et al. Clinical trial of fluoride therapy in postmenopausal osteoporotic women: extended observations and additional analysis. J Bone Miner Res 1994;9(2):265‐275. [DOI] [PubMed] [Google Scholar]
Ringe 1987 {published data only}
- Ringe JD. [Combined fluoride therapy for primary osteoporosis. Results of two‐years' treatment with sodium monofluorophosphate and calcium]. [German]. Fortschritte der Medizin 1987;105(19):379‐382. [PubMed] [Google Scholar]
Ringe 1998 {published data only}
- Ringe JD, Drost DJ, Kipshoven C, Rovati LC, Setnikar I. Avoidance of vertebral fractures in men with idiopathic osteoporosis by a three year therapy with calcium and low‐dose intermittent monofluorophosphate. Osteoporos Int 1998;8:47‐52. [DOI] [PubMed] [Google Scholar]
Takizawa 1980 {published data only}
- Takizawa H, Igarashi M, Hayashi Y, Karube S, Kimura H. [Comparison of treatments in senile osteoporosis: follow up for 12 months (author's transl)]. [Japanese]. Journal of the Japanese Orthopaedic Association ‐ Nippon Seikeigeka Gakkai Zasshi 1980;54(4):345‐355. [PubMed] [Google Scholar]
Vose 1978 {published data only}
- Vose GP, Keele DK, Milner AM, et al. Effect of sodium fluoride, inorganic phosphate, and oxymetholone therapies in osteoporosis: a six year progress report. J Gerontol 1978;33:204‐212. [DOI] [PubMed] [Google Scholar]
Additional references
Aaron 1991
- Aaron JE, de VC, Kanis JA. The effect of sodium fluoride on trabecular architecture. Bone 1991;12(5):307‐310. [DOI] [PubMed] [Google Scholar]
Bardin 1995
- Bardin T, Kuntz D. [Medicaments stimulant la formation osseuse]. In: Medicine‐Sciences Flammarion, editor(s). Therapeutique Rhumatologique. Paris, 1995:105‐111. [Google Scholar]
Boivin 1991
- Boivin G, Grousson B, Meunier PJ. X‐rays microanalysis of fluoride distribution in microfracture calluses in cancellous iliac bone from osteoporotic patients treated with fluoride and untreated. J Bone Miner Res 1991;6:1183‐1190. [DOI] [PubMed] [Google Scholar]
CDC 1994
- Anonymous. Consensus Development Conference: Diagnosis, prophylaxis and treatment of osteroporosis. Am J Med 1994:646‐650. [DOI] [PubMed] [Google Scholar]
Cranney 1999
- Cranney A, Welch V, Tugwell P, et al. Responsiveness of endpoints in osteoporosis clinical trials‐an update. J Rheumatol 1999;26:222‐228. [PubMed] [Google Scholar]
Delmas 1990
- Delmas PD, Dupuis J, Duboeuf F, Chapuy MC, Meunier PJ. Treatment of vertebral osteoporosis with disodium monofluorophosphate: comparison with sodium fluoride. J Bone Miner Res 1990;5(Suppl 1):S143‐S147. [DOI] [PubMed] [Google Scholar]
Delmas 1993
- Delmas PD. Biochemical markers of bone turnover: theoretical consideretions and clinical use in osteoporosis. Am J Med 1993;8:348‐354. [DOI] [PubMed] [Google Scholar]
Dure‐Smith 1996
- Dure‐Smith BA, Farley SM, Linkhart SG, Farley JR, Baylink DJ. Calcium deficiency in fluoride‐treated osteoporotic patients despite calcium supplementation. Journal of Clinical Endocrinology & Metabolism 1996;81(1):269‐275. [DOI] [PubMed] [Google Scholar]
Ettinger 1999
- Ettinger B, Black DM, Mitlak BH, et al. Reduction of vertebral fracture risk in postmenopausal women with osteoporosis treated with raloxifene: results from a 3‐year randomized clinical trial. Multiple Outcomes of Raloxifene Evaluation (MORE) Investigators. JAMA 1999;282(7):637‐645. [DOI] [PubMed] [Google Scholar]
Faulkner 1996
- Faulkner KG, Roberts LA, McCung MR. Discrepancies in normative data between Lunar and Hologic DXA sustems. Osteoporos Int 1996;6:432‐436. [DOI] [PubMed] [Google Scholar]
Fleiss 1993
- Fleiss JL. The statistical basis of meta‐analysis. Stat Methods Med Res 1993;2(2):121‐145. [DOI] [PubMed] [Google Scholar]
Franke 1974
- Franke J, Rempel H, Franke M. Three years' experience with sodium‐fluoride therapy of osteoporosis. Acta Orthopaedica Scandinavica 1974;45(1):1‐20. [DOI] [PubMed] [Google Scholar]
Goeree 1996
- Goeree R, O'Brien B, Pettit D, et al. An assessment of the burden of illness due to osteoporosis in Canada. Journal SOGC 1996, (Suppl):15‐24. [Google Scholar]
Gron 1966
- Gron P, McCann HG, Bernstein D. Effect of fluoride on human osteoporotic bone mineral. A chemical and crystallographic study. Journal of Bone & Joint Surgery ‐ American Volume 1966;48(5):892‐898. [PubMed] [Google Scholar]
Harrison 1981
- Harrison JE, McNeill KG, Sturtridge WC, et al. Three‐year changes in bone mineral mass of postmenopausal osteoporotic patients based on neutron activation analysis of the central third of the skeleton. Journal of Clinical Endocrinology & Metabolism 1981;52(4):751‐758. [DOI] [PubMed] [Google Scholar]
Haynes 1994
- Haynes RB, Wilczynski N, McKibbon KA, Walker CJ, Sinclair JC. Developing optimal search strategies for detecting clinically sound studies in MEDLINE. J Am Med Info Assoc 1994;1(6):447‐458. [DOI] [PMC free article] [PubMed] [Google Scholar]
Jadad 1996
- Jadad AR, Moore RA, Carrol D. Assessing the quality of reports of randomized clinical trials: is blinding necessary?. Control Clin Trials 1996;17:1‐12. [DOI] [PubMed] [Google Scholar]
Kuntz 1984
- Kuntz D, Marie P, Naveau B, et al. Extended treatment of primary osteoporosis by sodium fluoride combined with 25 hydroxycholecalciferol. Clinical Rheumatology 1984;3(2):145‐153. [DOI] [PubMed] [Google Scholar]
Lees 1992
- Lees S, Hansson T. Effect of fluoride dosage on bone density, sonic velocity and longitudinal modules of rabbits femur. Calcif Tissue Int 1992;50:88‐92. [DOI] [PubMed] [Google Scholar]
Lundy 1995
- Lundy MW, Stauffer M, Wergedal JE, et al. Histomorphometric analysis of iliac crest bone biopsies in placebo‐treated versus fluoride‐treated subjects [see comments]. Osteoporosis International 1995;5(2):115‐129. [DOI] [PubMed] [Google Scholar]
Mackerras 1997
- Mackerras D, Lumley T. First‐ and second‐year effects in trials of calcium supplementation on the loss of bone density in postmenopausal women. Bone 1997;21(6):527‐533. [DOI] [PubMed] [Google Scholar]
Mamelle 1988
- Mamelle N, Meunier PJ, Dusan R, et al. Risk‐benefit ratio of sodium fluoride treatment in primary vertebral osteoporosis. Lancet 1988;2(8607):361‐365. [DOI] [PubMed] [Google Scholar]
Merz 1981
- Merz W. The essential trace elements. Science 1981;213(1332‐1338). [DOI] [PubMed] [Google Scholar]
Muller 1992
- Muller P, Schmid K, Warnecke G, Stnikar I, Simon B. Sodium fluoride induced gastric mucosal lesions: comparison with sodium monofluorophosphate. Zeitung Gastroenterology 1992;30(252‐254). [PubMed] [Google Scholar]
Mulrow 1997
- Mulrow CD, Oxman ADe. Oxford: Update Software; 1997. Cochrane Collaboration Handbook [updated September 1997]. 1997;September 1997 update. [Google Scholar]
NOF 1998
- National Osteoporosis Foundation. Osteoporosis: Review of the evidence for prevention, diagnosis, and treatment and cost‐effectiveness analysis, status report. Osteoporos Int 1998, (Suppl 4):S1‐S88. [Google Scholar]
Orcel 1990
- Orcel P, de VC, Prier A, et al. Stress fractures of the lower limbs in osteoporotic patients treated with fluoride. J Bone Miner Res 1990;5(Suppl 1):S191‐S194. [DOI] [PubMed] [Google Scholar]
Papadimitroupoulos
- Papadimitroupoulos EA, Coyte PC, Josse RG, Greenwood CE. Current and projected rates of hip fractures in Canada. CMAJ 1997;157(10):1537‐1566. [PMC free article] [PubMed] [Google Scholar]
Pouilles 1991
- Pouilles JM, Tremollieres F, Causse E, Louvet JP, Ribot C. Fluoride therapy in postmenopausal osteopenic women: effect on vertebral and femoral bone density and prediction of bone response. Osteoporos Int 1991;1(2):103‐109. [DOI] [PubMed] [Google Scholar]
Power 1986
- Power GR, Gay JD. Sodium fluoride in the treatment of osteoporosis. Clinical & Investigative Medicine ‐ Medecine Clinique et Experimentale 1986;9(1):41‐43. [PubMed] [Google Scholar]
Resch 1993
- Resch H, Libanati C, Farley S, et al. Evidence that fluoride therapy increases trabecular bone density in a peripheral skeletal site. Journal of Clinical Endocrinology & Metabolism 1993;76(6):1622‐1624. [DOI] [PubMed] [Google Scholar]
Resch 1994
- Resch A, Pietschmann F, Bernecker P, et al. [Evidence of fluoride‐induced effects on the calcaneus by measurements of broadband ultrasound attenuation (BUA)]. [German]. Rofo.Fortschritte auf dem Gebiete der Rontgenstrahlen und der Neuen Bildgebenden Verfahren 1994;161(6):547‐550. [DOI] [PubMed] [Google Scholar]
Rich 1961
- Rich C, Ensinck J. Effect of sodium fluoride on calcium metabolism in human beings. Nature 1961;194:184‐185. [DOI] [PubMed] [Google Scholar]
Sakhaee 1991
- Sakhaee K, Pak CY. Fluoride bioavailability from immediate‐released fluoride with calcium carbonate compared with slow release sodium fluoride with calcium citrate. J Bone Miner Res 1991;14:131‐136. [DOI] [PubMed] [Google Scholar]
Schnitzler 1985
- Schnitzler CM, Solomon L. Trabecular stress fractures during fluoride therapy for osteoporosis. Skeletal Radiology 1985;14(4):276‐279. [DOI] [PubMed] [Google Scholar]
Shea 1999
- Shea B, Guyatt G, Cranney A, et al. Meta‐Analysis of Calcium Supplementation for the Prevention of Postmenopausal Osteoporosis. Arch Intern Med 1999;Submitted. [Google Scholar]
Stamp 1990
- Stamp TC, Saphier PW, Loveridge N, et al. Fluoride therapy and parathyroid hormone activity in osteoporosis. Clinical Science 1990;79(3):233‐238. [DOI] [PubMed] [Google Scholar]
van Kesteren 1982
- Kesteren RG, Duursma SA, Visser WJ, et al. Fluoride in bone and serum during treatment of osteoporosis with sodium fluoride, calcium and vitamin D. Metab Bone Dis 1982;4:31‐37. [DOI] [PubMed] [Google Scholar]
Wells 1997
- Wells G, Cranney A, Shea B, Tugwell P. Responsiveness of Endpoints in Osteoporosis Clinical Trials. J Rheumatol 1997;24(6):1230‐1233. [PubMed] [Google Scholar]
Zerwekh 1994
- Zerwekh JE, Hagler HK, Sakhaee K, et al. Effect of slow‐release sodium fluoride on cancellous bone histology and connectivity in osteoporosis. Bone 1994;15(6):691‐699. [DOI] [PubMed] [Google Scholar]
Zerwekh 1997
- Zerwekh JE, Padalino P, Pak CY. The effect of intermittent slow‐release sodium fluoride and continuous calcium citrate therapy on calcitropic hormones, biochemical markers of bone metabolism, and blood chemistry in postmenopausal osteoporosis. Calcif Tissue Int 1997;61:272‐278. [DOI] [PubMed] [Google Scholar]
References to other published versions of this review
Haguenauer 2000
- Haguenauer D, Welch V, Shea B, Tugwell P, Adachi JD, Wells G. Fluoride for the treatment of postmenopausal osteoporotic fractures: a meta‐analysis. Osteoporosis International 2000;11(9):727‐38. [DOI] [PubMed] [Google Scholar]


