

Abstract
Background
Psychiatric traits are heritable, highly comorbid and genetically correlated, suggesting that genetic effects that are shared across disorders are at play. The aim of the present study is to quantify the predictive capacity of common genetic variation of a variety of traits, as captured by their PRS, to predict case‐control status in a child and adolescent psychiatric sample including controls to reveal which traits contribute to the shared genetic risk across disorders.
Method
Polygenic risk scores (PRS) of 14 traits were used as predictor phenotypes to predict case‐control status in a clinical sample. Clinical cases (N = 1,402), age 1–21, diagnostic categories: Autism spectrum disorders (N = 492), Attention‐deficit/ hyperactivity disorders (N = 471), Anxiety (N = 293), disruptive behaviors (N = 101), eating disorders (N = 97), OCD (N = 43), Tic disorder (N = 50), Disorder of infancy, childhood or adolescence NOS (N = 65), depression (N = 64), motor, learning and communication disorders (N = 59), Anorexia Nervosa (N = 48), somatoform disorders (N = 47), Trauma/stress (N = 39) and controls (N = 1,448, age 17–84) of European ancestry. First, these 14 PRS were tested in univariate regression analyses. The traits that significantly predicted case‐control status were included in a multivariable regression model to investigate the gain in explained variance when leveraging the genetic effects of multiple traits simultaneously.
Results
In the univariate analyses, we observed significant associations between clinical status and the PRS of educational attainment (EA), smoking initiation (SI), intelligence, neuroticism, alcohol dependence, ADHD, major depression and anti‐social behavior. EA (p‐value: 3.53E‐20, explained variance: 3.99%, OR: 0.66), and SI (p‐value: 4.77E‐10, explained variance: 1.91%, OR: 1.33) were the most predictive traits. In the multivariable analysis with these eight significant traits, EA and SI, remained significant predictors. The explained variance of the PRS in the model with these eight traits combined was 5.9%.
Conclusion
Our study provides more insights into the genetic signal that is shared between childhood and adolescent psychiatric disorders. As such, our findings might guide future studies on psychiatric comorbidity and offer insights into shared etiology between psychiatric disorders. The increase in explained variance when leveraging the genetic signal of different predictor traits supports a multivariable approach to optimize precision accuracy for general psychopathology.
Keywords: Genetics, psychiatry, neurodevelopmental disorders, comorbidity, general P factor
Introduction
In this study, we aim to quantify the predictive capacity of common genetic variation of a variety of traits to reveal which traits contribute to the shared genetic risk across disorders as it is well known that psychiatric disorders are highly comorbid. High comorbidity rates have for instance been shown between anxiety disorders (anxiety), major depressive disorder (MDD), attention‐deficit/ hyperactivity disorder (ADHD), autism spectrum disorder (ASD), schizophrenia, alcohol dependence and eating disorders. (Katzman, Bilkey, Chokka, Fallu, & Klassen, 2017; Klimkiewicz, Klimkiewicz, Jakubczyk, Kieres‐Salomoński, & Wojnar, 2015; Ulfvebrand, Birgegård, Norring, Högdahl, & von Hausswolff‐Juhlin, 2015) Next to the comorbidity there is also extensive symptom overlap (American Psychiatric Association, 2013). This overlap has been described for MDD and anxiety (Tiller, 2013), ADHD, ASD, tic disorders and obsessive compulsive disorder (OCD; Huisman‐van Dijk, van de Schoot, Rijkeboer, Mathews, & Cath, 2016). Interestingly, the occurrence of psychiatric disorders is also correlated with psychological traits in the general population such as lower educational attainment (EA (Lee et al., 2018)), lower intelligence (Savage et al., 2018), higher substance use among which earlier smoking initiation (Liu et al., 2019), higher neuroticism scores (Nagel et al., 2018), and insomnia (Jansen et al., 2019). EA comprises cognitive abilities (intelligence), noncognitive abilities (patience, self‐control, temperament, motivation, self‐discipline, time preference), health endowments, and family background (Conti, Heckman, & Urzua, 2010). There is a phenotypic link between EA and health (Lynch & Hippel, 2016) as shown by previous research involving EA and adult success on the labor market and adult health including psychopathology, with a focus on depression, which demonstrates an important role for both cognitive abilities in early life and noncognitive abilities (Conti et al., 2010). Intelligence by itself also plays a major role in health and wellbeing with higher intelligence being associated with lower risk of mental health problems (Savage et al., 2018). Focusing on substance use behaviors, the literature shows that smoking behavior is related to a host of psychiatric disorders among which schizophrenia, ADHD, eating disorders, mood disorders, anxiety and substance use disorders (Boksa, 2017), and in a US population patients with a psychiatric diagnosis have a 3.23 times greater odds of smoking compared to individuals with no diagnosis (Smith, Mazure, & McKee, 2014). High scores on neuroticism questionnaires are associated with psychiatric disorders (Hettema, Neale, Myers, Prescott, & Kendler, 2006; Nagel et al., 2018), and insomnia is one of the most common comorbidities of psychiatric disorders (Jansen et al., 2019).
Next to phenotypic overlap, extensive genetic overlap between psychiatric and psychological traits has been observed. These traits are at least moderately heritable (Polderman et al., 2015) with an underlying genetic architecture of rare and common genetic variation (Claussnitzer et al., 2020). A common genetic overlap has been shown extensively in the brain disorder (Bulik‐Sullivan et al., 2015; Cross‐Disorder Group of the Psychiatric Genomics Consortium, 2019), the psychiatric disorder (Demontis et al., 2019; Grove et al., 2019; Schizophrenia Working Group of the Psychiatric Genomics Consortium, 2014; Walters et al., 2018; Wray et al., 2018) and psychological trait literature (Jansen et al., 2019; Linnér et al., 2019; Nagel et al., 2018; Tielbeek et al., 2017; Walters et al., 2018). Health‐related traits as EA (Lee et al., 2018; Satterstrom et al., 2020), intelligence (Savage et al., 2018), smoking initiation (Liu et al., 2019), insomnia (Jansen et al., 2019), risk‐taking behavior (RTB; Linnér et al., 2019) and anti‐social behavior (Tielbeek et al., 2017) show genetic correlations with psychiatric disorders and with each other. These studies show that psychiatric disorders, psychological traits and closely related phenotypes show genotypic overlap that might be due to pleiotropy (Watanabe et al., 2019; a locus affecting more than one trait) and polygenicity (Watanabe et al., 2019; multiple loci affecting one trait).
Building on the existing phenotypic and genetic overlap as summarized above, research on a theorized underlying general psychopathology factor, the ‘p factor’, tries to identify an underlying higher order dimension for psychopathology in general, and specific domains below this overarching p factor, such as internalizing, externalizing or psychotic experience domains (Caspi & Moffitt, 2018). This hierarchical clustering is based on the hypothesis that each mental disorder has a broadly shared and a unique genetic component. The shared genetic component is thought to capture the genetic part of the broad range of symptoms that are common across disorders, while the unique genetic component is thought to capture disorder specific symptoms (Caspi et al., 2014; Murray, Eisner, & Ribeaud, 2016). In addition, it is suggested that the p factor can combine all psychiatric disorders on a low to high psychopathology severity scale. The hypothesis is that a person’s score on this scale is informative of family history, developmental history, brain functioning and adult life impairment with higher p factor scores representing worse outcomes. (Caspi & Moffitt, 2018).
The findings regarding the p factor, genetic overlap, pleiotropy and polygenicity in psychopathology provide support for studies exploring shared genetic variation of nonspecific, shared psychiatric problems as present in clinical psychiatric samples. The shared heritability between traits and disorders (Brainstorm Consortium et al., 2018; Bulik‐Sullivan et al., 2015) can be examined by means of polygenic risk scores (PRS; Chatterjee, Shi, & García‐Closas, 2016; Wray et al., 2014). A PRS is an individual’s weighted sum of risk alleles for a trait based on previously determined effects of those alleles for that trait (Euesden, Lewis, & O’Reilly, 2015). At group level, the PRS has the potential to distinguish cases from controls. For example, the ADHD PRS has been shown to distinguish cases from controls in an ADHD and in an Autism Spectrum Disorder (ASD) /ADHD combined sample (Jansen et al., 2019), and the schizophrenia PRS differentiated patients who developed schizophrenia from patients who did not in a first episode psychosis sample (Vassos et al., 2017). Despite this capacity to distinguish cases from controls at a group level, the explained variance of the PRS is limited, often below 5% (Jansen et al., 2019). The predictive capacity of the PRS can be improved by making predictions based on multiple traits and disorders that share genetic influences (Brainstorm Consortium et al., 2018; Bulik‐Sullivan et al., 2015), by using multivariate approaches (Abdellaoui et al., 2018), or creating a multi‐trait predictor (Krapohl et al., 2018; Maier et al., 2018). These methods seem promising as, for example, a multi‐polygenic score (Krapohl et al., 2018) explained 4.8% of the variance in general cognitive ability and 10.9% in educational achievement in an adolescent sample, capturing 1.1% more variance than the best single‐score predictors.
The aim of the present study is to quantify the predictive capacity of common genetic variation of a variety of traits, as captured by their PRS, to predict case‐control status in a child and adolescent psychiatric sample with a variety of psychiatric disorders to reveal which traits contribute to the shared genetic risk across disorders. Disorders present in the sample, and closely related traits were used as predictive traits. Both child or adolescent and adult mental traits have been included as we expect genetic overlap, since the majority of the adult psychiatric disorders usually have their onset during childhood or adolescence (Kessler et al., 2007) and the genetic make‐up of an individual is fixed during life. To add, to our knowledge no genetic studies into addiction in child and adolescent samples have been presented. Firstly, we examined which individual PRS of these phenotypes significantly predicted receiving a diagnosis. Secondly, we evaluated whether this prediction could be improved by combining the joint genetic signals of the significantly associated phenotypes. The findings of this study will contribute to the identification of a shared genetic signal across disorders.
Methods
Participants
Clinical sample: ‘Inside‐out’
Data for this clinical sample (‘Inside‐out’) were collected from January 2001 until January 2012 at the department of Child and Adolescent Psychiatry of the Sophia Children’s Hospital, Erasmus Medical Center in Rotterdam. The diagnostic classification was performed by a clinician according to the Diagnostic and Statistical Manual of Mental Disorders, fourth edition. This procedure consisted of an interview with parents, a semi‐structured interview with the child based on the Semi‐structured Clinical Interview for Children and Adolescents (McConaughy & Achenbach, 2001), the Diagnostic Interview Schedule for Children IV‐P (Shaffer, Fisher, Lucas, Dulcan, & Schwab‐Stone, 2000), and the Autism Diagnostic Observation Schedule‐Generic (Lord et al., 1989) in case of a suspected Autism Spectrum Disorder. The above‐mentioned procedure was part of standard clinical practice. Additionally, DNA was extracted from saliva and genotyping was performed on the Illumina Psych Chip array and Global Screening Array (see Data section). For this study, ethical approval of the Erasmus Medical center was obtained. The full sample (N = 1909) consisted of children that received a clinical diagnosis (N = 1594), and a group of children that did not receive a diagnosis (N = 315). The current study used data of the 1,402 children (192 cases were removed after genetic quality control) diagnosed with one or more DSM‐IV disorders (ASD, ADHD, tic disorder, OCD, MDD, anxiety, anorexia nervosa (AN)), eating disorder NOS, and subcategories of mentioned disorders). Intellectual disability was present in 16% of the sample.
Control sample
A Dutch population sample was used (NESCOG, N = 943, age range: 17.0–79.0), previously described by Polderman et al. (2013). Data were collected on various behavioral symptoms, cognitive functioning, personality, environmental factors, and life events, in addition to genetic information. To correct for undiagnosed ASD, ADHD or anxiety status we excluded participants scoring 3 SD above the mean on the Autism Quotient (AQ; Baron‐Cohen, Wheelwright, Skinner, Martin, & Clubley, 2001), the attention problems scale of the Young Adult Self Report (YASR; Achenbach, 1997), the Conners’ Adult ADHD Rating Scale (CAARS; Conners, Erhardt, & Sparrow, 1999) or the Beck Anxiety Inventory (BAI). Genotyping was performed on the Illumina Psych Chip. This resulted in a sample of 939 participants (age range 17–79, 38% male). In addition, we used a German sample, the Berlin Psychosis Study (BePS; Skarabis & Ripke, 2017) of healthy adult individuals (N = 509, age range 18–84, 31% male). Participants whom reported having received a bipolar disorder (BiP) or other psychotic disorder, ADHD, OCD, MDD, anxiety, AN, or alcohol dependence diagnosis were excluded (N = 31). The total control sample consisted of 1,448 individuals (age range 17–84, 35% males).
To provide a sense of the nature of comorbidities and diagnoses we have the following Tables/Figures: Table 1 shows sample specifics such as sample size, age range and genotyping array for the cases and controls. Figure 1 shows the diagnostic composition as the amount of cases in the full sample per disorder and the amount of cases per disorder in that part of the sample diagnosed with intellectual disability, as well as the percentage of the full sample with an intellectual disability diagnosis, intellectual disability status and the sex distribution. Tables S1 and S2 provide an overview of comorbidities.
Table 1.
Sample description
| Cases | Controls | |||
|---|---|---|---|---|
| Clinical sample | NESCOG | BePS | Total controls | |
| Sample size | 1,402 | 939 | 509 | 1,448 |
| Age range (mean, SD), years | 1–20 (9.54, 3.71) | 17–79 (40.7, 17.3) | 18–84 (30.2, 12.1) | 17–84 (37.0) |
| Gender % male | 61 | 38 | 31 | 35 |
| Genotyping array | GSA (32%), Psych chip (68%) | Psych chip | GSA | GSA (35%), Psych chip (65%) |
Figure 1.
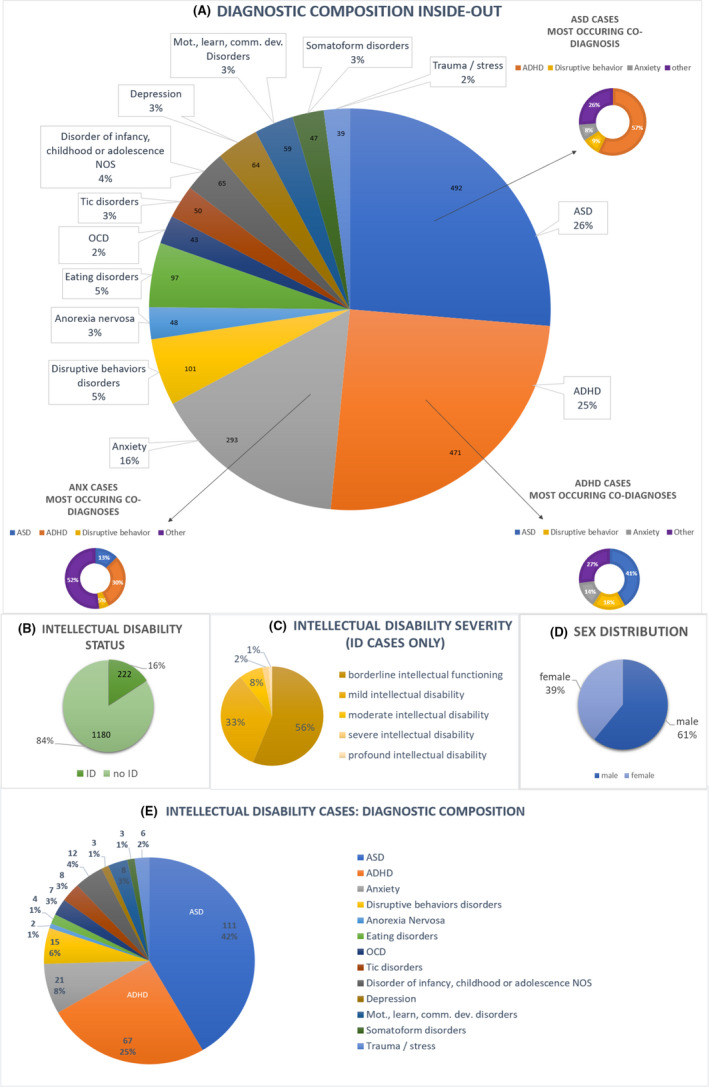
Diagnostic composition Inside‐out. Abbreviations: ASD = autism spectrum disorder; ADHD = attention‐deficit/hyperactivity disorder; OCD = obsessive compulsive disorder, disorder of infancy, childhood full diagnostic term: Disorder of infancy, childhood or adolescence NOS Mot., learn., comm. dev. disorder comprises motor, learning and communication developmental disorders, ID: intellectual disability. A: Numbers per disorder are based on a total 1,402 cases. Comorbid disorders are included, therefore totaling more than 1,402 diagnoses B: Intellectual Disability (ID) status for all 1,402 cases. C: ID severity for all ID cases. ID severity known for 89% of all ID cases. D: Sex distribution in Inside‐out. E: The chart is based on all ID cases (N 222). Comorbid disorders are included, therefore totaling more than 222 diagnoses
Genotyping
Genotyping of part of the clinical sample (ADHD, ASD, tic disorder and AN diagnosis) and of the NESCOG control sample was performed on the Illumina PsychChip array. The PsychChip SNP array contains HumanCore, Human Exome and custom content to capture genetic variants previously linked with psychiatric disorders (https://www.illumina.com/products/by‐type/micproarray‐kits/infinium‐psycharray.html).
The remaining part of the clinical sample and the BePS controls were genotyped on the Illumina Infinium Global Screening Array (GSA; https://www.illumina.com/products/by‐type/microarray‐kits/infinium‐global‐screening.html).
For SNP harmonization purpose between arrays, all samples were imputed in the Michigan imputation server. After imputation, the samples were combined. We used the Michigan imputation server pipeline which uses the Haplotype Reference Consortium (McCarthy et al., 2016; HRC) as a reference panel and poorly imputed variants were excluded based on their imputation score (R 2 < 0.9). In all samples, SNPs were filtered on MAF (<1%), SNP call rate (<95%) and Hardy–Weinberg disequilibrium (p < .00001). In the control samples, individual quality control filtering was based on missingness (>5%), relatedness (pairwise IBD > 0.185), ancestry (within the range of 1,000 Genomes CEU population on the first two principal components (PCs)), outlying heterozygosity (excluded if > 3 x SD from the mean of the heterozygosity rate), gender mismatch and missing phenotypes. In the clinical sample, individuals were filtered based on genotype and sex mismatch, outlying heterozygosity and non‐European ancestry (4 SD outside the range of the first two genetic principal components of the HapMap3 European founder population (CEU)), missingness (>5%) and relatedness (pairwise Identity‐By‐Descent (IBD) >0.185).
Polygenic scoring
The PRS is the sum of an individual’s ‘risk’ alleles for a certain phenotype weighted by the allele effect sizes, which are typically derived from linear association coefficients from a genome wide association study (GWAS). For the PRS creation a SNP p‐value inclusion threshold of < 1 is used (Choi, Mak, & O’Reilly, 2018; Maier et al., 2018). Using large publicly available summary statistics from GWA studies, PRS were constructed for EA (Lee et al., 2018), intelligence (Savage et al., 2018), smoking initiation (Liu et al., 2019), neuroticism (Nagel et al., 2018), insomnia (Jansen et al., 2019), RTB (Linnér et al., 2019), anti‐social behavior (Tielbeek et al., 2017), ADHD (Demontis et al., 2019), ASD (Grove et al., 2019), schizophrenia (Pardiñas et al., 2018), MDD (Wray et al., 2018), anxiety (Otowa et al., 2016), alcohol dependence (Walters et al., 2018) and BiP (Stahl et al., 2018; see Appendix S1). Table S3 provides an overview and details of the selected GWA studies. The selected GWAS studies are large enough to use for this type of analyses as shown by their LD intercept which show no worrisome potential inflation (see Table S4). Inside‐out, NESCOG and the BePS samples are independent samples not included in any of the GWAS.
The polygenic scoring was performed using PRSice2 (Euesden et al., 2015). Prior to polygenic scoring SNPs in high LD were clumped using PRSice2 (LD R 2 < 0.1, 250 kb pair window). For interpretational purposes the results were standardized to mean 0 and SD 1.
Statistical analysis
Genetic correlation with LDSC regression
Using linkage disequilibrium score (LDSC) regression (Bulik‐Sullivan et al., 2015), we calculated genetic correlations across all included traits based on the GWAS summary statistics we used for the PRS calculations of our predictor phenotypes. In addition, we computed the genetic correlations of the PRS in SPSS in our clinical sample to compare to the LDSC results.
Regression analyses
First, we performed 14 univariate analyses to investigate which PRS were able to distinguish between cases and controls (outcome variable). Although all participants of the discovery and target sample were of European descent, the baseline model included eight PCs to account for potential population stratification The baseline model included, in addition to the eight PCs to account for population stratification, chip (GSA or Psych Chip, to correct for array effects), and sex as covariates. Age was not added as a covariate as all cases are children and all controls are adults. The PCs were calculated on all samples together and were based on the pruned data with Eigensoft (Price et al., 2006; version 3.0) software. After Bonferroni multiple testing correction for 14 tests we assessed the significance (p‐value) of each predictor phenotype as well as its explained variance. The explained variance of the PRS is based on Nagelkerke pseudo R 2 (i.e., the difference between the full model R 2 and the covariate only (baseline) model R 2). As 16% of Inside‐out cases are co‐diagnosed with intellectual disability (ID) we investigated if the results were driven by the ID subgroup by comparing the diagnostic distribution of the whole sample to the ID part of the sample. Additionally, we ran the univariate analysis for the intelligence and EA PRS on the part of Inside‐out without ID (N: 1,180, see Figure 1) to adjust the analysis if needed. The same covariates were included and the results were assessed the same way as the full sample results. Second, the significantly associated PRS from the univariate analyses were tested for their significance in a multivariable analysis.
Results
Genetic correlations between the predictor phenotypes
The genetic correlations as calculated from the summary statistics (Figure 2, Table S5) were overall in line with the available literature. As shown in the correlational matrix in Table S5, all included traits showed intermediate to high correlations with at least two other traits. Therefore all 14 PRS of predictive phenotypes were included in the subsequent analyses. The Pearson correlations between the prs in our clinical sample (Table S6) show some differences with the genetic correlations between the GWAS summary statistic of the phenotypes. These differences can be partially explained by a difference in sample size. The clinical sample is much smaller than the GWAS sample sizes resulting in a less precise estimate. In general, the significances are quite similar giving no reason for concern.
Figure 2.
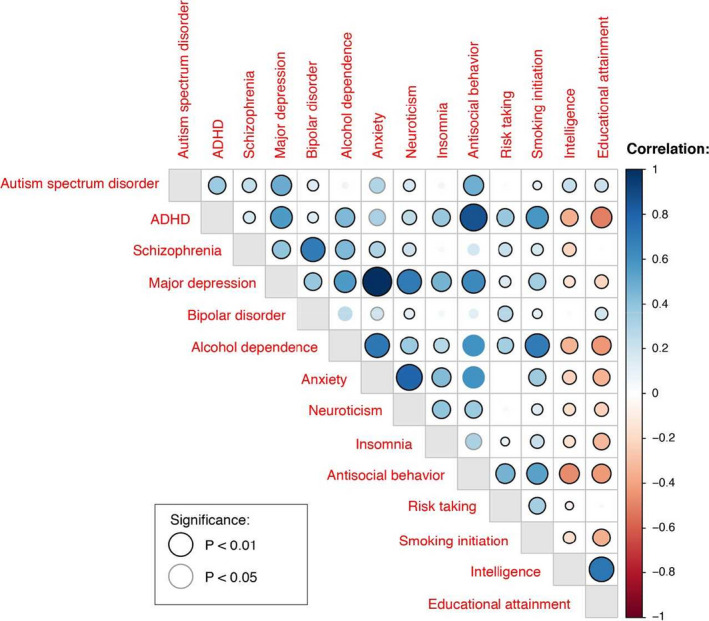
Overview of the genetic correlations based on the GWAS summary statistics
Regression analyses
The univariate logistic regression analyses showed eight significantly associated PRS (P Bonferroni corrected (bf) < 0.05); EA, intelligence, smoking initiation, neuroticism, anti‐social behavior, ADHD, MDD and alcohol dependence (Table 2a and Figure 3a). Presented p‐values are Bonferroni corrected. Fit statistics are provided in Table S7.
Table 2.
(a) Univariate logistic regression analysis. (b) Multivariable logistic regression analysis
| (a) PRS | % explained variance PRS | p | p_bfa | OR | 95% CI for ORc |
|---|---|---|---|---|---|
| EA | 3.99 | 2.52E‐21 | 3.53E‐20 | 0.66 | 0.61–0.72 |
| SI | 1.91 | 3.41E‐11 | 4.77E‐10 | 1.33 | 1.22–1.44 |
| IQ | 1.53 | 3.22E‐09 | 4.51E‐08 | 0.78 | 0.72–0.85 |
| MDD | 1.02 | 1.00E‐06 | 1.40E‐05 | 1.27 | 1.15–1.40 |
| ADHD | 0.99 | 2.00E‐06 | 2.80E‐05 | 1.22 | 1.13–1.32 |
| NEU | 0.58 | 2.47E‐04 | 3.46E‐03 | 1.16 | 1.07–1.26 |
| AD | 0.50 | 6.27E‐04 | 8.78E‐03 | 1.15 | 1.06–1.24 |
| ASB | 0.47 | 9.84E‐04 | 1.38E‐02 | 1.14 | 1.06–1.24 |
| INS | 0.19 | 3.76E‐02 | 5.27E‐01 | 1.09 | 1.01–1.18 |
| RTB | 0.13 | 7.92E‐02 | 1 | 1.07 | 0.99–1.16 |
| ANX | 0.11 | 1.16E‐01 | 1 | 1.06 | 0.99–1.15 |
| SCZ | 0.07 | 1.98E‐01 | 1 | 1.10 | 0.95–1.27 |
| BiP | 0.06 | 2.36E‐01 | 1 | 1.07 | 0.96–1.19 |
| ASD | 0.03 | 4.30E‐01 | 1 | 0.97 | 0.89–1.05 |
| (b) PRS | p | p_bfb | OR | 95% CI for ORc |
|---|---|---|---|---|
| EA | 2.43E‐09 | 1.94E‐08 | 0.74 | 0.76–0.81 |
| SI | 2.43E‐04 | 1.94E‐03 | 1.18 | 1.08–1.29 |
| MDD | 1.96E‐02 | 1.57E‐01 | 1.13 | 1.02–1.25 |
| ASB | 3.92E‐02 | 3.14E‐01 | 1.09 | 1.00–1.18 |
| ADHD | 6.48E‐02 | 5.19E‐01 | 1.08 | 1.00–1.18 |
| IQ | 1.48E‐01 | 1 | 0.93 | 0.86–1.02 |
| AD | 2.12E‐01 | 1 | 1.05 | 0.97–1.15 |
| NEU | 3.18E‐01 | 1 | 1.04 | 0.96–1.14 |
Clinical sample (N cases: 1,402, N controls: 1,448). Baseline model covariates: 8 PCs, sex and chip. All included PRS have SNP p‐value threshold < 1.
AD = alcohol dependence; ADHD = attention‐deficit/hyperactivity disorder; ANX = anxiety; ASB = anti‐social behavior; ASD = autism spectrum disorder; BiP = bipolar disorder; EA = educational attainment; INS = insomnia; IQ = intelligence; MDD = major depressive disorder; NEU = neuroticism; RTB = risk‐taking behavior; SCZ = schizophrenia; SI = smoking initiation.
After Bonferonni multiple testing (p‐bf) correction f or14 tests.
After Bonferonni multiple testing correction for 8 tests.
Upper and lower limits are shown.[Corrections made on 22 April 2021, after first online publication: In Tables 2a and b, the ‘OR’ and ‘95% CI for OR’ values for SI have been corrected in this version.]
Figure 3.
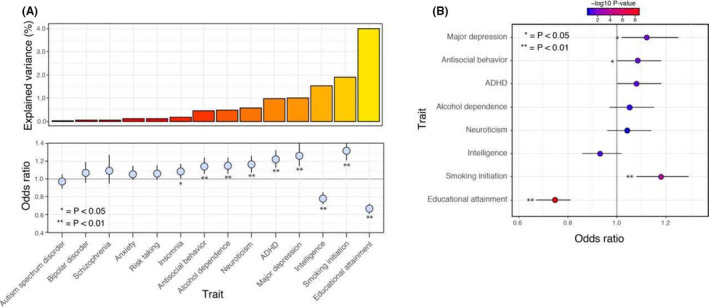
(A) The explained variance for all tested traits in the univariate analyses. The explained variance is based on Nagelkerke R 2. The effect sizes are shown as Odds Ratios (ORs). (B) The ORs based on the multivariable analyses
When comparing the whole clinical sample to the ID cases in our sample, the ID cases sub‐sample showed a larger proportion of ASD cases (42% vs 26%) and fewer anxiety cases (8% vs. 16%), and eating disorders (2% vs. 8%). Proportions of the other diagnostic groups were very similar between the full sample and the ID cases. The additional regression analyses in the sample without ID cases gave similar results for the EA and intelligence PRS (see Table S8).
In a second instance, we retained only PRS with P_bf < 0.05 (EA, intelligence, smoking initiation, neuroticism, anti‐social behavior, ADHD, MDD and alcohol dependence) for inclusion in a multivariable model. Of the eight PRS included in the full multivariable model (EA, intelligence, smoking initiation, neuroticism, anti‐social behavior, ADHD, MDD and alcohol dependence) two remained statistically significant (EA, SI; see Table 2b and Figure 3b). The full model has an explained variance of 17.8%. Of this, the PRS account for 5.9% of the variance, which is an increase of 1.91% compared to the explained variance of the highest scoring univariate PRS (EA) of 3.99%. The remaining part of the explained variance can be attributed to the covariates. Details are shown in Table S9.
Discussion
Polygenic risk scores of EA and smoking initiation are the main predictors of case‐control status in our clinical psychiatric child and adolescent sample. PRS of Intelligence, neuroticism, anti‐social behavior, ADHD, MDD and alcohol dependence are the other predictor phenotypes that in univariate analyses significantly distinguished between cases and controls. The multivariable analysis, testing the joint genetic signal of multiple predictor PRS had a higher predictive capacity compared to single PRS analysis. The increase in explained variance highlights the usability of multiple PRS in joint models to optimize precision accuracy for general psychopathology.
Based on the first series of univariate analyses, we included eight significantly predicting traits in the multivariable analysis (EA, intelligence, smoking initiation, neuroticism, anti‐social behavior, ADHD, MDD and alcohol dependence). Significant prediction came either from phenotypes that were based on a larger GWAS and hence had likely more statistical power (EA, intelligence, smoking initiation, neuroticism, MDD; Lee et al., 2018; Liu et al., 2019; Nagel et al., 2018; Savage et al., 2018; Wray et al., 2018) or were the more prevalent disorders in the sample (ADHD; Demontis & Walters, 2017), with a couple of exceptions (i.e., smaller GWAS and low prevalence in sample; anti‐social behavior and alcohol dependence; Tielbeek et al., 2017; Walters et al., 2018). Four of these traits (EA, smoking initiation, anti‐social behavior, MDD) remained significant predictors for case‐control status in the multivariable analysis of which EA and smoking initiation survived multiple testing correction. Due to the high genetic correlations between respectively EA and intelligence (r .7), smoking initiation and alcohol dependence (r .8), neuroticism and MDD (r .7), and anti‐social behavior and ADHD (r .9) the significance of one of both traits may be random, or based on only subtle differences between them. The significant positive association for the anti‐social behavior PRS is a somewhat surprising finding as this GWAS is smaller and hence less powerful. We hope this result will be replicated in a future study. When comparing the results of the univariate and multivariable analysis we see that the explained variance increased from 3.99% (the highest explained variance result of the EA PRS as a single predictor) to 5.90%. The rise in explained variance shows that the addition of phenotypes is not only useful in studies with small, hence low powered GWAS summary statistics as shown before (Maier et al., 2018), but that it is also useful for more general defined phenotypes as diagnostic status. Yet, it is important to note that the general psychopathology construct might be less representative of some disorders, in particular ASD, given the reported PRS associations. We did not find a statistically significant association between six traits (insomnia, RTB, ASD, schizophrenia, anxiety, BIP) and case‐control status in our sample. For insomnia, this is possibly due to the genetic correlation of insomnia being larger in mood disorders than in eating disorders and ASD (Jansen et al., 2019). Our sample composition might be too varied with not enough mood disorder cases included to generate a detectable enrichment of common genetic variation for INS. RTB was included in our model as it has a genetic correlation with ADHD and anti‐social behavior and a phenotypic overlap between these three traits is present. However, the genetic correlation might be too weak to predict clinical status. In addition, our sample comprises not only groups whom we expect to take more risk (ADHD) but also groups who are less likely to take risk (MDD/ anxiety) or with no relation to the risk phenotype (ASD, OCD/TIC disorders). As BiP and schizophrenia in general have a later age of onset compared to other psychiatric disorders (Abidi et al., 2017; Lijster et al., 2017; Patten, 2017) they are not present in our sample as this is a child and adolescent sample hence the common genetic variation of schizophrenia and BiP might not be enriched in Inside‐out despite the link between ASD and schizophrenia (Zheng, Zheng, & Zou, 2018). The ASD PRS was expected to be associated as this is one of the larger diagnostic groups within the sample. However, this PRS has not been associated with the ASD subgroup in Inside‐out in previous research, nor was the schizophrenia PRS (Jansen et al., 2019). Several explanations may explain this finding. First, ASD might have a unique genetic signature including an important contribution of rare variants (Satterstrom et al., 2020) that is not captured by the PRS, and second, the PRS might be inaccurate due to a smaller GWAS sample size. Lastly, given the high heterogeneity of ASD, the diagnostic composition within the ASD Inside‐out sample may differ from the ASD cases included in the GWAS sample. Another large diagnostic group in our sample is the anxiety group. Surprisingly, this PRS did not distinguish between cases and controls. As the anxiety PRS is based on a GWAS with a small sample (7,016 cases, 14,745 controls) it is likely to be underpowered.
Limitations
A weak point of the study is the referral bias present in samples generated in one institute. However, when comparing the diagnostic composition of Inside‐out to a general psychiatric European sample of older children, we see a similar diagnostic composition (Gerritsen et. al. Milestone, oral communication). The main difference is the higher percentage of depression diagnoses in Milestone. As younger children are less likely to be diagnosed with depression and more likely to be diagnosed with anxiety, which later develops into depression, it seems likely these children will be included in different groups at younger ages, quite possibly in the ADHD, ASD and anxiety groups. With this in mind, in general, in both samples ADHD, ASD and anxiety show the highest prevalence, which suggests Inside‐out is a good representation of the broader general child and adolescent psychiatric population. It would have been interesting to take educational level, cognitive performance and substance use into account. However, this information was not available for all samples used. In addition, this would remove part of the shared variance (Loe & Feldman, 2007), we did perform a sensitivity analysis excluding ID cases. A general concern regarding PRS studies in clinical samples is the limited clinical usability (Torkamani, Wineinger, & Topol, 2018). Our effect sizes are in line with the current literature (Jansen et al., 2019) meaning 5.9% still leaves room for many other contributing factors. Another point to keep in mind is the relatively small sample size of 1,402 cases and 1,448 controls adding up to 2,850 participants. However, with acceptable standard errors and 95% CI intervals for the OR in the regression analysis we feel this study adds value and can function as a pilot study leading into larger studies in this direction. Finally, It would be informative to run additional sensitivity analyses to rule out that the results are being driven by the ASD/ADHD part of the sample. Due to power issues this is currently not an option. However, the neurodevelopmental part of the paper has been analyzed extensively (Jansen et al., 2019) and besides a significant association with the ADHD PRS, no significant associations with the schizophrenia and ASD PRS have been observed. Still, we cannot rule out that other predictors might be associated specifically in this sample due to the over representation of ADHD and ASD.
Strong points of the study are our carefully curated sample and the comparison between children as cases and adults as controls. As the controls are adults, the chance of them receiving an additional diagnosis of ADHD or ASD is small making them pure controls for these traits. In addition, the NESCOG control sample was corrected for undiagnosed ADHD, ASD and anxiety status. In the BePS sample, no psychiatric diagnoses were allowed.
Future directions in this area of research are replication in a larger independent child and adolescent sample, and preferably in an adult sample as well. Next to replication, research into causality is of great importance. We show association between diagnostic status and low EA and smoking initiation but are not able to address the issue of causality. Still, if low EA and smoking initiation are good predictors of psychiatric disorders, studies exploring early interventions targeting EA and smoking initiation to clarify their role in the development of psychiatric disorders can be useful. In addition, future studies will benefit from a longitudinal design to investigate how PRS correlate to later life outcomes. Based on this a risk profile of a group of individuals can be generated identifying individuals at risk whom might benefit from early interventions. Our PRS selection is a first step in identifying PRS suitable for this type of study.
To conclude, our findings suggest that a lot of the genetic variance influencing psychiatric disorders influence a myriad of mental health‐related traits. Hence, a genetic vulnerability for low EA and SI are potential predictors for general psychopathology in children and adolescents which can be taken into account as some of the potential factors in the development of psychiatric symptoms. In addition, a genetic vulnerability for low EA and SI might contribute to specific comorbidity patterns as observed between psychiatric symptoms and to the broad range of psychiatric symptoms and as such might represent important contributors to the p factor. Our findings can guide future studies on psychiatric comorbidity, and the p factor, and studies addressing the causal directions between EA, SI and general psychopathology.
Supporting information
Appendix S1. Selection of predictive polygenic risk scores (PRS).
Table S1. Overview diagnostic composition including co‐diagnoses.
Table S2. Most common comorbidities in the sample.
Table S3. GWAS discovery sample information.
Table S4. Inflation statistics GWAS statistics.
Table S5. Genetic correlations based on LDSC regression analysis.
Table S6. Correlational matrix of the PRS within Inside‐out.
Table S7. Results of the univariate logistic regression analysis.
Table S8. Results of the univariate logistic regression analysis with ID cases excluded from the sample.
Table S9. Results of the multivariable logistic regression analysis, all eight univariate significant PRS included.
Acknowledgements
The authors thank the participants of the Inside‐out, NESCOG, and Berlin Psychosis Study sample. The authors gratefully acknowledge financial support by the Sophia Stichting voor Wetenschappelijk Onderzoek (SSWO, grant number 593 and S14‐27). The funding organizations had no role in any of the following: the design and conduct of the study; collection, management, analysis, and interpretation of the data; and preparation, review, or approval of the manuscript. The authors thank Danielle Posthuma and Frank Verhulst for their valuable contributions in study design, data collection and reviewing the manuscript. The authors thank Mark Patrick Roeling for the Inside‐out data collection. The manuscript is original, and not published, nor under concurrent consideration elsewhere. The authors have declared that they have no competing or potential conflicts of interest.
Key points.
We tested the association between child and adolescent psychiatric clinical status and polygenic risk scores of psychiatric disorders and psychological traits.
We observed significant associations between clinical status and the polygenic risk scores of educational attainment, smoking initiation, intelligence, neuroticism, alcohol dependence, ADHD, major depression and anti‐social behavior.
These findings can guide future studies on psychiatric comorbidity and offer insights into shared etiology between psychiatric disorders.
Conflict of interest statement: No conflicts declared.
Contributor Information
Arija G. Jansen, Email: a.g.jansen@vu.nl.
Gwen C. Dieleman, Email: g.dieleman@erasmusmc.nl.
References
- Abdellaoui, A., Nivard, M.G., Hottenga, J.J., Fedko, I., Verweij, K., Baselmans, B.M.L., … & Cacioppo, J.T. (2018). Predicting loneliness with polygenic scores of social, psychological and psychiatric traits. Genes, Brain, and Behavior, 17, e12472. [DOI] [PMC free article] [PubMed] [Google Scholar]
- Abidi, S., Mian, I., Garcia‐Ortega, I., Lecomte, T., Raedler, T., Jackson, K. … & Addington, D. (2017). Canadian guidelines for the pharmacological treatment of schizophrenia spectrum and other psychotic disorders in children and youth. Canadian Journal of Psychiatry, 62, 635–647. [DOI] [PMC free article] [PubMed] [Google Scholar]
- Achenbach, T.M. (1997). Manual for the young adult self‐report and young adult behavior checklist. Burlington, VT: Department of Psychiatry, University of Vermont. [Google Scholar]
- American Psychiatric Association . (2013). Diagnostic and statistical manual of mental disorders (Vol. 5). Arlington: American Psychiatric Association. [Google Scholar]
- Baron‐Cohen, S., Wheelwright, S., Skinner, R., Martin, J., & Clubley, E. (2001). The autism‐spectrum quotient (AQ): Evidence from Asperger syndrome/high‐functioning autism, males and females, scientists and mathematicians. Journal of Autism and Developmental Disorders, 31, 5–17. [DOI] [PubMed] [Google Scholar]
- Boksa, P. (2017). Smoking, psychiatric illness and the brain. Journal of Psychiatry and Neuroscience, 42, 147. [DOI] [PMC free article] [PubMed] [Google Scholar]
- Brainstorm Consortium , Anttila, V., Bulik‐Sullivan, B., Finucane, H.K., Walters, R.K., Bras, J., … & Murray, R. (2018). Analysis of shared heritability in common disorders of the brain. Science, 360, eaap8758. [DOI] [PMC free article] [PubMed] [Google Scholar]
- Bulik‐Sullivan, B., Finucane, H.K., Anttila, V., Gusev, A., Day, F.R., Loh, P.‐R., … & Neale, B.M. (2015). An atlas of genetic correlations across human diseases and traits. Nature Genetics, 47, 1236–1241 [DOI] [PMC free article] [PubMed] [Google Scholar]
- Caspi, A., Houts, R.M., Belsky, D.W., Goldman‐Mellor, S.J., Harrington, H., Israel, S., … & Moffitt, T.E. (2014). The p factor: One general psychopathology factor in the structure of psychiatric disorders? Clinical Psychological Science : A Journal of the Association for Psychological Science, 2, 119–137. [DOI] [PMC free article] [PubMed] [Google Scholar]
- Caspi, A., & Moffitt, T.E. (2018). All for one and one for all: Mental disorders in one dimension. American Journal of Psychiatry, 175, 831–844. [DOI] [PMC free article] [PubMed] [Google Scholar]
- Chatterjee, N., Shi, J., & García‐Closas, M. (2016). Developing and evaluating polygenic risk prediction models for stratified disease prevention. Nature Reviews Genetics, 17, 392–406. [DOI] [PMC free article] [PubMed] [Google Scholar]
- Choi, S.W., Mak, T.S.H., & O’Reilly, P.F. (2018). A guide to performing Polygenic Risk Score analyses. bioRxiv, 10.1101/416545 [DOI] [PMC free article] [PubMed] [Google Scholar]
- Claussnitzer, M., Cho, J.H., Collins, R., Cox, N.J., Dermitzakis, E.T., Hurles, M.E., … & McCarthy, M.I. (2020). A brief history of human disease genetics. Nature, 577, 179–189. [DOI] [PMC free article] [PubMed] [Google Scholar]
- Conners, C., Erhardt, D., & Sparrow, E. (1999). Conners’ adult ADHD rating scales. North Tonawanda, NY: Multi‐Health Systems. [Google Scholar]
- Conti, G., Heckman, J., & Urzua, S. (2010). The education‐health gradient. The American Economic Review, 100, 234–238. [DOI] [PMC free article] [PubMed] [Google Scholar]
- Cross‐Disorder Group of the Psychiatric Genomics Consortium . (2019). Electronic address: plee0@mgh.harvard.edu & Cross‐Disorder Group of the Psychiatric Genomics Consortium. Genomic Relationships, Novel Loci, and Pleiotropic Mechanisms across Eight Psychiatric Disorders. Cell, 179, 1469–1482.e11 [DOI] [PMC free article] [PubMed] [Google Scholar]
- de Lijster, J.M., Dierckx, B., Utens, E.M.W.J., Verhulst, F.C., Zieldorff, C., Dieleman, G.C., Legerstee, J.S. (2017). The age of onset of anxiety disorders. Canadian Journal of Psychiatry, 62, 237–246. [DOI] [PMC free article] [PubMed] [Google Scholar]
- Demontis, D., & Walters, R.K. (2019). Discovery of the first genome‐wide significant risk loci for attention deficit/hyperactivity disorder. Nature Genetics, 51, 63–75. [DOI] [PMC free article] [PubMed] [Google Scholar]
- Demontis, D., & Walters, R.K. (2017). Discovery of the first genome‐wide significant risk loci for ADHD. bioRxiv, 10.1101/145581 [DOI] [PMC free article] [PubMed] [Google Scholar]
- Euesden, J., Lewis, C.M., & O’Reilly, P.F. (2015). PRSice: Polygenic Risk Score software. Bioinformatics, 31, 1466–1468. [DOI] [PMC free article] [PubMed] [Google Scholar]
- Grove, J., Ripke, S., Als, T.D., Mattheisen, M., Walters, R.K., Won, H., … & Børglum, A.D. (2019). Identification of common genetic risk variants for autism spectrum disorder. Nature Genetics, 51, 431–444. [DOI] [PMC free article] [PubMed] [Google Scholar]
- Hettema, J.M., Neale, M.C., Myers, J.M., Prescott, C.A., & Kendler, K.S. (2006). A population‐based twin study of the relationship between neuroticism and internalizing disorders. American Journal of Psychiatry, 163, 857–864. [DOI] [PubMed] [Google Scholar]
- Huisman‐van Dijk, H.M., van de Schoot, R., Rijkeboer, M.M., Mathews, C.A., & Cath, D.C. (2016). The relationship between tics, OC, ADHD and autism symptoms: A cross‐ disorder symptom analysis in Gilles de la Tourette syndrome patients and family‐members. Psychiatry Research, 237, 138–146. [DOI] [PMC free article] [PubMed] [Google Scholar]
- Jansen, A.G., Dieleman, G.C., Jansen, P.R., Verhulst, F.C., Posthuma, D., & Polderman, T.J.C. (2019). Psychiatric polygenic risk scores as predictor for attention deficit/hyperactivity disorder and autism spectrum disorder in a clinical child and adolescent sample. Behavior Genetics, 50, 203–212. [DOI] [PMC free article] [PubMed] [Google Scholar]
- Jansen, P.R., Watanabe, K., Stringer, S., Skene, N., Bryois, J., Hammerschlag, A.R., … & Posthuma, D. (2019). Genome‐wide analysis of insomnia in 1,331,010 individuals identifies new risk loci and functional pathways. Nature Genetics, 51, 394. [DOI] [PubMed] [Google Scholar]
- Katzman, M.A., Bilkey, T.S., Chokka, P.R., Fallu, A., & Klassen, L.J. (2017). Adult ADHD and comorbid disorders: Clinical implications of a dimensional approach. BMC Psychiatry, 17, 302. [DOI] [PMC free article] [PubMed] [Google Scholar]
- Kessler, R.C., Amminger, G.P., Aguilar‐Gaxiola, S., Alonso, J., Lee, S., & Bedirhan Ustun, T. (2007). Age of onset of mental disorders: A review of recent literature. Current Opinion in Psychiatry, 20, 359–364. [DOI] [PMC free article] [PubMed] [Google Scholar]
- Klimkiewicz, A., Klimkiewicz, J., Jakubczyk, A., Kieres‐Salomoński, I., & Wojnar, M. (2015). Comorbidity of alcohol dependence with other psychiatric disorders. Part I. Epidemiology of dual diagnosis. Psychiatria Polska, 49, 265–275. [DOI] [PubMed] [Google Scholar]
- Krapohl, E., Patel, H., Newhouse, S., Curtis, C.J., von Stumm, S., Dale, P.S., … & Plomin, R. (2018). Multi‐polygenic score approach to trait prediction. Molecular Psychiatry, 23, 1368–1374. [DOI] [PMC free article] [PubMed] [Google Scholar]
- Lee, J.J., Wedow, R., Okbay, A., Kong, E., Maghzian, O., Zacher, M., … & Cesarini, D. (2018). Gene discovery and polygenic prediction from a genome‐wide association study of educational attainment in 1.1 million individuals. Nature Genetics, 50, 1112–1121. [DOI] [PMC free article] [PubMed] [Google Scholar]
- Linnér, R.K., Biroli, P., Kong, E., Meddens, S.F.W., Wedow, R., Fontana, M.A., … & Beauchamp, J.P. (2019). Genome‐wide association analyses of risk tolerance and risky behaviors in over 1 million individuals identify hundreds of loci and shared genetic influences. Nature Genetics, 51, 245. [DOI] [PMC free article] [PubMed] [Google Scholar]
- Liu, M., Jiang, Y., Wedow, R., Li, Y., Brazel, D.M., Chen, F., … & Vrieze, S. (2019). Association studies of up to 1.2 million individuals yield new insights into the genetic etiology of tobacco and alcohol use. Nature Genetics, 51, 237. [DOI] [PMC free article] [PubMed] [Google Scholar]
- Loe, I.M., & Feldman, H.M. (2007). Academic and educational outcomes of children with ADHD. Journal of Pediatric Psychology, 32, 643–654. [DOI] [PubMed] [Google Scholar]
- Lord, C., Rutter, M., Heemsbergen, J., Jordan, H., Mawhood, I., & Schopler, E. (1989). Autism diagnostic observation schedule: A standardized observation of communicative and social behavior. Journal of Autism and Developmental Disorders, 19, 185–212. [DOI] [PubMed] [Google Scholar]
- Lynch, J.L., & von Hippel, P.T. (2016). An education gradient in health, a health gradient in education, or a confounded gradient in both? Social Science and Medicine, 1982(154), 18–27. [DOI] [PubMed] [Google Scholar]
- Maier, R.M., Zhu, Z., Lee, S.H., Trzaskowski, M., Ruderfer, D.M., Stahl, E.A., … & Robinson, M.R. (2018). Improving genetic prediction by leveraging genetic correlations among human diseases and traits. Nature Communications, 9, 989. [DOI] [PMC free article] [PubMed] [Google Scholar]
- McCarthy, S., Das, S., Kretzschmar, W., Delaneau, O., Wood, A.R., Teumer, A., … & Marchini, J. (2016). A reference panel of 64,976 haplotypes for genotype imputation. Nature Genetics, 48, 1279–1283. [DOI] [PMC free article] [PubMed] [Google Scholar]
- McConaughy, S.H., & Achenbach, T.M. (2001). Manual for the semi‐structured clinical interview for children and adolescents. Burlington, VT: University of Vermont. [Google Scholar]
- Murray, A.L., Eisner, M., & Ribeaud, D. (2016). The development of the general factor of psychopathology ‘p Factor’ through childhood and adolescence. Journal of Abnormal Child Psychology, 44, 1573–1586. [DOI] [PubMed] [Google Scholar]
- Nagel, M., Jansen, P.R., Stringer, S., Watanabe, K., de Leeuw, C.A., Bryois, J., … & Posthuma, D. (2018). Meta‐analysis of genome‐wide association studies for neuroticism in 449,484 individuals identifies novel genetic loci and pathways. Nature Genetics, 50, 920–927. [DOI] [PubMed] [Google Scholar]
- Otowa, T., Hek, K., Lee, M., Byrne, E.M., Mirza, S.S., Nivard, M.G., … & Hettema, J.M. (2016). Meta‐analysis of genome‐wide association studies of anxiety disorders. Molecular Psychiatry, 21, 1391–1399. [DOI] [PMC free article] [PubMed] [Google Scholar]
- Pardiñas, A.F., Holmans, P., Pocklington, A.J., Escott‐Price, V., Ripke, S., Carrera, N., … & Walters, J.T.R. (2018). Common schizophrenia alleles are enriched in mutation‐intolerant genes and in regions under strong background selection. Nature Genetics, 50, 381–389. [DOI] [PMC free article] [PubMed] [Google Scholar]
- Patten, S.B. (2017). Age of onset of mental disorders. Canadian Journal of Psychiatry, 62, 235–236. [DOI] [PMC free article] [PubMed] [Google Scholar]
- Polderman, T.J.C., Hoekstra, R.A., Vinkhuyzen, A.A.E., Sullivan, P.F., van der Sluis, S., & Posthuma, D. (2013). Attentional switching forms a genetic link between attention problems and autistic traits in adults. Psychological Medicine, 43, 1985–1996. [DOI] [PMC free article] [PubMed] [Google Scholar]
- Polderman, T.J.C., Benyamin, B., de Leeuw, C.A., Sullivan, P.F., van Bochoven, A., Visscher, P.M., … & Posthuma, P. (2015). Meta‐analysis of the heritability of human traits based on fifty years of twin studies. Nature Genetics, 47, 702–709. [DOI] [PubMed] [Google Scholar]
- Price, A.L., Patterson, N.J., Plenge, R.M., Weinblatt, M.E., Shadick, N.A., & Reich, D. (2006). Principal components analysis corrects for stratification in genome‐wide association studies. Nature Genetics, 38, 904–909. [DOI] [PubMed] [Google Scholar]
- Satterstrom, F.K., Kosmicki, J.A., Wang, J., Breen, M.S., De Rubeis, S., An, J.Y., … & Buxbaum, J.D. (2020). Large‐scale exome sequencing study implicates both developmental and functional changes in the neurobiology of autism. Cell, 180, 568–584.e23. [DOI] [PMC free article] [PubMed] [Google Scholar]
- Savage, J.E., Jansen, P.R., Stringer, S., Watanabe, K., Bryois, J., de Leeuw, C.A., … & Posthuma, D. (2018). Genome‐wide association meta‐analysis in 269,867 individuals identifies new genetic and functional links to intelligence. Nature Genetics, 50, 912–919. [DOI] [PMC free article] [PubMed] [Google Scholar]
- Schizophrenia Working Group of the Psychiatric Genomics Consortium . (2014). Biological insights from 108 schizophrenia‐associated genetic loci. Nature, 511, 421–427. [DOI] [PMC free article] [PubMed] [Google Scholar]
- Shaffer, D., Fisher, P., Lucas, C.P., Dulcan, M.K., & Schwab‐Stone, M.E. (2000). NIMH Diagnostic Interview Schedule for Children Version IV (NIMH DISC‐IV): Description, differences from previous versions, and reliability of some common diagnoses. Journal of the American Academy of Child and Adolescent Psychiatry, 39, 28–38. [DOI] [PubMed] [Google Scholar]
- Skarabis, N., & Ripke, S. (2017). Beps – Berlin psychosis study. European Neuropsychopharmacology, 27, S466. [Google Scholar]
- Smith, P.H., Mazure, C.M., & McKee, S.A. (2014). Smoking and mental illness in the US population. Tobacco Control, 23, e147. [DOI] [PMC free article] [PubMed] [Google Scholar]
- Stahl, E.A., Breen, G., Forstner, A.J., McQuillin, A., Ripke, S., Trubetskoy, V., … & Sklar, P. (2018). Genome‐wide association study identifies 30 Loci Associated with Bipolar Disorder. bioRxiv, 10.1101/173062 [DOI] [PMC free article] [PubMed] [Google Scholar]
- Tielbeek, J.J., Johansson, A., Polderman, T.J.C., Rautiainen, M.R., Jansen, P., Taylor, M., … & Posthuma, D. (2017). Genome‐wide association studies of a broad spectrum of antisocial behavior. JAMA Psychiatry, 74, 1242–1250. [DOI] [PMC free article] [PubMed] [Google Scholar]
- Tiller, J.W.G. (2013). Depression and anxiety. Medical Journal of Australia, 199, S28–S31. [DOI] [PubMed] [Google Scholar]
- Torkamani, A., Wineinger, N.E., & Topol, E.J. (2018). The personal and clinical utility of polygenic risk scores. Nature Reviews Genetics, 19, 581–590. [DOI] [PubMed] [Google Scholar]
- Ulfvebrand, S., Birgegård, A., Norring, C., Högdahl, L., & von Hausswolff‐Juhlin, Y. (2015). Psychiatric comorbidity in women and men with eating disorders results from a large clinical database. Psychiatry Research, 230, 294–299. [DOI] [PubMed] [Google Scholar]
- Vassos, E., Di Forti, M., Coleman, J., Iyegbe, C., Prata, D., Euesden, J., … & Breen, G. (2017). An examination of polygenic score risk prediction in individuals with first‐episode psychosis. Biological Psychiatry, 81, 470–477. [DOI] [PubMed] [Google Scholar]
- Walters, R.K., Polimanti, R., Johnson, E.C., McClintick, J.N., Adams, M.J., Adkins, A.E., … & Agrawal, A. (2018). Transancestral GWAS of alcohol dependence reveals common genetic underpinnings with psychiatric disorders. Nature Neuroscience, 21, 1656–1669. [DOI] [PMC free article] [PubMed] [Google Scholar]
- Watanabe, K., Stringer, S., Frei, O., Umićević Mirkov, M., de Leeuw, C., Polderman, T.J.C., … & Posthuma, D. (2019). A global overview of pleiotropy and genetic architecture in complex traits. Nature Genetics, 51, 1339–1348. [DOI] [PubMed] [Google Scholar]
- Wray, N.R., Lee, S.H., Mehta, D., Vinkhuyzen, A.A.E., Dudbridge, F., & Middeldorp, C.M. (2014). Research review: Polygenic methods and their application to psychiatric traits. Journal of Child Psychology and Psychiatry, 55, 1068–1087. [DOI] [PubMed] [Google Scholar]
- Wray, N.R., Ripke, S., Mattheisen, M., Trzaskowski, M., Byrne, E.M., & Abdellaoui, A., … & the Major Depressive Disorder Working Group of the Psychiatric Genomics Consortium (2018). Genome‐wide association analyses identify 44 risk variants and refine the genetic architecture of major depression. Nature Genetics, 50, 668–681. [DOI] [PMC free article] [PubMed] [Google Scholar]
- Zheng, Z., Zheng, P., & Zou, X. (2018). Association between schizophrenia and autism spectrum disorder: A systematic review and meta‐analysis. Autism Research: Official Journal of the International Society for Autism Research, 11, 1110–1119. [DOI] [PubMed] [Google Scholar]
Associated Data
This section collects any data citations, data availability statements, or supplementary materials included in this article.
Supplementary Materials
Appendix S1. Selection of predictive polygenic risk scores (PRS).
Table S1. Overview diagnostic composition including co‐diagnoses.
Table S2. Most common comorbidities in the sample.
Table S3. GWAS discovery sample information.
Table S4. Inflation statistics GWAS statistics.
Table S5. Genetic correlations based on LDSC regression analysis.
Table S6. Correlational matrix of the PRS within Inside‐out.
Table S7. Results of the univariate logistic regression analysis.
Table S8. Results of the univariate logistic regression analysis with ID cases excluded from the sample.
Table S9. Results of the multivariable logistic regression analysis, all eight univariate significant PRS included.