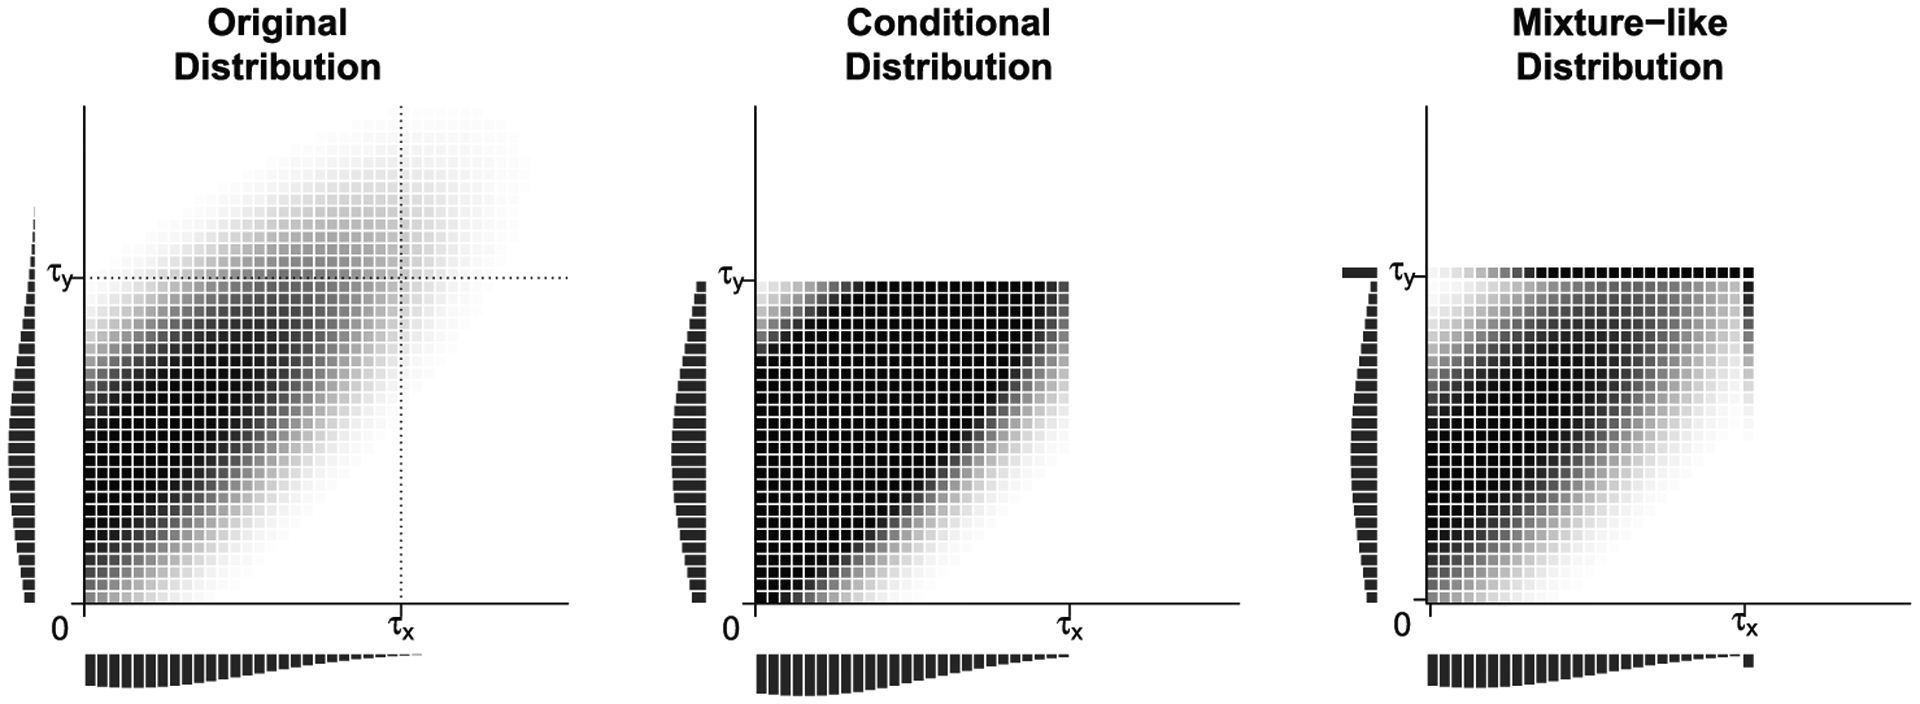
FIGURE 1.

Illustration of bivariate distributions underlying the three population parameters. Left: Original distribution over [0, ∞) × [0, ∞), which has Spearman’s correlation ρS. Middle: Conditional distribution over ΩR = Ω, which has Spearman’s correlation . Right: Mixture-like distribution SH over region Ω ∪ [0, τX] × τY ∪ τX × [0, τY], which has Spearman’s correlation
