Abstract
Currently, high-throughput quantitative proteomic and transcriptomic approaches have been widely used for exploring the molecular mechanisms and acquiring biomarkers for cancers. Our study aimed to illuminate the multi-dimensional molecular mechanisms underlying renal cell carcinoma (RCC) via investigating the quantitative global proteome and the profile of phosphorylation. A total of 5,428 proteins and 8,632 phosphorylation sites were quantified in RCC tissues, with 709 proteins and 649 phosphorylation sites found to be altered in expression compared with the matched adjacent non-tumor tissues. These differentially expressed proteins were mainly involved in metabolic process terms involving the glycolysis pathway, oxidative phosphorylation and fatty acid metabolism which have been considered to be a potential mechanism of RCC progression. Moreover, phosphorylation analysis indicated that these upregulated phosphorylated proteins are implicated in the glucagon signaling pathway and cholesterol metabolism, while the downregulated phosphorylated proteins were found to be predominantly involved in glycolysis, the pentose phosphate pathway, carbon metabolism and biosynthesis of amino acids. In addition, several new candidate proteins, CD14, MPO, NCF2, SOD2, PARP1, were found to be upregulated and MUT, ACADM, PCK1 were downregulated in RCC. These proteins may be recognized as new biomarkers for RCC. These findings could broaden our insight into the underlying molecular mechanisms of RCC and identify candidate biomarkers for the treatment of RCC.
Keywords: renal cell carcinoma, proteome, phosphorylome, biomarkers, pathways
Introduction
In a worldwide perspective, kidney cancer, one of the most commonly diagnosed malignant tumor, accounts for approximately 2–3% of all types of cancers (1–3). Clear cell renal cell carcinoma (RCC) is considered to be the main type of RCC, and its incidence and morbidity is consistently increasing annually (4). In the clinic, the prognosis of RCC patients may be favorable if diagnosed at an early stage. RCC is an intricate disease owing to its etiological and histological heterogeneity, and the underlying molecular mechanisms of RCC tumorigenesis are far from clear (5,6). Exploring the concrete mechanisms of RCC and identifying various potential biomarkers for the early diagnosis of RCC are crucial.
Currently, with the rapid development of quantitative proteomic methods by tandem mass spectrometry (MS/MS), researchers are able to explore the total differentially expressed proteins in different cancers and certain post-translational modifications (PTMs) of crucial proteins in cancers, which is helpful for screening protein candidates serving as novel diagnostic biomarkers or therapeutic targets (7–9).
PTMs of protein have been demonstrated to have a major influence in the regulation of protein functions. There are multiple modifications including phosphorylation, acetylation, SUMOylation, succinylation and malonylation (10,11). Among these PTMs, phosphorylation is fast, reversible and often highly specific, which remains a critical protein modification for regulating signaling pathways in various biological processes (12). Activation of protein phosphorylation contributes to a cascade of downstream signaling processes which are critical for cell maintenance and survival, and disorders of this process have been implicated in various types of cancer (13,14). Thus, the comprehensive identification of phosphorylation is pivotal by which to explore the molecular pathogenesis, which may contribute to the precise treatment and prediction of RCC. To date, various studies have specifically focused on the changes in the quantitative global proteome but few have investigated the phosphorylation in RCC (15–17). Therefore, we aimed to combine quantitative global proteome analysis and alterations in phosphorylation, with the expectation to deepen insight into the tumorigenesis of RCC.
Materials and methods
RCC sample collection
Nine human RCC tumor samples and matched adjacent non-tumor samples were collected from RCC patients treated at the Urology Department of Sir Run Run Shaw Hospital from February to December, 2018 (Zhejiang, China). Inclusion criteria included: i) samples from patients with RCC stored in the biological specimen bank of Sir Run Run Shaw Hospital; ii) patients aged ≥18 years; and iii) cancer type identified histologically or cytologically. Exclusion criteria included: i) patients with severe organic lesions; ii) patients with additional complications such as renal cyst, kidney stone and other kidney diseases; iii) patients previously diagnosed with any other malignancies. Four RCC tumor samples and matched adjacent non-tumor samples were used for liquid chromatography-mass spectrometry (LC/MS) and five paired samples were used for immunohistochemistry (IHC). The patients included 5 males and 4 females, with an average age of 53.6±7.6 years (range, 43–60 years). Patient information is documented in Table SI. The signed and dated consent form of each patient was obtained before surgery. All samples used in this research were stored at the biological specimen bank of Sir Run Run Shaw Hospital. These samples were obtained with the permission of the Ethics Committee of Sir Run Run Shaw Hospital affiliated with Zhejiang University Medical College. None of the RCC patents received any other therapy before surgery. Human tumor samples were treated with phosphate-buffered saline (PBS) three times to be cleansed from the residual blood, and then maintained in liquid nitrogen and finally stored at −80°C.
Protein extraction
Firstly, we took out the sample from −80°C, weighed a suitable amount of tissue sample into the mortar and added liquid nitrogen and fully ground them to powder. The samples of each group were respectively added with 4 times the volume of the powder lysis buffer (8 M urea, 1% protease inhibitor, 1% phosphatase inhibitor) followed by sonication three times on ice. At 4°C, centrifugation at 12,000 × g was used for 10 min. The cell fragments were removed, the supernatant was transferred to a new centrifuge tube, and the protein concentration was determined using a BCA kit (Abcam).
Trypsin digestion
In preparation of trypsin digestion, the final concentration of dithiothreitol was 5 mM and temperature was reduced to 56°C for 30 min. After that, the final concentration of iodoacetamide was 11 mM and incubated with the protein sample in darkness for 15 min at room temperature. Finally, the urea concentration of the sample was diluted to less than 2 M. Trypsin was added in a mass ratio of 1:50 (pancreatin:protein) and digestion was performed overnight at 37°C. The trypsin was added at the ratio of 1:100 (pancreatin:protein) and digestion was continued for 4 h.
Tandem mass tag (TMT) labeling
The peptides were desalted using Strata X C18 column (Phenomenex) and freeze-dried in a vacuum. The peptide powder was dissolved with 0.5 M tetraethylammonium bromide (TEAB) and labeled according to the operating instructions of the TMT kit (Thermo Fisher Scientific, Inc.). The simple operation process was as follows: after unfreezing, the labeling reagent was dissolved with acetonitrile, mixed with peptide sample, incubated at room temperature for 2 h, and pooled, desalted, and dried by vacuum centrifugation.
High-performance liquid chromatography (HPLC) fractionation
The peptide sample was classified by high pH reverse HPLC using a Thermo Scientific™ BetaSil™ C18 HPLC Column (Thermo Fisher Scientific, Inc.) (5-µm particle size, 10-mm internal diameter, 250-mm length). The simple operation process was as follows: 60 fractions were separated for 60 min with the peptide grading gradient of 8–32% acetonitrile and pH of 9.0. Next, for the proteomics analysis, the peptide fractions were combined into 18 fractions, and for the phosphorylation proteomics analysis, the peptide was combined into 8 fractions, and the combined components were dried by vacuum centrifugation.
Affinity enrichment
For phosphorylated peptide enrichment, the peptide sample was dissolved in enrichment buffer solution (50% acetonitrile/6% trifluoroacetic acid). The supernatant was then transferred to a new centrifuge tube and 30 mg IMAC materials was added. The mixed sample was placed on a rotating shaker and incubated gently. After incubation, the resin was washed three times with wash buffer solution of 50% acetonitrile/6% trifluoroacetic acid and 30% acetonitrile/0.1% trifluoroacetic acid. Finally, 10% ammonia buffer was used to elute the phosphopeptide, and the eluent was collected and vacuum freeze-dried. Desalting was carried out according to the instructions of the C18 ziptips after drying, and analysis was followed by liquid chromatography-tandem mass spectrometry (LC-MS/MS).
Immunohistochemical staining
Samples were fixed in 10% (v/v) formaldehyde in PBS, embedded in paraffin and cut into 4-µm sections and used for IHC staining with antibodies. To enhance antigen exposure, the slides were treated with 1X EDTA at 98°C for 10 min for antigen retrieval. The slides were incubated with endogenous peroxidase blocking solution to inhibit endogenous peroxidase and were then incubated with the primary antibody (CD14, ab183322; Abcam, dilution 1:100; MPO, ab208670; Abcam, dilution 1:1,000; NCF2, Abs135832, Absin, dilution 1:100; SOD2, ab246860; Abcam, dilution 1:1,000; PARP1, ab194586; Abcam, dilution 1:50; MUT, ab240091; Abcam, dilution 1:200; ACADM, ab239914; Abcam, dilution 1:500; PCK1, ab248573; Abcam, dilution 1:200) at room temperature for 60 min. After rinsing with Tris-buffered saline, the slides were incubated for 45 min with biotin-conjugated secondary antibody (catalog no. SA00004-2; Proteintech Wuhan Sanying, dilution 1:600), washed, and then incubated with enzyme conjugate HRP-streptavidin. Freshly prepared DAB (Zymed; Thermo Fisher Scientific, Inc.) was used as a substrate to detect HRP. Finally, slides were counterstained with hematoxylin and mounted with aqueous mounting media. Studies on human tissue samples were conducted with approval from the Ethics Committee of the Sir Run Run Shaw Hospital, Zhejiang University.
Bioinformatic analyses
Excel was used for investigation of the differentially expressed proteins with quantification ratios >1.5 as the upregulation threshold and <0.67 as the downregulation threshold. A P-value <0.05 was considered statistically significant. Database for Annotation, Visualization and Integrated Discovery (DAVID, http://david.ncifcrf.gov) was performed to classify proteins into three categories (biological process, cellular compartment, and molecular function) against the background of Homo sapiens. Online Search Tool for the Retrieval of Interacting Genes (STRING) database (http://www.string-db.org) was performed to evaluate the protein-protein interaction (PPI) information. We imported the differentially expressed proteins (DEPs) to STRING, and only experimentally validated interactions with a combined scored >0.7 were selected as significant. Then these significant DEPs were mapped into Cytoscape plugin (https://cytoscape.org) to create network visualizations. Finally, we put the resulting PPI network to module analysis with the Plugin MCODE with the default parameters (Degree cutoff ≥2, Node score cutoff ≥2, K-core ≥2, and Max depth=100). Moreover, function and pathway enrichment analysis were performed for differentially expressed genes (DEGs) in the modules. The patient prognosis in regards to these proteins was analyzed by online software GEPIA (http://gepia.cancer-pku.cn/index.html). We used Kyoto Encyclopedia of Genes and Genomes (KEGG, http://www.kegg.jp) database to identify enriched pathways. P<0.05 was considered as indicative of a statistical significant result. All experiments described in this study were performed during 2018 to 2019.
Results
Workflow for quantitative proteome and phosphorylome in RCC
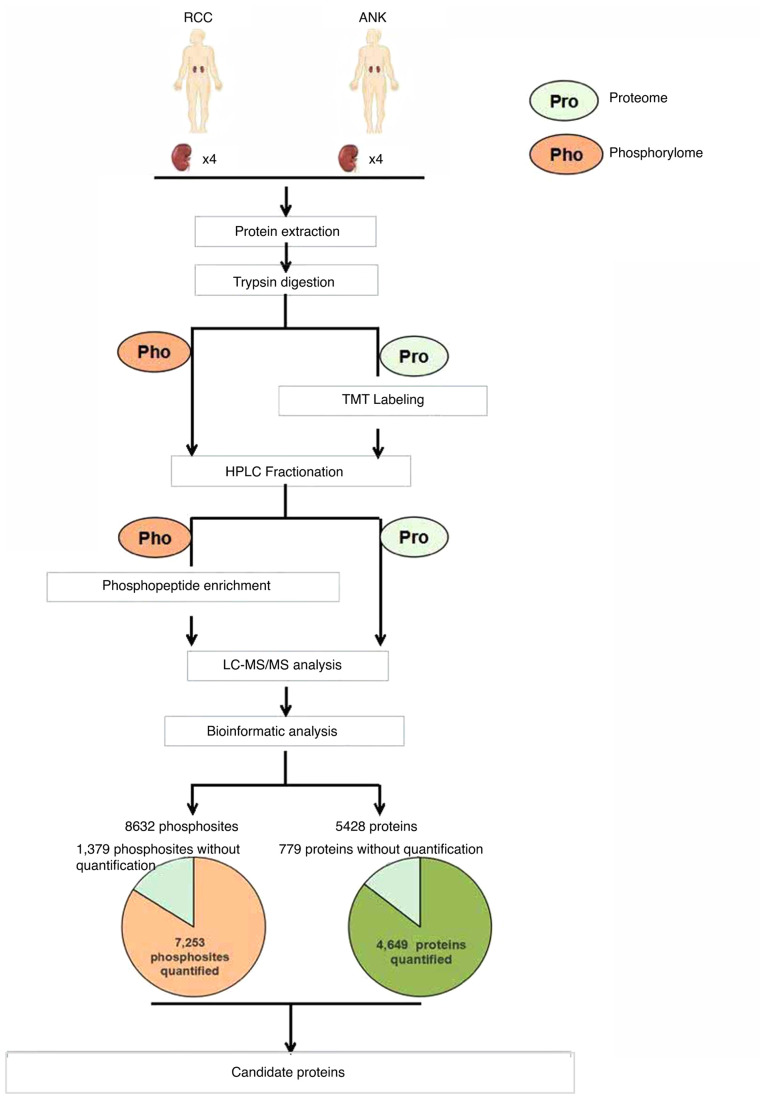
Protein samples from 4 paired renal cell carcinoma (RCC) and matched adjacent normal kidney (ANK) tissues were harvested and analyzed for protein and phosphosite identification using LC-MS/MS. TMT labeling and high-resolution mass spectrometry (HRMS) were applied to ascertain the differences in the proteome and phosphorylation between tumor and ANK tissues. Bioinformatic analysis was used to conduct detailed studies in ccRCC. The workflow is briefly indicted in Fig. 1.
Figure 1.
Schematic representation of the workflow for the global proteome and phosphorylome. Renal cell carcinoma (RCC) and adjacent normal kidney (ANK) tissues labeled with TMT were analyzed by LC-MS/MS. A number of identified proteins and phosphosites are shown in the pie chart. Candidate proteins were selected via bioinformatic analysis. TMT, tandem mass tag; LC-MS/MS, liquid chromatography-tandem mass spectrometry.
Functional analysis of the global proteome profiling in RCC
To identify the whole proteome profiling in RCC, we employed TMT labeling and HPLC fractionation after high-resolution LC-MS/MS analysis. Overall, 5,428 proteins were identified, and 4,649 of these proteins were quantified from four pairs of RCC tissue samples. Using quantification ratios >1.5 as the upregulation threshold and <0.67 as the downregulation threshold, a P-value <0.05 was considered to indicate statistical significance when comparing tumor samples to the matched adjacent nontumor tissues. In total, 331 proteins were upregulated and 378 proteins were downregulated.
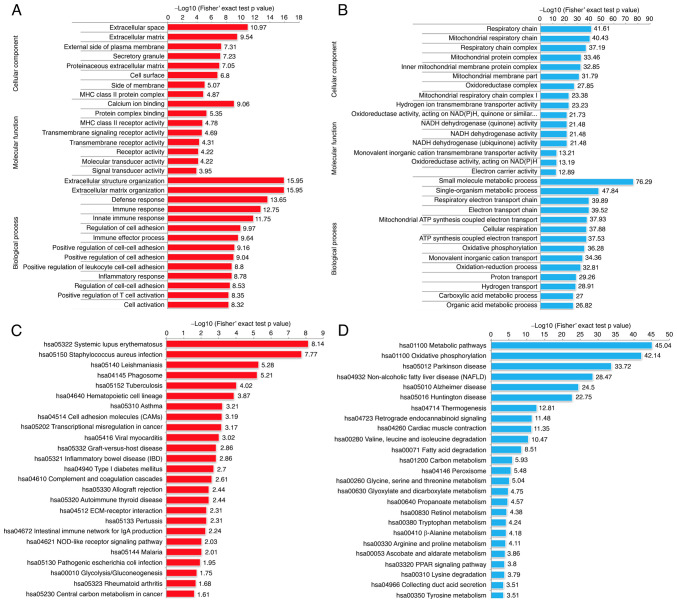
In order to further characterize the molecular functions of these DEPs, we performed Gene Ontology (GO) enrichment analysis (Fig. 2A and B). In terms of biological process, the RCC tissues possessed significantly altered biological metabolic processes, such as extracellular structure organization, immune response, and regulation of cell adhesion. Among the cellular component category, the RCC relative upregulated proteins were mainly localized in the extracellular space, extracellular matrix and cell surface, while the downregulated proteins were mainly enriched in the respiratory chain. In terms of molecular function, we observed that the upregulated proteins exhibited significant enrichment in calcium ion binding, receptor activity and signal transducer activity, while the downregulated proteins were enriched in NADH dehydrogenase activity.
Figure 2.
Functional enrichment analysis of the proteins which were significantly dysregulated in four pairs of RCC tissue samples. GO-based enrichment analysis of the upregulated (A) and downregulated (B) proteins; (C and D) KEGG pathway-based enrichment analysis of the dysregulated proteins. GO, Gene Ontology; KEGG, Kyoto Encyclopedia of Genes and Genomes.
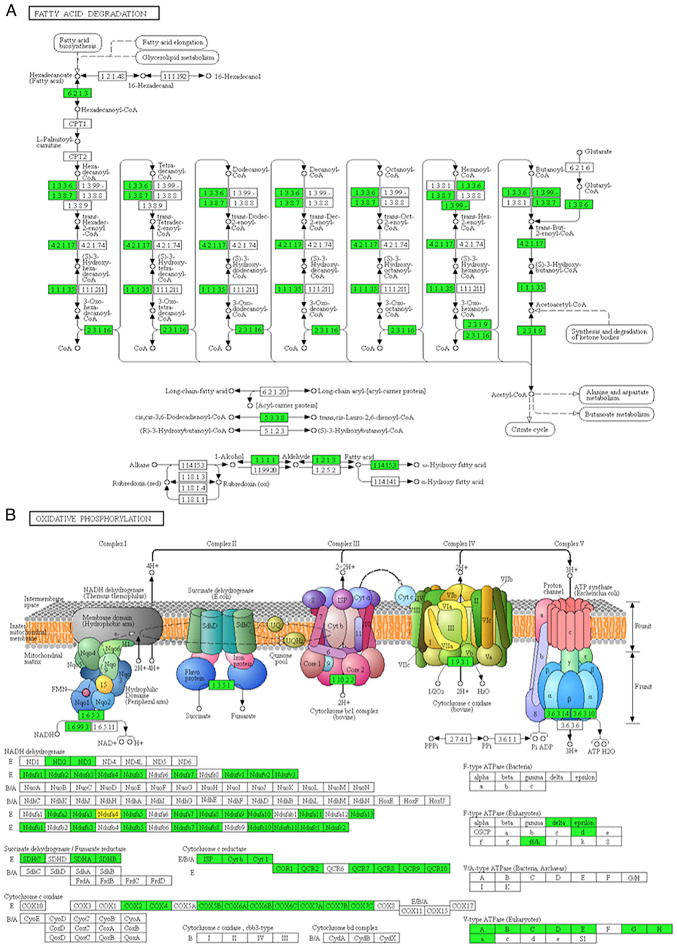
The KEGG pathway enrichment analysis was used to explore the biological functions of these significantly dysregulated proteins. The results of the KEGG pathway enrichment indicated that the upregulated proteins exhibited functions including cell adhesion molecules (CAMs), phagosome and transcriptional dysregulation in cancer (Fig. 2C and D). Interestingly, we also identified some immune-related genes, such as histocompatibility-1 MHC (MHCI), histocompatibility-2 MHC (MHCII), CD14 molecule (CD14), myeloperoxidase (MPO), protein tyrosine phosphatase, receptor type, C (PTPRC) and integrin subunit β2 (ITGB2), which indicated that immune response may play pivotal roles in the tumor development of RCC. Consistent with the Gene Ontology (GO) analysis, the result of KEGG pathway enrichment analysis presented that the RCC tissues possessed significantly altered biological metabolism, for example, fatty acid metabolism and oxidative phosphorylation. The major proteins and key enzymes related to fatty acid degradation and oxidative phosphorylation were clearly decreased (Fig. 3A and B). Consistent with previous studies (2,3), our results also indicated that a hypoxic microenvironment is a typical characteristic during RCC tumorigenesis.
Figure 3.
Two important pathways are identified. The major proteins and key enzymes related to fatty acid degradation (A) and oxidative phosphorylation (B) are shown.
Protein-protein interactome networks
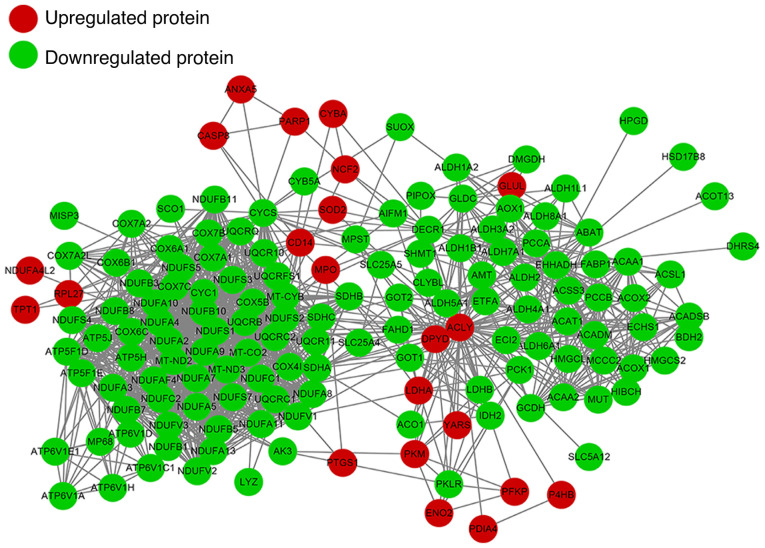
We constructed a PPI network to present the main interactions and regulatory relationships of all of these proteins in RCC (Fig. 4). Expression of lactate dehydrogenase A (LDHA3), vimentin 3, nicotinamide N-methyltransferase (NNMT2), Annexin A43, larval cuticular protein, 14 kDa (LCP14) and enolase 21 (ENO21) in RCC tissue have been shown to be dramatically higher in tumors when compared to the normal tissue. In this study we ascertained that the above genes were highly expressed in RCC tissues when compared to that in the normal tissues. In addition, we found several new candidate proteins such as CD14 molecule (CD14), myeloperoxidase (MPO), neutrophil cytosolic factor 2 (NCF2), superoxide dismutase 2 (SOD2), poly(ADP-ribose) polymerase 1 (PARP1), phosphofructokinase, platelet α (PFKPA) that were upregulated and methylmalonyl-CoA mutase (MUT), acyl-CoA dehydrogenase medium chain (ACADM), phosphoenolpyruvate carboxykinase 1 (PCK1) that were downregulated in RCC, which may be recognized as new biomarkers for RCC.
Figure 4.
Construction of protein-protein interactome networks of the differentially expressed proteins in the RCC tissues. Red, upregulated protein; green, downregulated protein.
Phosphorylation profile of RCC and the matched ANK tissues
Quantitative protein phosphorylation analyses were performed by phosphopeptide enrichment using Ti-IMAC microspheres (J&K Scientific) and the following LC-MS/MS analysis. All the protein phosphorylation sites obtained from Maxquant were filtered based on the localization probability, and setting the localization probability >0.75 as the threshold. In general, of the identified 8,632 phosphorylation sites in 3,128 protein groups in the human tissues, 7,253 of these sites in 2,962 proteins were quantified. In total, 315 differentially expressed phosphorylation sites were quantified as downregulated targets and 334 sites were quantified as upregulated targets with a quantification ratio >1.5 for the upregulation threshold and <0.67 for the downregulation threshold (P<0.05).
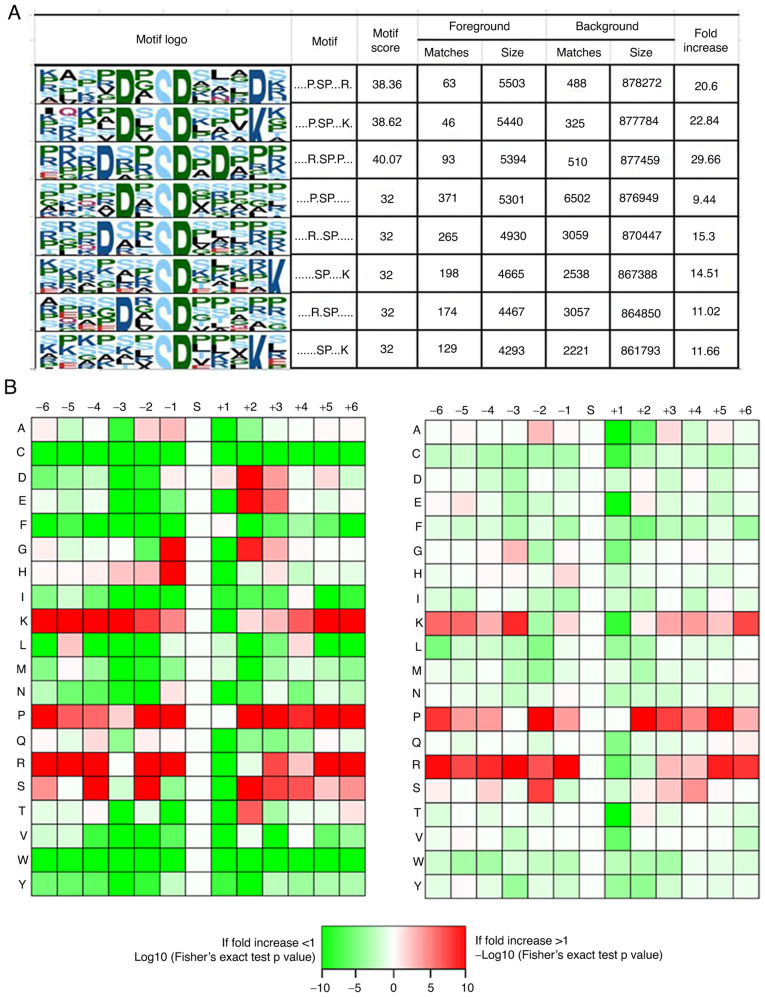
In order to determine the possible specific sequence motifs surrounding the phosphorylated residues in the human RCC samples, we carried out motif analysis to observe the amino acids at the positions around the phosphorylation sites. Eight remarkably enriched motifs were identified among all the identified phosphorylation sites, namely, P*SP***R, P*SP***K, R**SP*P, P*SP, R**SP, SP****K, R*SP and SP***K (where * represents a random amino acid residue, Fig. 5A). The amino acid frequencies of the sequences surrounding the phosphorylation sites were analyzed to confirm whether the amino acids occurred adjacent to phosphorylation sites are position-specific in motifs (Fig. 5B). We identified that lysine (K), proline (P) and arginine (R) were overrepresented in multiple positions (±6, ±5, ±4, +3, −2, −1) surrounding the phosphorylation sites, while cysteine (C), and tryptophane (W) were usually depleted at all positions (±6, ±5, ±4, ±3, ±2, ±1). Of interest, both glycine (G) and histidine (H) occurred more frequently at the −1 position but few at the +1 position surrounding the phosphorylation sites.
Figure 5.
Motif analysis of the identified phosphorylated peptides in the human RCC samples. (A) Sequence logo of the phosphorylated motifs. (B) Heatmap of the amino acid frequencies of the sequences flanking phosphorylated sites.
Bioinformatic analysis of the protein phosphorylation in RCC
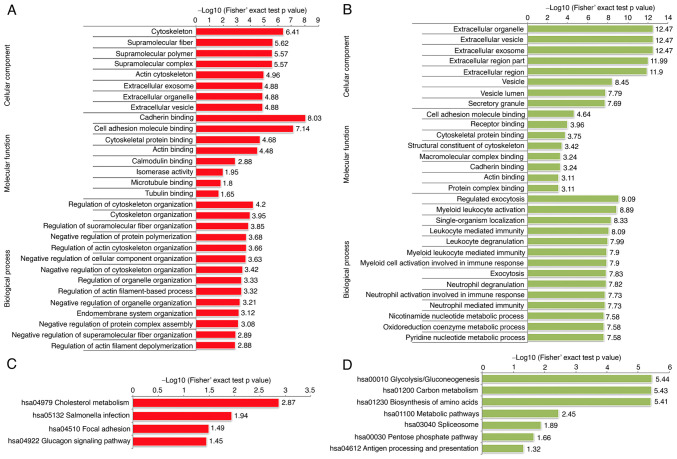
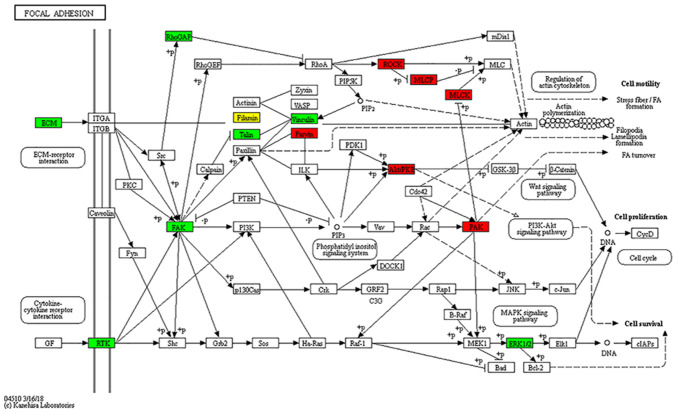
To evaluate the biological characteristics and functional alterations of the phosphorylation in RCC tissues, GO enrichment and KEGG analysis were performed. In terms of cellular components, the dysregulated phosphorylated proteins were mainly localized in the cytoskeleton, supramolecular complex, and extracellular region. The principal molecular functions of these proteins were mainly enriched in cytoskeletal protein binding and cell adhesion molecule binding. As to the biological process, the results indicated that the proteins related to cytoskeleton organization, supramolecular fiber organization and regulation of cellular component organization were relatively enriched among the upregulated proteins; however, most of the downregulated proteins were enriched in metabolic process and immune response (Fig. 6A and B). Interestingly, the KEGG pathway analyses presented that the upregulated phosphorylated proteins were also significantly enriched in focal adhesion. In contrast, the enrichment pathways among the downregulated proteins were glycolysis, biosynthesis of amino acids, and carbon metabolism (Fig. 6C and D). Differential phosphorylated proteins in focal adhesion pathways related to cancer metastasis (cell motility, cell proliferation and cell survival) are shown in Fig. 7. The upregulated phosphorylated proteins were found to be closely related to regulation of cellular cytoskeleton and significant signaling pathways, which may probably contribute to metastasis of RCC.
Figure 6.
Functional enrichment analysis of the proteins with upregulated and downregulated phosphosites in the RCC samples. GO-based enrichment analysis of proteins with upregulated (A) and downregulated (B) phosphosites. KEGG pathway-based enrichment analysis of proteins with upregulated (C) and downregulated (D) phosphosites. GO, Gene Ontology; KEGG, Kyoto Encyclopedia of Genes and Genomes.
Figure 7.
Focal adhesion pathways are involved in RCC. Differential phosphorylated proteins in focal adhesion pathways. RCC, renal cell carcinoma.
Verification of candidate proteins and analysis of prognosis
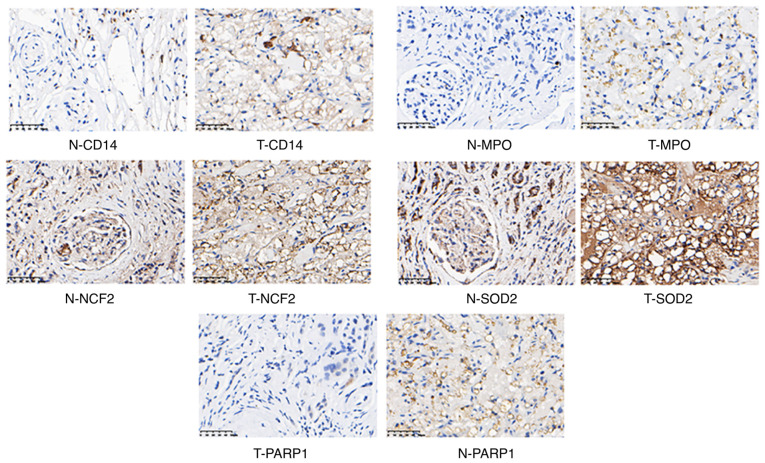
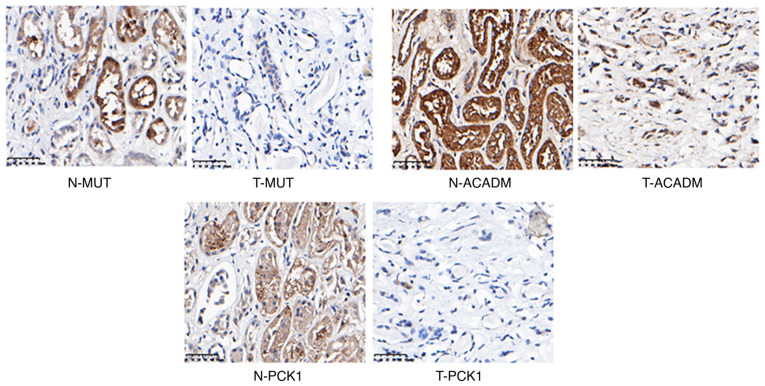
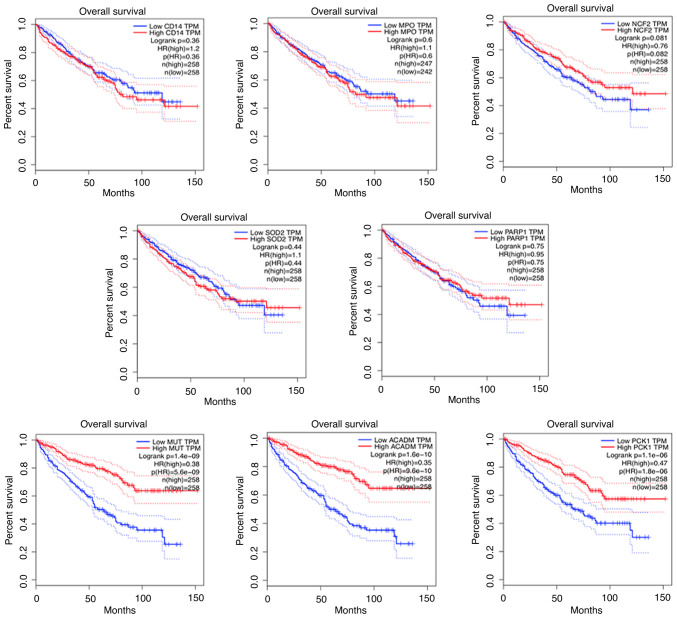
To demonstrate the expression of candidate proteins identified by the above analysis, IHC experiments were performed using 5 human RCC tumor samples and matched adjacent non-tumor samples. CD14, MPO, NCF2, SOD2, and PARP1 were upregulated (Fig. 8) and MUT, ACADM and PCK1 were downregulated in RCC (Fig. 9). In addition, we also analyzed the correlation between these proteins and RCC prognosis by using online software GEPIA. Interestingly, the upregulated proteins (CD14, MPO, NCF2, SOD2, PARP1) showed no prognostic value in RCC patients, while prognostic value in the downregulated proteins (MUT, ACADM, PCK1) were found (Fig. 10).
Figure 8.
IHC results of the upregulated proteins in the RCC tumor samples. N, normal samples; T, tumor samples. IHC, immunohistochemistry; RCC, renal cell carcinoma. CD14, CD14 molecule; MPO, myeloperoxidase; NCF2, neutrophil cytosolic factor 2; SOD2, superoxide dismutase 2; PARP1, poly(ADP-ribose) polymerase 1.
Figure 9.
IHC results of the downregulated proteins in the RCC tumor samples. N, normal samples; T, tumor samples. IHC, immunohistochemistry; RCC, renal cell carcinoma. MUT, methylmalonyl-CoA mutase; ACADM, acyl-CoA dehydrogenase medium chain; PCK1, phosphoenolpyruvate carboxykinase 1.
Figure 10.
Prognostic analysis of the identified proteins. Prognostic analysis of CD14 molecule (CD14), myeloperoxidase (MPO), neutrophil cytosolic factor 2 (NCF2), superoxide dismutase 2 (SOD2), poly(ADP-ribose) polymerase 1 (PARP1), methylmalonyl-CoA mutase (MUT), acyl-CoA dehydrogenase medium chain (ACADM) and phosphoenolpyruvate carboxykinase 1 (PCK1).
Discussion
In the present research, a quantitative proteomic analysis was used to investigate the underlying molecular mechanisms of renal cell carcinoma (RCC) development. We combined both TMT labeling and LC-MS/MS-based enrichment to explore the global proteins and post-translational modification (PTM) profiles in tumor tissues. A total of 709 differentially expressed proteins (DEPs) and 649 differentially expressed phosphorylated sites were identified in the RCC tissues.
Our data underlined that the DEPs in the RCC tissues were enriched in glycolysis, fatty acid metabolism and oxidative phosphorylation. Changes in energy metabolism is known as a biochemical feature of cancer cells, one of the hallmarks of cancer. Many researchers have indicated that altered energy metabolism is an important biological process of cancer cells (18–20). Normal cells utilize glucose mainly in the mitochondria to generate energy, while in cancer cells, energy is largely generated through activated glycolysis in the cytosol in hypoxic and acidic microenvironments. In addition, glycolysis still remains the main approach of energy production for cancer cells even in the presence of ample oxygen. Importantly, glycolysis plays a crucial role in tumor cell metastasis, proliferation, and resistance to chemotherapeutics (21–23).
In recent years, more and more researchers have started to focus on the PTMs of proteins to explore the underlying mechanisms in cancers (7,8). In addition to phosphorylation, many other types of PTMs, for example, propionylation, acetylation, succinylation, ubiquitylation and crotonylation have been determined due to the development of mass spectrometry technology. Importantly, the relationship between the PTMs in tumor progression and regulating cellular energy metabolism have been demonstrated (9).
Phosphorylation, an important type of PTM in proteins, is widely distributed in diverse model organisms. Recent research has revealed that global phosphorylation is dynamically changed as a response to stress, changes in the microenvironment and genetic mutations (12,24,25). At the phosphorylation level, our results showed that numerous metabolism-related processes were enriched in the RCC samples. The upregulated phosphorylation proteins were mainly involved in glucagon signaling pathway and cholesterol metabolism, while the downregulated phosphorylation proteins were enriched in glycolysis, pentose phosphate pathway, carbon metabolism and biosynthesis of amino acids, showing a strong correlation between phosphorylation and metabolic changes in RCC samples.
By using proteomic methods, we have offered a clear insight into protein and phosphorylation profiles in human RCC. These results can broaden our insight into RCC tumorigenesis and progression, particularly the metabolism-related regulation of RCC. In addition, our research identified various original potential biomarkers for RCC. However, the effect of phosphorylation on metabolism-related regulation and its specific regulated mechanisms still needs to be rigorously verified by cell and animal research.
Supplementary Material
Acknowledgements
Not applicable.
Funding Statement
This work was supported by the National Natural Science Foundation of China (grant nos. 21402173, 81672520, 81773389 and 30973001); the Zhejiang Provincial Natural Science Foundation of China (grant nos. LY17H160020 and LY17H050003); the Zhejiang Province Medical Program (nos. 2014ZDA011 and 2014KYB134); the National Basic Research 973 Program of China (no. 2012CB518304) and the Health Department of Zhejiang Province (no. 2019ZD027).
Funding
This work was supported by the National Natural Science Foundation of China (grant nos. 21402173, 81672520, 81773389 and 30973001); the Zhejiang Provincial Natural Science Foundation of China (grant nos. LY17H160020 and LY17H050003); the Zhejiang Province Medical Program (nos. 2014ZDA011 and 2014KYB134); the National Basic Research 973 Program of China (no. 2012CB518304) and the Health Department of Zhejiang Province (no. 2019ZD027).
Availability of data and materials
The authors of the present study have uploaded the sequence data in public repositories (ProteomeXchange, project accession, PXD025551).
Authors' contributions
LX and YC conceived and designed the study. LX ZL and SY performed the experiments and wrote the paper. GL and YC reviewed the data and edited the manuscript. All authors read and approved the manuscript and agree to be accountable for all aspects of the research in ensuring that the accuracy or integrity of any part of the work are appropriately investigated and resolved.
Ethics approval and consent to participate
These samples were obtained with the permission of the Ethics Committee of Sir Run Run Shaw Hospital affiliated with Zhejiang University Medical College (Hangzhou, China).
Patient consent for publication
Not applicable.
Competing interests
The authors declare that they have no competing interests.
References
- 1.Smith RA, Andrews K, Brooks D, DeSantis CE, Fedewa SA, Lortet-Tieulent J, Manassaram-Baptiste D, Brawley OW, Wender RC. Cancer screening in the United States, 2016: A review of current American cancer society guidelines and current issues in cancer screening. CA Cancer J Clin. 2016;66:96–114. doi: 10.3322/caac.21336. [DOI] [PubMed] [Google Scholar]
- 2.Owens B. Kidney cancer. Nature. 2016;537:S97. doi: 10.1038/537S97a. [DOI] [PubMed] [Google Scholar]
- 3.Chow WH, Dong LM, Devesa SS. Epidemiology and risk factors for kidney cancer. Nat Rev Urol. 2010;7:245–257. doi: 10.1038/nrurol.2010.46. [DOI] [PMC free article] [PubMed] [Google Scholar]
- 4.Jonasch E, Gao J, Rathmell WK. Renal cell carcinoma. BMJ. 2014;349:g4797. doi: 10.1136/bmj.g4797. [DOI] [PMC free article] [PubMed] [Google Scholar]
- 5.Zarrabi K, Fang C, Wu S. New treatment options for metastatic renal cell carcinoma with prior anti-angiogenesis therapy. J Hematol Oncol. 2017;10:38. doi: 10.1186/s13045-016-0374-y. [DOI] [PMC free article] [PubMed] [Google Scholar]
- 6.Sánchez-Gastaldo A, Kempf E, González Del Alba A, Duran I. Systemic treatment of renal cell cancer: A comprehensive review. Cancer Treat Rev. 2017;60:77–89. doi: 10.1016/j.ctrv.2017.08.010. [DOI] [PubMed] [Google Scholar]
- 7.Keskin O, Tuncbag N, Gursoy A. Predicting protein-protein interactions from the molecular to the proteome level. Chem Rev. 2016;116:4884–4909. doi: 10.1021/acs.chemrev.5b00683. [DOI] [PubMed] [Google Scholar]
- 8.Aebersold R, Mann M. Mass-spectrometric exploration of proteome structure and function. Nature. 2016;537:347–355. doi: 10.1038/nature19949. [DOI] [PubMed] [Google Scholar]
- 9.Riley NM, Coon JJ. Phosphoproteomics in the age of rapid and deep proteome profiling. Anal Chem. 2016;88:74–94. doi: 10.1021/acs.analchem.5b04123. [DOI] [PMC free article] [PubMed] [Google Scholar]
- 10.Silva AMN, Vitorino R, Domingues MRM, Spickett CM, Domingues P. Post-translational modifications and mass spectrometry detection. Free Radic Biol Med. 2013;65:925–941. doi: 10.1016/j.freeradbiomed.2013.08.184. [DOI] [PubMed] [Google Scholar]
- 11.Na S, Paek E. Software eyes for protein post-translational modifications. Mass Spectrom Rev. 2015;34:133–147. doi: 10.1002/mas.21425. [DOI] [PubMed] [Google Scholar]
- 12.Humphrey SJ, James DE, Mann M. Protein phosphorylation: A major switch mechanism for metabolic regulation. Trends Endocrinol Metab. 2015;26:676–687. doi: 10.1016/j.tem.2015.09.013. [DOI] [PubMed] [Google Scholar]
- 13.Butterfield DA, Gu L, Di Domenico F, Robinson RA. Mass spectrometry and redox proteomics: Applications in disease. Mass Spectrom Rev. 2014;33:277–301. doi: 10.1002/mas.21374. [DOI] [PubMed] [Google Scholar]
- 14.Konstantinopoulos PA, Karamouzis MV, Papavassiliou AG. Post-translational modifications and regulation of the RAS superfamily of GTPases as anticancer targets. Nat Rev Drug Discov. 2007;6:541–555. doi: 10.1038/nrd2221. [DOI] [PubMed] [Google Scholar]
- 15.Okamura N, Masuda T, Gotoh A, Shirakawa T, Terao S, Kaneko N, Suganuma K, Watanabe M, Matsubara T, Seto R, et al. Quantitative proteomic analysis to discover potential diagnostic markers and therapeutic targets in human renal cell carcinoma. Proteomics. 2008;8:3194–3203. doi: 10.1002/pmic.200700619. [DOI] [PubMed] [Google Scholar]
- 16.Masui O, White NM, DeSouza LV, Krakovska O, Matta A, Metias S, Khalil B, Romaschin AD, Honey RJ, Stewart R, et al. Quantitative proteomic analysis in metastatic renal cell carcinoma reveals a unique set of proteins with potential prognostic significance. Mol Cell Proteomics. 2013;12:132–144. doi: 10.1074/mcp.M112.020701. [DOI] [PMC free article] [PubMed] [Google Scholar]
- 17.Atrih A, Mudaliar MA, Zakikhani P, Lamont DJ, Huang JT, Bray SE, Barton G, Fleming S, Nabi G. Quantitative proteomics in resected renal cancer tissue for biomarker discovery and profiling. Br J Cancer. 2014;110:1622–1633. doi: 10.1038/bjc.2014.24. [DOI] [PMC free article] [PubMed] [Google Scholar]
- 18.Gottlieb E, Mostoslavsky R. Cancer and metabolism: Why should we care? Semin Cell Dev Biol. 2015;43:1–2. doi: 10.1016/j.semcdb.2015.10.007. [DOI] [PubMed] [Google Scholar]
- 19.DeBerardinis RJ, Chandel NS. Fundamentals of cancer metabolism. Sci Adv. 2016;2:e1600200. doi: 10.1126/sciadv.1600200. [DOI] [PMC free article] [PubMed] [Google Scholar]
- 20.Cantor JR, Sabatini DM. Cancer cell metabolism: One hallmark, many faces. Cancer Discov. 2012;2:881–898. doi: 10.1158/2159-8290.CD-12-0345. [DOI] [PMC free article] [PubMed] [Google Scholar]
- 21.Wallace DC. Mitochondria and cancer. Nat Rev Cancer. 2012;12:685–698. doi: 10.1038/nrc3365. [DOI] [PMC free article] [PubMed] [Google Scholar]
- 22.Andrejeva G, Rathmell JC. Similarities and distinctions of cancer and immune metabolism in inflammation and tumors. Cell Metab. 2017;26:49–70. doi: 10.1016/j.cmet.2017.06.004. [DOI] [PMC free article] [PubMed] [Google Scholar]
- 23.Ganapathy-Kanniappan S, Geschwind JF. Tumor glycolysis as a target for cancer therapy: Progress and prospects. Mol Cancer. 2013;12:152. doi: 10.1186/1476-4598-12-152. [DOI] [PMC free article] [PubMed] [Google Scholar]
- 24.Swaney DL, Beltrao P, Starita L, Guo A, Rush J, Fields S, Krogan NJ, Villén J. Global analysis of phosphorylation and ubiquitylation cross-talk in protein degradation. Nat Methods. 2013;10:676–682. doi: 10.1038/nmeth.2519. [DOI] [PMC free article] [PubMed] [Google Scholar]
- 25.Robles MS, Humphrey SJ, Mann M. Phosphorylation is a central mechanism for circadian control of metabolism and physiology. Cell Metab. 2017;25:118–127. doi: 10.1016/j.cmet.2016.10.004. [DOI] [PubMed] [Google Scholar]
Associated Data
This section collects any data citations, data availability statements, or supplementary materials included in this article.
Supplementary Materials
Data Availability Statement
The authors of the present study have uploaded the sequence data in public repositories (ProteomeXchange, project accession, PXD025551).


