

Abstract
Peptidyl‐prolyl cis‐trans isomerase C (Ppic) is expressed in several bone marrow (BM) hematopoietic progenitors and in T‐cell precursors. Since the expression profile of Ppic in the hematoimmune system was suggestive that it could play a role in hematopoiesis and/or T lymphocyte differentiation, we sought to test that hypothesis in vivo. Specifically, we generated a Ppic‐deficient mouse model by targeting the endogenous locus by CRISPR/Cas9 and tested the requirement of Ppic in hematopoiesis. Several immune cell lineages covering BM progenitors, lymphocyte precursors, as well as mature cells at the periphery were analyzed. While most lineages were unaffected, invariant NKT (iNKT) cells were reduced in percentage and absolute cell numbers in the Ppic‐deficient thymus. This affected the most mature stages in the thymus, S2 and S3, and the phenotype was maintained at the periphery. Additionally, immature transitional T1 and T2 B lymphocytes were increased in the Ppic‐deficient spleen, but the phenotype was lost in mature B lymphocytes. In sum, our data show that Ppic is dispensable for myeloid cells, platelets, erythrocytes, αβ, and γδ T lymphocytes in vivo in the steady state, while being involved in B‐ and iNKT cell differentiation.
Keywords: Peptidylprolyl isomerase C, Cyclophilin C, Hematopoiesis, Ppic, T‐cell development, Thymopoiesis
Peptidylprolyl isomerase C (Ppic) deficient mice were generated and their hematopoietic system analyzed. Loss of Ppic caused a reduction in the number of iNKT cells differentiating in the thymus, which persisted at the periphery.

Introduction
The gene Peptidyl‐prolyl cis‐trans isomerase C (Ppic, Cypc; EC:5.2.1.8) is expressed in hematopoietic progenitors in the bone marrow, and in T‐cell precursors, or thymocytes, in the thymus. PPIC function has been mostly studied in vitro or in association studies in human and rat. PPIC is a Peptidyl‐prolyl isomerase (or PPIase) that interconverts cis and trans isomers of peptide bonds with proline, and binds to different protein partners dependent on the presence of cyclosporine A (CsA) [1]. While it belongs to a gene family containing eight members (Ppia, Ppib, Ppic, Ppid, Ppie, Ppif, Ppig, Ppih), Ppic is the family member with the most restricted pattern of tissue expression [1]. PPIC expression was detected in specific kidney structures that are sensitive to CsA‐mediated nephrotoxicity, suggestive of a role in CsA‐induced kidney damage [2, 3]. Nevertheless, PPIC overexpression in Jurkat T lymphocytes did not alter their sensitivity to CsA dependent changes in calcium signaling, challenging the former hypothesis [4]. PPIC has also been reported to be an ER cyclophilin participating in the regulation of ER redox state together with cyclophilin B [5]. Additionally, PPIC, as well as cyclophilin A and B, has DNA cleaving activity suggestive that it might play a role during apoptosis [6]. Further studies linking PPIC expression to disease included human glioma, for which increased expression levels correlated with worse survival prognosis [7]. In coronary heart disease, PPIC serum levels can be used as a diagnostic marker [8]. Further, PPIC was upregulated following brain ischemia in a rat model [9]. Finally, PPIC binding to CD147 and osteopontin led to increased metastatic activity in a mouse model of breast cancer in vitro [10].
While few studies addressed Ppic function in vivo, we detected that the gene was differentially expressed in thymocytes undergoing cell competition [11], a process whereby thymocytes at the same differentiation stage, but short time of thymus residency, outcompete others with longer dwell time in the thymus [12]. The regulated expression profile of Ppic was, therefore, suggestive that Ppic could be involved in the differentiation of T lymphocytes and/or of other hematopoietic cell lineages. With the purpose of addressing the function of Ppic in vivo, and testing its involvement in the hematoimmune system, we generated a Ppic‐deficient mouse model. We assessed different progenitors and cell lineages of the hematoimmune system and show that Ppic‐deficient mice have a defect in iNKT cell differentiation in the thymus, and reduced cell numbers of iNKT in the spleen. We also found that immature transitional T1 and T2 B cells are increased in the spleen, but B lymphocyte precursors in the bone marrow (BM), as well as the mature B cell populations, are unaffected. These data suggest that Ppic is dispensable for early hematopoiesis and the differentiation and homeostasis of myeloid cells, erythrocytes, platelets, αβ, and γδ T cells. Nevertheless, it is involved in a short window of late B cell development in the spleen, and in iNKT cell differentiation in the thymus, which determines iNKT cell numbers at the periphery.
Results
Targeting of the Ppic endogenous locus by CRISPR/Cas9
We sought to test whether Ppic was involved in the differentiation and homeostasis of the hematoimmune system. Using gene expression data from the database ImmGen [13], we confirmed that Ppic was expressed in hematopoietic stem and progenitor cells in the BM, as well as B‐ and T‐ lymphocyte precursors, and their mature counterparts (Fig. 1A). In the thymus, Ppic expression seemed to be regulated and highest at the differentiation stages undergoing cell competition, the DN2 to DN3 (Fig. 1A). Ppic expression was indeed consistent with a potential role in early hematopoiesis and T lymphocyte differentiation, validating it as an interesting candidate gene with a potential role in hematopoiesis. To test Ppic function in vivo, we engineered Ppic‐deficient mice. The endogenous locus was targeted by CRISPR/Cas9 in the B6 background, using a guide RNA (gRNA) specific to the region immediately downstream of the ATG (Fig. 1B). Two founders were generated, each bearing specific mutations that disrupted the gene and were therefore functionally identical. Though both founders were used to start two independent lines, most experiments used only the line with a 4‐nucleotide insertion downstream of the ATG, which caused a +1 frameshift in the reading frame and several early STOP codons (Fig. 1C). The founder was crossed with a WT B6 and their progeny intercrossed to establish the Ppic‐deficient mouse line, thereby setting the conditions to examine the role of Ppic in the immune system in vivo.
Figure 1.

Generation of Ppic‐deficient mice. (A) Ppic expression levels as measured by RNA seq were retrieved from the ImmGen Database [13] for the indicated cell populations in the BM (top), thymus (middle), and spleen (bottom). (B) Schematic representation of the Ppic endogenous locus (not to scale) showing the sequence targeted by the gRNA (magenta, in capitals), with the ATG (bold) and protospacer‐adjacent motif (underline) highlighted, and the primers used to genotype the progeny (arrows flanking exon 1). (C) Schematic representation of the wild type (Ppic WT, top) and mutant (Ppic Mut, bottom) predicted cDNA. Below is the alignment of the WT and mutant sequences of Ppic, highlighting the 4‐nucleotide insertion in the latter that causes a frameshift followed by early STOP codons, which are marked in the schematics by red triangles.
Ppic deficiency does not affect hematopoietic progenitors in the bone marrow
To test if Ppic plays a role in the maintenance of the most immature hematopoietic progenitors, we analyzed the BM of Ppic−/− mice by flow cytometry and compared it to gender and age‐matched Ppic+/+ controls. We assessed the population defined as Lineage‐negative, Sca‐1‐positive, Kit‐positive (LSK), that contains the hematopoietic stem and progenitor cells, and found no differences in relative and in absolute cell numbers between Ppic−/− and Ppic+/+ (Fig. 2A and B). Detailing the HSC compartment further for long‐term HSC (LT‐HSC), short‐term HSC (ST‐HSC), as well as multipotent progenitors 2 to 4 (MPP2‐MPP4), showed no differences in relative (Fig. 2C‐E) and absolute cell numbers (Fig. 2F) between Ppic−/− and Ppic+/+ . Next, we assessed common myeloid progenitors (CMP), granulocyte‐monocyte progenitors (GMP) and megakaryocyte‐erythrocyte progenitors (MEP), and found that none differed between Ppic−/− and Ppic+/+ mice in relative or absolute cell numbers (Fig. 2G and H). This was in line with no detectable differences in erythrocytes (Supporting information Fig. S1A) or platelets (Supporting information Fig. 1B) in the blood of adult mice. In addition, no differences were found between Ppic−/− and Ppic+/+ in several myeloid lineages in the spleen, namely macrophages (Supporting information Fig. S2A and B), neutrophils (Supporting information Fig. S2C and D), conventional Dendritic Cells (DCs) (Supporting information Fig. S2E and F), and plasmacytoid DCs (Supporting information Fig. S2G and H). Finally, we assessed and quantified common lymphoid progenitors (CLP) and also detected no differences in the Ppic−/− BM (Fig. 2I and J). Altogether, these data indicate that Ppic deficiency does not impact on the numbers of the BM progenitors tested, and is dispensable for circulating erythrocytes and platelets, as well as myeloid lineages in the spleen at steady state.
Figure 2.

Ppic deficiency does not affect the hematopoietic progenitors in the BM. The BM of age‐ and gender‐matched Ppic+/+ and Ppic−/− mice were analyzed by flow cytometry. (A) Shown are FACS plots of the gate used for LSK in live lineage‐negative cells. (B) Quantification of the absolute cell numbers in (A). (C) FACS plots of LSK‐gated cells, as in (A), defining: hematopoietic stem cells (HSC), further analyzed in (D), multipotent progenitors (MPP) 2, and MPP3‐4, further detailed in (E) (from left to right and top to bottom). (D) HSC were further gated to distinguish long‐term HSC (LT‐HSC, left gate) and short‐term HSC (ST‐HSC, right gate). (E) MPP3‐4 in (C) were further gated to distinguish MPP3 (top gate) and MPP4 (bottom gate). (F) Quantification of the absolute number of cells in (C), (D), and (E). (G) Cells shown were gated on Lineage‐negative, Kit‐positive, Sca1‐negative, CD127‐negative, and gates correspond to MEP, GMP, and CMP (left to right and top to bottom). (H) Quantification of the absolute cell numbers in (G). (I) FACS plots of the gate used for CLP, showing cells gated on lineage‐negative cells. (J) Quantification of the absolute cell numbers in (H). Numbers above the gates represent mean ± SD of the percentages of the corresponding gate in one representative experiment (A, C, D, E, G, I). In the graphs depicting the quantification of absolute numbers, cells were normalized to 105 live BM cells. Each symbol represents one mouse and the horizontal line is the mean (B, F, H, J). Data shown are from one representative experiment of a total of three independent experiments, each with a minimum n = 3 mice per group. Mann–Whitney U test revealed no statistical difference.
Ppic‐deficient mice have an increase in transitional T1 and T2 B cells in the spleen
To address B lymphocytes, we analyzed the early stages of differentiation and found no differences between Ppic−/− and Ppic+/+ mice from the pre‐proB through the immature B lymphocytes in the BM (Fig. 3A). In the spleen, an increase in the number of immature transitional T1 and T2 was detected (Fig. 3B). Nevertheless, no phenotype was found in other B cell subsets, including T3 (Fig. 3B), follicular, marginal zone, and B1‐mature B lymphocytes (Fig. 3C), or circulating mature B lymphocytes in the BM (Fig. 3A). Taken together, the data suggest that Ppic might play a role in the migration of the immature B cells from the BM to the spleen, or in the generation of T1 transitional B cells, but this phenotype is compensated during differentiation in the spleen and mature B cells were not affected in numbers in the Ppic‐deficient mice.
Figure 3.

Ppic−/− mice have an increase in immature transitional T1 and T2 B cells in the spleen. (A) The BM of Ppic +/+ and Ppic −/− mice were analyzed for the indicated cell populations, and cell numbers were normalized for 105 total live BM cells. (B) Shown is the cell number of the indicated subpopulations in the spleen. (C) Cell number of the indicated mature B‐cell subsets in the spleen. Each symbol represents one mouse and the horizontal line is the mean. Data are from one representative of a total of three independent experiments, each with a minimum n = 3 mice per group. *p < 0.05 Mann–Whitney U test.
Ppic deficiency has no influence on αβ T lymphocyte differentiation
To test whether Ppic is involved in αβ T lymphocyte differentiation in the thymus, we analyzed Ppic‐deficient thymocytes. The main thymocyte populations can be defined based on the expression of CD4 and CD8. The most immature thymocytes lack the expression of both CD4 and CD8, and hence, are termed double negative (DN). DN differentiate into CD4+CD8+ double‐positive (DP) thymocytes, which finally downregulate either CD4 or CD8 to commit to the CD8 or CD4 T cell lineages, respectively. Ppic‐deficient thymocytes did not differ from the controls in percentage (Fig. 4A) or absolute cell numbers at the DP and single‐positive stages of differentiation (Fig. 4B). Double‐negative thymocytes can be further detailed by gating on CD3‐negative precursors and discriminated with basis on the differential expression of CD25, CD44, and Kit. No difference was detected in the immature subsets of differentiating T cell precursors, from the most immature early T‐lineage progenitor (ETP, Kit+CD44+CD25−), through DN2 (Kit+/loCD44+CD25+), DN3 (Kit−CD44−CD25+), and DN4 (Kit−CD44−CD25−) in relative and absolute cell numbers (Fig. 4C and D). These results were consistent with the absence of phenotype in Ppic‐deficient embryos (E17.5) and newborn mice (Supporting information Fig. S3A‐D). Next, we tested whether Ppic deficiency could impact cell competition in the thymus. Cell competition occurs between thymocytes included in the DN2 and DN3 stages that differ in time of thymus residency [14]. For that purpose, we transplanted WT newborn thymi into Ppic−/− or Ppic+/+ recipients and compared the kinetic of thymus turnover in the two types of thymus grafts (Supporting information Fig. S4A). No difference was detected between Ppic−/− or Ppic+/+ thymocytes of host origin, excluding Ppic from a functional role in cell competition (Supporting information Fig. S4B and C). Consistent with the absence of phenotype in the thymus, αβ T lymphocytes were also similar between the spleen of Ppic−/− and Ppic+/+ mice, with CD4 and CD8 T lymphocytes virtually identical for relative and absolute cell numbers (Fig. 4E and F), and a normal CD4 to CD8 ratio (Fig. 4G). Similarly, Foxp3‐expressing regulatory T cells were not affected in relative or absolute cell number in the thymus (Supporting information Fig. S5A and B), or the spleen (Supporting information Fig. S5C and D). Finally, we performed competitive BM chimeras in which either Ppic−/− or Ppic+/+ BM was mixed at 1:1 proportions with WT congenic BM and transferred into irradiated F1(B6xB6.SJL) recipients. In agreement with the data from the steady‐state analyses, no differences were found in the engraftment capacity of Ppic−/− or Ppic+/+ cells, or in the hematopoietic capacity for generating all cell lineages assessed, as measured by the normalized ratio of Ppic−/− or Ppic+/+ to the competitor BM (Supporting information Fig. S6A) or in absolute cell numbers (Supporting information Fig. S6B). These analyses show that Ppic deficiency does not affect αβT cell development or homeostasis in the steady state.
Figure 4.

αβ Tcell development is unaffected in Ppic− / − mice. (A) Thymοcytes of age‐ and gender‐matched Ppic+/+ and Ppic−/− mice were analyzed by flow cytometry for the indicated markers. (B) Absolute cell numbers were quantified for CD4+CD8+ double positive (DP), CD8 single positive (CD8SP), and CD4 single positive (CD4SP) gated as in (A). (C) CD4−CD8− double‐negative thymocytes in (A) were further gated as CD3‐negative and analyzed for the indicated markers. Gates from top left to bottom right identify early thymus progenitors (ETP), the double‐negative 2 (DN2), and the double‐negative 3 (DN3) thymocytes. (D) Quantification of the absolute number of cells in (C), as well as DN4 (CD117−CD25−CD44−). (E) The spleen of the same animals was analyzed and shown are representative histograms of live cells, showing the identification of αβ T lymphocytes (top), further gated (below) as CD4 and CD8 T lymphocytes. (F) Quantification of the absolute cell numbers in (E). (G) Ratio of CD4 to CD8 T lymphocytes in the spleen. Numbers in the FACS plots are the mean ± SD of the percentage of the populations gated in one representative experiment (A, C, E). Each symbol represents one mouse and the horizontal line is the mean (B, D, F, G). Data are from one representative of a total of six independent experiments each with a minimum n = 3 mice per group. Mann–Whitney U test revealed no statistical differences.
Ppic deficiency has no influence on γδ T lymphocyte differentiation
γδT lymphocytes also differentiate in the thymus and diverge from the αβ T cell lineage at an early stage of differentiation. We found that γδ T lymphocytes were present in the Ppic−/− and Ppic+/+ thymi in identical percentages (Fig. 5A) and absolute numbers (Fig. 5B). γδ T lymphocyte differentiation can be detailed with basis on the expression of CD25 and CD27 [15] (Fig. 5C). No differences were found in the most immature CD25+CD27+ precursors, the IFN‐γ producing CD27+, or the IL 17 producing CD27− subsets (Fig. 5C and D). Similar results were observed in the embryo at E17.5 and in newborn thymi (Supporting information Fig. S7A‐D). Further, the T cell receptor repertoire was not obviously altered, as assessed with basis on the expression of the most prevalent Vγ chains in the embryo, in the newborn (Supporting information Fig. S7E and F), or the adult thymus (Fig. 5E and F). Likewise, no differences were found in the spleen of adult mice in percentage or absolute number (Fig. 5G and H) of γδ T lymphocytes, or differential usage of Vγ chains (Fig. 5I and J). Taken together, Ppic deficiency did not affect γδ T lymphocyte differentiation or homeostasis in the steady state.
Figure 5.
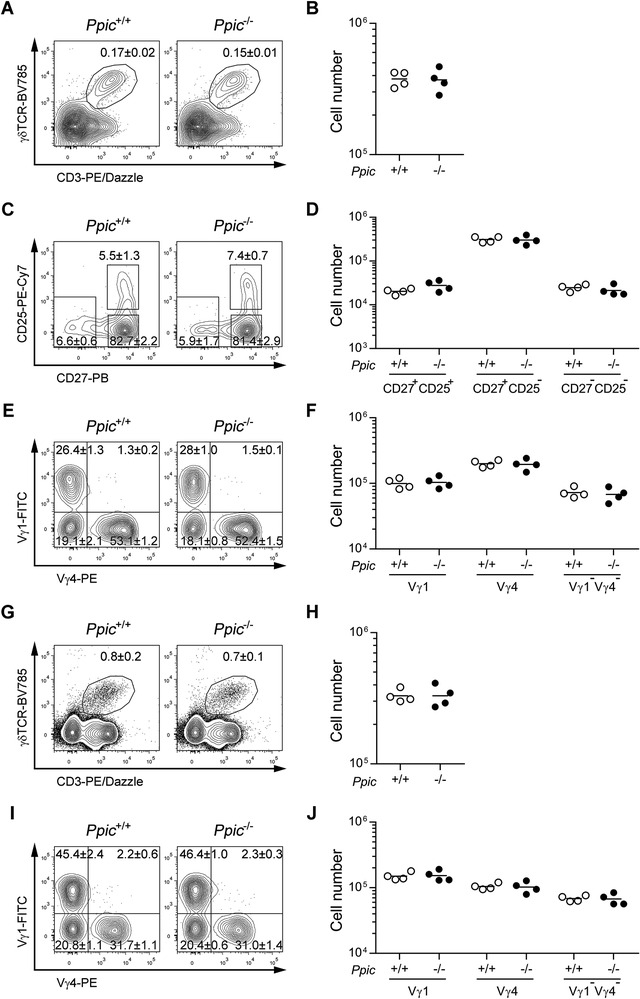
γδ Tcell development is unaffected in Ppic− / − mice. Thymocytes of age‐ and gender‐matched Ppic+/+ and Ppic−/− mice were analyzed by flow cytometry (A‐F). (A) Representative FACS plots of the gate used for defining γδ T lymphocytes, depicting cells gated on CD4‐CD8‐ double negative. (B) Quantification of the absolute cell numbers in (A). (C) γδ T lymphocytes gated in (A) were further gated as shown for the distinction of differentiation stages. (D) Quantification of the absolute number of cells gated in (C). (E) γδ T lymphocytes gated in (A) were further gated as shown for the expression of the Vγ distribution. (F) Quantification of the absolute cell numbers in (E). Splenocytes of the same mice were analyzed (G‐J). (G) Representative FACS plots of the gate used for defining γδ T lymphocytes, depicting cells gated on live cells. (H) Quantification of the absolute number of cells gated in (G). (I) γδ T lymphocytes gated in (G) were further gated as shown for the expression of the Vγ distribution. (J) Quantification of the absolute cell numbers as gated in (I). Values in the FACS plots are the mean ± SD of the percentages of the populations gated in one representative experiment (A, C, E, G, I). Each symbol represents one mouse and the horizontal line is the mean (B, D, F, H, J). Data are from one representative of a total of three independent experiments each with a minimum n = 3 mice per group. Mann–Whitney U test revealed no statistical differences.
Ppic deficiency leads to a reduction in iNKT cells
Last, we assessed if Ppic could be involved in iNKT cell differentiation and/or maintenance at the periphery. iNKT cells are a particular subset of αβ T lymphocytes that display properties of classical CD4 and CD8 αβ T lymphocytes and NK cells. They are termed invariant due to a reduced Vα and Vβ TCR chain segment utilization and they divert from the classical αβ T cell lineage when the αβ TCR from thymocytes at the DP stage interact with glycolipid loaded nonclassical MHC molecule CD1d presented by other DP cells. These thymocytes then downregulate CD8 and present high expression of CD24 and CD69, with low levels of CD44 (Stage 0), and will then be on the iNKT developmental pathway. At this early stage, iNKT cell precursors will undergo further TCR stimulation and differentiate into iNKT cells that are exported to the periphery [16]. Focusing first on the thymus, we found that iNKT cells were reduced among thymocytes of Ppic−/− mice (Fig. 6A and B). This reduction was due to a decrease in the later stages of differentiation, S2 (CD44hiNK1.1−) and S3 (CD44+NK1.1+), while the earlier stages S0/S1 (CD44−/loNK1.1‐) were comparable to those of WT control mice (Fig. 6C and D). A similar decrease of iNKT cells was observed at the periphery (Fig. 6E and F), consequence of a reduction in total numbers of NK1.1+ subpopulations (Fig. 6G and H). These data show that Ppic has a role in the differentiation of iNKT, which is maintained at the periphery in the steady state.
Figure 6.
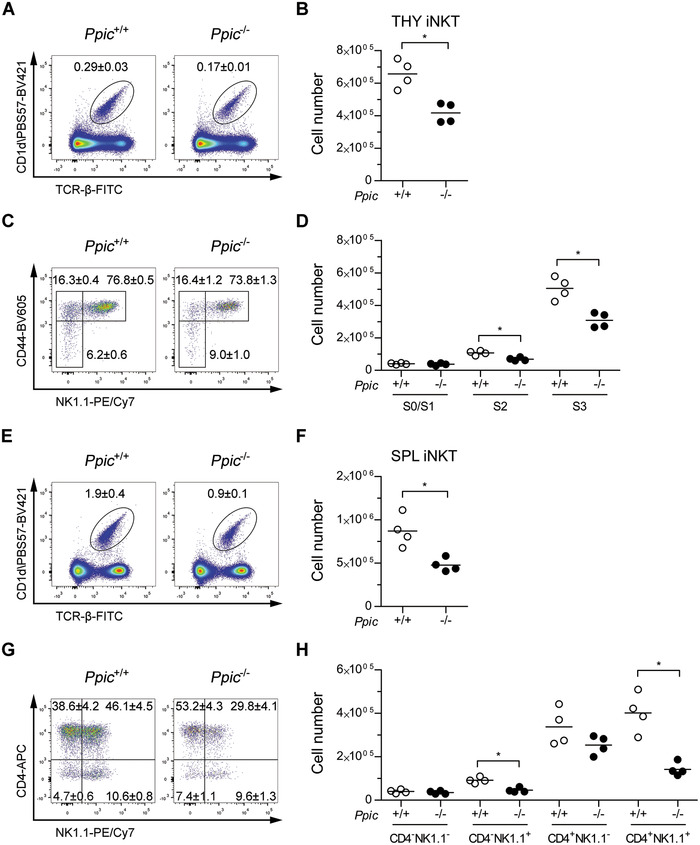
iNKT cell differentiation is impaired in Ppic‐deficient mice, and the phenotype persists in the spleen. Thymocytes of age‐ and gender‐matched Ppic+/+ and Ppic−/− mice were analyzed by flow cytometry to assess iNKT cell development (A‐D). (A) Representative FACS plots of the gate used for defining iNKT cells, depicting live thymocytes and identifying PBS57‐loaded CD1d tetramers versus TCR‐β. (B) Quantification of the absolute number of cells in (A). (C) iNKT cells in (A) were further analyzed as shown for the distinction of differentiation stages. (D) Quantification of the absolute number of cells gated in (C). Splenocytes of the same mice were analyzed (E‐H). (E) Representative FACS plots of the gate used for defining iNKT cells, depicting live cells. (F) Quantification of the absolute number of cells in (E). (G) iNKT cells gated in (E) were further gated as shown to define functional subsets. (H) Quantification of the absolute number of cells in (G). Values in the FACS plots are the mean ± SD of the gated populations in one representative experiment (A, C, E, G). Each symbol represents one mouse and the horizontal line is the mean (B, D, F, H). Data are from one representative of a total of two independent experiments each with a minimum n = 3 mice per group. *p < 0.05 Mann–Whitney U test.
Discussion
Ppic is expressed by several cell lineages of the hematopoietic system and was previously identified as differentially expressed in thymocytes undergoing cell competition [11]. To functionally address the involvement of Ppic in the immune system, we have generated a Ppic‐deficient mouse line and thoroughly assessed hematopoietic progenitors, as well as several immune cell lineages. Our data show that Ppic is dispensable for the development and homeostasis of most hematoimmune cells. However, in B lymphocyte differentiation, Ppic deficiency caused an increase in immature transitional T1 and T2 that might be explained by a more efficient homing to the spleen or an increased efficiency in generating these stages. While the causes remain to be tested, the phenotype was corrected in mature B lymphocyte subpopulations.
Interestingly, we found one lineage of nonconventional T lymphocytes, the iNKT cells, which were reduced in Ppic‐deficient mice. In the thymus, iNKT cells were reduced from the stages S2 and S3. It will be interesting to test whether these differences are due to an effect of Ppic in proliferation, cell death, or differentiation of iNKT in the thymus. Alternatively, there may be an impact after CD4+CD8+ DP thymocytes are diverted to the iNKT cell lineage that affects the progression of the cells to the S2 and S3 stages.
The reduced numbers of iNKT were maintained in the Ppic‐deficient spleen, suggestive that the cells cannot compensate the differentiation deficiency at the periphery, or that Ppic is also important for the homeostasis of mature iNKT. The reduction of iNKT was most relevant for the subsets expressing NK1.1, and while some degree of plasticity has been observed in iNKT cell subsets [16], previous reports have shown that iNKT classification with respect to CD4 and NK1.1 expression identifies subsets of functionally distinct iNKT subsets (such as iNKT1, iNKT2, iNKT17, and iNKT9 cells [17, 18, 19]). The skewing toward NK1.1− subsets in Ppic−/− mice may, thus, imply an alteration in the functional profile of iNKT cells [16, 17, 18, 19]. It will be interesting to determine if the impact of Ppic deficiency rests mainly in the thymus differentiation process, and the export of an altered subset composition is sufficient to establish an altered peripheral iNKT cell pool, or if it also affects the homeostasis and polarization of iNKT cells at the periphery. Future work will focus on evaluating these potential mechanisms and their molecular basis for the impact of Ppic deficiency in the development and homeostasis of iNK T cells reported in this study as well as its role upon challenges such as infections.
The lack of additional phenotypes in Ppic−/− mice, particularly in the populations with highest Ppic expression might be explained by some redundancy with other Ppic family members. Indeed, the Ppiase family is comprised of eight Ppiase and seven Ppiase‐like proteins in mice, several of which are expressed in the same cell populations expressing Ppic. While the degree of homology at DNA level reaches at best only 50‐65% with other two family members, it will remain to be tested whether there is some degree of functional overlap between proteins of the same family.
Materials and methods
Mice
C57BL/6J (B6, CD45.2, designated here Ppic+/+ ) were bred and kept at the Instituto Gulbenkian de Ciência (IGC) in a colony that is refreshed frequently with mice purchased from Charles River. B6.SJL‐Ptprca Pep3b/BoyJ (CD45.1+, here termed B6.SJL) mice, stock #002014, were purchased from The Jackson Laboratory and kept in a colony at IGC. F1(B6xB6.SJL) (CD45.1+CD45.2+) resulted from the intercross between B6 and B6.SJL parents, and were used at 8‐12 weeks of age. For embryonic stage E17.5 analyses, females and males were joined overnight and checked the next morning. Females that presented vaginal plugs (considered gestation day E0.5) were monitored and embryos collected at E17.5. Newborn thymi were analyzed at the day of birth. All mouse lines were maintained in individually ventilated cages in specific pathogen‐free conditions, and all experiments were conducted in compliance with Portuguese and European laws and approved by the Ethics Committee of the IGC–Fundação Calouste Gulbenkian and the Direção Geral de Alimentação e Veterinária (DGAV).
Generation of Ppic−/− mouse line
The Ppic mutant allele was generated through a CRISPR/Cas9‐mediated disruption of the gene. One gRNA was used to target exon 1 of Ppic immediately downstream of the ATG, corresponding to the sequence 5′‐CCACCGCGCACCATGAGCCC‐3′ in exon 1, which is followed by a protospacer‐adjacent motif sequence. The gRNA sequence was verified and gives no predicted off targets, even if considering 1 or 2 mismatches. The gRNA was generated by transcription from the gRNA‐pUTB7 plasmid. This plasmid was built by hybridizing oligonucleotides F:5′‐AGGGCCACCGCGCACCATGAGCCC‐3′ and R:5′‐AAACGGGCTCATGGTGCGCGGTGG‐3′ to generate a ds DNA fragment that leaves AGGG and TTTG overhangs to allow directional cloning into the BbsI sites of the gRNA basic plasmid [20]. After sequence confirmation, the gRNA was linearized with FspI and transcribed with T7 RNA polymerase using the MEGAshortscriptTM kit (Ambion) according to the manufacturer's protocol. The DNA template was then digested with DNaseI and the gRNA purified with the MEGAclearTM RNA purification kit (Ambion). The Cas9 protein was a gift from Juan Galcerán (Instituto de Neurociencias CSIC‐UMH, Alicante, Spain) to M Mallo at the Transgenics Unit of the IGC. To generate the Ppic mutant mice, a mix containing the gRNA (10 ng/μL), Cas9 protein (100 ng/μL), and the replacement oligo (10 ng/μL) in 10 mM Tris‐HCl pH7.5; 0.1 mM EDTA, was introduced into fertilized B6 mouse oocytes, at single‐cell stage, by pronuclear microinjection at the Transgenics Unit of the IGC. Although a homologous recombination approach had been chosen, in which a donor sequence was coinjected with the objective of inserting three stop codons at the targeted site, no insertion of the donor sequence occurred. Identification of the recombinant allele in the resulting pups was done by PCR on genomic DNA purified from tail biopsies using primers flanking the targeted region (F:5′‐CCCGGATCCACCACTCTC‐3′; R: 5′‐GAGCCCTTGCTCTTCAGC‐3′ which originates a band of 311 bp for the WT allele. Mice for which the PCR product displayed a shift in size were further Sanger sequenced. From two initial founders, founder 8 displayed a modification that originates a scrambled (+1 frameshift) and truncated protein. Once the mutant sequence was determined, new primers were designed that only anneal with the sequences in the WT (R: 5′‐GGACCCGGGCTCATGGTG‐3′) or in the mutant genome (mutant R: 5′‐AGACGGGGACCCGGGTCT‐3′). The selected founder was backcrossed to B6 for two generations and heterozygotes intercrossed to generate the Ppic−/− mouse line.
Thymus transplants
Thymus transplants were performed as previously [14, 21, 22]. Briefly, thymi were harvested from WT newborn F1(B6xB6.SJL) donor mice (CD45.1+CD45.2+), Ppic+/+ or Ppic−/− (CD45.2+). Hosts were anesthetized with ketamine (100 mg/kg) and xylazine (16 mg/kg), the kidney exposed, and the thymus lobes transplanted separately under the kidney capsule, one on each end of the kidney. The kidney was then put back into the peritoneal cavity and the incision sutured and stapled closed. Hosts received saline subcutaneously in the scruff and allowed to recover in a heated pad. Mice were monitored in the following day and transplants analyzed at the determined time points post‐transplant.
Flow cytometry
Single‐cell suspensions from BM, thymus, and spleen were prepared in PBS/10% FBS (PBS/FBS). Single‐cell suspensions from BM were prepared by flushing one tibia and femur per mouse. Cell densities were determined using a hemocytometer with trypan blue staining used to exclude dead cells. For staining, all samples were first stained with Zombie‐aqua (Biolegend #423102) or LIVE/DEAD Fixable Near‐IR (Invitrogen) according to the manufacturer's instructions. Blocking was done with mouse IgG (Jackson ImmunoResearch Europe #015‐000‐003) followed by staining with the appropriate combination of the following antibodies purchased from BioLegend, unless otherwise stated: Ter119‐biotin (TER‐119, #116204); CD11b‐biotin (M1/70, 101204); CD11c‐biotin (N418, #117304); CD19‐biotin (6D5, #115504); CD4‐biotin (GK1.5, #100404); CD8‐biotin (53‐6.7, #100704); CD3‐biotin (145‐2C11, #100304); Gr‐1‐biotin (RB6‐8C5, #108404); NK1.1‐biotin (PK136, #108704); CD117‐APC (2B8, #105812); Sca1‐PerCP/Cy5.5 (D7, #108124); CD127‐PE/Cy7 (A7R34, #135014); CD4‐PE/Cy7 (GK1.5, #100422); CD8‐FITC (YTS169.8, in‐house); CD25‐BV605 (PC61, #102036); NK1.1‐PE (PK136, #108708); CD19‐PE/Cy7 (6D5, #115520); CD3‐APC/Cy7 (145‐2C11, #100330); CD4‐BV605 (GK1.5, #100451); CD8‐PerCP/Cy5.5 (53‐6.7, #100734); CD45.1‐FITC (A20, #110706); CD45.2‐PB (104, #109820); CD8‐BV711 (53‐6.7, #100748); CD3‐PE/Dazzle594 (17A2, #100245); CD27‐PB (LG.3A10, #124217); CD25‐PE/Cy7 (PC61, #102016); TCRγ1.1‐FITC (2_11, #141104); TCRγ2‐PE (UC3‐10A6, #137706); TCRγδ‐bio (GL3, #118103); CD44‐PerCP/Cy5.5 (IM7, #103032); CD117 APC/Cy7 (2B8, #105826); CD8‐BV711 (53‐6.7, #100748); NK1.1‐BV605 (PK136, #108740); CD4‐APC (RM4‐5, BD Pharmingen #553051); CD25‐PE (PC61, #102008); CD8‐APC (53‐6.7, #100712); CD4‐FITC (GK1.5, in house); Foxp3‐eFluor 450 (FJK‐16S, eBioscience, # 48‐5773‐82); CD19‐BV711 (6D5, #115555); IgD‐PerCP/Cy5.5 (11‐26c.2a, #405710); CD43‐PE/Cy7 (S11, #143210); IgM‐BV421 (RMM‐1, #406518); CD21/35‐FITC (7G6, BD Pharmingen, #553818); CD23‐PE (B3B4, eBioscience, #12‐0232‐83); CD93‐APC (AA4.1, eBioscience, #17‐5892‐83); Gr‐1‐APC (RB6‐8C5, #108412); CD317‐FITC (927, #127008); B220‐PerCP/Cy5.5 (RA36B2, #103236); F4/80‐BV421 (BM8, #123131); CD11c‐BV711 (N418, #117349); CD11b‐BV785 (M1/70, #101243); MHC‐II‐BV605 (M5/114.15.2, #107639); CD24‐BV510 (M1/69, #101831); CD44‐BV605 (IM7, #103047); TCRβ‐FITC (H57‐597, eBioscience, #11‐5961‐82); CD19‐PerCP/Cy5.5 (ebio1D3, eBioscience, #45‐0193‐82); NK1.1‐PE/Cy7 (PK136, eBioscience, #25‐5941‐82); CD4‐APC (GK1.5, eBioscience, #17‐0041‐82); CD1d tetramer loaded with PBS57 and coupled to BV421 (NIH tetramer Core Facility); CD16/32‐PE (93, #101307); CD135‐APC (A2F10, #135310); CD150‐BV605 (TC15‐12F12.2, #115927); CD48‐BV785 (HM48‐1, #103449); CD34‐BV421 (SA376A4, #152208); CD19‐PerCP/Cy5.5 (6D5, #115534); B220‐PE (RA36B2, BD, #553090); CD93‐FITC (AA4.1, #136508); CD24‐APC (30F1, #138506). For stainings with biotinylated antibodies, a secondary step of incubation with streptavidin‐BV785 (#405249), streptavidin‐APC/Cy7 (#405208), or streptavidin‐BV711 (#405241) was done. Each antibody staining step was performed in PBS/FBS for 30 min on ice. For Foxp3 intracellular detection, the True‐NuclearTM Transcription factor buffer set (Biolegend, #424401) was used according to the supplier's instructions. Briefly, cells were surface stained and then incubated in 1× fix buffer for 45‐60 min. After washing the cells in 1× perm buffer, the Foxp3 antibody was added diluted in 1× perm buffer and incubated at room temperature for 30 min. A final wash in 1× perm buffer was performed and the cells resuspended in PBS for FACS acquisition. FACS acquisition was performed on an LSRFortessa X‐20 (Becton Dickinson) controlled through BD FACSDiva software (BD biosciences). FACS data were analyzed using FlowJo (FlowJo, LLC). Cell number and other calculations were performed in Excel (Microsoft) and plotted using Prism (Graphpad software). For identifying each cellular subset, all populations were first gated in a lymphocyte gate in FSC versus SSC, followed by doublet exclusion and dead cells were excluded using a viability die. Specific populations were identified as follows: Lineage−: Ter119−CD11b−CD11c−CD19−CD4−CD8−CD3−Gr‐1−NK1.1−; LSK: Sca‐1+c‐Kit+Lin−; LK: Sca‐1−c‐Kit+Lin−; HSC: CD150+CD48−Sca‐1+c‐Kit+Lin−; LT‐HSC: CD34−CD150+CD48−Sca‐1+c‐Kit+Lin−; ST‐HSC: CD34+CD150+CD48−Sca‐1+c‐Kit+Lin−; MPP2: CD150+CD48+Sca‐1+c‐Kit+Lin−; MPP3: CD135lo/−CD150−CD48+ Sca‐1+c‐Kit+Lin−; MPP4: CD135hiCD150−CD48+Sca‐1+c‐Kit+Lin−; myeloid progenitors: CD127−Sca‐1−c‐Kit+Lin−; CMP: CD34+CD16/32− CD127−Sca‐1−c‐Kit+Lin−; GMP: CD34+CD16/32+CD127−Sca‐1−c‐Kit+Lin−; MEP: CD34−CD16/32−CD127−Sca‐1−c‐Kit+Lin−; CLP: CD127+CD135+Lin−; Pre‐proB: B220+CD43+CD19−CD24−; proB: B220+CD43+CD19+CD24+; early preB: B220+CD43+CD19+CD24hi; late preB: B220loCD43−IgM−; immature B: B220hiCD43−IgM+CD93+; mature B: B220hiCD43−IgM+CD93−; transitional B T1: CD19+CD93+CD23−IgM+IgD−/lo; transitional B T2: CD19+CD93+CD23+IgM+IgD−/lo; transitional B T3: CD19+CD93+CD23+IgM−/loIgD+; Follicular B cells: CD19+CD93−CD23+CD43−IgM−/loIgD+; Marginal zone B cells: CD19+CD93−CD23−CD21/35hiCD43−IgM+IgD−/lo; B1 B cells: CD19+CD93−CD23−CD21/35−CD43+IgM+IgD−/lo; DP: CD4+CD8+; CD8SP: CD4−CD8+CD3+; CD4SP: CD4+CD8−; ISP: CD4−CD8+CD3−; DN: CD4−CD8−; TN: CD4−CD8−CD3−; ETP: c‐Kit+CD25−CD44+CD4−CD8−CD3−; DN2: CD25+CD44+CD4−CD8−CD3−; DN2a: c‐Kit+CD25+CD44+CD4−CD8−CD3−; DN2b: c‐Kit−/loCD25+CD44+CD4−CD8−CD3−; DN3: CD25+CD44−CD4−CD8−CD3−; DN4: CD25−CD44−CD4−CD8−CD3−; total CD3: CD3+; CD4 T: CD4+CD8−CD3+CD19−CD11b−NK1.1−; CD8 T: CD4−CD8+CD3+CD19−CD11b−NK1.1−; γδT cells: γδTCR+CD3+CD4−CD8−; CD25+CD27+ γδT: CD25+CD27+ γδTCR+CD3+CD4−CD8−; CD25−CD27+ γδT: CD25−CD27+ γδTCR+CD3+CD4−CD8−; Vγ1 γδT: Vγ1+Vγ4− γδTCR+CD3+CD4−CD8−; Vγ4 γδT: Vγ1−Vγ4+ γδTCR+CD3+CD4−CD8−; Vγ1−Vγ4− γδT: Vγ1−Vγ4− γδTCR+CD3+CD4−CD8−; iNKT: TCRβ+CD1d‐PBS57‐tet+; S0/S1 iNKT, CD4−NK1.1−TCRβ+CD1d‐PBS57‐tet+; S2 iNKT, CD4+NK1.1−TCRβ+CD1d‐PBS57‐tet+; S3 iNKT: CD4+NK1.1+TCRβ+CD1d‐PBS57‐tet+; CD4+NK1.1+ iNKT: CD4+NK1.1+TCRβ+CD1d‐PBS57‐tet+; CD4+NK11− iNKT: CD4+NK1.1+TCRβ+CD1d‐PBS57‐tet+; CD4−NK11− iNKT: CD4−NK11−TCRβ+CD1d‐PBS57‐tet+; Macrophages: CD11b+F4/80+CD19−; Neutrophils: CD11b+Gr‐1+F4/80−CD19−; Conventional DC: CD11c+MHC‐IIhiCD317−CD19−; Plasmacytoid DC, CD11c+MHC‐II+CD317+B220intCD19−; NK cells: NK1.1+CD3−CD19−; B cells (in BM chimeras): CD19+; CD11b: CD11b+NK1.1−CD19−; in the experiments of thymus transplants, a CD45.1+CD45.2+ gate to identify donor origin and CD45.1−CD45.2+ to identify host origin; in the experiments of BM chimeras competitor origin was determined by gating on CD45.1+CD45.2− and test origin by gating on CD45.1−CD45.2+. The flow cytometry work here presented is in accordance with the guidelines for the use of flow cytometry and cell sorting in immunological studies [23].
Bone marrow chimeras
F1(B6xB6.SJL) mice aged 8‐ to 12‐week old were 7Gy‐irradiated and used as recipients for BM cells in the next day. Donor cell suspensions were prepared from femurs and tibias, followed by lineage depletion using biotin‐binder Dynabeads (Invitrogen #11047) according to the manufacturer's recommendations. Irradiated mice received 1 × 10⁶ lineage‐negative enriched BM cells consisting of Ppic+/+ or Ppic−/− (CD45.2+) cells mixed at a ratio of 1:1 with CD45.1+ cells in 100 μL sterile PBS i.v. Recipient mice were analyzed 8 weeks later. Similar results were obtained in an independent experiment using 6 × 10⁶ unfractioned donor BM cells.
Statistical analysis
Data were tested for statistical significance using Mann–Whitney U test in Prism version 7.01 (Graphpad, software).
Conflict of interest
The authors declare no commercial or financial conflict of interest.
Author contributions
RSP designed and performed experiments, analyzed data, and wrote the manuscript; CVR and SRA designed, performed experiments, and analyzed data, CA generated the Ppic‐deficient mice, APB performed and LG overviewed the studies addressing iNKT cells at steady state, and VCM conceived the study, designed research and experiments, and wrote the manuscript. All authors edited and contributed to the final version of the manuscript.
Ethics approval statement
All experiments were conducted in compliance with Portuguese and European laws and approved by the Ethics Committee of the IGC–Fundação Calouste Gulbenkian and the DGAV.
Peer review
The peer review history for this article is available at https://publons.com/publon/10.1002/eji.202048924.
Abbreviations
- CsA
cyclosporine A
- CLP
common lymphoid progenitors
- CMP
common myeloid progenitors
- DN
double negative
- DP
double positive ; ETP, early thymic progenitor
- GMP
granulocyte‐monocyte progenitors
- gRNA
guide RNA
- iNKT
invariant natural killer T cells
- LSK
lineage negative, Sca‐1 positive, Kit positive
- MPP
multipotent progenitors
- MEP
megakaryocyte‐erythrocyte progenitors
- Ppic
peptidyl‐prolyl cis‐trans isomerase C
Supporting information
Supporting Information
Acknowledgments
This work was supported by the Instituto Gulbenkian de Ciência (IGC) of the Calouste Gulbenkian Foundation, and the Portuguese National Research Council (Fundação para a Ciência e Tecnologia [FCT]) Grant PTDC/BIA‐BID/30925/2017 to VCM, that also supports the salary of RSP. VCM is supported by an individual contract awarded by FCT (CEECIND/03106/2018). CVR is a PhD student of the IGC Integrative Biology and Biomedicine (IBB) PhD Program and supported by an individual FCT PhD Fellowship ref. PD/BD/139190/2018. This work had the support of the research infrastructures Congento LISBOA‐01‐0145‐FEDER‐022170 and PPBI‐POCI‐01‐0145‐FEDER‐022122, both cofinanced by FCT and Lisboa2020, under PORTUGAL2020 agreement (European Regional Development Fund). We thank K Serre and B Silva‐Santos for helpful discussion about γδ T cells. We acknowledge D Zannatta, V Correia, D Vale for technical support. We thank the support of M Mallo and the Transgenics Unit, the team of the Animal House Facility, and acknowledge the Flow Cytometry Unit of the IGC.
Data availability statement
Data sharing not applicable to this article as no datasets were generated or analysed during the current study.
The data that support the findings of this study are available from the corresponding author upon reasonable request.
References
- 1.Friedman, J. and Weissman, I., Two cytoplasmic candidates for immunophilin action are revealed by affinity for a new cyclophilin: one in the presence and one in the absence of CsA. Cell 1991. 66: 799–806. [DOI] [PubMed] [Google Scholar]
- 2.Otsuka, M., Terada, Y., Yang, T., Nonoguchi, H., Tomita, K. and Marumo, F., Localization of cyclophilin A and cyclophilin C mRNA in murine kidney using RT‐PCR. Kidney Int. 1994. 45: 1340–1345. [DOI] [PubMed] [Google Scholar]
- 3.Friedman, J., Weissman, I., Friedman, J. and Alpert, S., An analysis of the expression of cyclophilin C reveals tissue restriction and an intriguing pattern in the mouse kidney. Am. J. Pathol. 1994. 144: 1247–1256. [PMC free article] [PubMed] [Google Scholar]
- 4.Bram, R. J., Hung, D. T., Martin, P. K., Schreiber, S. L. and Crabtree, G. R., Identification of the immunophilins capable of mediating inhibition of signal transduction by cyclosporin A and FK506: roles of calcineurin binding and cellular location. Mol. Cell. Biol. 1993. 13: 4760–4769. [DOI] [PMC free article] [PubMed] [Google Scholar]
- 5.Stocki, P., Chapman, D. C., Beach, L. A. and Williams, D. B., Depletion of cyclophilins B and C leads to dysregulation of endoplasmic reticulum redox homeostasis. J. Biol. Chem. 2014. 289: 23086–23096. [DOI] [PMC free article] [PubMed] [Google Scholar]
- 6.Montague, J. W., Hughes, F. M. and Cidlowski, J. A., Native recombinant cyclophilins A, B, and C degrade DNA independently of peptidylprolyl cis‐trans‐isomerase activity. Potential roles of cyclophilins in apoptosis. J. Biol. Chem. 1997. 272: 6677–6684. [DOI] [PubMed] [Google Scholar]
- 7.Gao, Y.‐F., Zhu, T., Mao, C.‐X., Liu, Z.‐X., Wang, Z.‐B., Mao, X.‐Y., Li, L. et al. PPIC, EMP3 and CHI3L1 are novel prognostic markers for high grade glioma. Int. J. Mol. Sci. 2016. 17: 1808. [DOI] [PMC free article] [PubMed] [Google Scholar]
- 8.Alfonso, A., Bayón, J., Gegunde, S., Alonso, E., Alvariño, R., Santás‐Álvarez, M., Testa‐Fernández, A. et al., High serum cyclophilin C levels as a risk factor marker for coronary artery disease. Sci. Rep. 2019. 9: 10576. [DOI] [PMC free article] [PubMed] [Google Scholar]
- 9.Shimizu, T., Imai, H., Seki, K., Tomizawa, S., Nakamura, M., Honda, F., Kawahara, N. et al., Cyclophilin C‐associated protein and cyclophilin C mRNA are upregulated in penumbral neurons and microglia after focal cerebral ischemia. J. Cereb. Blood Flow Metab. 2005. 25: 325–337. [DOI] [PubMed] [Google Scholar]
- 10.Mi, Z., Oliver, T., Guo, H., Gao, C. and Kuo, P. C., Thrombin‐cleaved COOH(‐) terminal osteopontin peptide binds with cyclophilin C to CD147 in murine breast cancer cells. Cancer Res. 2007. 67: 4088–4097. [DOI] [PubMed] [Google Scholar]
- 11.Martins, V. C., Busch, K., Juraeva, D., Blum, C., Ludwig, C., Rasche, V., Lasitschka, F. et al., Cell competition is a tumour suppressor mechanism in the thymus. Nature 2014. 509: 465–470. [DOI] [PubMed] [Google Scholar]
- 12.Ramos, C. V. and Martins, V. C., Cell competition in hematopoietic cells: Quality control in homeostasis and its role in leukemia. Dev. Biol. 2021. 475: 1–9. [DOI] [PubMed] [Google Scholar]
- 13.Heng, T. S. P, Painter, M. W, Elpek, K., Lukacs‐Kornek, V., Mauermann, N., Turley, S. J, Koller, D. et al., The Immunological Genome Project: networks of gene expression in immune cells. Nat. Immunol. 2008. 9: 1091–1094. [DOI] [PubMed] [Google Scholar]
- 14.Ramos, C. V., Ballesteros‐Arias, L., Silva, J. G., Paiva, R. A., Nogueira, M. F., Carneiro, J., Gjini, E. et al., Cell competition, the kinetics of thymopoiesis, and thymus cellularity are regulated by double‐negative 2 to 3 early thymocytes. Cell Rep. 2020. 32: 107910. [DOI] [PubMed] [Google Scholar]
- 15.Ribot, J. C, Debarros, A., Pang, D. John, Neves, J. F, Peperzak, V., Roberts, S. J, Girardi, M. et al., CD27 is a thymic determinant of the balance between interferon‐gamma‐ and interleukin 17‐producing gammadelta T cell subsets. Nat. Immunol. 2009. 10: 427–436. [DOI] [PMC free article] [PubMed] [Google Scholar]
- 16.Monteiro, M. and Graca, L., iNKT cells: innate lymphocytes with a diverse response. Crit. Rev. Immunol. 2014. 34: 81–90. [DOI] [PubMed] [Google Scholar]
- 17.Lee, Y. J., Holzapfel, K. L, Zhu, J., Jameson, S. C and Hogquist, K. A, Steady‐state production of IL‐4 modulates immunity in mouse strains and is determined by lineage diversity of iNKT cells. Nat. Immunol. 2013. 14: 1146–1154. [DOI] [PMC free article] [PubMed] [Google Scholar]
- 18.Monteiro, M., Agua‐Doce, A., Almeida, C. F., Fonseca‐Pereira, D., Veiga‐Fernandes, H. and Graca, L., IL‐9 expression by invariant NKT cells is not imprinted during thymic development. J. Immunol. 2015. 195: 3463–3471. [DOI] [PubMed] [Google Scholar]
- 19.Coquet, J. M., Chakravarti, S., Kyparissoudis, K., Mcnab, F. W., Pitt, L. A., Mckenzie, B. S., Berzins, S. P. et al., Diverse cytokine production by NKT cell subsets and identification of an IL‐17‐producing CD4‐NK1.1‐ NKT cell population. Proc. Natl. Acad. Sci. U.S.A. 2008. 105: 11287–11292. [DOI] [PMC free article] [PubMed] [Google Scholar]
- 20.Casaca, A., Nóvoa, A., Mallo, M., Hoxb6 can interfere with somitogenesis in the posterior embryo through a mechanism independent of its rib‐promoting activity. Development 2016. 143: 437–448. [DOI] [PubMed] [Google Scholar]
- 21.Ballesteros‐Arias, L., Silva, J. G., Paiva, R. A., Carbonetto, B., Faísca, Pe. and Martins, V. C., T cell acute lymphoblastic leukemia as a consequence of thymus autonomy. J. Immunol. 2019. 202: 1137–1144. [DOI] [PubMed] [Google Scholar]
- 22.Martins, V C., Ruggiero, E, Schlenner, S. M., Madan, V., Schmidt, M., Fink, P. J., Von Kalle, C. et al., Thymus‐autonomous T cell development in the absence of progenitor import. J. Exp. Med. 2012. 209: 1409–1417. [DOI] [PMC free article] [PubMed] [Google Scholar]
- 23.Cossarizza, A., Chang, H.‐D., Radbruch, A., Acs, A., Adam, D., Adam‐Klages, S., Agace, W. W. et al., Guidelines for the use of flow cytometry and cell sorting in immunological studies (second edition). Eur. J. Immunol. 2019. 49: 1457–1973. [DOI] [PMC free article] [PubMed] [Google Scholar]
Associated Data
This section collects any data citations, data availability statements, or supplementary materials included in this article.
Supplementary Materials
Supporting Information
Data Availability Statement
Data sharing not applicable to this article as no datasets were generated or analysed during the current study.
The data that support the findings of this study are available from the corresponding author upon reasonable request.