

Abstract
Hydrogen peroxide plays an important role as an intermediate and product in the reduction of dioxygen by copper enzymes and mononuclear copper complexes. The copper(II) tris(2‐pyridylmethyl)amine complex (Cu‐tmpa) has been shown to produce H2O2 as an intermediate during the electrochemical 4‐electron reduction of O2. We investigated the electrochemical hydrogen peroxide reduction reaction (HPRR) by Cu‐tmpa in a neutral aqueous solution. The catalytic rate constant of the reaction was shown to be one order of magnitude lower than the reduction of dioxygen. A significant solvent kinetic isotope effect (KIE) of 1.4 to 1.7 was determined for the reduction of H2O2, pointing to a Fenton‐like reaction pathway as the likely catalytic mechanism, involving a single copper site that produces an intermediate copper(II) hydroxo species and a free hydroxyl radical anion in the process.
Keywords: copper, electrocatalysis, hydrogen peroxide, hydroxyl radicals, mechanistic studies
Neutral territory: The electrochemical reduction of hydrogen peroxide was studied in presence of Cu‐tmpa. Our combined mechanistic studies including solvent kinetic isotope effects (KIE), rate orders, and catalytic rate constants show that hydrogen peroxide is most likely activated by copper(I) via a Fenton‐like mechanism wherein hydroxyl radicals are formed.

1. Introduction
The formation, decomposition, and reduction of H2O2 plays an important role in many (bio)chemical processes, such as oxidation reactions,[1] fuel cells chemistry,[2] and enzymatic reactions. Many peroxidases and catalases scavenge and disproportionate H2O2 into O2 and H2O to prevent formation of reactive oxygen species (ROS) that induce damage to their hosts.[3] In the context of elucidating the oxidative catalytic reactions taking place at the active sites of these enzymes, often containing copper, iron, or manganese ions, many synthetic mimic catalysts have been synthesized and studied intensively.[4]
Of particular interest are lytic polysaccharide monooxygenases (LPMOs), a family of copper‐containing enzymes that are able to degrade lignocellulosic biomass.[5] Over the last decade, since the discovery of the LPMO family of enzymes, significant scientific effort has been put into the determination of the structure and active site of LPMOs. It was revealed that all LPMOs contain a type II copper centre as their active site in a CuII resting state, with little variation in the primary coordination sphere for the different LPMOs.[5c, 6] The primary coordination sphere is formed by the coordination of three N ligands in a T‐shaped geometry around the copper centre, with the primary coordination sphere conforming to a trigonal‐bipyramidal geometry. The N ligands comprise a monodentate histidine and a bidentate histidine, coordinating with both the imidazole and backbone nitrogen coordinating to the copper centre, the so‐called histidine brace. Polysaccharides are cleaved by LPMOs through an oxidative mechanism, and it was shown that both O2 and H2O2 can act as the oxidant. Additionally, in the absence of polysaccharide substrate, H2O2 is produced by the enzyme in the presence of O2. This behaviour shows similarities to that of single site copper complexes, which can both reduce O2 and H2O2, while also producing H2O2 as a detectable intermediate during catalysis.[7] In this light, we have recently reported, the oxygen reduction reaction mediated by Cu‐tmpa (tmpa=tris(2‐pyridylmethyl)amine), which has a maximum turnover frequency 1.8×10⁶ s−1 for the reduction of dioxygen and involved the formation of H2O2 during the catalytic cycle.[7a] Density functional theory (DFT) calculations of LPMO systems have shown that the most likely catalytic species responsible for the cleavage of polysaccharides is a copper oxyl radical (CuII−O.−) species. Several different routes have been suggested for the catalytic pathway.[8] Fenton chemistry plays an important role in many of these processes, and it has been shown that Fenton‐like reactions can take place between CuI complexes and H2O2, resulting in the homolytic cleavage of the O−O bond.[9]
Another enzyme that shows similarities to both the LPMOs and single site copper complexes, is the particulate methane monooxygenase (pMMO), which activates and reduces dioxygen in order to oxidize methane to methanol. Many conflicting suggestions on the nature of the CuB active site in pMMO have been proposed, which was either considered a mononuclear or dinuclear copper centre,[6, 10] but recent experimental work points towards a catalytic centre containing a mononuclear copper ion in a square‐pyramidal geometry and includes a histidine brace similar to the LPMOs.[11]
How hydrogen peroxide is formed and activated are very important research questions, taking into account potential applications of this chemistry. In traditional polymer electrolyte membrane (PEM) fuel cells, formation of H2O2 is considered undesirable as it leads to both catalyst poisoning and damaging of the proton exchange membrane.[2a, 12] However, more recently hydrogen peroxide has also been suggested as an alternative sustainable fuel or oxidant in fuel cells, owing to the broad range of standard equilibrium potentials associated with H2O2.[2d, 13] Currently, the bulk of H2O2 is synthesized through the anthraquinone process, which uses several different catalysts (Pd or Ni), creates a significant amount of waste products, and requires expensive separation steps in order to obtain concentrated H2O2.[14] As such, despite the use of H2O2 as a sustainable oxidant in many chemical reactions, its production is not sustainable.[1c, 15] An electrochemical synthesis by selective 2‐electron reduction of O2 at low overpotentials would be a more desirable approach to obtain H2O2.
Understanding how hydrogen peroxide is activated and reduced at copper sites is essential for our understanding of single site copper monooxygenases, and in potential the design of new catalysts for the oxygen reduction reaction and the electrochemical production of H2O2. In this study, we report our findings on the electrocatalytic behaviour of Cu‐tmpa towards the hydrogen peroxide reduction reaction (HPRR) under neutral aqueous conditions, showing solvent kinetic isotope effects (KIE), rate orders, and catalytic rate constants. Based on this, we propose a catalytic mechanism for the Cu‐tmpa catalysed HPRR.
2. Results and Discussion
2.1. Electrocatalytic Reduction of Hydrogen Peroxide by Cu‐tmpa
The electrocatalytic reduction of H2O2 by Cu‐tmpa in a phosphate buffer (PB) solution of pH 7, containing 100 mM phosphate salts (NaH2PO4 and Na2HPO4), was investigated in detail and the results are discussed here. In Figure 1a, a CV measured in the aforementioned solution in the presence of 1.1 mM H2O2 shows a peak‐shaped catalytic wave. The catalytic half‐wave potential (E cat/2) of this catalytic wave is situated at 0.34 V vs. RHE, which is close to the E cat/2 of the ORR at 0.33 V vs. RHE observed under stationary conditions. For both the HPRR and the ORR a catalytic peak potential of 0.26 V was found, which suggests that both ORR and HPRR may be limited by side phenomena such as mass transport limitations. Additionally, a comparison of the CVs of the electrochemical reduction of H2O2 and O2 reveals that the peak catalytic current (i cat ) for the HPRR (30 μA) is less than a third of that of ORR (100 μA), as shown in Figure 1b. While a lower i cat can be an indication of a slower catalytic reaction, this only holds true if the substrate and the catalytic mechanism are the same when comparing CV measurements. This is clearly not the case for the ORR and HPRR, and the large difference in peak catalytic current can be explained by the difference in catalytic electron transfer number n of the reaction and the diffusion coefficient D of the substrate. Thus, considering the different electron transfer number for the ORR (n=4) and the HPRR (n=2), a D O2 of 2×10⁻⁵ cm2 s−1, and a D H2O2 of 0.6–1.4×10⁻⁵ cm2 s−1,[16] an expected ratio between the respective peak catalytic currents (i cat,H2O2 /i cat,O2) can be determined. If the HPRR is limited in H2O2 concentration, as was the case for O2 during the ORR for this catalyst,[7a] and i cat is therefore not only determined by the catalytic rate constant or catalyst concentration, a i cat,H2O2 /i cat,O2 ratio in the range of 0.27 to 0.42 is expected. The i cat,H2O2 /i cat,O2 derived from the CVs in Figure 1b falls within the calculated ratio, indicating that the HPRR is also limited in substrate concentration at 1.1 mM H2O2 and a Cu‐tmpa concentration of 0.3 mM.
Figure 1.
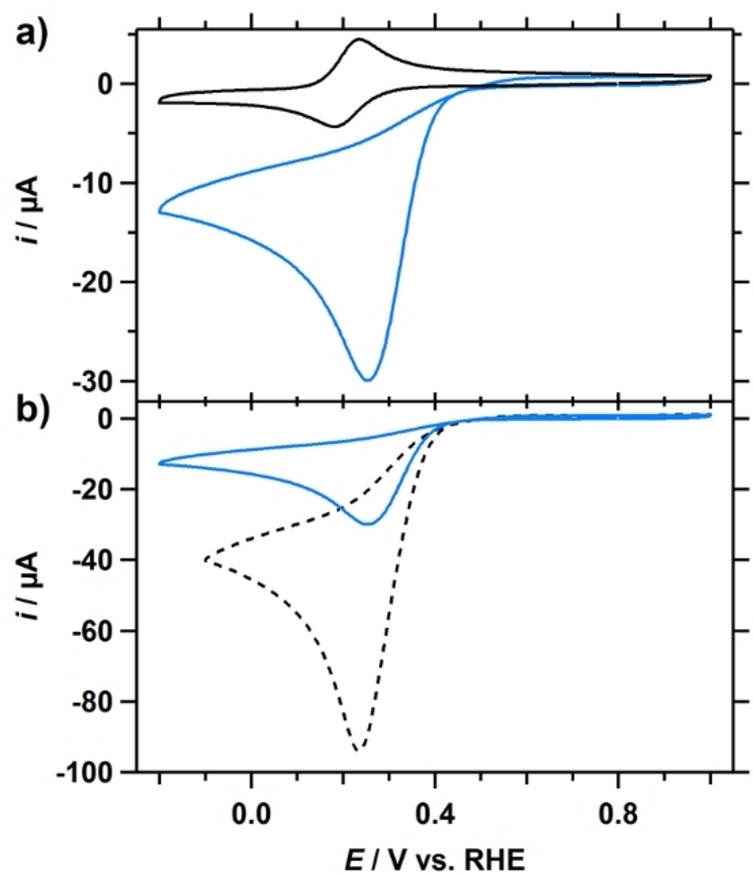
a) CVs of Cu‐tmpa (0.30 mM) in the presence of 1 atm Ar (black) or 1.1 mM H2O2 (blue). E cat/2=0.34 V vs. RHE. b) Comparison of CVs of 1.1 mM H2O2 (blue) and 1 atm O2 (dashed) reduction by Cu‐tmpa (0.30 mM). Conditions: pH 7 PB ([PO4]=100 mM), 293 K, 100 mV s−1 scan rate, 0.0707 cm2 electrode surface area.
2.2. Catalyst Concentration HPRR Dependence
The relationship between the catalytic current and the catalyst concentration was investigated by determining the peak catalytic current at a low catalyst concentration range (1.0–2.5 μM), in the presence of 1.1 mM H2O2. While the GC electrode showed no activity towards the reduction of H2O2, background correction was applied to the CV to remove contributions from the GC double layer with a magnitude of 0.5 to 1 μA. The resulting linear sweep voltammograms (LSV) are shown in Figure 2a. For each Cu‐tmpa concentration, the peak current is visible around 0.23 V vs. RHE, with an E cat/2 at 0.31 V. Both potentials have shifted closer to the redox potential of the catalyst compared to the E cat and E cat/2 observed at high catalyst concentration, which is expected when substrate diffusion limitations play a reduced role during catalysis. For the HPRR, a linear relationship is observed between the i cat and the Cu‐tmpa concentration (Figure 2b), as was also shown for the Cu‐tmpa catalysed ORR.[7a] A plot of log(i cat) as a function of the logarithm of the catalyst concentration has a slope of 1.05 (R2=0.96), confirming the first‐order nature of the catalytic reaction (see Figure S1 in the Supporting Information). Additionally, the same experiment performed at a higher H2O2 concentration of 10 mM over a Cu‐tmpa concentration range from 1 to 10 μM showed the same first‐order dependence in catalyst concentration (see Figure S2).
Figure 2.
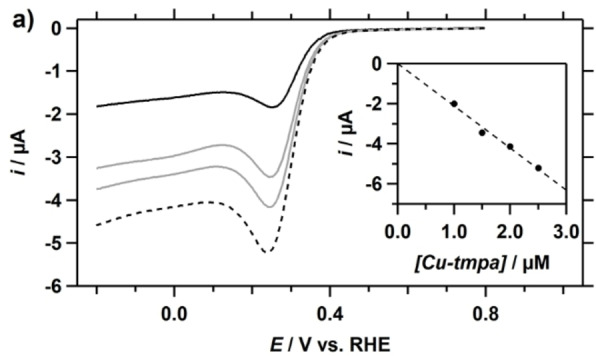
a) Background corrected linear sweep voltammograms (LSV) of the reduction of H2O2 (1.1 mM) for different concentrations of Cu‐tmpa; 1.0 (solid black)/1.5/2.0/2.5 (dashed) μM. Inset: the peak catalytic current i cat measured at 0.23 V vs. RHE plotted against the catalyst concentration. Conditions: pH 7 PB ([PO4]=100 mM), 293 K, 100 mV s−1 scan rate.
2.3. Relationship between Hydrogen Peroxide Concentration and Catalytic Activity
As opposed to O2, it is far more straightforward to increase the concentration of H2O2 in the solution to study the relationship between the substrate concentration and the catalytic reaction. CVs were measured in a PB pH 7 electrolyte solution containing Cu‐tmpa and different H2O2 concentrations ranging from 1.1 to 30 mM. These CVs show the familiar peak shaped catalytic wave around 0.25 V vs. RHE (Figure 3a), but from a H2O2 concentration of 20 mM and upwards a shoulder or second reduction event appears below 0.1 V in the CV, and becomes clearly visible at 30 mM. Expanding the concentration range to 100 mM shows that the peak current of this second catalytic wave steadily increases with the increasing H2O2 concentration, while the peak current of the first catalytic remains the same. Moreover, the potential at which the peak catalytic current of this reduction is reached also shifts more negatively with increasing concentration. Another observation is that an oxidation event appears in the positive potential window above 0.6 V vs. RHE at H2O2 concentrations of 40 mM and higher (Figure S3a). Although this oxidation could be the result of scanning to a lower potential, both the 30 and 40 mM H2O2 measurements have the same potential window, yet this oxidation is only present in the CVs corresponding to the solution containing 40 mM H2O2 and higher. Therefore, it is more likely that the observed oxidation is related to the increased peroxide concentration. The onset of this catalytic oxidation is close to the standard reduction potential for the oxidation of H2O2 to O2 (E0=0.695 V vs. RHE), making the 2‐electron oxidation of H2O2 the most likely candidate for the observed H2O2‐concentration dependent oxidation. The GC electrode is not able to activate H2O2 in neutral solution at these low potentials, as it was only shown to catalyse the oxidation above 1.4 V vs. RHE in a PB pH 7.4 buffer (though at 1.0 mM H2O2),[17] while under basic conditions (>pH 10) oxidation was observed above 0.9 V vs. RHE while rotating (250 mM H2O2).[18] To confirm this, CVs were measured with a GC electrode in a PB pH 7 electrolyte solutions containing H2O2 concentrations ranging from 1.5 to 500 mM (Figure S3b). No anodic currents were observed in the absence of Cu‐tmpa, showing the involvement of the copper complex in apparent oxidation of H2O2.
Figure 3.

CVs of the reduction of H2O2 in the presence of 0.3 mM Cu‐tmpa for a range of H2O2 concentrations under 1 atm Ar; a) 1.1 (blue)/5.0/10/20 (red) mM, b) 30 (blue)40/60/80/100 (red) mM. Conditions: pH 7 PB ([PO4]=100 mM), 293 K, 100 mV s−1 scan rate.
A plot of the peak catalytic current i cat derived from the obtained CVs versus the H2O2 concentration, reveals two different regimes where reduction of dioxygen takes place (Figure 4a). A linear relationship between i cat and the concentration is apparent at low concentrations of H2O2, but above 30 mM the catalytic current of the first reductive wave is no longer dependent on the substrate concentration. When the second catalytic wave at lower potential is considered, it clearly shows that the corresponding i cat,2 still has a mostly linear dependency on H2O2 concentration (Figure 4b), although a slight deviation from an ideal linear relationship is visible at higher concentrations. Although we cannot fully rule out that some disproportionation of peroxide may have occurred under these conditions, these results do show that the reduction reaction of H2O2 to water is both first‐order in H2O2 and Cu‐tmpa.
Figure 4.
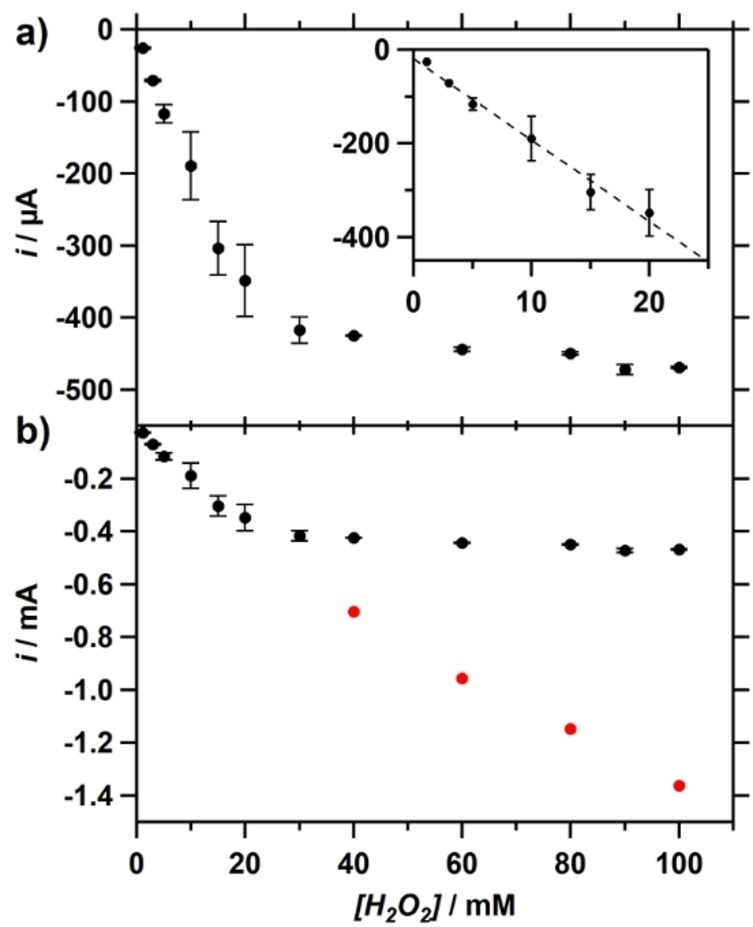
a) Catalytic current as a function of H2O2 concentration in the presence of 0.3 mM Cu‐tmpa, showing a [H2O2] dependent (zoom in inset) and independent regime. b) An expanded view including the i cat values of the 2nd catalytic reduction (red circles). Conditions: pH 7 PB ([PO4]=100 mM), 293 K, 100 mV s−1 scan rate.
The existence of two distinct catalytic waves can be related to the buffer capacity of the electrolyte solution at pH 7. As the hydrogen peroxide concentration is approaching that of the phosphate buffer in the electrolyte solution at these higher concentrations, the buffering ability of the solution can become compromised. This would result in significantly increased pH gradient close to the electrode surface. Thus, the appearance of a second catalytic reduction at a lower potential is likely the result of a shift in proton source for the reduction of H2O2 to H2O, possibly from H2O or even H2O2 itself, as the pKa of hydrogen peroxide is 11.75 in water.[19]
2.4. Kinetic Isotope Effect Studies of the Peroxide Reduction Reaction
To get more insight into the rate‐determining step in the mechanism of the electrocatalytic reduction of H2O2, solvent kinetic isotope effects (KIE) were determined. Cyclic voltammograms were measured in a 0.1 M phosphate buffer (pH 7) solution containing 0.3 mM Cu‐tmpa. Both deuterated and non‐deuterated phosphate buffers contained the same concentration and ratio of phosphate salts (0.1 M). The pH*, defined as the apparent pH directly determined from a H2O calibrated pH meter in a D2O solution, of the deuterated solution was determined to be 7.13. Using Eq. (1) to convert the pH* to the pH,[20] this pH* value corresponds to a pH of 7.03. This agrees well with the pH of 7.01 that was measured for the non‐deuterated electrolyte solution. The pD can in turn be calculated using Eq. (2), resulting in a pD of 7.58.
| (1) |
| (2) |
In the presence of 1 atm argon, and in the absence of hydrogen peroxide, the E 1/2 of the Cu‐tmpa redox couple is positively shifted by 37 mV in the deuterated phosphate buffer compared to the non‐deuterated phosphate buffer (Figure 5a). Saturating the deuterated electrolyte solution in the RHE compartment with H2 instead of D2 is the likely cause of this, the observed potential shift being similar to the difference in equilibrium potential E 0 for the H+/H2 and D+/D2 couples.[21] Upon the addition of 1.1 mM H2O2 to the electrolyte solutions, a clear difference in catalytic rates can be observed between the deuterated and non‐deuterated electrolyte solutions (Figure 5b). As with the redox couple in the absence of substrate, the E cat/2 of the catalytic wave is positively shifted by 37 mV in the deuterated solution. More striking is the decrease of the peak catalytic current i cat in the deuterated solution, from 30 to 20 μA.
Figure 5.

a) CVs of 0.3 mM Cu‐tmpa under 1 atm Ar in a deuterated (solid) and non‐deuterated (dotted) PB electrolyte solution. b) CVs of the catalytic reduction of H2O2 (1.1 mM under 1 atm Ar) by Cu‐tmpa in a deuterated (solid) and non‐deuterated (dotted) PB solution. c) CVs of the catalytic reduction of O2 (1 atm) by Cu‐tmpa (0.3 mM) in a deuterated (solid) and non‐deuterated (dotted) PB solution. Conditions: pH 7 PB ([PO4]=100 mM), 293 K, 100 mV s−1 scan rate.
Conversely, when the catalytic activity of Cu‐tmpa towards the ORR in deuterated PB (pH 7) electrolyte solution in the presence of 1 atm O2 is investigated by cyclic voltammetry (Figure 5c), the catalytic half‐wave potential E cat/2 is again shifted positively by 37 mV. The difference of the i cat between the deuterated solution and the non‐deuterated solution is only 5 μA, which is insignificant compared to the difference observed for the H2O2 reduction. This is in line with the observations that the electrocatalytic ORR by Cu‐tmpa is severely rate‐limited in the mass‐transport of O2 at a Cu‐tmpa concentration of 0.3 mM,[7a] and suggests that this is the case in both non‐deuterated and deuterated electrolyte solutions.
The KIE is defined as the ratio between the catalytic rate constants in aqueous and deuterated solutions. The electrocatalytic rate constant is directly proportional to the catalytic current enhancement, e. g. the squared ratio of i cat over i p, where the i p is the peak reductive current of the CuII/I redox couple. Thus, the KIE can be determined by applying Eq. (3) to the values obtained from the CVs under both conditions.
| (3) |
This resulted in a solvent KIE value of 1.65 for the reduction of hydrogen peroxide, which indicates that proton transfer is involved in the rate‐determining step of the catalytic reaction. While the determined KIE value is not particularly large, it is in the range of KIEs that are associated with homolytic cleavage of the O−O bond of the CuII−OOH, in conjunction with a proton transfer.[22] However, it was shown that the HPRR by Cu‐tmpa is mass‐transport limited in H2O2 under the experimental conditions used here, which may result in an underestimation of the KIE that was obtained from i cat derived directly from the CVs in Figure 5b. Directly deriving the rate constants under non mass‐transport limiting conditions, will result in a more accurate determination of the KIE.
2.5. Reaction Kinetics and FOWA of the HPRR
While a quick analysis of cyclic voltammograms of the ORR and HPRR by Cu‐tmpa (Figure 1b) already reveals that HPRR by Cu‐tmpa is significantly slower than ORR under the same catalytic conditions and substrate concentrations, the rate constants of the reaction can be determined via foot‐of‐the‐wave analysis (FOWA) or by direct determination using the catalytic current enhancement. Using the FOWA method to determine rate constants, only the beginning of the catalytic wave is used, a region which is not affected by substrate consumption, catalyst deactivation, product inhibition or other side phenomena. In this way the ideal or maximum turnover frequency (TOFmax) associated with the catalytic reaction can be determined. The FOWA has been described in detail previously by Savéant, Costentin and others.[23]
For the FOWA (see Supporting Information, section 1.3), a CV was measured in triplicate in a PB (pH 7) electrolyte solution containing 0.3 mM Cu‐tmpa and 1.1 mM H2O2, using a freshly polished GC electrode. The resulting CVs are shown in Figure S4a. From these CVs, plots of the current enhancement i c /i p vs. were constructed (Figure S4c). Here, i c is the current associated with the catalytic HPRR reaction at the applied potential E and i p is the peak cathodic current associated with the CuII/I redox couple of Cu‐tmpa. In the foot‐of‐the‐wave region, a linear fit (Figure S4e; R2>0.98) was applied between the onset of the HPRR and the potential at which i c /i p is at least larger than 1.6, i. e. the potential where the catalytic current is 60 % larger than the peak cathodic current of the CuII/I redox couple. The catalytic onset is defined as i c /i redox≥2, where i redox is the current associated with the reduction of the catalyst measured at the applied potential E, in the absence of H2O2. From the slope of the linear fit, the TOFmax for the HPRR by Cu‐tmpa in pH 7 phosphate buffer solution containing 1.1 mM H2O2 was determined to be 2.1×10⁵±0.1×10⁵ s−1. This is one order of magnitude (9 times) less than was previously reported for the ORR (Figure 6a).[7a] Using the same approach, the TOFmax for the HPRR in the deuterated pH 7 phosphate buffer solution was determined to be 1.5×10⁵±0.1×10⁵ s−1. A comparison of the TOFmax of the HPRR in H2O and D2O is shown in Figure 6b and confirms that the Cu‐tmpa catalysed HPRR is indeed slower in D2O. By applying Eq. (3), where TOFmax was used as the k obs, a KIE of 1.37±0.14 was calculated.
| (4) |
| (5) |
Figure 6.
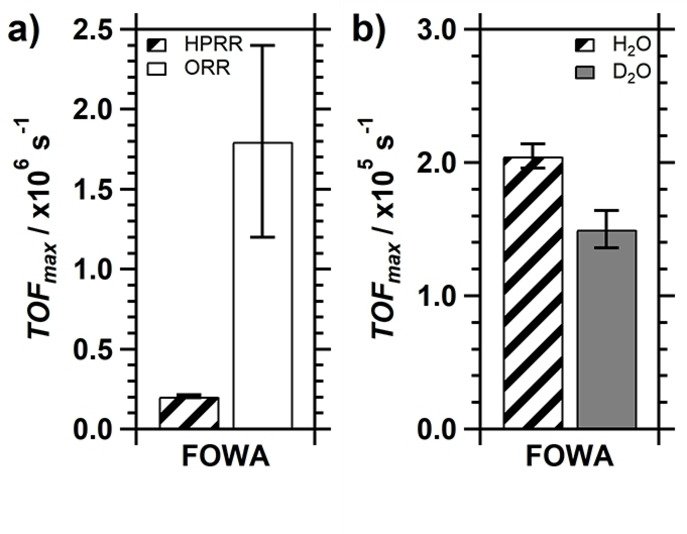
a) Comparison between the TOFmax of Cu‐tmpa for the HPRR (1.1 mM H2O2 under 1 atm Ar) and the ORR (1 atm O2) as determined by FOWA. b) Comparison between the TOFmax of the HPRR in H2O and D2O. Conditions: [Cu‐tmpa]=0.3 mM, pH 7 PB ([PO4]=100 mM), 293 K, 100 mV s−1 scan rate.
A more direct approach to obtain a rate constant can be achieved by using the catalytic current enhancement i cat /i p and applying Eq. (4), where R, T and F are known constants, ν is the scan rate (V/s), and n cat is the number of electrons transferred during the catalytic reaction.[24] The current enhancement was determined from the background‐corrected peak catalytic current i cat at low catalyst concentration (1.0–2.5 μM) in the presence of 1.1 mM H2O2, as discussed in a previous section. No redox current is visible above the double layer current at these low catalyst concentrations. Therefore, for each catalyst concentration the i p was calculated using the diffusion coefficient of Cu‐tmpa (D=4.9×10⁻⁶ cm2 s−1) by applying the Randles‐Sevcik equation [Eq. (5)]. This resulted in a k obs of 4.8×10³±0.4×10³ s−1 (Figure 7). Repeating the same experiments in deuterated electrolyte solutions resulted in a k obs of 3.2×10³±0.4×10³ s−1. Equation 3 was applied to these catalytic rate constants giving a KIE of 1.48±0.17, showing that at both low and high catalyst concentration, and under both substrate limited and non‐limiting conditions, a significant kinetic isotope effect is observed.
Figure 7.
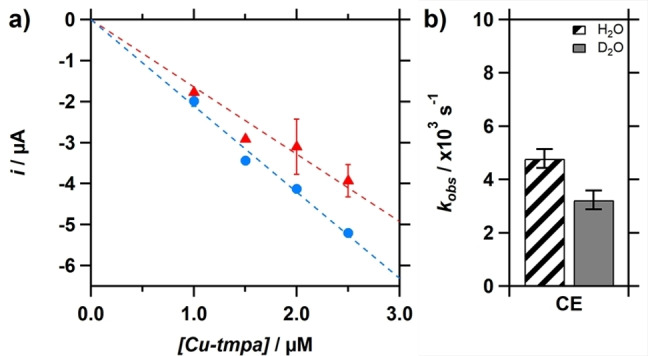
a) The peak catalytic current i cat plotted against the Cu‐tmpa concentration in a deuterated (red triangles) and non‐deuterated (blue circles) PB electrolyte solution containing 1.1 mM H2O2 under 1 atm Ar. b) Comparison for the k obs derived from the current enhancement (CE) between the hydrogen peroxide reduction in H2O and D2O.Conditions: pH 7 PB ([PO4]=100 mM), 293 K, 100 mV s−1 scan rate.
3. Discussion
As demonstrated, the electrocatalytic HPRR by Cu‐tmpa is a first‐order reaction in both the catalyst and the hydrogen peroxide substrate. Using FOWA, the TOFmax for the reduction of H2O2 was shown to be one order of magnitude lower than that of the 2‐electron reduction of O2 to H2O2, consistent with the analysis of the Tafel slopes for ORR and HPRR previously reported by us.[7a] The HPRR k obs (4.8×10³ s−1±0.4×10³ s−1) that was obtained at low catalyst concentration was significantly lower than the FOWA‐derived TOFmax (2.1×10⁵ s−1±0.1×10⁵ s−1) at higher catalyst concentration. Such a k obs<TOFmax is expected due to previously mentioned deviations from an ideal catalytic system.
However, the difference between the k obs and the TOFmax of the HPRR is significantly larger (2.5 times) than the difference between the k obs (1.5×10⁵ s−1) and TOFmax (1.8×10⁶ s−1) of the ORR that we have previously reported.[7a] A few factors can explain this difference. Firstly, during the ORR the partial 2‐electron reduction of O2 to H2O2 and the 2‐electron reduction of H2O2 both contribute to the peak catalytic current, each with a different catalytic rate. Thus, the intermediate H2O2 is generated in situ near the electrode surface, thereby minimizing the effect of mass‐transport of H2O2 to the electrode on the subsequent 2‐electron reduction to H2O. Given that the diffusion constant of H2O2 (0.6–1.4×10⁻⁵ cm2 s−1) is significantly lower than that of O2 (2.0×10⁻⁵ cm2 s−1), this would enhance the catalytic current associated with the reduction of H2O2, contributing to a higher overall k obs for the 4‐electron ORR as determined via the current enhancement (CE) i cat/i p. This would result in a smaller difference between the k obs and TOFmax for the ORR, where the latter is derived from the partial 2‐electron reduction of O2. Conversely, for the HPRR both the FOWA and CE rate constants are associated with the same 2‐electron reduction of H2O2. During the HPRR diffusion of H2O2 to the electrode does play a role and does not benefit of an increased catalytic rate due to in situ generation of the substrate that resulted in a smaller difference between the k obs and TOFmax for the ORR.
Furthermore, in the case of the HPRR, one of the contributing factors to the observed deviation from the ideal behaviour can be related to catalysts decomposition or deposition. Indeed, prolonged cycling during CV measurements shows a significant change in shape of the catalytic events (see Figure S5 in the Supporting Information), followed by increased activity after mixing and saturating the solution with argon, something that was not observed for the ORR. During ORR, the reduction of H2O2 is only expected under conditions wherein the overall reduction reaction is nearly mass transport limited in O2. Under such conditions one would not expect to find a large deviation from the ideal catalytic activity due to catalyst degradation, if one considers that catalyst deactivation is linked to the reduction of H2O2 and not to the 2‐electron reduction of O2.
The mechanism for H2O2 reduction on copper has been proposed to go through a Fenton‐type mechanism, based on research on copper monooxygenases or on bio‐inspired copper complexes as monooxygenase mimics.[9] In this mechanism, it is proposed that the O−O bond of hydrogen peroxide is split homolytically. This can either result in a copper oxyl radical (Cu−O.−) and a free hydroxyl anion (HO−), or a copper hydroxyl species (Cu−OH) and a free hydroxyl radical anion (HO.−) as intermediates. For LPMO, it has been found by computational methods that the latter route is more favourable.[25] Additionally, it was shown that the hydroxyl radical was stabilized in the enzyme binding pocket of the active site, preventing damage caused by free radical species. This allows for a hydrogen atom abstraction (HAA) by the hydroxyl radical from the copper bound hydroxyl group, resulting in Cu−O.− and a water molecule.[9b] These possible catalytic pathways are schematically shown in Scheme 1, which also includes an outer sphere electron‐transfer PCET step as an alternative for the HAA.[26] In an electrochemical system, where electron transfer is very fast, and no free radical‐stabilizing binding pocket is available, outer sphere electron transfer mediated by the solvent and/or phosphate ions should be considered.
Scheme 1.

Possible electrocatalytic HPRR pathways in the presence of Cu‐tmpa, showing a pathway that proceeds via a Cu hydroxyl and free hydroxyl radical (top), or via copper oxyl radical (bottom). In copper monooxygenases, the possibility of an HAA step has been proposed, enabled by the stabilizing effect of the binding pocket on the hydroxyl radical (see text).
The solvent kinetic isotope effect of 1.4–1.7 for the HPRR catalysed by Cu‐tmpa indicates that bond breaking of an O−H bond is involved in the rate‐determining step of the catalytic reaction. The relatively low KIE would suggest a weak O−H bond with little covalent character is involved. Solvent KIEs in the same range were observed for an Fe(III)‐hydroperoxide porphyrin model for the active site of heme oxygenase.[22b, 22c, 27] Based on computational methods, the solvent KIE was proposed to be associated with a concerted, stepwise mechanism of proton transfer from the H2O/H3O+ and solvent O−O bond breaking, while involving a rearrangement of the formed hydroxyl radical anion. Such a mechanism would align closer with the top route shown in Scheme 1. The resulting free hydroxyl radical anion would also explain the observed instability of the complex under catalytic conditions, as it could react with the tmpa ligand.
4. Conclusions
The catalytic performance was investigated of Cu‐tmpa for the electrocatalytic reduction of H2O2 in pH 7 phosphate buffered neutral aqueous solution. It was confirmed that the reduction of H2O2 is significantly slower than O2 reduction, with rate constants being 10 (TOFmax) to 30 (k obs) times lower. As is the case for the ORR, the HPRR displayed a first‐order dependence on the catalyst concentration, showing that only a single copper site is involved in the catalytic reaction, which fits well with the reported literature on iron‐ and copper‐catalysed H2O2 reduction in enzymes. Additionally, the reaction shows a first‐order dependence on the H2O2 concentration as well, up until the buffering capacity of the 0.1 M PB buffer is compromised. The effect on the catalytic performance by using D2O as the solvent was studied, and resulted in a solvent KIE between 1.4–1.7 for the HPRR. However, while this does confirm that a hydrogen or proton transfer is involved in the rate‐determining step of the catalytic reaction, the magnitude of the KIE alone does not allow us to pinpoint the exact mechanistic route for the HPRR. Yet, when combining what is known about copper monooxygenases with the obtained solvent KIE and the apparent instability of the Cu‐tmpa under catalytic HPRR conditions, the pathway in which free hydroxyl radical anions are formed seems the most likely candidate at this point.
Experimental Section
General
Aqueous electrolyte solutions were prepared using NaH2PO4 (Suprapur®, Merck) and Na2HPO4 (Suprapur®, Merck). [Cu(tmpa)(CH3CN)](OTf)2 was synthesized as previously reported.[7a] Milli‐Q Ultrapure grade water was used for all electrochemical experiments and for the preparation of all aqueous electrolyte solutions. D2O for the kinetic isotope experiments was obtained from Sigma‐Aldrich (99.9 atom% D). H2O2 was obtained from Sigma‐Aldrich (≥30 %, for ultratrace analysis), and the exact concentration was determined via permanganate titration. Alumina suspensions (1.0, 0.3, and 0.05 μm) were obtained from Buehler. pH measurements were done using a Hanna Instruments HI 4222 pH meter which was calibrated by five‐point calibration using IUPAC standard buffers. All gasses used during electrochemical measurements, H2, O2, and argon (each 5.0 grade), were supplied by Linde.
Electrochemical measurements
All electrochemical experiments were performed in a custom‐built 10 mL single‐compartment glass cell with a three‐electrode setup. The measurements were performed using Autolab PGSTAT 12, 204, and 128N potentiostats, operated by the Autolab NOVA 2 software. The working electrodes were glassy carbon (GC) disks, either a GC rod (A=0.071 cm2, type 1, Alfa Aesar) in hanging meniscus confirmation, or a PEEK encapsulated GC disk (A=0.071 cm2, Metrohm) submerged in the solution. Unless otherwise stated, the GC electrodes were manually polished before each catalytic measurement for 5 mins with 1.0, 0.3, and 0.05 μm alumina suspensions on Buehler cloth polishing pads, or with a Struers LaboPol‐30 polishing machine using 1.0 μm diamond and 0.04 μm silica suspension on polishing cloths (Dur‐type) for 1 min each. This was followed by sonication of the electrode in Milli‐Q purified water for 10–15 minutes. A gold wire was used as a counter electrode and was flame annealed and rinsed with Milli‐Q purified water. The reference electrode was a reversible hydrogen electrode (RHE) made from a Pt mesh submerged in same electrolyte solution as the main cell compartment, connected via a Luggin capillary, and continuously sparged with H2 gas. Oxygen‐free electrolyte solutions were prepared by saturating the cell for 20 to 30 minutes with Ar, after which an atmosphere of 1 atm Ar was maintained. Oxygen‐saturated electrolyte solutions were obtained by saturating the cell for 20 minutes with O2, after which a 1 atm O2 atmosphere was maintained. All glassware was regularly cleaned by submersion in an aqueous oxidizing solution containing 0.5 M H2SO4 and 1 mg/mL (6.3 mM) KMnO4 overnight. This is followed by removal of excess KMnO4 and MnO2 from the glassware with diluted H2SO4 and H2O2, followed by rinsing the glassware three times with water and boiling twice submerged in Milli‐Q purified water.
Electrochemical measurements in D2O
In preparation of the measurements in D2O, all glassware was cleaned following the procedure described previously. Additionally, the glassware was dried in an oven at 140 °C for 2 days. The GC working electrode was polished as previously described, followed by sonication in D2O instead of H2O. After each polishing cycle and before every measurement, the GC electrode was submerged in the deuterated electrolyte solution for at least 2 minutes. Both the counter and reference electrode were flame annealed and rinsed with D2O before the experiment. The electrolyte solutions were prepared by weighing the required phosphate salts (NaH2PO4 and Na2HPO4), which were stored under vacuum in a desiccator containing aluminosilicate drying pearls, in a 100 mL volumetric flask. The volumetric flask was filled to 100 mL with D2O. The apparent pH* was measured using a calibrated pH meter filled with non‐deuterated electrolyte solution. Both the main cell compartment and the Luggin compartment containing the RHE electrode were filled with the same deuterated PB solution. Catalyst solutions were obtained by first drying Cu‐tmpa on a Schlenk‐line overnight, before weighing the required amount. This was followed by preparation of concentrated stock solutions of Cu‐tmpa (30.0 mM) in D2O for use in the electrochemical experiments. H2O2 (10.0 M in H2O) was used as is, as the maximum proton content during the electrochemical measurements would not exceed 0.01 %.
Conflict of interest
The authors declare no conflict of interest.
Supporting information
As a service to our authors and readers, this journal provides supporting information supplied by the authors. Such materials are peer reviewed and may be re‐organized for online delivery, but are not copy‐edited or typeset. Technical support issues arising from supporting information (other than missing files) should be addressed to the authors.
Supporting Information
Acknowledgements
Financial support was provided by the European Research Council (ERC starting grant 637556 Cu4Energy to D.G.H.H.).
M. Langerman, D. G. H. Hetterscheid, ChemElectroChem 2021, 8, 2783.
This article is dedicated to the memory of Prof. Jean‐Michel Savéant and his enormous contributions to molecular electrochemistry
References
- 1.
- 1a.Grigoropoulou G., Clark J. H., Elings J. A., Green Chem. 2003, 5, 1–7; [Google Scholar]
- 1b.Noyori R., Aoki M., Sato K., Chem. Commun. 2003, 1977–1986; [DOI] [PubMed] [Google Scholar]
- 1c.Goti A., Cardona F., Tundo P., Esposito V., Green Chemical Reactions, Springer Netherlands, Dordrecht, 2008, pp. 191–212; [Google Scholar]
- 1d.Podgoršek A., Zupan M., Iskra J., Angew. Chem. Int. Ed. 2009, 48, 8424–8450; [DOI] [PubMed] [Google Scholar]; Angew. Chem. 2009, 121, 8576–8603. [Google Scholar]
- 2.
- 2a.Prabhakaran V., Arges C. G., Ramani V., Proc. Nat. Acad. Sci. 2012, 109, 1029–1034; [DOI] [PMC free article] [PubMed] [Google Scholar]
- 2b.Curtin D. E., Lousenberg R. D., Henry T. J., Tangeman P. C., Tisack M. E., J. Power Sources 2004, 131, 41–48; [Google Scholar]
- 2c.Wang Y., Chen K. S., Mishler J., Cho S. C., Adroher X. C., Appl. Energy 2011, 88, 981–1007; [Google Scholar]
- 2d.An L., Zhao T., Yan X., Zhou X., Tan P., Sci. Bull. 2015, 60, 55–64. [Google Scholar]
- 3.
- 3a.Asada K., Physiol. Plant. 1992, 85, 235–241; [Google Scholar]
- 3b.Nagababu E., Chrest F. J., Rifkind J. M., Biochim. Biophys. Acta Gen. Subj. 2003, 1620, 211–217. [DOI] [PubMed] [Google Scholar]
- 4.
- 4a.Maiti D., Narducci Sarjeant A. A., Karlin K. D., Inorg. Chem. 2008, 47, 8736–8747; [DOI] [PMC free article] [PubMed] [Google Scholar]
- 4b.Ghosh A., Mitchell D. A., Chanda A., Ryabov A. D., Popescu D. L., Upham E. C., Collins G. J., Collins T. J., J. Am. Chem. Soc. 2008, 130, 15116–15126; [DOI] [PubMed] [Google Scholar]
- 4c.Day B. J., Biochem. Pharmacol. 2009, 77, 285–296; [DOI] [PMC free article] [PubMed] [Google Scholar]
- 4d.Tovmasyan A., Maia C. G. C., Weitner T., Carballal S., Sampaio R. S., Lieb D., Ghazaryan R., Ivanovic-Burmazovic I., Ferrer-Sueta G., Radi R., Reboucas J. S., Spasojevic I., Benov L., Batinic-Haberle I., Free Radical Biol. Med. 2015, 86, 308–321; [DOI] [PMC free article] [PubMed] [Google Scholar]
- 4e.Signorella S., Palopoli C., Ledesma G., Coord. Chem. Rev. 2018, 365, 75–102. [Google Scholar]
- 5.
- 5a.Vaaje-Kolstad G., Westereng B., Horn S. J., Liu Z., Zhai H., Sørlie M., Eijsink V. G. H., Science 2010, 330, 219–222; [DOI] [PubMed] [Google Scholar]
- 5b.Horn S. J., Vaaje-Kolstad G., Westereng B., Eijsink V. G., Biotechnol. Biofuels 2012, 5, 45–45; [DOI] [PMC free article] [PubMed] [Google Scholar]
- 5c.Vaaje-Kolstad G., Forsberg Z., Loose J. S. M., Bissaro B., Eijsink V. G. H., Curr. Opin. Struct. Biol. 2017, 44, 67–76; [DOI] [PubMed] [Google Scholar]
- 5d.Hemsworth G. R., Johnston E. M., Davies G. J., Walton P. H., Trends Biotechnol. 2015, 33, 747–761; [DOI] [PubMed] [Google Scholar]
- 5e.Calderaro F., Keser M., Akeroyd M., Bevers L. E., Eijsink V. G. H., Várnai A., van den Berg M. A., Biotechnol. Biofuels 2020, 13, 195. [DOI] [PMC free article] [PubMed] [Google Scholar]
- 6.Ciano L., Davies G. J., Tolman W. B., Walton P. H., Nat. Catal. 2018, 1, 571–577. [Google Scholar]
- 7.
- 7a.Langerman M., Hetterscheid D. G. H., Angew. Chem. Int. Ed. 2019, 58, 12974–12978; [DOI] [PubMed] [Google Scholar]; Angew. Chem. 2019, 131, 13108–13112; [Google Scholar]
- 7b.Smits N. W. G., van Dijk B., De Bruin I., Groeneveld S. L. T., Siegler M. A., Hetterscheid D. G. H., Inorg. Chem. 2020, 59, 16398–16409; [DOI] [PMC free article] [PubMed] [Google Scholar]
- 7c.Thorseth M. A., Letko C. S., Rauchfuss T. B., Gewirth A. A., Inorg. Chem. 2011, 50, 6158–6162; [DOI] [PubMed] [Google Scholar]
- 7d.Kakuda S., Peterson R. L., Ohkubo K., Karlin K. D., Fukuzumi S., J. Am. Chem. Soc. 2013, 135, 6513–6522; [DOI] [PMC free article] [PubMed] [Google Scholar]
- 7e.Venegas R., Muñoz-Becerra K., Lemus L., Toro-Labbé A., Zagal J. H., Recio F. J., J. Phys. Chem. C 2019, 123, 19468–19478; [Google Scholar]
- 7f.Muñoz-Becerra K., Báez D. F., Zagal J. H., Bollo S., Toro-Labbé A., Venegas R., Recio F. J., Electrochim. Acta 2020, 357, 136881. [Google Scholar]
- 8.Hangasky J. A., Marletta M. A., Biochemistry 2018, 57, 3191–3199. [DOI] [PubMed] [Google Scholar]
- 9.
- 9a.Kim S., Ginsbach J. W., Lee J. Y., Peterson R. L., Liu J. J., Siegler M. A., Sarjeant A. A., Solomon E. I., Karlin K. D., J. Am. Chem. Soc. 2015, 137, 2867–2874; [DOI] [PMC free article] [PubMed] [Google Scholar]
- 9b.Wang B., Walton P. H., Rovira C., ACS Catal. 2019, 9, 4958–4969. [DOI] [PMC free article] [PubMed] [Google Scholar]
- 10.
- 10a.Lieberman R. L., Rosenzweig A. C., Nature 2005, 434, 177–182; [DOI] [PubMed] [Google Scholar]
- 10b.Himes R. A., Karlin K. D., Curr. Opin. Chem. Biol. 2009, 13, 119–131; [DOI] [PMC free article] [PubMed] [Google Scholar]
- 10c.Smith S. M., Rawat S., Telser J., Hoffman B. M., Stemmler T. L., Rosenzweig A. C., Biochemistry 2011, 50, 10231–10240; [DOI] [PMC free article] [PubMed] [Google Scholar]
- 10d.Cao L., Caldararu O., Rosenzweig A. C., Ryde U., Angew. Chem. Int. Ed. 2018, 57, 162–166; [DOI] [PMC free article] [PubMed] [Google Scholar]; Angew. Chem. 2018, 130, 168–172; [Google Scholar]
- 10e.Miyanishi M., Abe T., Hori Y., Shiota Y., Yoshizawa K., Inorg. Chem. 2019, 58, 12280–12288. [DOI] [PubMed] [Google Scholar]
- 11.Ross M. O., MacMillan F., Wang J., Nisthal A., Lawton T. J., Olafson B. D., Mayo S. L., Rosenzweig A. C., Hoffman B. M., Science 2019, 364, 566–570. [DOI] [PMC free article] [PubMed] [Google Scholar]
- 12.
- 12a.Liu W., Zuckerbrod D., J. Electrochem. Soc. 2005, 152, A1165; [Google Scholar]
- 12b.Kinumoto T., Inaba M., Nakayama Y., Ogata K., Umebayashi R., Tasaka A., Iriyama Y., Abe T., Ogumi Z., J. Power Sources 2006, 158, 1222–1228; [Google Scholar]
- 12c.Inaba M., Kinumoto T., Kiriake M., Umebayashi R., Tasaka A., Ogumi Z., Electrochim. Acta 2006, 51, 5746–5753; [Google Scholar]
- 12d.Hongsirikarn K., Mo X., Goodwin J. G., Creager S., J. Power Sources 2011, 196, 3060–3072. [Google Scholar]
- 13.
- 13a.Fukuzumi S., Yamada Y., Karlin K. D., Electrochim. Acta 2012, 82, 493–511; [DOI] [PMC free article] [PubMed] [Google Scholar]
- 13b.An L., Zhao T. S., Zhou X. L., Wei L., Yan X. H., RSC Adv. 2014, 4, 65031–65034; [Google Scholar]
- 13c.Miglbauer E., Wójcik P. J., Głowacki E. D., Chem. Commun. 2018, 54, 11873–11876; [DOI] [PubMed] [Google Scholar]
- 13d.Yang Y., Xue Y., Huang F., Zhang H., Tao K., Zhang R., Shen Q., Chang H., ACS Appl. Mater. Interfaces 2018, 1, 5328–5335. [Google Scholar]
- 14.Campos-Martin J. M., Blanco-Brieva G., Fierro J. L. G., Angew. Chem. Int. Ed. 2006, 45, 6962–6984; [DOI] [PubMed] [Google Scholar]; Angew. Chem. 2006, 118, 7116–7139. [Google Scholar]
- 15.Hage R., Lienke A., Angew. Chem. Int. Ed. 2006, 45, 206–222; [DOI] [PubMed] [Google Scholar]; Angew. Chem. 2006, 118, 212–229. [Google Scholar]
- 16.
- 16a.van Stroe-Biezen S. A. M., Everaerts F. M., Janssen L. J. J., Tacken R. A., Anal. Chim. Acta 1993, 273, 553–560; [Google Scholar]
- 16b.Hall S. B., Khudaish E. A., Hart A. L., Electrochim. Acta 1999, 44, 2455–2462. [Google Scholar]
- 17.Aoki K., Ishida M., Tokuda K., Hasebe K., J. Electroanal. Chem. 1988, 251, 63–71. [Google Scholar]
- 18.Westbroek P., Temmerman E., J. Electroanal. Chem. 2000, 482, 40–47. [Google Scholar]
- 19.Goor G., Glenneberg J., Jacobi S., Dadabhoy J., Candido E., Ullmann's Encyclopedia of Industrial Chemistry, pp. 1–40. [Google Scholar]
- 20.Kréżel A., Bal W., J. Inorg. Biochem. 2004, 98, 161–166. [DOI] [PubMed] [Google Scholar]
- 21.
- 21a.Ghoneim M. M., Clouser S., Yeager E., J. Electrochem. Soc. 1985, 132, 1160–1162; [Google Scholar]
- 21b.Xu J., Huang W., McCreery R. L., J. Electroanal. Chem. 1996, 410, 235–242. [Google Scholar]
- 22.
- 22a.Gopinath E., Bruice T. C., J. Am. Chem. Soc. 1991, 113, 4657–4665; [Google Scholar]
- 22b.Davydov R., Matsui T., Fujii H., Ikeda-Saito M., Hoffman B. M., J. Am. Chem. Soc. 2003, 125, 16208–16209; [DOI] [PubMed] [Google Scholar]
- 22c.Kumar D., de Visser S. P., Shaik S., J. Am. Chem. Soc. 2005, 127, 8204–8213. [DOI] [PubMed] [Google Scholar]
- 23.
- 23a.Costentin C., Drouet S., Robert M., Savéant J.-M., J. Am. Chem. Soc. 2012, 134, 11235–11242; [DOI] [PubMed] [Google Scholar]
- 23b.Costentin C., Savéant J.-M., ChemElectroChem 2014, 1, 1226–1236; [Google Scholar]
- 23c.Rountree E. S., McCarthy B. D., Eisenhart T. T., Dempsey J. L., Inorg. Chem. 2014, 53, 9983–10002; [DOI] [PubMed] [Google Scholar]
- 23d.Artero V., Saveant J.-M., Energy Environ. Sci. 2014, 7, 3808–3814; [DOI] [PMC free article] [PubMed] [Google Scholar]
- 23e.Costentin C., Savéant J.-M., J. Am. Chem. Soc. 2017, 139, 8245–8250. [DOI] [PubMed] [Google Scholar]
- 24.Bullock R. M., Appel A. M., Helm M. L., Chem. Commun. 2014, 50, 3125–3143. [DOI] [PubMed] [Google Scholar]
- 25.Wang B., Johnston E. M., Li P., Shaik S., Davies G. J., Walton P. H., Rovira C., ACS Catal. 2018, 8, 1346–1351. [Google Scholar]
- 26.
- 26a.Ramaswamy N., Mukerjee S., J. Phys. Chem. C 2011, 115, 18015–18026; [Google Scholar]
- 26b.Kenkel I., Franke A., Dürr M., Zahl A., Dücker-Benfer C., Langer J., Filipović M. R., Yu M., Puchta R., Fiedler S. R., Shores M. P., Goldsmith C. R., Ivanović-Burmazović I., J. Am. Chem. Soc. 2017, 139, 1472–1484. [DOI] [PubMed] [Google Scholar]
- 27.Sharma P. K., Kevorkiants R., de Visser S. P., Kumar D., Shaik S., Angew. Chem. Int. Ed. 2004, 43, 1129–1132; [DOI] [PubMed] [Google Scholar]; Angew. Chem. 2004, 116, 1149–1152. [Google Scholar]
Associated Data
This section collects any data citations, data availability statements, or supplementary materials included in this article.
Supplementary Materials
As a service to our authors and readers, this journal provides supporting information supplied by the authors. Such materials are peer reviewed and may be re‐organized for online delivery, but are not copy‐edited or typeset. Technical support issues arising from supporting information (other than missing files) should be addressed to the authors.
Supporting Information