Abstract
Motivation
Gene Set Enrichment Analysis (GSEA) is an algorithm widely used to identify statistically enriched gene sets in transcriptomic data. However, GSEA cannot examine the enrichment of two gene sets or pathways relative to one another. Here we present Differential Gene Set Enrichment Analysis (DGSEA), an adaptation of GSEA that quantifies the relative enrichment of two gene sets.
Results
After validating the method using synthetic data, we demonstrate that DGSEA accurately captures the hypoxia-induced coordinated upregulation of glycolysis and downregulation of oxidative phosphorylation. We also show that DGSEA is more predictive than GSEA of the metabolic state of cancer cell lines, including lactate secretion and intracellular concentrations of lactate and AMP. Finally, we demonstrate the application of DGSEA to generate hypotheses about differential metabolic pathway activity in cellular senescence. Together, these data demonstrate that DGSEA is a novel tool to examine the relative enrichment of gene sets in transcriptomic data.
Availability and implementation
DGSEA software and tutorials are available at https://jamesjoly.github.io/DGSEA/.
Supplementary information
Supplementary data are available at Bioinformatics online.
1 Introduction
Given the ever-increasing availability of -omics data characterizing the genome, transcriptome, proteome and metabolome, there is a persistent need for approaches that extract biological insights from these complex datasets. Gene Set Enrichment Analysis (GSEA) (Subramanian et al., 2005) has proved to be one of the most popular and powerful tools for analyzing transcriptomic data. In addition, the GSEA algorithm has proved useful for analysis of other data types including DNA copy number alterations (Graham et al., 2017), proteomics (Cha et al., 2010), phospho-proteomics (Drake et al., 2012) and metabolomics (Delfarah et al., 2019). Regardless of the data type, the key concept underlying GSEA is that predefined sets of functionally related genes can display significant enrichment that would be missed by examination of individual genes. Using the entire dataset as background, researchers can identify pathways upregulated and downregulated in phenotype(s) of interest. The GSEA approach is widely successful and has inspired many extensions, improvements and variations to analyze individual gene sets (Hänzelmann et al., 2013; Lavallée-Adam et al., 2014).
In addition to analysis of individual gene sets, statistical methods are needed to accurately measure how two gene sets or pathways are coordinately regulated with respect to each other. This is particularly important for situations where biological control involves tradeoffs or branches between two pathways. Methods for identifying differentially expressed gene set pairs have been developed (Cho et al., 2009; Yaari et al., 2013), although they lack the ability to control for false discovery rate (FDR) when hypotheses are not known a priori. Here, we present Differential Gene Set Enrichment Analysis (DGSEA), an adaption of GSEA that calculates the enrichment of two pathways relative to each other. Using metabolic pathways as a test case, we demonstrate that DGSEA accurately captures cellular phenotypes including hypoxia-induced metabolic shift, is more predictive of cellular metabolism than GSEA, and uncovers novel tradeoffs in metabolic activity upon cell senescence. As the availability of -omics data increases, DGSEA will serve as a tool to identify tradeoffs between gene sets or pathways that govern biological control.
2 Materials and methods
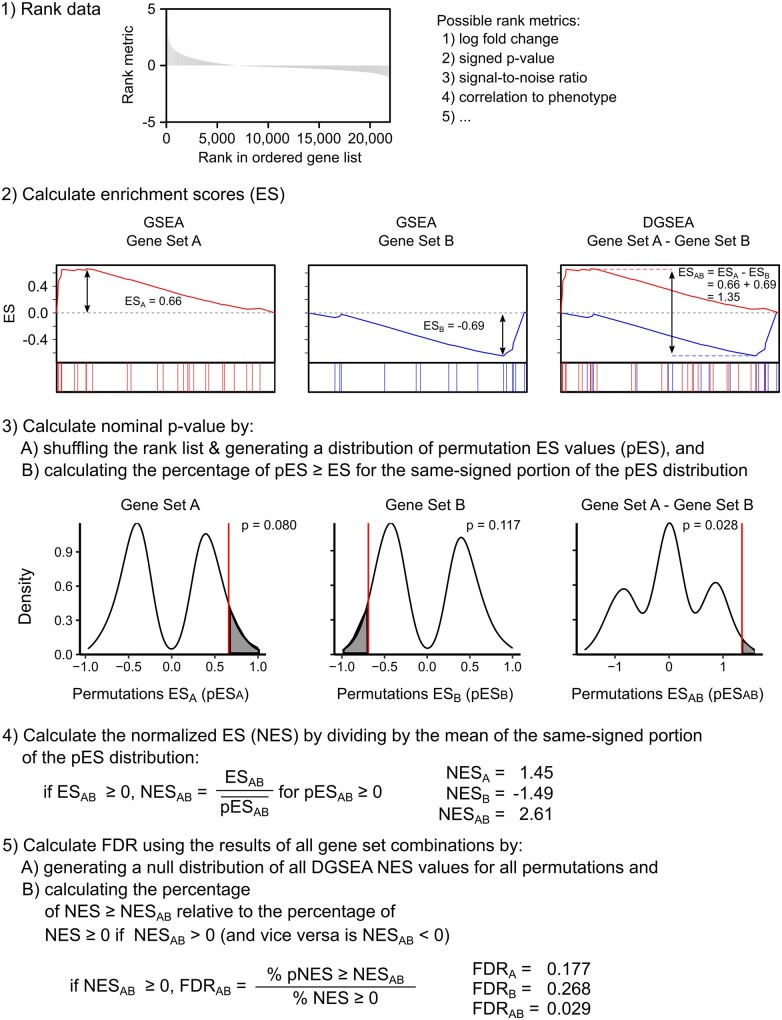
To quantify the enrichment of two gene sets relative to each other, we adapted GSEA to create DGSEA. DGSEA can be performed either (i) with two gene sets of interest such that only those two gene sets are tested relative to each other (‘targeted’ DGSEA for testing a priori hypotheses) or (ii) using a list of gene sets such that all combinations of gene sets will be tested (‘untargeted’ DGSEA for hypothesis generation). In either scenario, the goal of DGSEA is to determine whether the members of two gene sets (e.g. Gene Sets A and B) are randomly distributed with reference to each other. If Gene Sets A and B are upregulated and downregulated, respectively, we expect that A and B will be at opposite sides of the ordered gene list. Although we use the terminology ‘gene set’, the DGSEA algorithm can be used with genomic, transcriptomic, proteomic or metabolomic data with sets of functionally related genes, proteins or metabolites. DGSEA first ranks the data by any suitable metric (Fig. 1). Second, we calculate an enrichment score (ES) for each gene set (ESA and ESB) by walking down the rank list and finding the maximum deviation from zero of a running-sum, weighted Kolmogorov–Smirnov-like statistic. This is equivalent to the GSEA algorithm. Then, the difference between ESA and ESB is calculated to measure the enrichment of the two gene sets relative to each other (ESAB = ESA - ESB). We then estimate the significance level of ESA, ESB and ESAB using an empirical permutation test as in the original GSEA algorithm. Next, the normalized enrichment score (NES) is calculated by dividing positive and negative ES by the mean of positive or negative pES, respectively.
Fig. 1.
DGSEA quantifies the enrichment between two gene sets relative to each other. First, a dataset is ranked by any suitable metric. Second, the ES is calculated for each individual gene set in a manner equivalent to GSEA (ESA and ESB, left and middle). Then, the difference between the ESs of two gene sets is calculated (ESAB = ESA - ESB, right). Third, the statistical significance of ESA, ESB and ESAB is estimated using an empirical permutation test. Fourth, the NES is calculated by dividing the observed ES by the mean of the same-signed portion of the permutation ES distribution ). Fifth, to control for FDR, a null distribution of NES values is generated using all gene set comparisons and the FDR is calculated as the ratio of the percentage of all NES greater than or equal to NESAB divided by the percentage of observed if NESAB is positive and similarly if NESAB is negative
Finally, to estimate the FDR, a null distribution of NES values is generated using a list of background gene sets. For targeted DGSEA, a background list of gene sets can be provided based on the biological meaning of the tested gene sets. For example, when examining the difference between Glycolysis and Oxidative Phosphorylation, we use the remaining gene sets in KEGG Metabolic Pathways as background. Using the background gene sets, the null distribution is the union of NES values comparing Gene Set A versus all background pathways (NESAY) with the NES values comparing all background gene sets versus Gene Set B (NESXB). The histogram of these distributions is termed NESXY. For untargeted DGSEA using a list of gene sets (e.g. all metabolic pathways), the null distribution of NES values is simply the combination of all gene set pairs (XY). In either case, the null distribution of all permutation ESXY is normalized against the mean of the same signed distribution. For a given NESAB, the FDR is then calculated as the ratio of the percentage of the same-signed NESXY greater than or equal to NESAB divided by the percentage of NESXY with the same sign as NESAB. The FDR estimates for NESA and NESB are generated using a similar approach based on single background gene sets, equivalent to GSEA. The output of DGSEA is thus the relative enrichment and statistical significance of Gene Set A versus B, as well as the individual enrichment and statistical significance of Gene Sets A and B.
3 Results
3.1 Simulation study
To evaluate the sensitivity of DGSEA to quantify differences between gene sets, we generated simulated data from a standard normal distribution (15,678 genes total). We then added two ‘perturbed’ Gene Sets A and B with normally distributed positive and negative random deviations, respectively (µ=+X or -X for Gene Sets A and B, respectively, σ = 1, n = 10, 25, 50 or 100 genes). For values of X ranging from 0 to 0.5, we then performed DGSEA (Gene Set A minus Gene Set B) and GSEA (Gene Set A or Gene Set B) for 50 independent replicates. For all gene set sizes, DGSEA demonstrated significant mean enrichment (FDR q-value < 0.05) at smaller values of X than did GSEA (Fig. 2). Similar to GSEA, the mean enrichment necessary to detect a statistically significant enrichment using DGSEA decreased as gene set size increases. Additionally, we tested replacing synthetic gene sets using the sizes of the real glycolysis and OxPhos gene sets (19 and 85 genes, respectively) with simulated values, and we found that DGSEA captured differences in means of ≥0.45 (q < 0.01) (Supplementary Fig. S1A). Finally, we tested DGSEA using negative control data with both the simulated glycolysis and OxPhos gene sets perturbed in the same direction. Because both pathways are randomly perturbed in the same direction, DGSEA should not measure enrichment of the two pathways relative to each other. Indeed, DGSEA q-values were not significant for any value of the perturbation X (Supplementary Fig. S1B). Taken together, this data established the sensitivity and specificity of the DGSEA method.
Fig. 2.
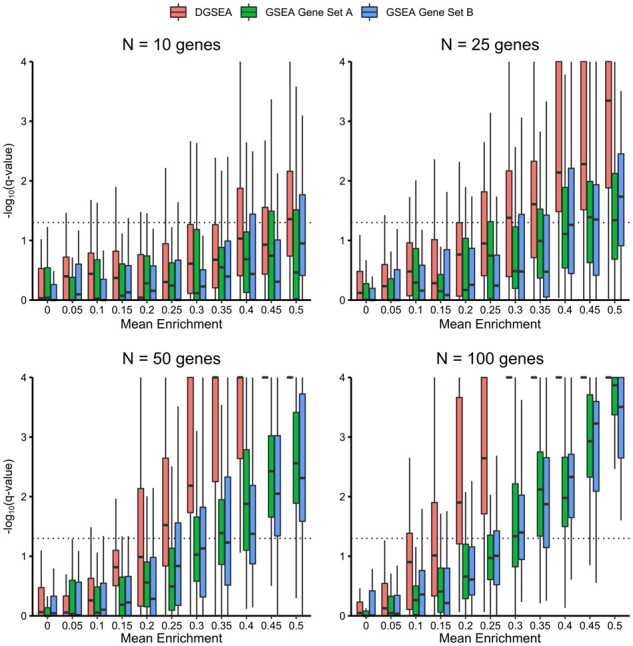
DGSEA is more sensitive than GSEA for coregulated pathways. Gene expression data were simulated from a standard normal distribution (µ =0, σ = 1, n = 15,678 genes). Then, gene expression values for Gene Set A and Gene Set B were substituted from normal distributions with means +X and -X, respectively (σ = 1, n = 10, 25, 50 or 100 genes). For values of X ranging from 0 to 0.5, we then performed DGSEA (Gene Set A minus Gene Set B, red boxplots) and GSEA [Gene Set A (green boxplots) or Gene Set B (blue boxplots)] for 50 independent replicates and plotted the negative log10 FDR q-value. For all gene set sizes, DGSEA demonstrated significant mean enrichment (FDR q-value < 0.05 or negative log10 FDR q-value > 1.3) at smaller values of X than did GSEA. Like GSEA, the mean enrichment necessary to detect a statistically significant enrichment using DGSEA decreased as gene set size increases
3.2 DGSEA accurately captures the coordinated upregulation of glycolysis and downregulation of OxPhos in hypoxia
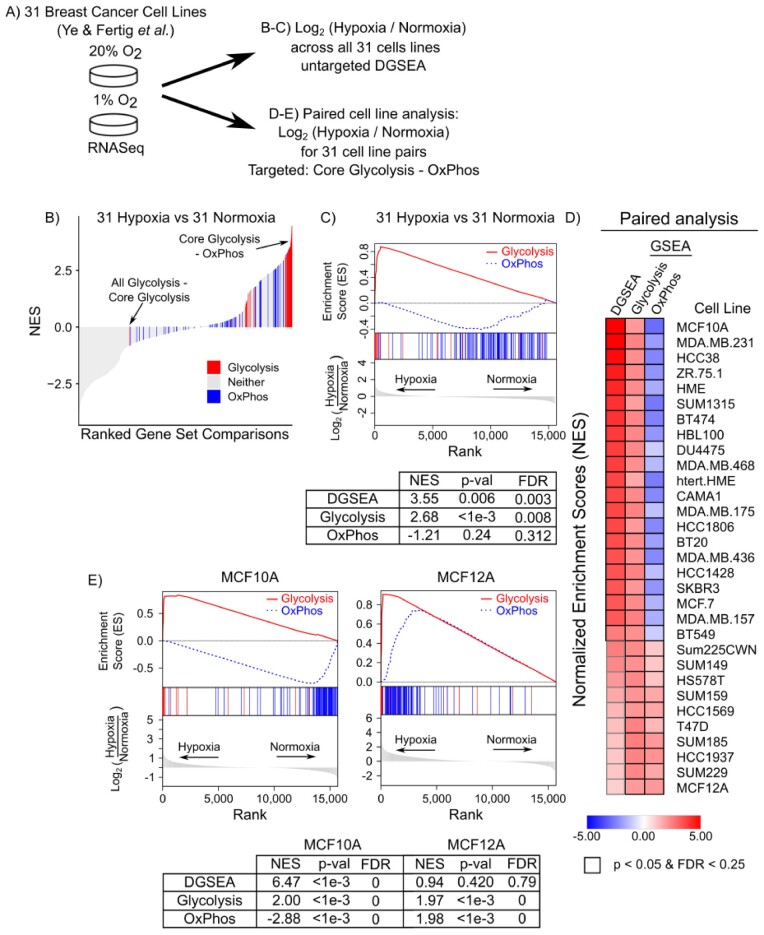
Having tested DGSEA using simulated data, we next sought to assess the algorithm’s ability to capture cellular phenotypes using experimental data. Hypoxia is associated with a metabolic shift away from OxPhos and toward glycolysis. In the absence of oxygen, hypoxia-inducible factor 1-α (HIF1α) transcriptionally activates glucose catabolism through expression of glucose transporters, glycolytic enzymes, lactate dehydrogenase and pyruvate dehydrogenase kinase 1 (Majmundar et al., 2010). To test whether DGSEA could detect the hypoxic shift from OxPhos to glycolysis, we applied DGSEA to RNASeq data from 31 breast cancer cell lines subjected to either 1 or 20% oxygen (Ye et al., 2018) (Fig. 3A). GSEA analysis with a consensus hypoxia gene set confirmed that all 31 individual cell lines demonstrated enrichment of hypoxia-regulated genes upon exposure to 1% oxygen (Supplementary Fig. S2A). We thus grouped all cell lines by their oxygen status and performed untargeted DGSEA to identify relative differences between all pairwise combinations of 79 metabolic pathways in the Kyoto Encyclopedia of Genes and Genomes (KEGG) metabolic pathway database (Kanehisa et al., 2014). Out of 3,081 combinations, we found that 240 pathway combinations had FDR q-values < 0.01. Notably, 153 of these significant DGSEA gene set combinations included either glycolysis, oxidative phosphorylation or the TCA cycle as would be expected for mammalian cells experiencing hypoxia (Fig. 3B and Supplementary Table S1).
Fig. 3.
DGSEA captures the coordinate upregulation of glycolysis and downregulation of OxPhos in hypoxia. (A) Schematic of data normalization methods used to generate gene ranking metrics for breast cancer cell lines subjected to hypoxia (1% O2) or normoxia (20% O2). (B) Core Glycolysis and OxPhos are significantly changed relative to other pathways when subject to hypoxia. Untargeted DGSEA was run using all metabolic pathways, and gene set comparisons were ranked by their NES. DGSEAs containing Core Glycolysis (red) and OxPhos (blue) are highlighted. Wilcoxon rank-sum P-values for Core Glycolysis and OxPhos are 3.09e-39 and 4.08e-8, respectively. (C) Representative mountain plots and table of values for Core Glycolysis–OxPhos. (D) DGSEA on paired cell line data identified cell lines with coordinately increased glycolysis and decreased OxPhos. DGSEA (Core Glycolysis–OxPhos) and GSEA (Core Glycolysis and OxPhos) NES values were calculated for each cell line. Black outline denotes P-value < 0.05 and FDR < 0.25. (E) Representative mountain plots and table of values for Core Glycolysis–OxPhos for MCF10A and MCF12A cells
Having confirmed the hypoxic response of all cell lines grouped by oxygen status, we next tested the ability of DGSEA to perform targeted analysis using the gene sets core glycolysis and OxPhos on individual cell lines. For the paired cell line analysis, targeted DGSEA was significantly upregulated in 21 of 31 cell lines (P-value < 0.05, FDR < 0.25) (Fig. 3D, Supplementary Table S2). Notably, GSEA using either pathway individually demonstrated significant upregulation of core glycolysis in all 31 cell lines but significant downregulation of OxPhos in only 21 of 31 cell lines. Surprisingly, upon exposure to 1% oxygen, 10 cell lines exhibited significant upregulation of OxPhos. One cell line, MCF12A, had a similar induction of both core glycolysis and OxPhos in 1% oxygen (Fig. 3E). Notably, the cell lines with upregulated OxPhos in 1% oxygen were the same cell lines identified by DGSEA as not having a significantly differential response between core glycolysis and OxPhos.
We next tested whether similar trends were observable in single sample DGSEA (ssDGSEA) and GSEA (ssGSEA). Analysis of single samples (ssGSEA) with a consensus hypoxia gene signature again confirmed that all 31 individual cell lines demonstrated enrichment of hypoxia-regulated genes upon exposure to 1% oxygen (Supplementary Fig. S2B). Using ssDGSEA to compare the relative enrichment of core glycolysis and OxPhos, we found that nearly every cell line increased its NES score in 1% oxygen (Supplementary Fig. S3). For OxPhos, however, most cell lines had only slightly negative or negligible changes in the ssGSEA NES between 20 and 1% oxygen. Taken together, DGSEA accurately identified cell lines which exhibit the hypoxia-induced coordinated upregulation and downregulation of glycolysis and OxPhos, respectively.
3.3 Benchmarking DGSEA against QuSAGE
Having found that DGSEA accurately captures the coordinated upregulation of glycolysis and downregulation of OxPhos induced by hypoxia, we next sought to compare DGSEA to QuSAGE (Yaari et al., 2013), another algorithm which can measure the enrichment of two gene sets relative to one another. We thus compared our results from untargeted DGSEA across all KEGG metabolic pathways using RNAseq data from breast cancer cell lines exposed to either hypoxia or normoxia. Comparing the non-FDR corrected P-values revealed broad agreement between the two methods (Supplementary Fig. S4A, B). In total, DGSEA and QuSAGE identified 121 and 283 pathway combinations with P-values < 0.01, respectively, with an overlap of 73 pathway combinations with P-values < 0.01 in both methods (Supplementary Fig. S4C). A threshold of P = 0.01 was chosen because DGSEA P-values less than 0.01 generally have an FDR < 0.05. Notably, QuSAGE recommends using a Benjamini–Hochberg correction to account for multiple hypothesis testing. However, the Benjamini–Hochberg correction is not appropriate here because the 3,081 pathway combinations are not independent of one another. As such, we cannot properly assess the FDR of the 283 pathway combinations with P-value < 0.01 identified by QuSAGE. In contrast, by comparing the observed NES against a null distribution obtained from random permutations (Fig. 1), DGSEA provides a suitable estimation of FDR even when the P-values are not independent of one another, thereby rendering it suitable for untargeted analyses.
3.4 DGSEA is more predictive than GSEA of lactate secretion and glucose consumption in cancer cell lines
Lactate secretion is often used as a marker of the metabolic shift between glycolysis and OxPhos. Because DGSEA can measure the relative difference between glycolysis and OxPhos, we hypothesized that DGSEA would be more predictive of lactate secretion rates than GSEA using either the glycolysis or OxPhos gene sets alone. To test this hypothesis, we analyzed paired gene expression and metabolite consumption and secretion rates from the NCI-60 panel of cancer cell lines (Gmeiner et al., 2010; Jain et al., 2012) (Fig. 4A and Supplementary Table S4). Indeed, we found that ssDGSEA NESs were more significantly correlated with lactate secretion rates than either core glycolysis or OxPhos ssGSEA NESs (Fig. 4B). In addition, we found that ssDGSEA was a better predictor of lactate secretion than ssGSEA for all combinations of similar gene sets (e.g. Gene Set A is either Core Glycolysis or Glycolysis–Gluconeogenesis and Gene Set B is either OxPhos or TCA Cycle) (Supplementary Fig. S5). Finally, ssDGSEA was also more predictive of glucose uptake than ssGSEA using either glycolysis or OxPhos. Together, these results reveal that DGSEA was more predictive than GSEA of metabolite exchange rates in cancer cells.
Fig 4.
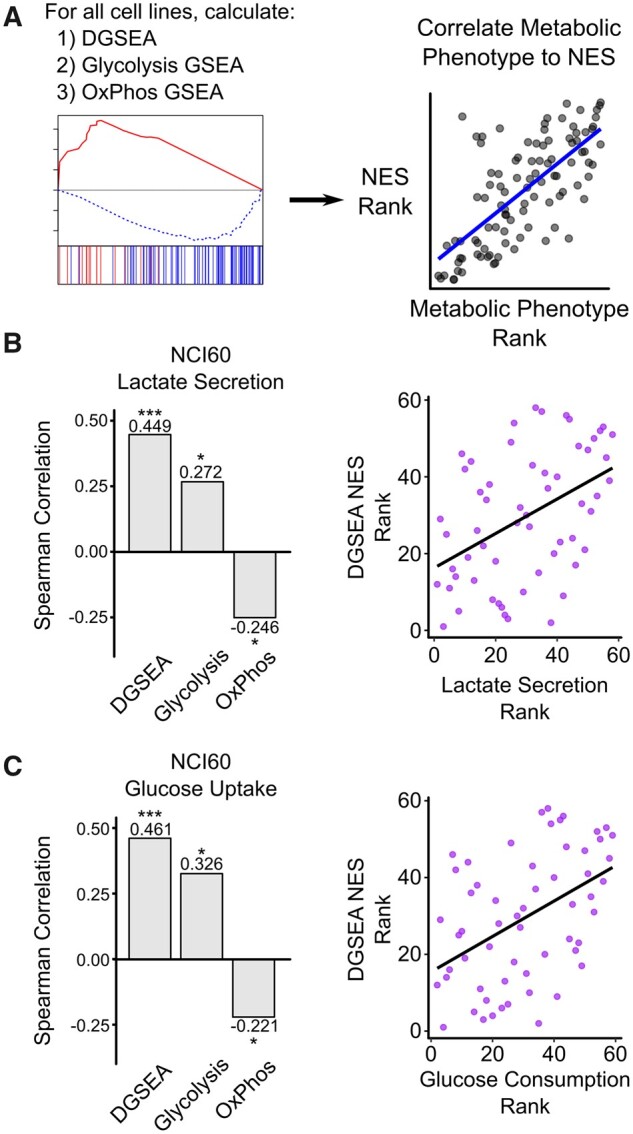
DGSEA is a better predictor of cellular metabolism than GSEA. (A) Schematic of process used to correlate pathway activity, as measured by GSEA or DGSEA, with metabolic phenotypes. (B, C) DGSEA more accurately predicted lactate secretion and glucose uptake rates than GSEA. Gene expression data were centered and scaled across 59 of the NCI-60 cancer cell lines and the NES values for Core Glycolysis, OxPhos and DGSEA were calculated for each cell line. Spearman rank correlation coefficients were calculated between each NES and lactate secretion or glucose uptake data. Scatter plots showing the spearman correlation are shown (right). * indicates P < 0.05, ** P < 0.01 and *** P < 0.001
3.5 DGSEA is correlated with high concentrations of intracellular lactate and low concentrations of intracellular AMP in adherent cancer cell lines
Although intracellular metabolite concentrations do not reflect pathway flux, we next hypothesized that comparing DGSEA and steady-state metabolite abundance would reveal trends consistent with coordinated upregulation of glycolysis and downregulation of OxPhos. For this purpose, we used paired RNAseq and metabolomics data from 897 cancer cell lines from the Cancer Cell Line Encyclopedia (Li et al., 2019). Since culture type has been reported to be a major determinant of metabolism, we separately analyzed cancer cell lines cultured in adherent and suspension cultures. Correlating DGSEA NESs for 836 adherent cell lines against 225 intracellular metabolite concentrations, we found that the metabolite most correlated with DGSEA was 1-methylnicotinamide, which has no known role in the regulation of glycolysis or OxPhos (Fig. 5A and Supplementary Table S5). However, the second most correlated metabolite with DGSEA NES was lactate, suggesting that DGSEA accurately captured the tradeoff between glycolysis and OxPhos. As with the lactate secretion data, we found that DGSEA NESs correlated better with intracellular lactate levels than did GSEA NESs using either glycolysis or OxPhos alone (Fig. 5B and Supplementary Fig. S6A). Interestingly, we found that the metabolite most anticorrelated with DGSEA NESs was AMP, a classical readout of cellular energetic state (Herzig et al., 2018). DGSEA again was a better predictor of AMP levels than GSEA with either glycolysis of OxPhos alone. Notably, these results with adherent cultures were not recapitulated in suspension cultures, perhaps due to sample size limitations (Supplementary Fig. S6B). Taken together, these results indicate that DGSEA testing the relative enrichment between glycolysis and OxPhos strongly correlated with steady-state levels of metabolites that indicate the tradeoff between glycolysis and OxPhos (i.e. lactate) and anticorrelated with metabolites indicative of a low energetic state (i.e. AMP).
Fig 5.
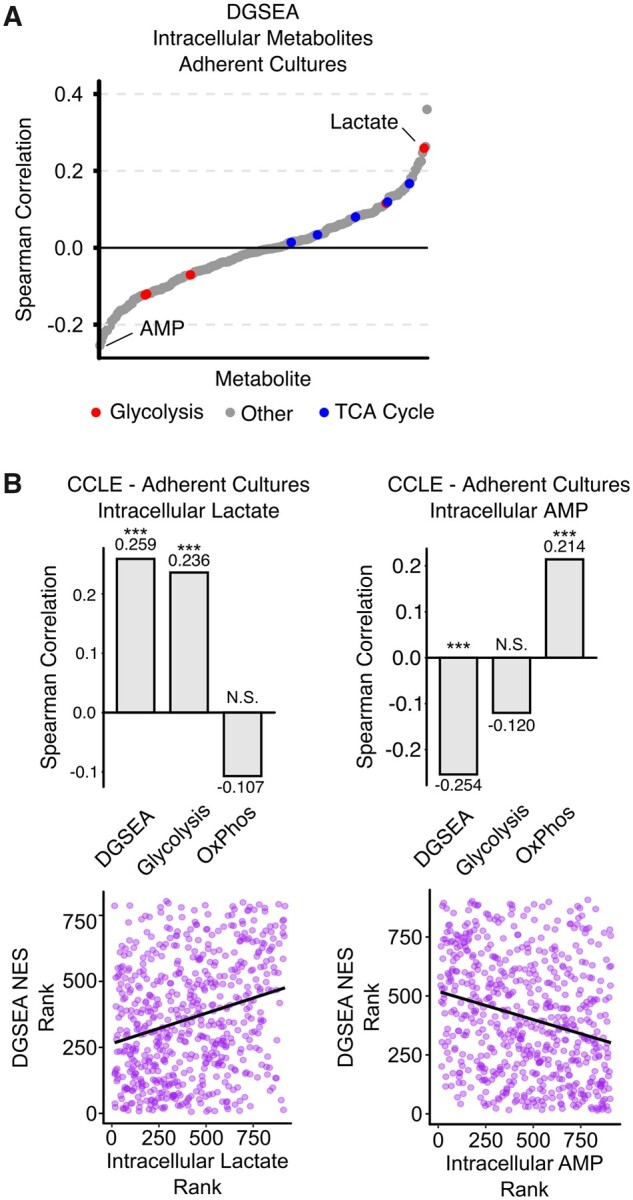
DGSEA is a better predictor of intracellular lactate and AMP levels than GSEA for adherent cell cultures. (A) Increased intracellular lactate and decreased AMP correlated with increased glycolysis and decreased OxPhos. RNASeq data were centered and scaled across all adherent cell culture lines in the Cancer Cell Line Encyclopedia and then the Spearman correlation coefficient was calculated between DGSEA NESs and metabolite abundances. Lactate was the second most correlated metabolite, and AMP was the least correlated metabolic with DGSEA. (B) Barplots showing the comparison of DGSEA and glycolysis and OxPhos GSEA. Scatter plots showing the correlation between DGSEA and lactate or AMP are shown. *** indicates P < 0.001
3.6 Untargeted DGSEA predicts differential metabolic pathway activity in senescent and proliferating cells
To demonstrate the usage of DGSEA without an a priori hypothesis, we next analyzed RNAseq data from IMR90 cells undergoing ionizing radiation-induced senescence (Baar et al., 2017). Using 79 metabolic pathways from KEGG, we found that 19 of 3,081 pairwise combinations exhibited significant differential enrichment between senescent and proliferating cells (P-value < 0.05, FDR q-value < 0.05) (Fig. 6 and Supplementary Table S6). In contrast, using GSEA, only two gene sets exhibited significant enrichment, namely glycolysis and nitrogen metabolism. Of the 19 significant DGSEA pathway combinations, there were 14 unique gene sets with nitrogen metabolism (9 of 19) and core glycolysis (4 of 19) overrepresented. Notably, six of the significant DGSEA pathway combinations compared two pathways that were not individually significant using GSEA (e.g. glycosaminoglycan biosynthesis keratan sulfate and heparan sulfate, Fig. 6A). These results suggest that the coordinated up- and downregulation of these metabolic pathways, rather than the up- or downregulation of the individual pathways, may be required for cellular senescence. Together, these results demonstrate the ability of DGSEA to generate de novo hypotheses from transcriptomic data.
Fig 6.
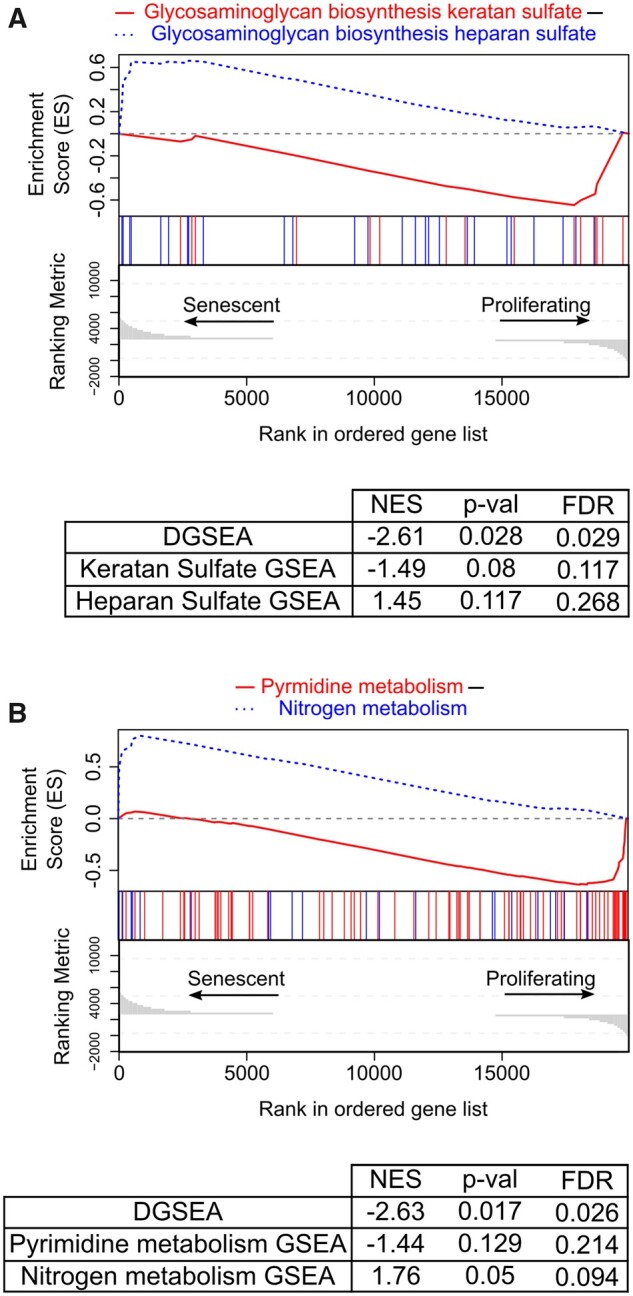
Untargeted DGSEA predicts differential metabolic activity in senescent and proliferating cells. 79 metabolic pathway gene sets from KEGG were queried with untargeted DGSEA to identify metabolic differences upon ionizing radiation-induced senescence in IMR90 cells. (A, B) Representative mountain plots of DGSEA comparing KEGG pathways glycosaminoglycan biosynthesis—keratan sulfate (hsa00533) to glycosaminoglycan biosynthesis—heparan sulfate (hsa00534) and pyrimidine metabolism (hsa00240) minus nitrogen metabolism (hsa00910)
3.7 Limitations of DGSEA
Since DGSEA is an adaptation of the original GSEA algorithm, many of the limitations of GSEA apply to DGSEA. Most notably, the method does not account for gene–gene correlations and can produce high Type I error (Goeman and Bühlmann, 2007). However, there has been some debate on whether gene–gene correlations can be ignored due to the significant variance inflation they produce on ESs (Tamayo et al., 2016). One advantage of GSEA is the intuitive ‘Enrichment Plot’ that allow the user to manually examine enrichment patterns. If the pattern of the enrichment does not appear biologically meaningful, the user can dismiss the result even if the results are statistically significant. Similar to GSEA, we have included in our R package a function to generate enrichment plots that the user can use to decide whether or not to discard DGSEA results in which the enrichment plot does not appear biologically meaningful, even if the P-value is statistically significant. As an example, we queried the senescence and proliferating RNAseq data with transcription factor target gene sets from the Broad Institute’s Molecular Signatures Database (Supplementary Fig. S7A). We found that the transcription factors HSF1 minus HSF2 were statistically significant (FDR q-value = 1.96e-4), but upon inspection of the enrichment plot, we noticed that the pattern for HSF1 was quite random (Supplementary Fig. S7B).
4 Discussion
Traditional gene set enrichment analyses are limited to examining one set of genes at a time. Our DGSEA method builds upon the original GSEA algorithm to measure the enrichment of two gene sets relative to each other. Our work thus builds on statistical frameworks to identify differentially expressed gene set pairs (Cho et al., 2009; Yaari et al., 2013). DGSEA can be run using traditional ranking metrics (e.g. fold-change between perturbation and control) or using single-sample methods across many samples (i.e. ssDGSEA). In this way, DGSEA provides similar usability to GSEA while serving as an extension to pathway analysis. Our DGSEA software is freely available at https://jamesjoly.github.io/DGSEA/ and can be installed directly as an R package.
To test the accuracy of DGSEA, we first used hypoxia as an example of a metabolic shift between glycolysis and OxPhos. We found that DGSEA accurately captured the metabolic tradeoff between upregulated glycolysis and downregulated OxPhos (Fig. 3). Notably, individual cell line analysis by DGSEA identified a metabolic switch in only 21 of 31 cell lines, a finding confirmed by the observation that the 10 other cell lines increased OxPhos in response to hypoxia. These surprising findings may be explained by the fact that some cell lines require concentrations of oxygen lower than 1% to suppress OxPhos (Chandel et al., 1997). Regardless, in cell lines with the classic hypoxia-induced metabolic shift, DGSEA correctly identified coordinated increases in glycolysis and decreases in OxPhos.
Having established the accuracy of DGSEA, we proceeded to analyze how DGSEA using the glycolysis and OxPhos pathways correlated with traditional metrics of cellular metabolism, namely lactate secretion and glucose consumption (Fig. 4). Our finding that DGSEA more accurately predicted lactate secretion rates than either GSEA with glycolysis or OxPhos alone confirmed that DGSEA accurately captured the tradeoff between upregulated glycolysis and downregulated OxPhos. Furthermore, we found that DGSEA NESs of adherent cancer cell lines were more correlated with intracellular lactate than either GSEA with glycolysis or OxPhos (Fig. 5). Although steady-state levels of lactate do not necessarily reflect the relative activity of glycolysis and OxPhos, they do suggest that DGSEA reflects the balance between conversion of pyruvate to lactate and acetyl-CoA for the TCA cycle. In addition, we found that DGSEA NESs were more significantly anticorrelated with intracellular levels of AMP than GSEA with glycolysis or OxPhos alone. Notably, AMP regulates both glycolysis and OxPhos through AMP-activated kinase (AMPK)-mediated activation of glycolytic enzymes and mitochondrial biogenesis (Herzig et al., 2018). Since the analyzed metabolomic data did not include ATP levels, we cannot calculate the AMP:ATP ratio to infer the activity of AMPK in these cell lines. However, taken together these results demonstrate that DGSEA analysis is highly informative for metabolic pathway activity and intracellular energetic state.
While useful as a targeted tool, we wanted to explore how DGSEA could be used when the user does not have a predefined hypothesis. We thus sought to use untargeted DGSEA to search for differential enrichment of metabolic pathway gene sets from KEGG in senescent and proliferating cells. We found 19 out of 3,081 pairs of metabolic pathway gene sets that exhibited differential activity in senescent versus proliferating cells. Of these 19 pairs of gene sets, 6 were uniquely significant in DGSEA but not individual GSEAs. One of these results was differential enrichment between the biosynthesis of the glycans keratan sulfate and heparan sulfate (Fig. 6). This result is particularly interesting since these molecules play critical roles in the extracellular matrix (Buczek-Thomas et al., 2019; Caterson et al., 2018) and changes to cell morphology are a hallmark of senescence (Herranz et al., 2018). These results demonstrate that DGSEA can be used to detect differential enrichment in gene set activity when there is not a predefined hypothesis.
In summary, DGSEA is a novel framework for analyzing the tradeoffs between two gene sets or pathways. As such, we believe that DGSEA will serve as a tool for analysis of a wide array of biological contexts. Furthermore, since GSEA has been demonstrated to work on other -omic layers, we anticipate that DGSEA will accurately capture tradeoffs in phospho-proteomic and metabolomic data. As such, DGSEA will serve as a useful tool to accurately quantify how tradeoffs between gene sets or pathways regulate biological control.
Funding
This work was supported by the Viterbi School of Engineering (NAG), a Mork Family Doctoral Fellowship (JHJ) and grant NIH National Institute of Arthritis and Musculoskeletal and Skin Diseases 1R01AR070245-01A1 (WEL).
Conflict of Interest: none declared.
Supplementary Material
Contributor Information
James H Joly, Mork Family Department of Chemical Engineering and Materials Science, University of Southern California, Los Angeles, CA 90089, USA.
William E Lowry, Department of Molecular, Cell, and Developmental Biology, Los Angeles, Los Angeles, CA 90095, USA; Broad Center for Regenerative Medicine, Los Angeles, Los Angeles, CA 90095, USA; Division of Dermatology, David Geffen School of Medicine, Los Angeles, Los Angeles, CA 90095, USA; Molecular Biology Institute, Los Angeles, Los Angeles, CA 90095, USA; Jonsson Comprehensive Cancer Center, University of California, Los Angeles, Los Angeles, CA 90095, USA.
Nicholas A Graham, Mork Family Department of Chemical Engineering and Materials Science, University of Southern California, Los Angeles, CA 90089, USA; Norris Comprehensive Cancer Center, University of Southern California, Los Angeles, CA 90089, USA.
References
- Baar M.P. et al. (2017) Targeted apoptosis of senescent cells restores tissue homeostasis in response to chemotoxicity and aging. Cell, 169, 132–147.e16. [DOI] [PMC free article] [PubMed] [Google Scholar]
- Buczek-Thomas J.A. et al. (2019) Hypoxia induced heparan sulfate primes the extracellular matrix for endothelial cell recruitment by facilitating VEGF-fibronectin interactions. Int. J. Mol. Sci., 20, 5065. [DOI] [PMC free article] [PubMed] [Google Scholar]
- Caterson B. et al. (2018) Keratan sulfate, a complex glycosaminoglycan with unique functional capability. Glycobiology, 28, 182–206. [DOI] [PMC free article] [PubMed] [Google Scholar]
- Cha S. et al. (2010) In situ proteomic analysis of human breast cancer epithelial cells using laser capture microdissection: annotation by protein set enrichment analysis and gene ontology. Mol. Cell. Proteomics MCP, 9, 2529–2544. [DOI] [PMC free article] [PubMed] [Google Scholar]
- Chandel N.S. et al. (1997) Cellular respiration during hypoxia role of cytochrome oxidase as the oxygen sensor in hepatocytes. J. Biol. Chem., 272, 18808–18816. [DOI] [PubMed] [Google Scholar]
- Cho S.B. et al. (2009) Identifying set-wise differential co-expression in gene expression microarray data. BMC Bioinformatics, 10, 109. [DOI] [PMC free article] [PubMed] [Google Scholar]
- Delfarah A. et al. (2019) Inhibition of nucleotide synthesis promotes replicative senescence of human mammary epithelial cells. J. Biol. Chem., 294, 10564–10578. [DOI] [PMC free article] [PubMed] [Google Scholar]
- Drake J.M. et al. (2012) Oncogene-specific activation of tyrosine kinase networks during prostate cancer progression. Proc. Natl. Acad. Sci. USA, 109, 1643–1648. [DOI] [PMC free article] [PubMed] [Google Scholar]
- Gmeiner W.H. et al. (2010) Genome-wide mRNA and microRNA profiling of the NCI 60 cell-line screen and comparison of FdUMP[10] with fluorouracil, floxuridine, and topoisomerase 1 poisons. Mol. Cancer Ther., 9, 3105–3114. [DOI] [PMC free article] [PubMed] [Google Scholar]
- Goeman J.J., Bühlmann P. (2007) Analyzing gene expression data in terms of gene sets: methodological issues. Bioinformatics, 23, 980–987. [DOI] [PubMed] [Google Scholar]
- Graham N.A. et al. (2017) Recurrent patterns of DNA copy number alterations in tumors reflect metabolic selection pressures. Mol. Syst. Biol., 13, 914. [DOI] [PMC free article] [PubMed] [Google Scholar]
- Hänzelmann S. et al. (2013) GSVA: gene set variation analysis for microarray and RNA-seq data. BMC Bioinformatics, 14, 7. [DOI] [PMC free article] [PubMed] [Google Scholar]
- Herranz N. et al. (2018) Mechanisms and functions of cellular senescence. J. Clin. Invest., 128, 1238–1246. [DOI] [PMC free article] [PubMed] [Google Scholar]
- Herzig S. et al. (2018) AMPK: guardian of metabolism and mitochondrial homeostasis. Nat. Rev. Mol. Cell Biol., 19, 121–135. [DOI] [PMC free article] [PubMed] [Google Scholar]
- Jain M. et al. (2012) Metabolite profiling identifies a key role for glycine in rapid cancer cell proliferation. Science, 336, 1040–1044. [DOI] [PMC free article] [PubMed] [Google Scholar]
- Kanehisa M. et al. (2014) Data, information, knowledge and principle: back to metabolism in KEGG. Nucleic Acids Res., 42, D199–D205. [DOI] [PMC free article] [PubMed] [Google Scholar]
- Lavallée-Adam M. et al. (2014) PSEA-Quant: a protein set enrichment analysis on label-free and label-based protein quantification data. J. Proteome Res., 13, 5496–5509. [DOI] [PMC free article] [PubMed] [Google Scholar]
- Li H. et al. (2019) The landscape of cancer cell line metabolism. Nat. Med., 25, 850–860. [DOI] [PMC free article] [PubMed] [Google Scholar]
- Majmundar A.J. et al. (2010) Hypoxia-inducible factors and the response to hypoxic stress. Mol. Cell, 40, 294–309. [DOI] [PMC free article] [PubMed] [Google Scholar]
- Subramanian A. et al. (2005) Gene set enrichment analysis: a knowledge-based approach for interpreting genome-wide expression profiles. Proc. Natl. Acad. Sci. USA, 102, 15545–15550. [DOI] [PMC free article] [PubMed] [Google Scholar]
- Tamayo P. et al. (2016) The limitations of simple gene set enrichment analysis assuming gene independence. Stat. Methods Med. Res., 25, 472–487. [DOI] [PMC free article] [PubMed] [Google Scholar]
- Yaari G. et al. (2013) Quantitative set analysis for gene expression: a method to quantify gene set differential expression including gene-gene correlations. Nucleic Acids Res., 41, e170–e170. [DOI] [PMC free article] [PubMed] [Google Scholar]
- Ye I.C. et al. (2018) Molecular portrait of hypoxia in breast cancer: a prognostic signature and novel HIF-regulated genes. Mol. Cancer Res. MCR, 16, 1889–1901. [DOI] [PMC free article] [PubMed] [Google Scholar]
Associated Data
This section collects any data citations, data availability statements, or supplementary materials included in this article.


