

Abstract
Low physical fitness has been found to be associated with many chronic diseases and medical conditions. Knowledge of secular trends in physical fitness is important to initiate countermeasures for addressing negative trends. The aim of this study was to analyze secular trends in health‐related muscular fitness in Slovenian children and adolescents between 1983 and 2014. Data were collected as part of “The Analysis of Children's Development in Slovenia (ACDSi)” study in 1983, 1993/94, 2003/04, and 2013/14. Anthropometry (body weight, height, BMI, and triceps skinfold) and muscular fitness (standing long jump, bent‐arm hang, and sit‐ups 60 s test) of 18730 (9168 female) students from primary and secondary schools were recorded. The secular trend was analyzed considering anthropometry. The results showed that anthropometric measures had an increasing trend and overall muscular fitness had a decreasing trend. Leg muscle power decreased over the decades in all age groups (relative difference between −1.5% and −2.6%), being more pronounced in boys. Arm muscle strength decreased in two younger age groups (range −21.1% to −42.7%, 6–10, and 11–14 years), but not in the oldest group (15–19 years), where the increase occurred in both genders (0.4% to 9.3%). In terms of decades, the largest negative changes (−30.1%) occurred from 1993/94 to 2003/04 and the smallest changes (−4.2%) from 2003/04 to 2013/14. The overall trend in repetitive core strength surprisingly increased (1.1% to 18.3%). There is a need to promote healthy lifestyles, raise parental awareness and use all government resources to redirect the negative trend in physical fitness.
Keywords: ANCOVA, bent‐arm hang, sit‐ups test, standing long jump, students
1. INTRODUCTION
Physical fitness is a good indicator of current health status in childhood and adolescence and can be used as a predictor of future health.1 Low physical fitness is found to be related to many chronic diseases and medical conditions, such as hypertension,2 type 2 diabetes,3 and all‐cause mortality,3, 4 but the best evidence has undoubtedly been found for cardiovascular disease (CVD).5
Any definition of physical fitness includes muscular fitness as one of its components.6 Results of previous studies suggest that reduced muscular fitness is associated with an increased risk of cardiovascular, premature, and all‐cause mortality.7, 8, 9 In addition, muscular fitness in adolescent men has been shown to be inversely associated with later CVD events and CVD mortality in middle age, independent of cardiorespiratory fitness, and other important confounding factors.10
The current situation is worrying in terms of the prevalence of low physical fitness and health determinants, which show an increasing trend.11 Knowledge of secular trends in physical fitness is important to understand the trends of health‐related outcomes and to introduce countermeasures for combating negative trends. An overview of the secular trends in physical fitness among children and adolescents in recent decades suggests a general decline, but this is not uniform across fitness components and across countries.12
There has been an almost universal decrease in aerobic capacity 13, 14, 15 and an increase in body mass index (BMI) 13, 14, 16 worldwide. In contrast, studies on different muscle groups and cohorts from different countries have shown different trends in muscular fitness. For instance, an increase in handgrip strength was accompanied by a decrease in leg muscle power.17 The reason for this could be increased body weight. Contrarily, despite the decrease in upper body strength, leg muscle power increased,18 which can be explained by the activation of the leg muscles to constantly bear body weight, which is growing over time.
The decreasing secular trend in muscular fitness has been observed in English,18 Canadian,19 Swedish,13 Lithuanian,16, 20 Spanish,21 Portuguese,22 and Serbian 23, 24 children and adolescents. In contrast, the muscular fitness of youth from Belgium,25 the Netherlands,26 and Finland27 appears to be more stable. However, changes in fitness trends can be influenced by the tests used and the population studied, so it is necessary to apply the same standardized procedures in the same population.16, 24
Although different original reports around the world show different trends depending on the geographical region, there is not much information on secular trends in muscular fitness among children and adolescents in Central Europe, especially in Slovenia, where children and adolescents are among the fittest and most active in the world.28 Moreover, only some studies controlled for anthropometric characteristics, such as body weight, height and BMI,13, 16, 20, 22 when observing trends in muscular fitness. The development of appropriate public health strategies requires regular analysis of fitness trends, especially among young people.21
The aim of the present study was to analyze secular trends in health‐related muscular fitness among Slovenian children and adolescents between 1983 and 2014. We hypothesized that the secular trend in all monitored components of muscular fitness in Slovenian children and adolescents between 1983 and 2014 would decrease over time.
2. MATERIALS AND METHODS
2.1. Study design
The data were collected within the framework of the comprehensive study “The Analysis of Children's Development in Slovenia (ACDSi)”29 ACDSi is a cross‐sectional, decennial study that began in 1970 at the Faculty of Sport of the University of Ljubljana as a research project focusing on developmental trends in physical characteristics and motor performance of children and adolescents from Slovenian primary and secondary schools. The study is interdisciplinary, investigating kinesiology, psychology, sociology, medicine, and physical anthropology. The participation of all students was anonymous and voluntary, and they could withdraw from the study at any time. After the children, adolescents, and their parents were fully informed about the objectives of the study and its protocol, written consent was obtained from the parents or legal guardians of all participating children and adolescents. Note that there were no major risks associated with any of the tests.
2.2. Participants
ACDSi is decennial study on the biological, psychological, and social development of children and adolescents, described in detail elsewhere.29 The study was approved by National Medical Ethics Committee (ID 138/05/13) and was in accordance with the principles embodied in the Declaration of Helsinki. In brief, ACDSi is a repeated cross‐sectional study that included 11 primary schools stratified by four types of settlement (from rural to rural‐industrial, industrial‐rural, and industrial) and 16 secondary schools stratified by three types of programs (grammar/general, technical, vocational). Due to data loss in the 1970 fire, measurements from 1983 onward are included in this study. The research project has been repeated four times: the first time in 1983 and then every ten years, in 1993/94, 2003/04, and 2013/14. In 1983, only primary schools were included, while from 1993/94 the sample was expanded with adolescents (aged 15 to 19). In total, the secular sample included 18730 participants (Figure 1; 9562 males and 9168 females). They were divided into three groups according to their age: 6–10, 11–14 and 15 to 19 years, similar to other studies investigating this topic.30, 31
FIGURE 1.
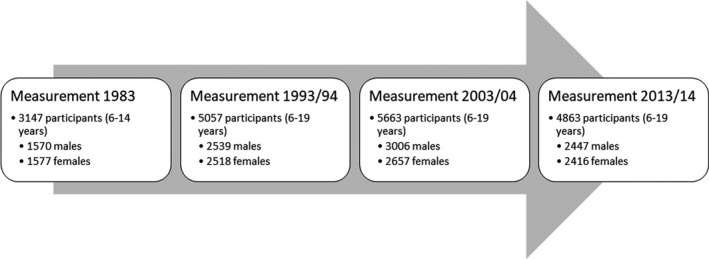
Sample size and structure for measurements in 1983, 1994/94, 2003/04, and 2013/14
2.3. Testing procedures
In each school, one of the physical education teachers was assigned as coordinator. The coordinators helped with obtaining consent forms and parent questionnaires, with setting up the measurement schedule, informing other teachers and school staff about the organization of the measurements, etc. The measurements were organized between 8.00 and 14.00 and lasted two or three days, depending on the sample size of each school. A group leader led each of the three groups (anthropometry, motor testing, and questionnaires) and a measurement leader took care of the coordination between all three groups. All measuring equipment that was not part of the standard school gym equipment was brought to the school by the research team. All testing equipment was routinely calibrated every day throughout the testing period.
Anthropometric measurements and fitness testing included many other tests, but for the purposes of the present study, data from body weight, height, BMI and triceps skinfold (anthropometry), standing long jump, bent‐arm hang, and sit‐ups 60 s test (muscular fitness tests) were used.
2.4. Anthropometric measurements
Only standard non‐invasive anthropometric measurements were taken. In all measurements, body height was measured to the nearest millimeter. Body weight was measured to the nearest 100 g. Participants were measured barefoot. The electronic scale was checked for accuracy every time it was moved. BMI was calculated as body weight per square meter of height (kg/m2). In addition, the skinfold of the triceps muscle was measured with 1 mm accuracy. For the last two measurements (2003/04 and 2013/14), we used the GPM 101 anthropometer (Siber & Hegner) to measure body height, the Tanita BWB‐800P portable electronic scale (Arlington Heights) to measure body weight, and the Harpenden fat caliper (Baty International Ltd.) to measure triceps muscle skinfold. For all previous measurements, the devices used were standardized with comparable accuracy.
2.5. Muscular fitness tests
The physical fitness tests were conducted and evaluated using the SLOfit32 and EUROFIT protocols.33 The following tests were included in the analysis according to the purpose of this study
2.5.1. Standing long jump
Muscular power was evaluated by jumping a distance from a standing starting position. The better of two attempts was recorded. The result was given in centimeters.
2.5.2. Bent‐arm hang
Muscular strength of the upper body was evaluated by the bent‐arm hang test. This test determines the maximum amount of time a participant can remain suspended by the arms while keeping his chin just above the bar. If the participant reached 2 min, the test was completed with the best result.
2.5.3. Sit‐ups 60 s test
The function of the abdominal musculature was assessed by the maximum number of sit‐ups achieved in 60 seconds. The test began in a supine position with the arms crossed on the chest and the palms resting on the opposite shoulders. The knees were bent at a 90° angle, and the heels and feet were flat on the mat. The assistant sat at the feet of person being measured and grasped them firmly below the knees with their hands. The participant had to rise to a sitting position with the elbows extended so that they touched the knees. The total number of correctly performed and completed sit‐ups within 60 seconds was counted.
2.6. Statistical analysis
Statistical Package for the Social Sciences—SPSS v 27.0 for Windows (IBM) was used for data processing and analysis. Boys and girls were analyzed separately. Data were tested for normality using the Kolmogorov‐Smirnov analysis for each age group (n = 3) and for both genders separately. Values outside the interval of ±3 SDs (outliers) were excluded from further analysis.16 It should be noted that all analyses were performed on three previously specified age groups: 6–10, 11–14, and 15–19 years. Analysis of covariance (ANCOVA) was used to compare differences in muscular fitness between the decades in each age and gender group. To eliminate the effect of anthropometry, body height, weight, and BMI were used as covariates, with the decade being a fixed factor. The Bonferroni post‐hoc test was used several times for comparisons in both types of analysis. A p‐value of 0.05 was considered statistically significant. Results in the figures are presented as means, while results in the tables are presented as percentages (relative differences).
3. RESULTS
Figure 2 presents the secular trends of body height, weight, BMI, and triceps skinfold of Slovenian schoolchildren over the three decades.
FIGURE 2.
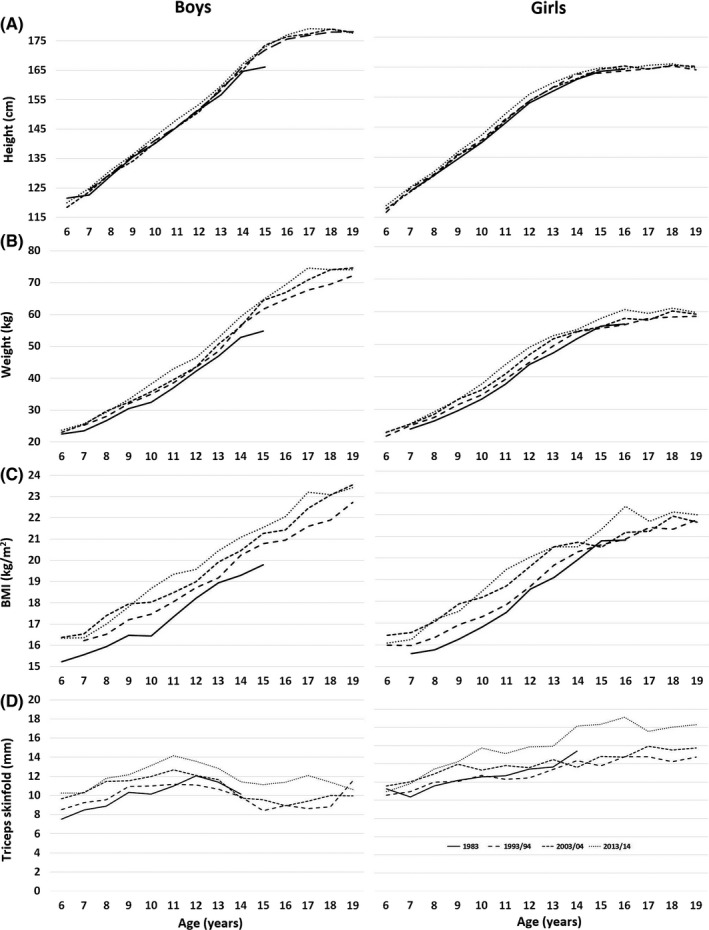
Height (A) weight (B) body mass index (BMI; C) and triceps skinfold (D) of schoolchildren aged 6 to 19 years in 1983 (solid line), 1993/34 (dashed line), 2003/04 (small dashed line), and 2013/14 (dotted line). The data are presented as mean values
As shown in Figure 2, anthropometric measures such as body height, weight, and consequently BMI, and triceps skinfold, have increased over the last three decades. We can see that the solid line representing the 1983 schoolchildren occupies the lowest position on almost the entire time axis, while the dotted line representing the 2013/14 schoolchildren occupies the highest position most often.
The results for muscular fitness are shown in Figure 3. Initial analysis showed that, as expected, boys generally achieved significantly higher results than girls. In addition, older students generally performed better than younger ones.
FIGURE 3.

Left‐hand panels show mean test scores for boys; right‐hand panels show scores for girls (A—standing long jump; B—bent‐arm hang; C—sit‐ups 60 s). Fitness results were controlled for height, weight, and BMI
Relative differences between each individual test result for all three tests, both genders and all age groups are shown in Table 1.
TABLE 1.
Relative secular changes in the standing long jump, bent‐arm hang and sit‐ups 60 s performance from 1983 to 2014
| Test | Gender | Age group | 1983‐1993/94 | 1983‐2003/04 | 1983‐2013/14 | 1993/94‐2003/04 | 1993/94‐2013/14 | 2003/04‐2013/14 |
|---|---|---|---|---|---|---|---|---|
| Standing long jump | Boys | 6–10 years | −0,3% | −2,3%** | −2,6%** | −1,9% | −2,3%* | −0,4% |
| 11–14 years | 0,7% | −0,9% | −2,1%** | −1,6%* | −2,7%** | −1,2% | ||
| 15–19 years | / | / | / | 0,0% | −2,3%** | −2,3%** | ||
| Girls | 6–10 years | 0,2% | 0,1% | −1,8%* | −0,1% | −2,0% | −1,9% | |
| 11–14 years | −0,9% | 0,5% | −1,5% | 1,4% | −0,6% | −2,0%* | ||
| 15–19 years | / | / | / | 0,3% | −1,6% | −1,8% | ||
| Bent‐arm hang | Boys | 6–10 years | −15,5%** | −41,0%** | −40,6%** | −30,1%** | −29,7%** | 0,6% |
| 11–14 years | −11,4%** | −25,1%** | −28,2%** | −15,4%** | −18,9%** | −4,2% | ||
| 15–19 years | / | / | / | 8,8%** | 9,3%** | 0,4% | ||
| Girls | 6–10 years | −23,5%** | −40,1%** | −42,7%** | −21,7%** | −25,1%** | −4,4% | |
| 11–14 years | −13,1%** | −27,4%** | −21,1%** | −16,5%** | −9,2% | 8,7%* | ||
| 15–19 years | / | / | / | 2,7% | 7,3%** | 4,5% | ||
| Sit‐ups 60 s | Boys | 6–10 years | / | / | / | −3,8% | 13,8%** | 18,3%** |
| 11–14 years | / | / | / | 7,3%** | 17,1%** | 9,2%** | ||
| 15–19 years | / | / | / | 6,9%** | 11,6%** | 4,4%** | ||
| Girls | 6–10 years | / | / | / | 1,1% | 2,2% | 1,1% | |
| 11–14 years | / | / | / | 11,5%** | 23,7%** | 10,9%** | ||
| 15–19 years | / | / | / | 13,8%** | 15,0%** | 1,1% |
p < 0.05
p < 0.01.
Table 1 and Panel A in Figure 3 reveals that the muscle power of children and adolescents manifested through standing long jump has been declining over the decades in all age groups. This was noticeable in both genders, but was more pronounced in boys. The biggest differences were found between the 2013/14 results and other results. Significant differences occurred in all age groups except in 6‐ to 10‐ and 11‐ to 14‐year‐old boys between 2003/04 and 2013/14 year. In addition, there were no significant differences between 1993/94 and 2013/14 in girls of all ages, although relative differences of up to 2% were shown in Table 1. However, the difference was on the border of significance for 6‐ to 10‐year old girls (p = 0.057).
The ANCOVA analysis revealed conspicuous results regarding muscle strength of children and adolescents’ arms. Namely, results of bent‐arm hang test showed that arm strength has declined over decades in two younger age groups (6–10 and 11–14 years), but not in the oldest group (15–19 years), where the exact opposite happened. They have gotten better over time. This was the case with both genders. Table 1 reveals an increase of 9.3% and 7.3% over the last two decades (for boys and girls, respectively). The largest decrease in arm muscle strength (up to 42.7%) was found between children aged 6–10 from 1983 to 2013/14.
Unlike the previous two components of muscular fitness, the overall trend was increasing in repetitive core muscle strength. The smallest difference in the last two decades was found between 6‐ and 10‐year old girls (2.2%), while the largest differences were revealed in 11‐ and 14‐year‐olds of both genders (17.1% for boys and 23.7% for girls). This trend has mostly flattened out over the last decade for both the youngest and the oldest girls.
4. DISCUSSION
The aim of this study was to analyze secular trends in muscular fitness among Slovenian children and adolescents from 1983 to 2014. Anthropometric measures such as height, weight, and consequently BMI, as well as triceps skinfold as an indicator of subcutaneous body fat, showed an increasing trend over the last three decades. Results of muscular fitness tests, controlled for height, weight, and BMI, showed that boys generally performed significantly better than girls and older students generally performed better than younger ones. Leg muscle power declined over the decades in all age groups. This was seen in both genders, but was more pronounced in boys. The results of the arm muscle strength test showed that they declined over decades in two younger age groups (6–10 and 11–14 years), but not in the oldest group (15–19 years), where just the opposite happened. They got better over time. This was the case for both genders. Note that, in terms of decades, the largest negative changes (−30.1%) were observed from 1993/94 to 2003/04 and the smallest changes (−4.2%) from 2003/04 to 2013/14. In contrast to the previous two components of muscular fitness, the overall trend for repetitive core muscle strength increased.
Anthropometric measures such as body height, weight, and BMI have been increasing over the past three decades (see Figure 2). In addition, the subcutaneous fat tissue, expressed by the skinfold of the triceps, has also had a growing secular trend. This was in line with the most studies that investigated anthropometric characteristics of the adolescents in the last three decades.13, 14, 16, 22, 23, 25, 26, 27
In terms of muscular fitness, leg power and arm strength appear to have declined, while core muscle strength has mostly increased over the last three decades. This relation of declining trends in arm and leg muscles was slightly different from other studies, where an increase in arm strength was accompanied by a decrease in legs power17 and vice versa.18 However, when observed separately, a decline in arms and legs muscular fitness is mostly in line with trends in other studies.16, 17, 18, 19, 20, 21, 24, 25, 26 Nevertheless, some other authors have found different results, where there has been an improvement in these fitness components.17, 18, 23 Note that all increasing trends in arm muscle strength have been found in the Handgrip test, which is a biomechanically different task compared with bent‐arm hang. This could be explained by the fact that body weight and body size are positively correlated with performance when acting against an external force,34 such as the handgrip in this case. At the same time, increased body weight could make it more difficult to perform the bent‐arm hang test. In addition, the differences were generally slightly more pronounced in boys than in girls. This was also in line with several previous studies.25, 26 This could be potentially explained by positive association between physical fitness and maturity in boys, but not in girls, even when body dimensions are controlled,35, 36 which suggests that maturity has an independent effect on physical fitness in boys.35, 36
In the youngest groups of both genders, there were no significant differences for all indicators of muscular fitness over the last decade, except for the increase in repetitive core strength in boys. These results are consistent with the findings of Sorić and co‐workers on secular trends in obesity among this age group of Slovenian children and adolescents. Namely, obesity has been decreasing among 7‐ to 10‐year‐old boys and girls since 2009 (APC = −1.9, 95% CI = −3.2 to −0.6 and APC = −1.6, 95% CI = −3.0 to −0.2, respectively).30 This can also be partly explained by the fact that the material conditions in Slovenia for physical education classes of young students have improved, as more new school gyms have been built and these students have also been given space to exercise. Despite the negligible differences in younger children in our study, we can assume that differences occur after puberty and during adolescence due to the demands of the modern lifestyle.
Despite increases in body height, weight, BMI, and subcutaneous fat mass and decreases in muscular power and strength of legs and arms, core strength increased in both genders. This secular trend pattern was presented in other studies as well.16, 20, 22, 27 The increasing trend in the sit‐ups test could also be found in some other European countries. A slight increase in the sit‐ups test was found in Lithuanian 16, 20 and Finnish,27 but not in Swedish 13 youth, where it decreased. In general, weight and body size are inversely associated with physical fitness tests, where the work is performed against gravity, such as standing long jump, sit‐ups, and bent‐arm hang tests.37, 38 On the other hand, as already mentioned, weight and body size are positively correlated to performance when performing against an external force.34, 37, 38 In addition to body size, maturity may also contribute to the explanation of the assessed results, since maturity is generally positively associated with physical fitness in adolescents.36 Nevertheless, such large differences certainly cannot be explained by early maturation alone. Thus, there are definitely other causes that cannot be controlled for. A marginal explanation could also be the common fashion among young people for a “flat” stomach, which encourages them to do abdominal training.20 Furthermore, an increase in sit‐ups test could be the result of school physical education programs that routinely allow children to exercise their abdominal muscles. It has been shown that the physical education system could affect future physical activity and lifestyle of schoolchildren,39 and consequently could influence health status and physical fitness in adulthood.
4.1. Strengths and limitations
The greatest strength of our study is a representative sample of children and adolescents followed over three decades using the same methodology. It is important to note that the sample was always evaluated from the same environments, which made the comparison between decades ecologically valid. In addition, the components of body size (height, weight, and BMI) were considered in the analysis of muscular fitness trends. We also analyzed three different components of muscular fitness, which allowed us to see that the changes in muscular fitness trends were not unilateral and equal across all dimensions. Nevertheless, regardless of the significance of the present results, several limitations of the current study should be noted. First, there are no data on the maturity level of the children, which could influence the results obtained. Second, we used one data point per decade. If we had more frequent data points (one per 5 years or one per year), this would give us more detailed insight into trend changes in muscular fitness. Third, the 1983 measurement lacks data for the sit‐ups 60 s test because the research team decided to perform other tasks at that time.
4.2. Conclusion
The aim of this study was to analyze secular trends in muscular fitness, when controlling for height, weight, and BMI, in a representative sample of Slovenian children and adolescents from 1983 to 2014. We hypothesized that the secular trend in all monitored components of muscular fitness would decrease over time. Leg power and arm strength decreased, while core muscle strength mostly increased over the last three decades. Therefore, we can conclude that the hypothesis was only partially confirmed. In addition, the differences were generally more pronounced in boys than in girls. In the youngest groups of children, there were no significant differences in any component of muscular fitness within the last decade, with the exception of core strength in boys. Since there was a reverse trend, that is, an increase in arm strength, in the oldest group (15–18 years), the causes need to be further investigated in future studies.
5. PERSPECTIVE
If this general negative trend continues, it will jeopardize the health and well‐being of future adults and result in serious socioeconomic consequences for humanity. There is a need to promote healthy lifestyle, raise awareness among parents and utilize all possible government resources such as schools, teachers, and media to stop and divert the negative trend of physical fitness. Teachers need to introduce more muscle fitness‐related content as children's leisure activities are no longer directing their development in this direction as much. Some studies show that policy mandates for physical education in schools may contribute to improvement in children's physical fitness.40 It is also recommended that teachers monitor changes in children's fitness and prepare interventions for the most vulnerable that go beyond the school campus—that is, parents and contact with the local environment (health system, sports clubs). Future research on secular trends in physical fitness should include maturation parameters and socioeconomic data in the analyses and consider more physical factors that may influence the validity of the obtained results.
CONFLICT OF INTEREST
There is no conflict of interest.
ACKNOWLEDGMENTS
Limited non‐specific funding was provided by the Slovenian National Research Agency (P5‐0142 Bio‐psycho‐social context of kinesiology). The study received valuable assistance from the Slovenian Olympic Committee and Elan Inventa, a sporting equipment manufacturer and supplier. We thank the patrons who supported this study: the Slovenian Federation of Sport Teacher Associations, the Section for School and High‐school Medicine at the Slovenian Medical Association, the Ministry of Health of the Republic of Slovenia, the Ministry of Education, Science and Sport of Slovenia, the Olympic Committee of Slovenia. A special thank you to Professor Emeritus Janko Strel, the previous principal investigator of the ACDSi study, for his valuable legacy and knowledge transfer of the study’s infrastructure. The authors thank the voluntary investigators, students, researchers, school coordinators, principals, children, adolescents, and parents involved in this ongoing, multidisciplinary study.
DATA AVAILABILITY STATEMENT
The data that support the findings of this study are available from the corresponding author upon reasonable request.
REFERENCES
- 1.Ortega FB, Ruiz JR, Castillo MJ, Sjöström M. Physical fitness in childhood and adolescence: a powerful marker of health. Int J Obes. 2008;32(1):1. [DOI] [PubMed] [Google Scholar]
- 2.Faselis C, Doumas M, Kokkinos JP, et al. Exercise capacity and progression from prehypertension to hypertension. Hypertension. 2012;60(2):333‐338. [DOI] [PubMed] [Google Scholar]
- 3.Do LC, Blair SN, Jackson AS. Cardiorespiratory fitness, body composition, and all‐cause and cardiovascular disease mortality in men. Am J Clin Nutr. 1999;69(3):373‐380. [DOI] [PubMed] [Google Scholar]
- 4.Faselis C, Doumas M, Panagiotakos D, et al. Body mass index, exercise capacity, and mortality risk in male veterans with hypertension. Am J Hypertens. 2012;25(4):444‐450. [DOI] [PubMed] [Google Scholar]
- 5.Högström G, Nordström A, Eriksson M, Nordström P. Risk factors assessed in adolescence and the later risk of stroke in men: a 33‐year follow‐up study. Cerebrovasc Dis. 2015;39(1):63‐71. [DOI] [PubMed] [Google Scholar]
- 6.Haskell WL, Montoye HJ, Orenstein D. Physical activity and exercise to achieve health‐related physical fitness components. Public Health Rep. 1985;100(2):202. [PMC free article] [PubMed] [Google Scholar]
- 7.Leong DP, Teo KK, Rangarajan S, et al. Prognostic value of grip strength: findings from the Prospective Urban Rural Epidemiology (PURE) study. Lancet. 2015;386(9990):266‐273. [DOI] [PubMed] [Google Scholar]
- 8.Silventoinen K, Magnusson PKE, Tynelius P, Batty GD, Rasmussen F. Association of body size and muscle strength with incidence of coronary heart disease and cerebrovascular diseases: a population‐based cohort study of one million Swedish men. Int J Epidemiol. 2009;38(1):110‐118. [DOI] [PubMed] [Google Scholar]
- 9.Ortega FB, Silventoinen K, Tynelius P, Rasmussen F. Muscular strength in male adolescents and premature death: cohort study of one million participants. BMJ. 2012;345:e7279. [DOI] [PMC free article] [PubMed] [Google Scholar]
- 10.Timpka S, Petersson IF, Zhou C, Englund M. Muscle strength in adolescent men and risk of cardiovascular disease events and mortality in middle age: a prospective cohort study. BMC Med. 2014;12(1):62. [DOI] [PMC free article] [PubMed] [Google Scholar]
- 11.Zaninotto P, Wardle H, Stamatakis E, Mindell J, Head J. Forecasting Obesity to 2010. Department of Health London; 2006.
- 12.Jürimäe T, Volbekiene V, Jürimäe J, Tomkinson GR. Changes in Eurofit test performance of Estonian and Lithuanian children and adolescents (1992–2002). Pediatric Fitness. 2007:50;129‐142. [DOI] [PubMed] [Google Scholar]
- 13.Westerstahl M, Barnekow‐Bergkvist M, Hedberg G, Jansson E. Secular trends in body dimensions and physical fitness among adolescents in Sweden from 1974 to 1995. Scand J Med Sci Sports. 2003;13(2):128‐137. [DOI] [PubMed] [Google Scholar]
- 14.Tomkinson GR, Olds TS, Kang SJ, Kim DY. Secular trends in the aerobic fitness test performance and body mass index of Korean children and adolescents (1968–2000). Int J Sports Med. 2007;28(04):314‐320. [DOI] [PubMed] [Google Scholar]
- 15.Tomkinson GR, Léger LA, Olds TS, Cazorla G. Secular trends in the performance of children and adolescents (1980–2000). Sport Med. 2003;33(4):285‐300. [DOI] [PubMed] [Google Scholar]
- 16.Venckunas T, Emeljanovas A, Mieziene B, Volbekiene V. Secular trends in physical fitness and body size in Lithuanian children and adolescents between 1992 and 2012. J Epidemiol Community Heal. 2017;71(2):181‐187. [DOI] [PubMed] [Google Scholar]
- 17.Dos Santos FK, Prista A, Gomes TNQF, et al. Secular trends in physical fitness of Mozambican school‐aged children and adolescents. Am J Hum Biol. 2015;27(2):201‐206. [DOI] [PubMed] [Google Scholar]
- 18.Cohen DD, Voss C, Taylor MJD, Delextrat A, Ogunleye AA, Sandercock GRH. Ten‐year secular changes in muscular fitness in English children. Acta Paediatr. 2011;100(10):e175‐e177. [DOI] [PubMed] [Google Scholar]
- 19.Tremblay MS, Shields M, Laviolette M, Craig CL, Janssen I, Gorber SC. Fitness of Canadian children and youth: results from the 2007–2009 Canadian Health Measures Survey. Heal reports. 2010;21(1):7. [PubMed] [Google Scholar]
- 20.Volbekienė V, Griciūtė A. Health‐related physical fitness among schoolchildren in Lithuania: A comparison from 1992 to 2002. Scand J Public Health. 2007;35(3):235‐242. [DOI] [PubMed] [Google Scholar]
- 21.Moliner‐Urdiales D, Ruiz JR, Ortega FB, et al. Secular trends in health‐related physical fitness in Spanish adolescents: the AVENA and HELENA studies. J Sci Med Sport. 2010;13(6):584‐588. [DOI] [PubMed] [Google Scholar]
- 22.Costa AM, Costa MJ, Reis AA, Ferreira S, Martins J, Pereira A. Secular trends in anthropometrics and physical fitness of young Portuguese school‐aged children. Acta Med Port. 2017;30(2):108‐114. [DOI] [PubMed] [Google Scholar]
- 23.Ignjatovic A, Ninkovic GB, Stevanovic N. Hand grip strength in 12 years old children in Serbia–changes over 50 years. Sport Bus. 2017;3:77‐80. [Google Scholar]
- 24.Kocić J, Stojanović D, Stanković S, et al. Muscle strength test performance changes over time in Serbian children. Acta Medica Median. 2019;58(2):154‐160. [Google Scholar]
- 25.Matton L, Duvigneaud N, Wijndaele K, et al. Secular trends in anthropometric characteristics, physical fitness, physical activity, and biological maturation in Flemish adolescents between 1969 and 2005. Am J Hum Biol Off J Hum Biol Assoc. 2007;19(3):345‐357. [DOI] [PubMed] [Google Scholar]
- 26.Runhaar J, Collard DCM, Singh AS, Kemper HCG, Van Mechelen W, Chinapaw M. Motor fitness in Dutch youth: differences over a 26‐year period (1980–2006). J Sci Med Sport. 2010;13(3):323‐328. [DOI] [PubMed] [Google Scholar]
- 27.Huotari PRT, Nupponen H, Laakso L, Kujala UM. Secular trends in muscular fitness among Finnish adolescents. Scand J Public Health. 2010;38(7):739‐747. [DOI] [PubMed] [Google Scholar]
- 28.Sember V, Morrison SA, Jurak G, et al. Results from Slovenia’s 2018 report card on physical activity for children and youth. J Phys Act Heal. 2018;15(Supplement 2):S404‐S405. [DOI] [PubMed] [Google Scholar]
- 29.Jurak G, Kovač M, Starc G. The ACDSi 2013–The Analysis of Children’s Development in Slovenia 2013: Study protocol. Anthropol Notebooks. 2013;19(3):123‐143. [Google Scholar]
- 30.Sorić M, Jurak G, Đurić S, Kovač M, Strel J, Starc G. Increasing trends in childhood overweight have mostly reversed: 30 years of continuous surveillance of Slovenian youth. Sci Rep. 2020;10:11022. [DOI] [PMC free article] [PubMed] [Google Scholar]
- 31.Colley RC, Clarke J, Doyon CY, et al. Trends in physical fitness among Canadian children and youth. ON, Canada: Stat Canada Ottawa; 2019. [DOI] [PubMed] [Google Scholar]
- 32.Strel J, Ambrožič F, Kondrič M, et al. Sports Educational Chart. Ministry of Education and Sport. 1997;1–89. [Google Scholar]
- 33.Europe C of. Eurofit: European test of physical fitness. 1988.
- 34.Watson AW, O’Donovan DJ. Factors relating to the strength of male adolescents. J Appl Physiol. 1977;43(5):834‐838. [DOI] [PubMed] [Google Scholar]
- 35.Round JM, Jones DA, Honour JW, Nevill AM. Hormonal factors in the development of differences in strength between boys and girls during adolescence: a longitudinal study. Ann Hum Biol. 1999;26(1):49‐62. [DOI] [PubMed] [Google Scholar]
- 36.Jones MA, Hitchen PJ, Stratton G. The importance of considering biological maturity when assessing physical fitness measures in girls and boys aged 10 to 16 years. Ann Hum Biol. 2000;27(1):57‐65. [DOI] [PubMed] [Google Scholar]
- 37.Malina RM, Beunen GP, Claessens AL, et al. Fatness and physical fitness of girls 7 to 17 years. Obes Res. 1995;3(3):221‐231. [DOI] [PubMed] [Google Scholar]
- 38.Beunen G, Malina RM, Ostyn M, Renson R, Simons J, Van Gerven D. Fatness, growth and motor fitness of Belgian boys 12 through 20 years of age. Hum Biol. 1983;55:599‐613. [PubMed] [Google Scholar]
- 39.Emeljanovas A, Malinauskas R, Valentine I, Hardman K. The relationship between the assessment system in physical education in the former soviet state of Lithuania and physical activity levels of adults. Kinesiol Int J Fundam Appl Kinesiol. 2015;47(2):242‐252. [Google Scholar]
- 40.Sanchez‐Vaznaugh EV, Sánchez BN, Rosas LG, Baek J, Egerter S. Physical education policy compliance and children’s physical fitness. Am J Prev Med. 2012;42(5):452‐459. [DOI] [PubMed] [Google Scholar]
Associated Data
This section collects any data citations, data availability statements, or supplementary materials included in this article.
Data Availability Statement
The data that support the findings of this study are available from the corresponding author upon reasonable request.