

Abstract
Heparan sulfates (HSs) are widely expressed glycans in the animal kingdom. HS plays a role in regulating cell differentiation/proliferation, embryonic development, blood coagulation, inflammatory response, and viral infection. The amount of HS and its structural information are critically important for investigating the functions of HS in vivo. A sensitive and reliable quantitative technique for the analysis of HS from biological samples is under development. Here, we report a new labeling reagent for HS disaccharides analysis, 6-amino-N-(2-diethylamino)ethyl quinoline-2-carboamide (AMQC). The AMQC-conjugated disaccharides are analyzed by LC-MS/MS in positive mode, significantly improving the sensitivity. The use of AMQC coupled with authentic 13C-labeled HS disaccharide internal standards empowered us to determine the amount and the disaccharide composition of the HS on a single histological slide. We used this method to profile the levels of HS in the plasma/serum and tissues/organs to assist the disease prognosis in two animal models, including the acetaminophen (APAP)-induced acute liver injury mouse model and the burn injury mouse model. The method may uncover the roles of HS contributing to the diseases as well as provide a potential new set of biomarkers for disease diagnosis and prognosis.
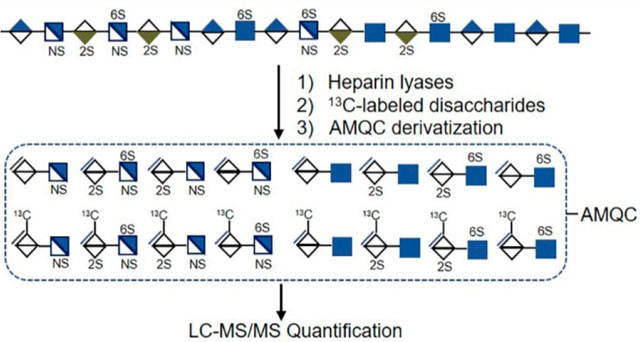
Graphical Abstract
Glycosaminoglycan belongs to a family of polydisperse linear polysaccharides ubiquitous on the cell surface and in the extracellular matrix. Glycosaminoglycans are attached to a core protein and form proteoglycans. The glycosaminoglycan families consist of heparan sulfate (HS), chondroitin sulfate, dermatan sulfate, keratan sulfate, and hyaluronan, which are distinguished with different disaccharide compositions. The HS polysaccharides on HS proteoglycans (HSPGs) interact with a variety of proteins such as growth factors, amyloid proteins, lipoproteins, inflammatory proteins, and microbial proteins. HS interaction with proteins contributes to the vital roles in many physiological and pathological processes including cancer progression, amyloid disease, inflammatory disease, and infectious disease.1,2 The disaccharide repeating unit of HS consists of a glucuronic acid (GlcA) or iduronic acid (IdoA) residue linked to a glucosamine (GlcN) residue. Both IdoA and GlcN residues carry sulfo groups. The functions of HS are governed by the sulfation patterns, the length of the polysaccharide chains, and the amount of HS. Knowing the composition of the sulfated disaccharide repeating unit and the quantity is essential for investigating the functions of HS.
The levels of HSPGs and location are regulated through controlling the expression of the core protein, while the structures of HS side chains are controlled through modulating the expression of HS biosynthetic enzymes.3 The qualitative and quantitative changes of HS are valuable biomarkers for disease diagnosis and prognosis.4,5 Many efforts have been made for structural characterization and quantification of HS at the disaccharide building block level.6–8 HS can be isolated from the cell surface, biological fluids (plasma/serum, urine, or cerebrospinal fluid), and whole tissues from healthy and diseased subjects. In recent years, attention has been given to characterize the HS from a limited amount of biological materials such as tissue slides for histological examination,9 plasma for syndecan shedding, or newborn dried blood spots for mucopolysaccharidosis diagnosis.10,11 We aim to develop a sensitive and quantitative analysis technique for detecting structural changes in HS from the biological samples with a high degree of confidence.
One common method to analyze HS is to perform disaccharide analysis, a sensitive way to analyze HS from biological samples.12 A HS sample is subjected to complete degradation by heparin lyases into eight disaccharide building blocks. The degraded sample is followed by high-performance liquid chromatography (HPLC), LC-mass spectrometry (LC-MS), and LC-MS/MS analyses to obtain the composition of the disaccharides. The sum of the individual HS disaccharide building blocks is equal to the amount of HS polysaccharides. In a bid to enhance the performance, several strategies have been developed. Introduction of fluorescence-labeling reagent at the reducing end of HS disaccharides by reductive amination not only improves the detection sensitivity of LC with fluorescence detection but also enhances the ionization efficiency of the disaccharides with MS as a detector.6,13,14 In addition, the labeled disaccharides display improved resolution on a C18 column using mobile phases that are compatible for a MS detector, giving the ability to separate different disaccharides with identical molecular mass. 2-Aminoacridone (AMAC), a labeling agent, is a successful example used in the analysis of HS.6,8,15
Efforts to improve the sensitivity of HS disaccharide analysis have been reported. One approach is to use a different labeling reagent to detect the disaccharides in the positive mode of the MS detector. Procainamide reportedly exhibits greater sensitivity in positive mode electrospray ionization (ESI)-MS using a HILIC column.16 Unlike AMAC, procainamide has a basic tertiary amine functional group with high proton affinity, resulting in better ionization efficiency in positive mode. Another alternative approach is to introduce a nano LC system to deliver the samples to the MS detector at a flow rate of nanoliters per minute. The condition minimizes the sample dilution from the LC separation, enhancing the sensitivity. The nano-HILIC column has been used for the analysis of HS extracted from tissue slides.17
In this study, we report a new label reagent, 6-amino-N-(2-diethylamino)ethyl quinoline-2-carboamide (AMQC), for disaccharide analysis of HS. The analysis is capable of being carried out at the positive mode of the MS detector. Introduction of AMQC has improved the MS ionization efficiency and detection sensitivity without compromising the resolution of the disaccharides on a C18 column. Coupled with 13C-labeled disaccharide calibrants, we demonstrate that the method is a rapid, sensitive, and accurate technique for HS disaccharide analysis. The method was successfully used to analyze the HS from tissue slides, plasma/serum, and whole tissue from two disease mice models. Our findings will offer a new tool to analyze HS from biological sources with high sensitivity, reliability, and accuracy to advance HS-related research.
EXPERIMENTAL SECTION
Materials.
2-Aminoacridone (AMAC) and sodium cyanoborohydride were purchased from Sigma-Aldrich (St. Louis, MO, USA). Eight 13C-labeled heparan sulfate disaccharide internal standards and 13C-labeled polysaccharide (NSK5P) were synthesized as described previously.8 Eight unlabeled native disaccharide standards were purchased from Iduron (Manchester, UK). Recombinant heparan lyase I, II, and III were expressed in E. coli and purified by a Ni–agarose column. DEAE-Sepharose Fast Flow resin was obtained from GE Healthcare (Chicago, IL, USA). Formalin-fixed paraffin-embedded (FFPE) mice tissue slides sectioned in the coronal plane at 5 μm thickness were prepared at the core facility of the University of North Carolina at Chapel Hill (Chapel Hill, NC, USA). Each slide contains 2–3 sections. A Pierce BCA Protein Assay Kit was purchased from Thermo Fisher Scientific (Waltham, MA USA). All reagents and chemicals were LC grade or LC-MS grade.
Synthesis of 6-Amino-N-(2-diethylamino)ethyl) Quinoline-2-carboamide (AMQC).
Synthesis of AMQC is a two-step protocol as described in the following synthetic scheme. The boc-protected quinoline-2-carboxylic acid was purchased from Princeton Biomolecular Research (Princeton, NJ, USA). First, quinoline-2-carboxylic acid was coupled with 2-diethylamino ethylamine using HATU in the presence of DIPEA. Next, boc protection was removed using dioxane HCl in MeOH after chromatographic C18 purification.
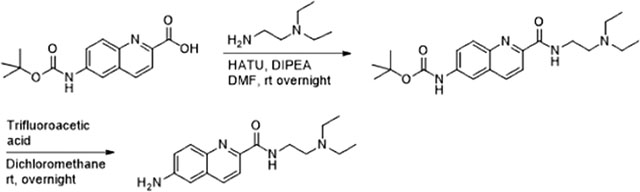
Hunig’s base (0.66 g, 0.88 mL, 5.16 mmol) was added to a solution of 6-((tert-butoxycarbonyl)amino) quinoline-2-carboxylic acid (0.55 g, 1.89 mmol, 1.1 equiv) in DMF (8 mL), and the reaction mixture was stirred for 15 min at 0 °C. A solution of 2-(diethylamino)ethylamine (0.2 g, 0.24 mL, 1.72 mmol, 1 equiv) in 1 mL of DMF was added to the above reaction mixture followed by addition of HATU (0.85 g, 2.23 mmol, 1.3 equiv). The reaction mixture was warmed at room temperature and stirred overnight. Reaction progress was monitored by TLC. The reaction was quenched using water and extracted with dichloromethane. The organic layer was combined, dried on MgSO4, and concentrated under diminished pressure. The Boc-intermediate product was chromatographed and afforded an off-white solid (0.35 g, 53%).
A 3 mL amount of dioxane was added to a solution of Boc intermediate (0.32 g, 0.83 mmol) in 6 mL of MeOH, and the reaction was stirred at room temperature for 24 h. The reaction was monitored by TLC. The solvent was removed under reduced pressure and chromatographed to afford a light-yellow syrup (0.28 g, quantitative). 1H NMR (600 MHz, MeOD) δ 8.38 (d, J = 8.4 Hz, 1H), 8.17 (d, J = 8.4 Hz, 1H), 8.13 (d, J = 9.0 Hz, 1H), 7.6–7.58 (m, 1H), 7.48 (s, 1H), 3.87 (t, J = 6.1 Hz, 2H), 3.46 (t, J = 6.1 Hz, 2H), 3.38–3.33 (m, 4H), 1.37 (t, J = 7.3 Hz, 6H); 13C NMR (150 MHz, MeOD) δ 167.5, 147.8, 143.7, 138.2, 132.2, 132.1, 131.5, 125.8, 120.4, 73.56, 72.44, 62.17, 52.56, 43.72, 35.91, 9.11; ESI-MS m/z [M + H]1+ calcd for C16H22N4O 286.18, found 287.03
Acetaminophen (APAP) Overdose Mice.
All animal experiments were approved by the Institutional Animal Care and Use Committee (IACUC) of the University of North Carolina at Chapel Hill (Chapel Hill, NC). Ten week old male C57BL6/J mice (~25 g in body weight) were fasted overnight (12–15 h) to deplete glutathione stores before APAP (Sigma) administration. Fresh APAP was dissolved in warm (~50 °C) sterile 0.9% sodium chloride solution (sterile saline), cooled to 37 °C, and injected intraperitoneally at 400 mg/kg. At 24 h after APAP overdose, plasma and liver tissue samples were collected and mice were euthanized. Plasma alanine aminotransferase, a biomarker for liver injury, was used to assess the liver damage after APAP overdose;18 therefore, the samples used in this work were at the peak of liver injury.
Murine Model of Burn Injury.
Burn injury in mice was performed according to a previously published model.19,20 Briefly, female C57B/6 mice at 6–8 weeks of age (15–20 g) were anesthetized with 475 mg/kg tribromoethanol (Avertin, Sigma-Aldrich). After confirmation of adequate anesthesia by toe pinch, the dorsum was shaved with electric clippers, it received a subcutaneous injection of 3 mg/kg morphine sulfate, and veterinary eye lubricant was applied. A copper rod heated to 100 °C in a water bath was applied for 10 s to the shaved dorsum in four separate locations creating a 20% total body surface area full-thickness burn. Mice were resuscitated on a heated pad until awake, at which point they were transferred to separate cages. Pain control after awakening was achieved through ad lib water with added oral morphine (60 μg/20 g mouse). Control mice (sham-burned) received the same treatment, except for the application of the heated copper rod. Mice were euthanized at varying time points (0.5, 2, 2.5, 4, and 8 h post burn and sham burn) using an isoflurane drop and subsequent cervical dislocation. Whole blood was collected via retro-orbital bleed, allowed to clot, and centrifuged at full speed for 30 min for serum isolation. Lungs were harvested and stored in dPBS. All samples were stored at −20 °C.
Animals were cared for in accordance with protocol 18–118, approved by the University of North Carolina IACUC, and housed in facilities accredited by the American Association for Accreditation of Laboratory Animal Care. Protocols were performed in keeping with the Guide for the Care and Use of Laboratory Animals of the National Institutes of Health.
Heparin Lyases Treatment of Tissue Slides.
Formalin-fixed paraffin-embedded (FFPE) mice liver, lung, and kidney tissue slides were selected in the study. The tissue slide was subject to a series of xylene and ethanol washes, 100% xylene wash for 3 times, each for 3 min, and then washed with 100%, 95%, 80%, and 50% ethanol and LC-MS water, each for 3 min. After the deparaffinization and rehydration, the tissue slides were submerged into 10 mM sodium citrate, pH 6.0, at 95 °C for 20 min. Then the tissue slides were placed into LC-MS-grade water to remove any residual sodium citrate.
Before the heparin lyases digestion, the spots were circled with an ImmEdge pen. Each tissue section (5 μm thick) was incubated with 10 μL of heparin lyases solution containing 5 mg/mL each of heparin lyase I, II, and III in a buffer of 100 mM sodium acetate/2 mM calcium acetate buffer (pH 7.0) and 0.1 mg/mL bovine serum albumin (BSA) at 37 °C. After 1 h, another 10 μL of heparin lyase solution was added to the same digestion spot. The digestion process was repeated for 3 cycles with the last cycle incubation overnight. The tissue slides were placed into a sealed, humidified box during the digestion. After overnight incubation, 8 μL of 13C-labeled heparan sulfate disaccharide internal standards mixture (1 ng/μL) was added into the digest spot. The digest mixture from the tissue slides was extracted with 10 μL of 0.3% ammonium hydroxide solution. The extraction steps were repeated 4 times. The extraction fractions were combined and centrifuged. The supernatant was recovered and freeze dried for AMQC labeling and LC-MS/MS analysis. The eight disaccharides derived from HS were quantified using the ratios of the peak area of the individual disaccharide to that of the corresponding 13C-labeled internal standard and multiplying a correction factor for this disaccharide (Supplementary Table S3). The total HS amount from the tissue slides was obtained by summing up the quantity of each disaccharide. The HS amount was normalized with the protein amount for each tissue slide (ng/mg).
Protein Quantification of Tissue Slides.
Protein quantification of the tissue slides was carried out as described previously by Guo et al.21 Briefly, the tissue section was deparaffinizated and rehydrated and underwent antigen retrieval. The tissue section was scraped off the slide and washed with protein extraction buffer including 20 mM Tris HCl buffer (pH 9.0) and 2% (w/v) SDS. The protein extraction solution was incubated on ice for 5 min. The solution was vortexed and boiled at 100 °C for 20 min and then incubated at 80 °C for 2 h. After centrifugation, the protein concentration was determined in the supernatant using the BCA assay.
Extraction and Quantitation Analysis of HS from Burn Mice Lung Tissue.
The extraction protocol was carried out as described previously.8 The procedure involved the homogenization and defatting of tissue, Pronase E digestion, DEAE column purification, and heparin lyases digest. The recovery calibrant, 13C-labeled NS K5P (N-sulfo heparosan), and 13C-labeled disaccharide internal standards were applied to quantify the HS from tissues.8
Isolation and Purification of HS from Plasma/Serum.
HS extraction from the plasma/serum samples was performed with protein precipitation, proteinase digestion, DEAE column purification, and heparin lyases depolymerization. The 13C-labeled NS K5P (20 ng) was added into 100 μL of mice plasma/serum before methanol precipitation of proteins. The sample (100 μL) was mixed with 1.5 mL of methanol vortex for 1 min, and protein was allowed to precipitate at room temperature for 10 min. The sample was centrifuged at 1000g for 10 min, and the supernatant was discarded. The pellet was digested with Pronase E (10 mg:1 g (w/w), Pronase E/protein) at 55 °C for 24 h to degrade the proteins. After digestion, the solution was boiled at 100 °C for 10 min and centrifuged at 14 000 rpm for 10 min to discard insoluble matter. HS was recovered from the digested solution using a micro DEAE-column (150 μL). The DEAE column mobile phase A contained 20 mM Tris, pH 7.5, and 50 mM NaCl, and mobile phase B contained 20 mM Tris, pH 7.5, and 1 M NaCl. After loading the digested solution, the column was washed with 10 column volumes of buffer A followed by 10 column volumes of buffer B to elute the HS fraction. The eluted HS was desalted using an YM-3KDa spin device, and the device was washed three times with deionized water. The spin device was reversed to recover the retentate from the membrane and washed three times with deionized water. The combined solution was dried before digestion with heparin lyases. A 100 μL amount of of enzymatic buffer (100 mM sodium acetate/2 mM calcium acetate buffer (pH 7.0) containing 0.1 g/L BSA) and 6 μL of enzyme cocktails containing 5 mg/mL each of heparin lyase I, II, and III was added to digest HS at 37 °C overnight. After digestion, a known amount 13C-labeled disaccharide internal standards was added to the digestion solution. The digestion solution was boiled at 100 °C for 10 min and centrifuged at 14 000 rpm for 10 min to recover the disaccharides. The supernatant was recovered and freeze dried before the AMQC-labeling step.
Labeling HS Disaccharides with AMQC and AMAC.
For the AMAC labeling, the disaccharides were mixed with 5 μL of 0.1 M AMAC solution in DMSO/glacial acetic acid (17:3, v/v) and incubated at room temperature for 15 min.13,15 For the AMQC labeling, the labeling reaction condition was nearly identical with the exception that 5 μL of 0.43 M AMQC was used in place of AMAC. To the reaction mixture, 5 μL of 1 M aqueous sodium cyanoborohydride (freshly prepared) was added. The reaction mixture was incubated at 45 °C for an additional 2 h. The reaction was centrifuged to obtain the supernatant for LC-MS/MS analysis.
LC-MS/MS optimization of AMQC/AMAC-Labeled Disaccharides.
The Multiple Reaction Mode (MRM) sensitivity was optimized using the AMQC/AMAC-labeled disaccharide standards at a concentration of 1 μg/mL. A stable spray was achieved before starting MRM optimization. Due to the ion source parameters being flow rate dependent, all disaccharides were optimized under the conditions of LC. Ion source parameters including gases (sheath, Aux, and sweep), spray voltage, vaporizer temperature, and ion transfer temperature were optimized at first to achieve the maximum stable response of precursor ion. For the AMQC-labeled disaccharides in the positive mode, the ion source parameters as follows: spray voltage 1500 V, sheath gas 40 Arb, Aux gas 15 Arb, sweep gas 0 Arb, vaporizer temperature 350 °C, and ion transfer temperature 250 °C. For the AMAC-labeled disaccharides in the negative mode, the ion source parameters are as follows: spray voltage 4000 V, sheath gas 45 Arb, Aux gas 15 Arb, sweep gas 0 Arb, vaporizer temperature 350 °C, and ion transfer temperature 320 °C. Optimization of the MRM transition was performed by autotuning the TSQ Fortis LC-MS/MS system. Parameters such as argon collision pressure, collision energy, and tube lens were chosen to tune and obtain maximum sensitivity and selectivity of the product ion for each disaccharide. The final optimized MRM transition parameters are listed in the Supplementary Tables S1 and S2.
LC-MS/MS Analysis of HS Disaccharides.
The analysis of AMAC- and AMQC-labeled disaccharides was carried out on a Vanquish Flex UHPLC System (Thermo Fisher Scientific) coupled with TSQ Fortis triple-quadrupole mass spectrometry as the detector. A C18 column (Agilent InfinityLab Poroshell 120 EC-C18 2.7 μm, 4.6 × 50 mm) was used to separate the AMAC- and AMQC-labeled disaccharides. For the AMAC-labeled disaccharides, buffer A contained 50 mM ammonium acetate in water and buffer B was methanol. The elution gradient was performed as follows: the concentration of buffer B was increased from 5% to 45% in 10 min, followed by isocratic 100% buffer B in 4 min with a flow rate of 0.3 mL/min. For the AMQC-labeled disaccharides, buffer A contained 50 mM ammonium formate in water, and buffer B was methanol. A linear gradient of buffer B from 5% to 23% in 8 min was employed, followed by a gradient of buffer B from 23% to 100% in 8 min, and isocratic 100% buffer B in 4 min at a flow rate of 0.3 mL/min. An online triple-quadrupole mass spectrometry detector was operated in the MRM mode. For the AMAC-labeled disaccharides, ESI-MS analysis was performed in the negative mode using the following parameters: negative ion spray voltage 4.0 kV, sheath gas 45 Arb, Aux gas 15 arb, ion transfer tube temperature 320 °C, and vaporizer temperature 350 °C. For the AMQC-labeled disaccharides, ESI-MS analysis was performed in the positive mode using the following parameters: positive ion spray voltage 1.5 kV, sheath gas 40 Arb, Aux gas 15 arb, ion transfer tube temperature 250 °C, and vaporizer temperature 350 °C. TraceFinder software was applied for data processing. After LC-MS/MS analysis, quantitative determination of HS was performed by comparing the peak area of each target disaccharide to the corresponding 13C-labeled internal standard and multiplying a correction factor for each individual disaccharide. The recovery yield of HS from plasma/serum was evaluated based on a comparison of the amount of recovery calibrant disaccharide in the plasma/serum samples and the control sample.8 A correction factor was used to correlate the LC-MS/MS signals with the amount between the native disaccharide counterpart and the 13C-labeled disaccharide standard. The factor was obtained from the linearity analysis. The concentration of each disaccharide was calculated using the peak area ratio of the native disaccharide and corresponding 13C-labeled disaccharide standard and predetermined correction factor. A list of the correction factors for each disaccharide is shown in Supplementary Table S3.
Determination of Linearity and Limit of Detection (LOD).
The assessment of linearity and LOD were performed using eight pure native HS disaccharides and 13C-labeled disaccharide standards. A series of known concentrations of native HS disaccharide standards (from Iduron) was mixed with a fixed concentration of 13C-labeled disaccharide standards. After AMQC/AMAC label and LC-MS/MS analysis, the peak area of native disaccharide was normalized to the peak area of the corresponding 13C-labeled disaccharide. The normalized peak area was plotted against the anticipated concentrations of native disaccharide. Each calibration concentration contained three replicates, and the linearity of the calibration curve was assessed by linear regression. The LOD is defined as the lowest concentration of the analyte in the solution that can be reliably detected. LOD was assessed based on the ratio of the signal to noise (S/N).22 The S/N values were obtained by comparing the signals from the known amount of disaccharides with blank control. A value of >3 is generally considered acceptable for estimating the detection limit.
RESULTS AND DISCUSSION
Comparison of the Analysis of AMAC- and AMQC-Labeled Disaccharides by LC-MS/MS.
A highly sensitive method to analyze the endogenous HS composition is of great interest to many in the glycobiology field. One possible approach is to use positive mode detection for the MS detector during LC-MS/MS analysis. Given the highly negatively charged property of HS, the negative mode is currently used during LC-MS or LC-MS/MS analysis. The AMAC (Figure 1a) tag has been routinely performed for HS disaccharides characterization. We attempted to search for a new tag that is amenable to detect the disaccharides using positive mode. Waters Corp. reported a series of chemicals with tertiary amine function groups that are well suited for the analysis of N-linked glycans using the positive mode.23 The RapiFluor-MS derivatization agent introduced by Waters indicates its high efficiency and sensitivity for N-glycan characterization in the positive mode. The improved intensity and sensitivity of RapiFluor-MS labeled N-glycan is attributed to higher ionization efficiency produced by a basic tertiary amine in the structure. Inspired by the findings, we synthesized a labeling reagent, 6-amino-N-(2-diethylamino)ethyl quinoline-2-carboamide (AMQC) (Figure 1b), and examined the potential utilities in HS disaccharide analysis.
Figure 1.
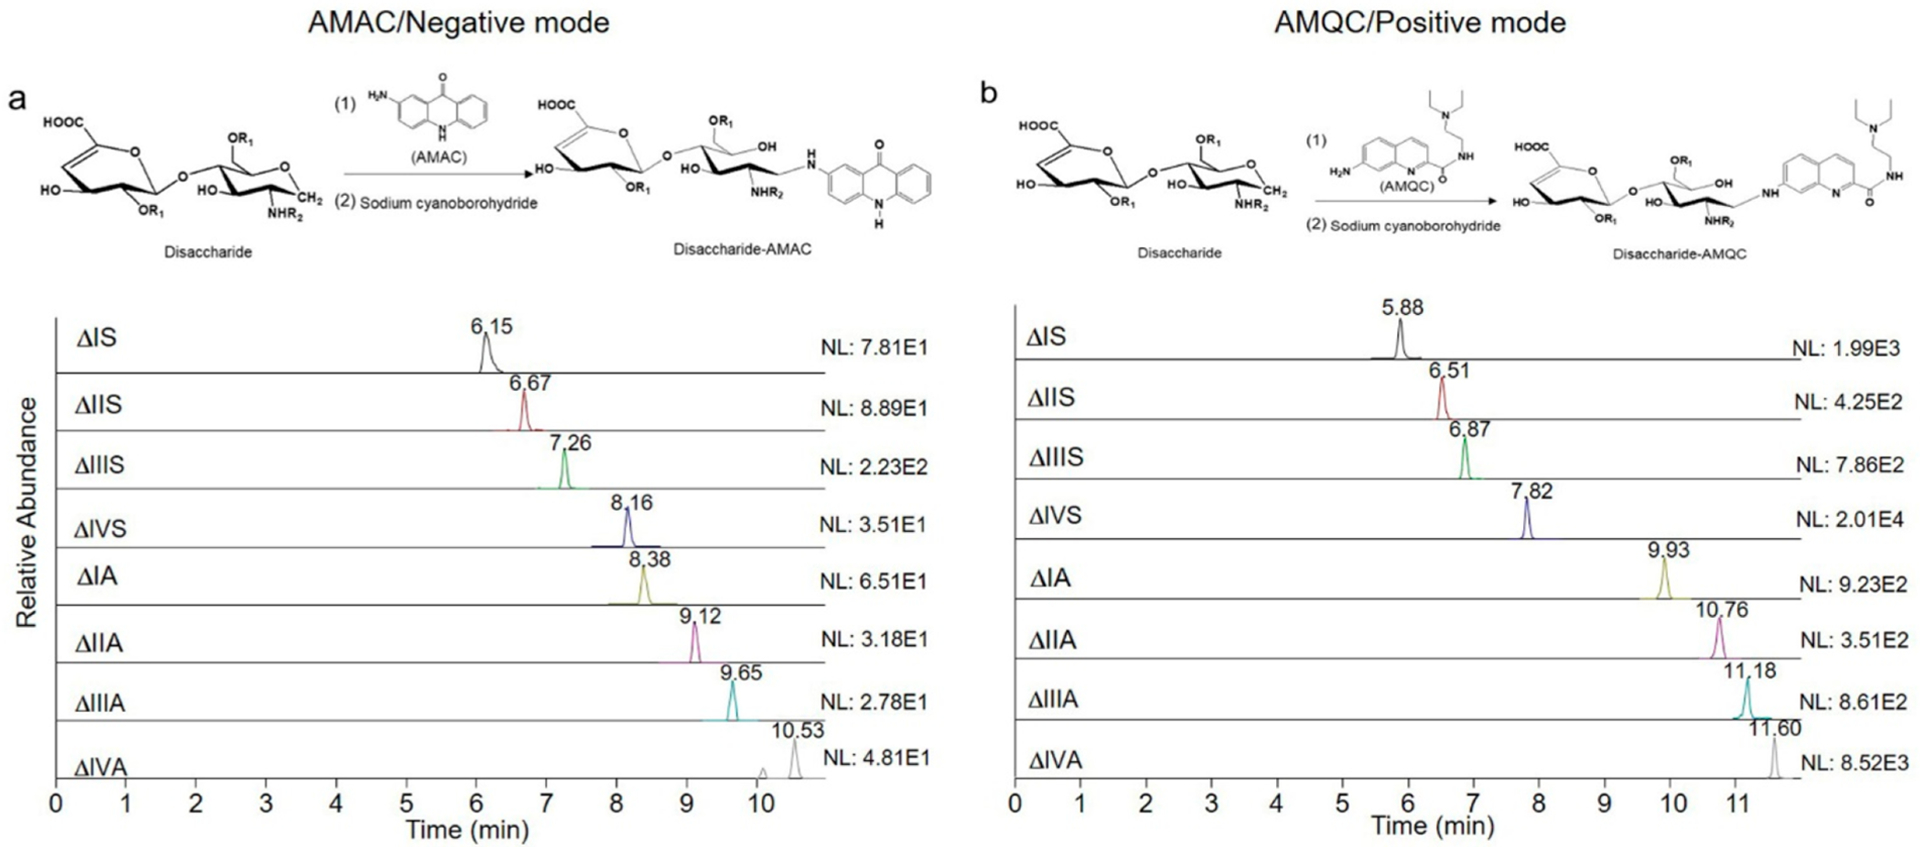
LC-MS/MS analysis of AMAC- and AMQC-labeled eight heparan sulfate disaccharides. (a) MRM ion chromatograms of AMAC-labeled disaccharides. (b) MRM ion chromatograms of AMQC-labeled disaccharides. Comparison is based on the injection of 42 pg of individual disaccharide standard for the LC-MS/MS analysis. NL: normalized intensity.
We compared the sensitivity and resolution of AMQC- and AMAC-labeled HS disaccharides using the LC-MS/MS method, where AMQC-labeled disaccharides were detected using positive mode and AMAC-labeled counterparts were detected using negative mode. A total of eight HS disaccharides was involved in this study (Table 1). As depicted in Figure 1, the C18 column offered adequate separation for the AMQC-labeled eight disaccharides, and the resolution was comparable to AMAC-labeled disaccharides. Ammonium formate was employed in the running buffer for resolving AMQC-labeled disaccharides, offering better separation and cleaner mass spectra than when using ammonium acetate. The linear calibration curve was established to evaluate the suitability of the AMQC-based LC-MS/MS method for the quantification of HS. The calibration curve of AMQC-labeled disaccharides covered the range of 0.2–26 μg/mL with the linear regression equation y = 1.1981x − 0.0731 (R2 = 0.9999) (Figure S1). Both disaccharides and bovine kidney HS were chosen to determine the quantification accuracy. The accuracy is from 88.6% to 97.9% for disaccharides and from 82.2% to 111.2% for bovine kidney HS. The result demonstrated that both the AMQC and the AMAC methods offer adequate quantitation capability (Supplementary Table S4). On comparing the LOD of the eight disaccharides labeled with AMQC and with AMAC, we discovered that the use of AMQC tag improves the sensitivity by 20–320-fold, depending on the structures of the disaccharides (Table 2). Our findings are consistent with the fact that positive mode elevates sensitivity.16 Antia and colleagues analyzed procainamide-tagged HS disaccharides using positive mode detection,15 but the eight disaccharides were not fully resolved by the C18 column. From our study, we conclude that AMQC is a well-suited labeling agent for HS disaccharide analysis for two reasons: positive mode detection and adequate resolution by LC using a C18 column.
Table 1.
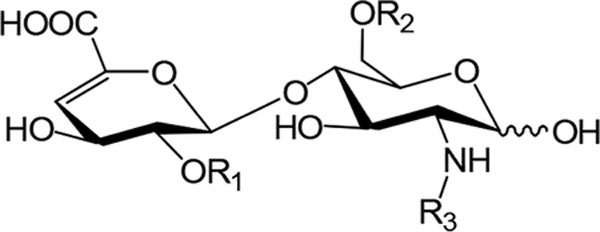
Chemical Structures of Individual Disaccharides from HS
| |||
| disaccharides | R1 | R2 | R3 |
|---|---|---|---|
| ΔIS | −SO3− | −SO3− | −SO3− |
| ΔIIS | −H | −SO3− | −SO3− |
| ΔIIIS | −SO3− | −H | −SO3− |
| ΔIVS | −H | −H | −SO3− |
| ΔIA | −SO3− | −SO3− | −COCH3 |
| ΔIIA | −H | −SO3− | −COCH3 |
| ΔIIIA | −SO3− | −H | −COCH3 |
| ΔIVA | −H | −H | −COCH3 |
Table 2.
Retention Times and LOD of AMQC- and AMAC-Labeled HS Disaccharides for LC-MS/MS Analysis
| retention time (min) | LOD (ng/mL) | |||
|---|---|---|---|---|
| disaccharides | AMQC | AMAC | AMQC | AMAC |
| ΔIS | 5.88 | 6.37 | 1.0 | 20 |
| ΔIIS | 6.52 | 6.70 | 1.0 | 80 |
| ΔIIIS | 6.87 | 7.24 | 1.0 | 80 |
| ΔIVS | 7.82 | 8.13 | 1.0 | 320 |
| ΔIA | 9.93 | 8.38 | 1.3 | 20 |
| ΔIIA | 10.76 | 9.08 | 3.0 | 160 |
| ΔIIIA | 11.18 | 9.62 | 1.0 | 80 |
| ΔIVA | 11.60 | 10.45 | 1.0 | 40 |
Profiling HS from Tissue Slides.
The utility of the highly sensitive method involving the AMQC-labeling agent was demonstrated by analyzing HS from histological slides. We also added the quantitative capability by including 13C-labeled disaccharide standards. Here, liver-, kidney-, and lung-tissue slides from mice were chosen to perform the analysis (Figure 2). We analyzed five consecutive slides from the same tissue with a thickness of 4–5 μm. For each slide, a procedure to measure the amount of protein from each tissue slide was also introduced (Figure 2). The amount of HS was normalized to the amount of protein from the slide. The amount of total HS from the tissue slides was determined to be as follows: 712.4 ± 138.8 ng/mg (n = 5) from a single liver slide, 2673.6 ± 509.9 ng/mg (n = 5) from a single kidney slide, and 4428.8 ± 949.7 ng/mg (n = 5) from a single lung slide (Figure 2). Clearly, there is a statistically significant difference in the amount of HS from the liver, kidney, and lung slides. This conclusion is concordant with the analysis results from the whole tissue, namely, the amount of HS (ng/mg) follows the order liver < kidney < lung.8 Results from the analysis also revealed the composition of eight disaccharides from the HS. For the individual disaccharide, the mass percentage of five disaccharides, including ΔIS, ΔIIS, ΔIIIS, ΔIIA- and ΔIIIA- in the lung tissue slide has a significant difference from the liver and kidney tissue slides (Supplementary Table S5).
Figure 2.
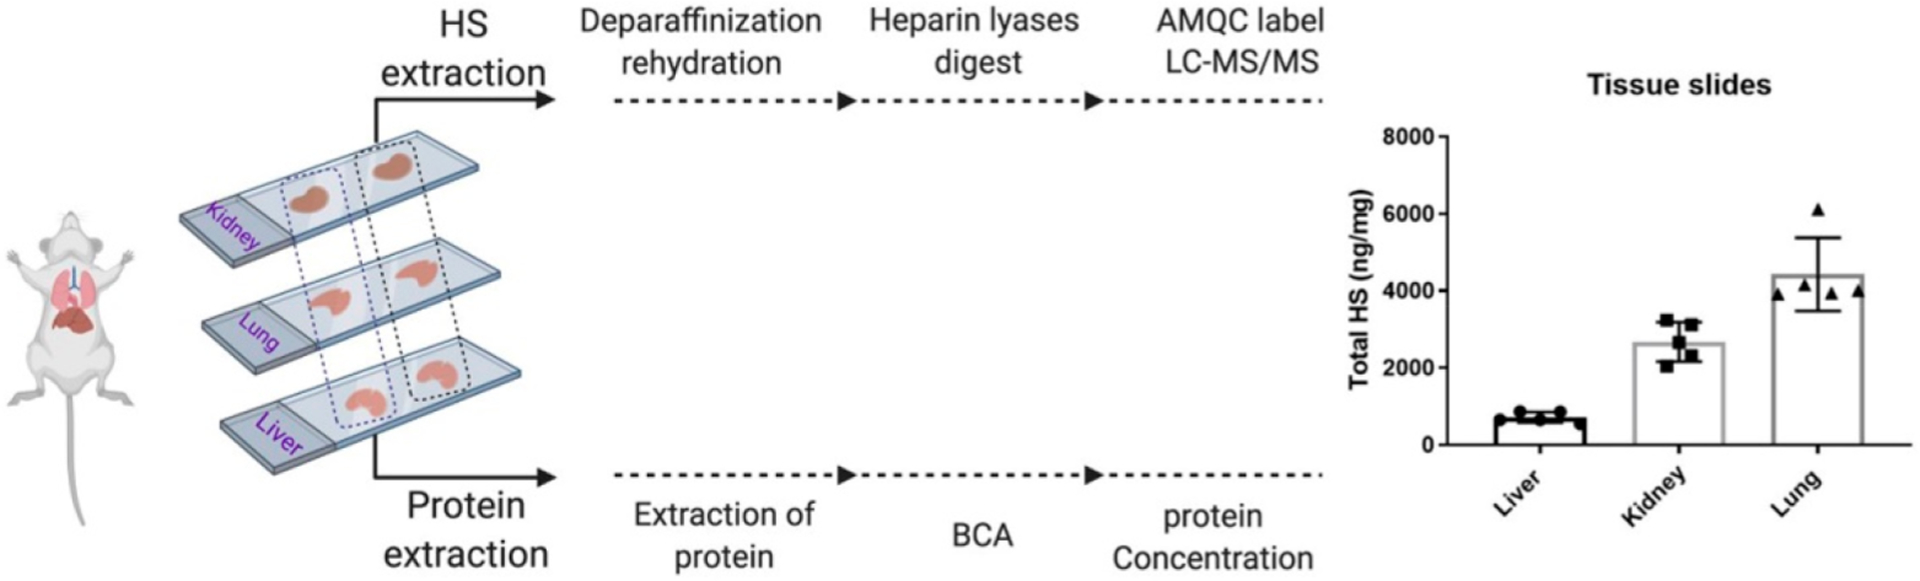
Workflow for the analysis of HS from FFPE tissue slides of mice liver, kidney, and lung. Actual amount of HS from histological slides is shown in the bar graph. Quantity of HS was normalized to the total amount of protein of each slide (ng/mg). Data presented are the average of three determinations from five consecutive slides.
Quantitation and compositional profiling of HS from histological slides has advantages over the analysis of HS from whole tissues. The information could uncover the spatial and temporal expression level of HS, which may correlate to other biological readings, i.e., microscopic image, histological staining, etc. For example, the analysis of HS from an entire tissue will only obtain the average level of HS in the tissue. Our method provides enough sensitivity and quantitative ability to measure the concentration of HS at the desired position of a given tissue. Although previous studies have reported detecting and quantifying HS from histological slides,17 the method involved the use of a HILIC column and nano LC system. Our study uses a standard LC system and a robust C18 column to complete the analysis of HS. Use of a standard LC and C18 column reduces the operating cost, and the analysis can be performed in a wide range of MS facilities. Furthermore, the addition of 13C-labeled disaccharide internal standards elevates the accuracy and reliability.
Determination of the Plasma/Serum HS and Lung HS from Disease Mouse Models.
Our initial attempts to determine the plasma concentration of HS discovered that the plasma proteins severely interfere with the method. When HS (20 ng) was spiked into the goat plasma (100 μL), we only obtained signals for three disaccharides, ΔIVS, ΔIIA, and ΔIVA, whereas seven disaccharides were detected in the control (HS in 100 μL of water) (Table 3). Such signal suppression was not unexpected as a previous report indicated that the biological matrix impacts the ionization efficiency as well as the LC resolution.24 Comparing the response values as measured by the peak area of the internal 13C-labeled disaccharide standards further confirmed our assertion. For example, the 13C-labeled disaccharide ΔIS’s response value in the control sample (water) was 234 769, but the value for the same disaccharide was reduced to 2889 in the plasma sample, an 81.2-fold decrease (Table 3). To eliminate the plasma protein interference, we introduced a purification step to clean up the HS from plasma (Figure 3a). After purification, the response values for the internal 13C-labeled disaccharides were comparable to those in the control, consequently allowing us to identify all seven unlabeled native disaccharides. We also compared the response value of the individual disaccharide with 5, 10, and 40 ng of HS in the goat plasma (100 μL) (Supplementary Tables S6–S8). Introducing the purification step clearly improved the detection sensitivity of the disaccharides in all tested concentrations. Our data suggest that the biological matrix, i.e., plasma proteins, should be removed in order to get accurate measurement for HS. The use of internal 13C-labeled disaccharide standards in addition to the quantitation capability offers a simple way to assess the quality of the data. For those reasons, the DEAE-column purification step was applied for HS extraction from plasma/serum samples in all subsequent experiments.
Table 3.
Results of Disaccharide Analysis of HS in the Plasma with or without Purification
| peak areas of individual disaccharides | |||||||||
|---|---|---|---|---|---|---|---|---|---|
| amount (ng)a | plasma | water | DEAE | ||||||
| disaccharides | plasmab | waterc | DEAEd | 12C | 13C | 12C | 13C | 12C | 13C |
| ΔIS | 0.00 | 0.39 | 0.28 | 0 | 2889 | 17 483 | 234 769 | 23338 | 270 436 |
| ΔIIS | 0.00 | 1.71 | 1.54 | 0 | 7431 | 12 541 | 149 988 | 9904 | 106 508 |
| ΔIIIS | 0.00 | 0.74 | 2.52 | 0 | 3612 | 3920 | 123 753 | 17 885 | 78 006 |
| ΔIVS | 3.64 | 3.87 | 2.93 | 65 849 | 284 230 | 496 806 | 4 903 568 | 563 280 | 3 405 770 |
| ΔIA | 0.00 | 0.00 | 0.00 | 0 | 2585 | 0 | 14 867 | 0 | 10 588 |
| ΔIIA | 0.00 | 0.92 | 1.53 | 0 | 5180 | 2565 | 37 320 | 2551 | 26 931 |
| ΔIIIA | 4.04 | 0.21 | 1.82 | 10 220 | 4809 | 20 077 | 77 216 | 11 110 | 58 656 |
| ΔIVA | 6.64 | 7.22 | 10.27 | 49 647 | 117 029 | 123 048 | 863 642 | 322 312 | 711 276 |
A total of 20 ng of HS was mixed with 100 μL of goat plasma or with 100 μL of water.
The sample was directly subjected to disaccharide analysis.
The sample served as a control.
The sample was digested by Pronase E and purified by a DEAE column prior to disaccharide analysis.
The amount of disaccharide was different from that in the control (water) because there was residual HS in the goat plasma.
Figure 3.
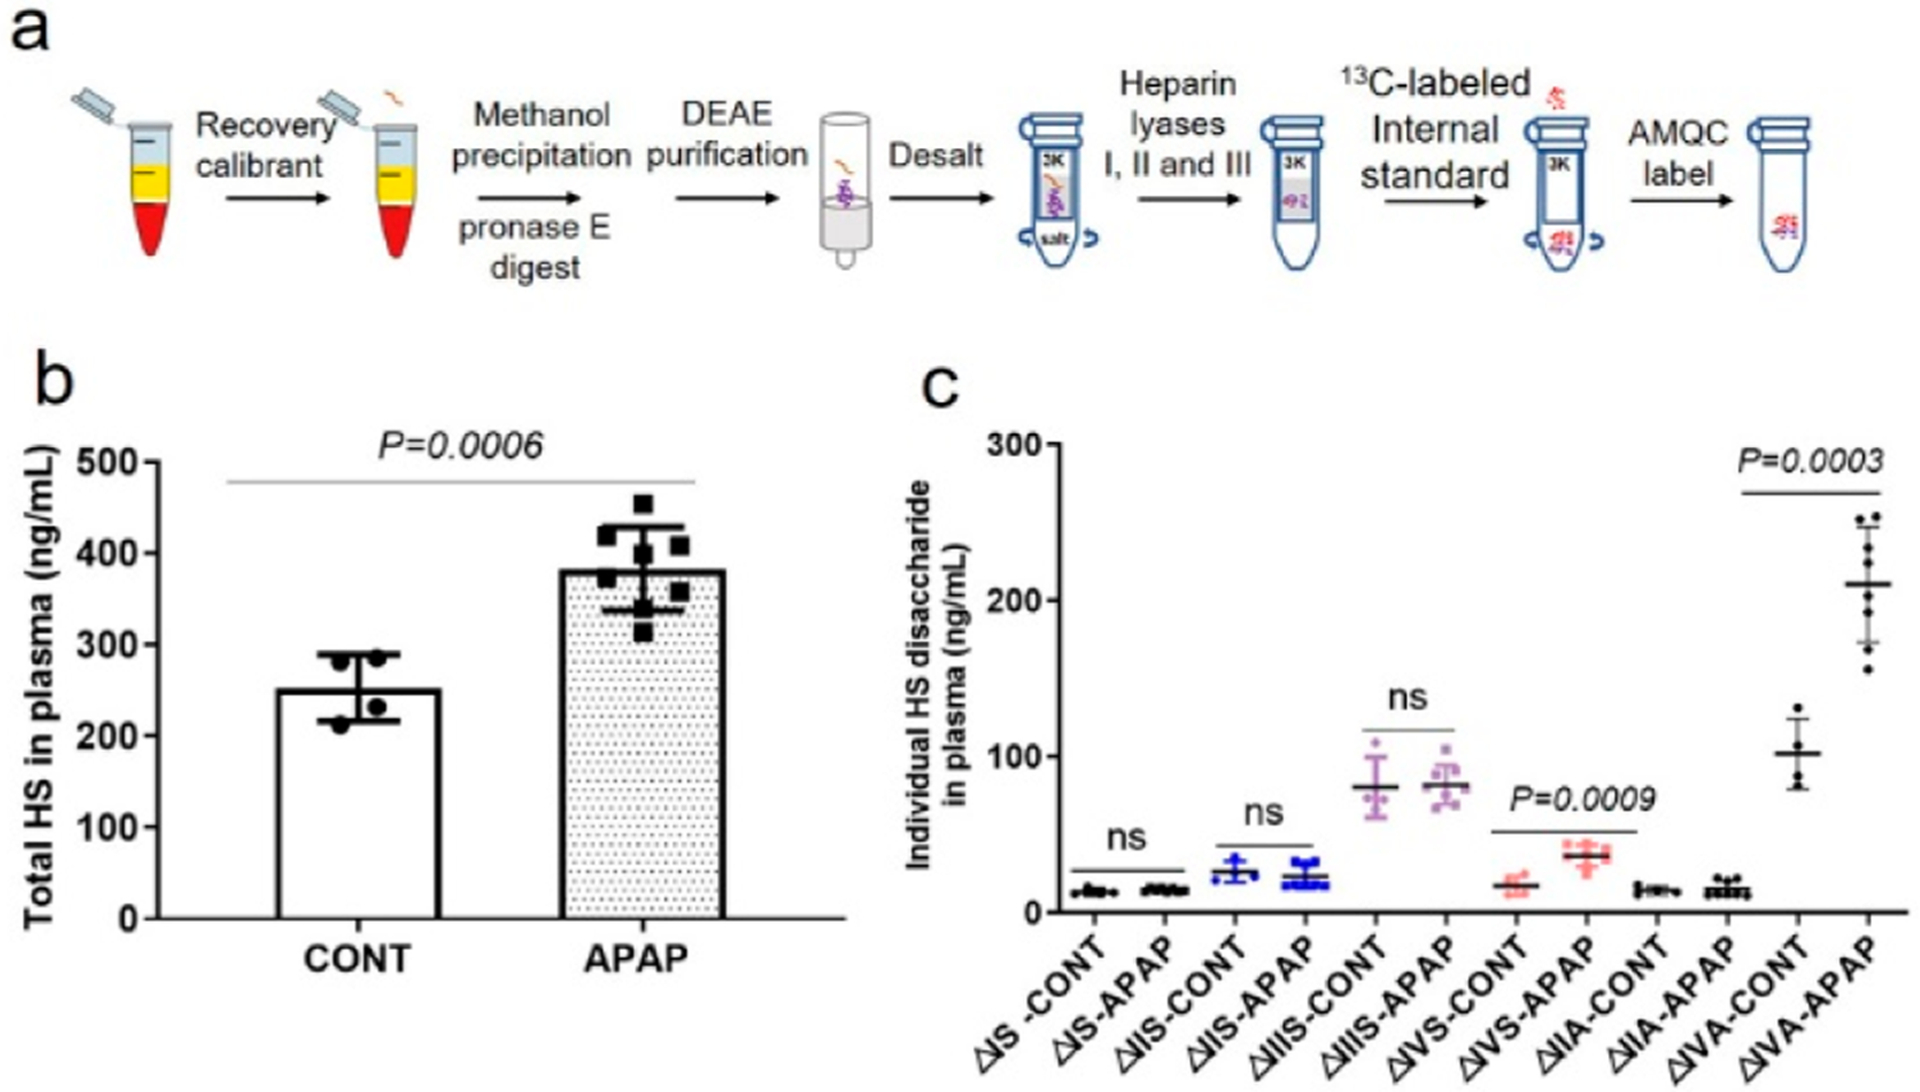
Identification and quantification of HS from APAP overdose-induced mice plasma. (a) Flowchart to isolate HS from the plasma/serum samples. (b) Total amount of HS in 1 mL of mice plasma with and without APAP overdose. Data are presented as mean ± SD (CONT, n = 4; APAP, n = 8). CONT represents the group of animals without APAP overdose, and APAP represents the group of animals with APAP overdose. p value was determined by two-tailed unpaired t test; ns, not significant (p > 0.05). (c) Total amount of individual disaccharide from 1 mL of mice plasma with or without APAP overdose.
We next used our method to examine the plasma concentration of HS in acetaminophen (APAP)-induced acute liver injury mice model. A recent study demonstrates that HS is intimately associated with physiological and pathophysiological responses after APAP-induced liver injury.25 In particular, our previously published data suggest that cell surface HS proteoglycan in the liver, syndecan-1, is shed after APAP overdose in mice as well as in patients who suffer from acute liver injury caused by APAP overdose.26 The elevated shed syndecan-1 was merely based on the concentration of the core protein. To this end, we decided to measure the concentrations and compositions of HS in the plasma from both APAP-injured mice and healthy mice using the procedure described in Figure 3a. We demonstrated that APAP overdose increased the plasma concentration of total HS to 382.8 ± 45.7 from 253.5 ± 37.2 ng/mL, a 51% increase (Figure 3b). In addition, the plasma HS from APAP-injured mice displayed higher levels of two low-sulfation disaccharides ΔUA-GlcNS (ΔIVS, P = 0.0009) and ΔUA-GlcNAc (ΔIVA, P = 0.0003), while high-sulfation disaccharides did not show a significant difference between the APAP-injured group and the control group (Figure 3c). Our data suggest that the observed increase in total plasma HS in APAP-injured mice is primarily due to an elevation of the low-sulfation composition. Interestingly, the dynamics of HS in plasma and in the liver appear different. Although an increase in total HS in the liver tissue was also observed in a previous study, the increase was primarily concentrated on the 6-O-sulfation disaccharides in HS from liver tissue in the APAP-injured cohort compared with the control group.8 The underlying pathological/physiological mechanism to control the structural changes in the plasma HS and liver tissue HS in response to APAP injury remains to be investigated.
Our method was next used to profile serum HS in a burn mouse model. Annually, an estimated 1.1 million deaths are caused by burn, which continues to be one of the leading causes of unintentional death in the United States.27 Acute inflammation follows the initial burn injury. The excessive inflammation response may lead to damage of the endothelial glycocalyx layer in the target organ and may be associated with the HS characteristic alteration in the circulation. To date, the effects of burn injury on the amount and composition of HS have not been extensively studied. Here, we examined the level of HS in the serum and lung from a burn mice model over time. The blood sample was drawn at five points, including 0.5, 2, 2.5, 4, and 8 h, after burn injury and subjected to analysis. Our data showed that the HS level in the serum fluctuated across the course of the experiment. At 0.5 h after burn, the HS level was elevated compared to the control (P = 0.0058), and then the level returned to the baseline at 2 h. There is no statistical difference in the amount of HS throughout the time course at 2.5, 4, and 8 h compared to the control (Figure 4a). Interestingly, individual disaccharide analysis of HS in the serum revealed that two disaccharides ΔUA-GlcNS6S (ΔIIS) and ΔUA-GlcNAc6S (ΔIIA) were increased at the 0.5 and 2.5 h time points (Supplementary Figure S2a and S2b) and the levels returned to baseline at 4 h. This result suggests that the surge in the 6-O-sulfated disaccharides at the 0.5 and 2.5 h time points might reflect the host response to the development of burn injury.
Figure 4.
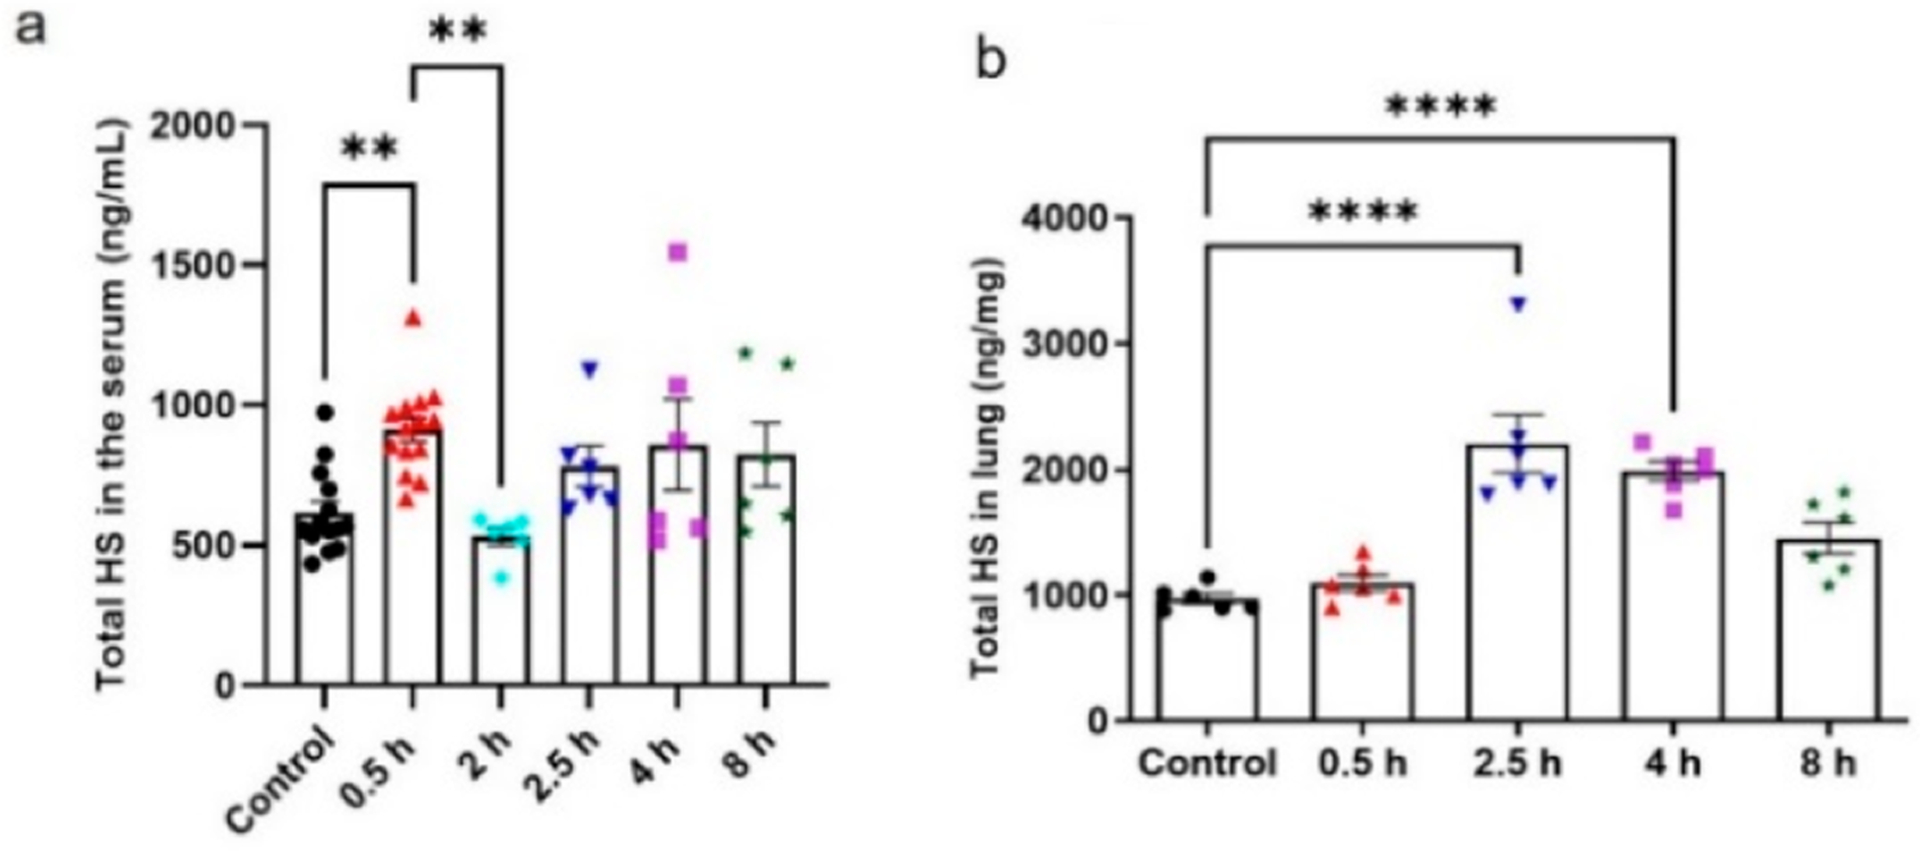
Identification and quantification of HS from burn-injured mice (% TBSA) serum and lung tissue. (a) Total HS amount in 1 mL of serum at specific time points. (b) Total amount of HS in the lung tissue harvested at specific time points. Data are presented as mean ± SEM. P value was determined by one-way ANOVA: ** P < 0.01, *** P < 0.001, **** P < 0.0001. Serum samples: n = 12 control group and at 0.5 h; n = 6 at 2, 2.5, 4, and 8 h. Lung tissue samples: n = 6 control group and at 0.5, 2.5, 4, and 8 h.
The profile of HS from the lung in burn mice was also evaluated. For burn patients, the lung tissue dysfunction has been a major concern.28 We conducted the analysis of HS isolated from burn mice lung tissue. As shown in Figure 4b, no significant increase was observed for the total amount of HS at the time point of 0.5 h after burn injury. However, a clear increase in the level of total HS was observed at 2.5 h. After 2.5 h, the level of HS started to decline over time but did not return to the control level (Figure 4b). The individual disaccharide component showed no significant difference in the lung tissue over time. It appears that HS reaches its peak level only at 0.5 h in the circulation after the injury, and the HS returns to the baseline. For the lung tissue, the peak level of HS arrived at 2.5 h after the injury, and the level of HS remained high after that time point. Luker and colleagues demonstrated the inverse correlation between the shed syndecan-1 in the plasma and the intact form on the lung tissue in the core protein level.28 In our study, there is no significant correlation in the level change of HS in the serum and lung tissue, suggesting that the fluctuating concentration of syndecan-1’s core protein does not reflect the dynamics of total HS.
CONCLUSIONS
In this manuscript, we describe a sensitive method that is able to quantify the individual disaccharide building blocks and total amount of HS. Two lines of critical innovation are presented in the current study. First, a newly discovered AMQC-labeling agent allows the analysis being carried out under positive mode, thereby increasing the sensitivity for analysis. Second, inclusion of 13C-labeled disaccharide internal standards not only adds the quantitation capability but also offers an effective check for the quality of the results from analysis. The improvement has increased the reliability for analysis, especially for analyzing samples that may contain contaminates affecting the ionization or LC separation as seen in the analysis of HS from plasma/serum samples. Notably, both 13C-labeled disaccharides and AMQC-labeling agent are needed to conduct the analysis on a routine basis. The 13C-labeled disaccharides are commercially available, allowing researchers to have easy access. The synthesis of AMQC is completed from a commercially available starting material in gram scales. Clearly, our method provides a new opportunity for accurately analyzing HS, which potentially will direct biologists and clinicians to find valuable biomarkers and effective mechanistic studies for human disease.
Supplementary Material
Funding
This work was supported in part by NIH grants (HL094463, HL144970, GM123792, GM131124, GM008450, and AR070179) and Glycan Innovation grants from Eshelman Innovation Institute.
The authors declare the following competing financial interest(s): Jian Liu is founder of Glycan Therapeutics. V.M.D. and G.S. are employees of Glycan Therapeutics. Jian Liu’s lab at UNC has received a gift from Glycan Therapeutics to support the research in glycoscience. Z.W., C.A.M., K.A., Jine Li, D.X., and R.M. declare no competing interests.
Footnotes
Supporting Information
The Supporting Information is available free of charge at https://pubs.acs.org/doi/10.1021/acs.analchem.1c01761.
MRM transitions for AMQC/AMAC-labeled native disaccharides and 13C-labeled disaccharides; correction factors of AMQC- and AMAC-labeled disaccharides using LC-MS/MS; back-up calculation of QC samples with low, medium and high concentrations and a known amount of bovine kidney HS; mass percentage of individual disaccharide of liver-, kidney-, and lung-tissue slides; results of disaccharide analysis of HS (5, 10, and 40 ng) in goat plasma (100 μL) with and without purification; linear correlation curves for AMQC- and AMAC-labeled disaccharides; percentage of two disaccharides from burn mice plasma (PDF)
Complete contact information is available at: https://pubs.acs.org/10.1021/acs.analchem.1c01761
Contributor Information
Zhangjie Wang, Division of Chemical Biology and Medicinal Chemistry, Eshelman School of Pharmacy, University of North Carolina, Chapel Hill, North Carolina 27599-7568, United States.
Vijay M. Dhurandhare, Division of Chemical Biology and Medicinal Chemistry, Eshelman School of Pharmacy, University of North Carolina, Chapel Hill, North Carolina 27599-7568, United States; Glycan Therapeutics, Raleigh, North Carolina 27606, United States
Cressida A. Mahung, Department of Surgery, North Carolina Jaycee Burn Center, University of North Carolina, Chapel Hill, North Carolina 27599-7050, United States
Guowei Su, Division of Chemical Biology and Medicinal Chemistry, Eshelman School of Pharmacy, University of North Carolina, Chapel Hill, North Carolina 27599-7568, United States; Glycan Therapeutics, Raleigh, North Carolina 27606, United States.
Ding Xu, Department of Oral Biology, School of Dental Medicine, The State University of New York at Buffalo, Buffalo, New York 14214, United States.
Rob Maile, Department of Surgery, North Carolina Jaycee Burn Center, University of North Carolina, Chapel Hill, North Carolina 27599-7050, United States; Department of Microbiology and Immunology, University of North Carolina, Chapel Hill, North Carolina 27599, United States; Curriculum of Toxicology and Environmental Medicine, University of North Carolina, Chapel Hill, North Carolina 27599-7325, United States.
Jian Liu, Division of Chemical Biology and Medicinal Chemistry, Eshelman School of Pharmacy, University of North Carolina, Chapel Hill, North Carolina 27599-7568, United States;.
REFERENCES
- (1).Lindahl U Thromb. Haemostasis 2007, 98 (1), 109–15. [PubMed] [Google Scholar]
- (2).Sarrazin S; Lamanna WC; Esko JD Cold Spring Harbor Perspect. Biol 2011, 3 (7), a004952. [DOI] [PMC free article] [PubMed] [Google Scholar]
- (3).Wang Z; Arnold K; Dhurandhare VM; Xu Y; Liu J RSC Chem. Biol 2021, 2, 702–712. [DOI] [PMC free article] [PubMed] [Google Scholar]
- (4).Clarke LA; Winchester B; Giugliani R; Tylki-Szymańska A; Amartino H Mol. Genet. Metab 2012, 106 (4), 395–402. [DOI] [PubMed] [Google Scholar]
- (5).Auray-Blais C; Lavoie P; Tomatsu S; Valayannopoulos V; Mitchell JJ; Raiman J; Beaudoin M; Maranda B; Clarke JT Anal. Chim. Acta 2016, 936, 139–48. [DOI] [PubMed] [Google Scholar]
- (6).Li G; Li L; Tian F; Zhang L; Xue C; Linhardt RJ ACS Chem. Biol 2015, 10 (5), 1303–10. [DOI] [PubMed] [Google Scholar]
- (7).Schmidt EP; Li G; Li L; Fu L; Yang Y; Overdier KH; Douglas IS; Linhardt RJ J. Biol. Chem 2014, 289 (12), 8194–202. [DOI] [PMC free article] [PubMed] [Google Scholar]
- (8).Wang Z; Arnold K; Xu Y; Pagadala V; Su G; Myatt H; Linhardt RJ; Liu J Commun. Biol 2020, 3 (1), 425. [DOI] [PMC free article] [PubMed] [Google Scholar]
- (9).Shao C; Shi X; Phillips JJ; Zaia J Anal. Chem 2013, 85 (22), 10984–91. [DOI] [PMC free article] [PubMed] [Google Scholar]
- (10).Hippensteel JA; Anderson BJ; Orfila JE; McMurtry SA; Dietz RM; Su G; Ford JA; Oshima K; Yang Y; Zhang F; Han X; Yu Y; Liu J; Linhardt RJ; Meyer NJ; Herson PS; Schmidt EP J. Clin. Invest 2019, 129 (4), 1779–1784. [DOI] [PMC free article] [PubMed] [Google Scholar]
- (11).Scott CR; Elliott S; Hong X; Huang JY; Kumar AB; Yi F; Pendem N; Chennamaneni NK; Gelb MH J. Pediatr 2020, 216, 204–207. [DOI] [PMC free article] [PubMed] [Google Scholar]
- (12).Antia IU; Yagnik DR; Pantoja Munoz L; Shah AJ; Hills FA Anal. Biochem 2017, 530, 17–30. [DOI] [PubMed] [Google Scholar]
- (13).Wang Z; Li D; Sun X; Bai X; Jin L; Chi L Anal. Biochem 2014, 451, 35–41. [DOI] [PubMed] [Google Scholar]
- (14).Skidmore MA; Guimond SE; Dumax-Vorzet AF; Yates EA; Turnbull JE Nat. Protoc 2010, 5 (12), 1983–92. [DOI] [PubMed] [Google Scholar]
- (15).Volpi N; Galeotti F; Yang B; Linhardt RJ Nat. Protoc 2014, 9 (3), 541–58. [DOI] [PubMed] [Google Scholar]
- (16).Antia IU; Mathew K; Yagnik DR; Hills FA; Shah AJ Anal. Bioanal. Chem 2018, 410 (1), 131–143. [DOI] [PubMed] [Google Scholar]
- (17).Raghunathan R; Polinski NK; Klein JA; Hogan JD; Shao C; Khatri K; Leon D; McComb ME; Manfredsson FP; Sortwell CE; Zaia J Mol. Cell Proteomics 2018, 17 (9), 1778–1787. [DOI] [PMC free article] [PubMed] [Google Scholar]
- (18).Volk R; Schwartz JJ; Li J; Rosenberg RD; Simons MJ Biol. Chem 1999, 274, 24417–24424. [DOI] [PubMed] [Google Scholar]
- (19).Cairns B; Maile R; Barnes CM; Frelinger JA; Meyer AA J. Trauma 2006, 61 (2), 293–8. [DOI] [PubMed] [Google Scholar]
- (20).Maile R; Barnes CM; Nielsen AI; Meyer AA; Frelinger JA; Cairns BA J. Immunol 2006, 176 (11), 6717–26. [DOI] [PubMed] [Google Scholar]
- (21).Wadstrom T; Ljungh AJ Med. Microbiol 1999, 48, 223–233. [DOI] [PubMed] [Google Scholar]
- (22).Shrivastava A; Gupta V Chronic. Young Scient 2011, 2 (1), 21. [Google Scholar]
- (23).Keser T; Pavić T; Lauc G; Gornik O Front. Chem 2018, 6, 324. [DOI] [PMC free article] [PubMed] [Google Scholar]
- (24).Panuwet P; Hunter RE Jr.; D’Souza PE; Chen X; Radford SA; Cohen JR; Marder ME; Kartavenka K; Ryan PB; Barr DB Crit. Rev. Anal. Chem 2016, 46 (2), 93–105. [DOI] [PMC free article] [PubMed] [Google Scholar]
- (25).Nam EJ; Hayashida K; Aquino RS; Couchman JR; Kozar RA; Liu J; Park PW Hepatology 2017, 66 (5), 1601–1615. [DOI] [PMC free article] [PubMed] [Google Scholar]
- (26).Arnold K; Xu Y; Sparkenbaugh EM; Li M; Han X; Zhang X; Xia Ke.; Piegore M; Zhang Fu.; Zhang X; Henderson M; Pagadala V; Su G; Tan L; Park PW; Stravitz RT; Key NS; Linhardt RJ; Pawlinski R; Xu D; Liu J Sci. Transl. Med 2020, 12, eaav8075. [DOI] [PMC free article] [PubMed] [Google Scholar]
- (27).Chandran A; Hyder AA; Peek-Asa C Epidemiol. Rev 2010, 32, 110–20. [DOI] [PMC free article] [PubMed] [Google Scholar]
- (28).Luker JN; Vigiola Cruz M; Carney BC; Day A; Moffatt LT; Johnson LS; Shupp JW Ann. Burns Fire Disast 2018, 31 (1), 17–22. [PMC free article] [PubMed] [Google Scholar]
Associated Data
This section collects any data citations, data availability statements, or supplementary materials included in this article.