

Abstract
Cleft palate has been linked to both genetic and environmental factors that perturb key events during palatal morphogenesis. As a developmental outcome, it presents a challenging, mechanistically complex endpoint for predictive modeling. A dataset of 500 chemicals evaluated for their ability to induce cleft palate in animal prenatal developmental studies was compiled from ToxRefDB and the biomedical literature, which included 63 cleft palate active and 437 inactive chemicals. To characterize the potential molecular targets for chemical-induced cleft palate, we mined the ToxCast high-throughput screening database for patterns and linkages in bioactivity profiles and chemical structural descriptors. ToxCast assay results were filtered for cytotoxicity and grouped by target gene activity to produce a ‘gene score’. Following unsuccessful attempts to derive a global prediction model using structural and gene score descriptors, hierarchical clustering was applied to the set of 63 cleft palate positives to extract local structure-bioactivity clusters for follow-up study. Patterns of enrichment were confirmed on the complete dataset, i.e., including cleft palate inactives, and putative molecular initiating events identified. The clusters corresponded to ToxCast assays for cytochrome P450s, G protein-coupled receptors, retinoic acid receptors, the glucocorticoid receptor, and tyrosine kinases/phosphatases. These patterns and linkages were organized into preliminary decision trees and the resulting inferences were mapped to a putative adverse outcome pathway (AOP) framework for cleft palate supported by literature evidence of current mechanistic understanding. This general data-driven approach offers a promising avenue for mining chemical-bioassay drivers of complex developmental endpoints where data are often limited.
Introduction
Cleft lip and/or palate is a common birth defect occurring in 1 out of 700 live births worldwide (Dixon, Marazita, Beaty, & Murray, 2011), costing over $15 million annually in direct hospital expenses in the United States (Russo & Elixhauser, 2007). Animal models and human epidemiological studies have revealed complex etiology for this malformation, with genetic factors, environmental factors, and their interactions underlying the risk. The genetic factors are identified through human studies and animal models and have indicated potential gene pathways involved in cleft palate (Wattanawong, Rattanasiri, McEvoy, Attia, & Thakkinstian, 2016). A number of cleft palate teratogens have been identified from in vivo mammalian studies published in both the biomedical literature and in regulatory guideline prenatal developmental toxicity studies that routinely evaluate secondary palate formation (Collins, 2006). The Toxicity Reference Database (ToxRefDB) is the U.S. Environmental Protection Agency’s public database of animal toxicity data manually curated from over 3,000 guideline studies on over 500 chemicals (Martin, Judson, Reif, Kavlock, & Dix, 2009), many of which are also included in ToxCast. ToxRefDB includes multi-generational reproductive studies (Martin, Mendez, et al., 2009) and prenatal developmental toxicity studies (Knudsen et al., 2009) where cleft palate is one of the observed apical endpoints following prenatal exposure. However, the identification of putative cleft palate teratogens in humans is limited to case studies and epidemiological studies that have associated small numbers of environmental chemicals and pharmaceuticals with incidence of cleft palate (Hu & Shy, 2001; J. Schardein, 2000; J. L. Schardein & Macina, 2007).
To date, the U.S. Environmental Protection Agency’s ToxCast high-throughput screening (HTS) program has tested over 4000 chemicals for bioactivity, with the ph1, ph2 subsets from Phase II (1060 chemicals) tested across the widest variety of in vitro assays (Richard et al., 2016). Within the cross-Agency Tox21 project, additional screening of upwards of 8500 chemicals, including most of EPA’s 4000 ToxCast chemicals, has yielded results for an additional set of approximately 100 Tox21-specific assays (Tice, Austin, Kavlock, & Bucher, 2013). These chemical-assay results are being used to develop new approaches for modeling or estimating potential toxicity (Judson et al., 2016; Kavlock et al., 2012; Richard et al., 2016). An important concept incorporated into many of these approaches is the integration of in vitro data with biological information and chemical descriptors utilizing in silico models that can then be used to predict in vivo toxicity (Benfenati, Piclin, Roncaglioni, & Vari, 2001). The goals of the ToxCast program include building predictive models from HTS data, either alone or in conjunction with other data such as chemical structures, that can be used to screen previously untested environmental chemicals (Judson et al., 2010). Here, we applied various methods to the goal of predicting cleft palate, illustrating that hybrid approaches coupled with supervised data mining can chart a path forward for modeling complex in vivo developmental endpoints.
Our approach combines chemical structural information, HTS data, and results from guideline animal studies and the published literature to propose biological pathways associated with incidence of cleft palate and, ultimately, to support the development of a chemical-biological predictive signature for cleft palate. Computational methods employing ToxCast and Tox21 HTS data to build predictive models or signatures have been developed for liver tumors (Jack, Wambaugh, & Shah, 2011), reproductive toxicity in rat multigenerational studies (Martin, Judson, et al., 2009), zebrafish developmental toxicity (Sipes, Padilla, & Knudsen, 2011), vasculogenesis/angiogenesis (Knudsen & Kleinstreuer, 2011), prenatal developmental toxicity in rats and rabbits (Sipes, Martin, et al., 2011), and male reproductive developmental toxicity (Leung et al., 2016). In some studies, the HTS data are integrated with information such as biological pathways (Kleinstreuer et al., 2013; Leung et al., 2016; Sipes, Martin, et al., 2011). Studies utilizing HTS data similar to ToxCast have created modeling sets that combine chemical structural descriptors with in vitro assay data to achieve higher predictivity on the toxicity endpoints (Sedykh et al., 2011; I. Shah, Liu, Judson, Thomas, & Patlewicz, 2016; Wu et al., 2013; Zhu, 2013; Zhu, Rusyn, Richard, & Tropsha, 2008; Zhu et al., 2009). Most recently, an approach is being developed to explore chemical structure feature (i.e., chemotype) enrichments within local regions of chemical structure space as a means to amplify weak chemical-biological activity signals within highly structurally and mechanistically diverse datasets (Richard et al., 2016; Richard et al., 2018; Strickland, Martin, Richard, Houck, & Shafer, 2018). Early unpublished work in this area presented the conceptual chemotype enrichment approach applied to cleft palate, with preliminary results mined from datasets combining public and non-public cleft palate data for rats (Mostrag-Szlichtyng et al., 2013; Volarath et al., 2010; Yang et al., 2013).
Whereas statistical prediction of toxicity is an important goal of computational toxicology, in general, and of the ToxCast program, in particular, gaining an understanding the biological pathways and mechanistic drivers of the toxicity is equally important. This understanding involves relating chemicals to molecular initiating events (MIEs), and gene and protein targets to cellular events and, downstream, to tissue and organ phenotypes that potentially lead to the toxicity endpoint. The chemical and biological knowledge supporting a toxicity pathway can then be formalized by constructing an adverse outcome pathway (AOP) (Ankley et al., 2010; Villeneuve et al., 2014). Conceptually, an AOP starts with identifying one or more MIEs, followed by specifying the key events and key event relationships leading to an adverse outcome or apical endpoint, where the latter can become major drivers of regulatory decision-making. The availability of rich HTS data across a diverse chemistry landscape, coupled with guideline study results for subsets of chemicals, can potentially help to identify both chemical and biological drivers for MIEs and support AOP development.
In this work, we employ a variety of computational modeling and data-mining approaches, using both HTS data and chemical structural descriptors, to extract mechanistically informative indicators of cleft palate activity that suggest several distinct MIEs leading to an AOP for cleft palate. A substantial body of knowledge in the scientific literature is brought to bear on supporting these results as contributors to an AOP. The challenges of modeling a complex developmental endpoint, such as cleft palate, using limited amounts of data aggregated over many species, dose ranges, and study parameters, for a broadly diverse chemical structure space, are not atypical of the environmental toxicology domain. Hence, it is hoped that the present approach will provide useful guidelines for exploring chemical-bioactivity drivers for a broader range of developmental toxicity endpoints moving forward.
Materials and Methods
Identification of cleft palate inducing chemicals
Chemicals for this study were selected from the ToxCast Phase II library, consisting of 1060 diverse chemicals in the ph1_v2 and ph2 sub-inventories. This Phase II library subset has the largest ToxCast assay coverage, having been tested in a battery of over 1400 in vitro assay endpoints to date (Richard et al., 2016). The full ToxCast chemical library with sub-inventories identified is available for download at https://comptox.epa.gov/dashboard/chemical_lists/toxcast; Phase II ToxCast assay data results are available at https://www.epa.gov/chemical-research/toxicity-forecaster-toxcasttm-data.
Two sources of information were mined to identify chemicals in the ToxCast Phase II library that had evidence linking them to cleft palate: ToxRefDB version 1 (Knudsen et al., 2009; Martin, Judson, et al., 2009) and the biomedical literature in PubMed. ToxRefDb is available here: ftp://newftp.epa.gov/comptox/High_Throughput_Screening_Data/Animal_Tox_Data/. In total, 63 chemicals from the library were linked to cleft palate in animal models (CP-positives; Table 1). Evidence for 30 CP-positives in rats or rabbits were documented in ToxRefDB and the remaining 33 were identified from evidence in rats, rabbits, mice, or hamsters and from epidemiological studies in the biomedical literature (described below). To be as inclusive as possible for this initial modeling effort, we did not eliminate chemicals based on a dose threshold, maternal toxicity, or whether cleft palate was part of a syndrome or associated with cleft lip. An additional 437 chemicals were identified and labelled CP-negatives. These chemicals had ToxCast HTS and ToxRefDB apical endpoint data with no record of causing cleft palate when they were tested in prenatal developmental studies in which cleft palate was an evaluated. Literature-based searches for CP-positive ToxCast chemicals utilized a novel high-throughput text-based search tool (Baker & Hemminger, 2010; Kleinstreuer et al., 2013) applied to Medical Subject Heading (MeSH) annotations from > 25 million citations in PubMed (queried 05/2016). First, we queried this database to find chemicals described with one of the subheadings: toxicity, poisoning, or adverse effects, and that occurred in the same article in which the term ‘cleft palate’ was annotated. The resulting chemical list was curated manually (i.e., association of the chemical to the cleft palate endpoint were reviewed for accuracy) and cross-referenced with chemicals tested in ToxCast to confirm the presence of bioactivity data for inclusion in the study.
Table 1.
63 cleft palate active chemicals and source of information on their cleft palate activity.
| DTXSID | CASRN | Name (synonym) | Source |
|---|---|---|---|
| DTXSID0020442 | 94-75-7 | 2,4-Dichlorophenoxyacetic acid | (Bage, Cekanova, & Larsson, 1973; Roll & Matthiaschk, 1983)[*] |
| DTXSID8020541 | 57-41-0 | 5,5-Diphenylhydantoin | (Paulson, Paulson, & Jreissaty, 1979) [***] |
| DTXSID2020634 | 51-21-8 | 5-Fluorouracil | (Abbott et al., 1993)[*] |
| DTXSID8020040 | 309-00-2 | Aldrin | (Ottolenghi, Haseman, & Suggs, 1974)[*] |
| DTXSID7021239 | 302-79-4 | trans-Retinoic acid (Tretinoin, all-trans-retinoic acid, retinoic acid) | ToxRefDB |
| DTXSID5020108 | 50-78-2 | Aspirin | ToxRefDB |
| DTXSID0032520 | 131860-33-8 | Azoxystrobin | ToxRefDB |
| DTXSID0020232 | 58-08-2 | Caffeine | ToxRefDB |
| DTXSID0022808 | 50-53-3 | Chlorpromazine | (Walker & Patterson, 1974) [*] |
| DTXSID4020458 | 2921-88-2 | Chlorpyrifos | (Tian, Ishikawa, Yamaguchi, Yamauchi, & Yokoyama, 2005)[*] |
| DTXSID6022474 | 50-22-6 | Corticosterone | (R. Shah & Kilistoff, 1976) [*] |
| DTXSID1023990 | 21725-46-2 | Cyanazine | ToxRefDB |
| DTXSID6043709 | 4449-51-8 | Cyclopamine | (Lipinski et al., 2008) [*] |
| DTXSID5020364 | 50-18-0 | Cyclophosphamide | (McClure, Wilk, Horigan, & Pratt, 1979)[**] |
| DTXSID6032358 | 57966-95-7 | Cymoxanil | ToxRefDB |
| DTXSID0032601 | 94361-06-5 | Cyproconazole | ToxRefDB |
| DTXSID3022873 | 2098-66-0 | Cyproterone | (Eibs, Spielmann, & Hagele, 1982) [*] |
| DTXSID3022877 | 147-94-4 | Cytarabine | (Ortega, Puig, & Domingo, 1991) [*] |
| DTXSID2021781 | 84-74-2 | Dibutyl phthalate | ToxRefDB |
| DTXSID5032365 | 1194-65-6 | Dichlobenil | ToxRefDB |
| DTXSID0020440 | 120-36-5 | Dichlorprop | (Roll & Matthiaschk, 1983)[*] |
| DTXSID6022923 | 15307-86-5 | Diclofenac | (Montenegro & Palomino, 1990)[*] |
| DTXSID9020453 | 60-57-1 | Dieldrin | (Ottolenghi et al., 1974)[*] |
| DTXSID1024621 | 111-96-6 | Diethylene glycol dimethyl ether (diglyme) | ToxRefDB |
| DTXSID3020465 | 56-53-1 | Diethylstilbestrol | (Gabriel-Robez, Rohmer, Clavert, & Schneegans, 1972)[*] |
| DTXSID6025068 | 84-75-3 | Dihexyl phthalate | ToxRefDB |
| DTXSID4022949 | 58-73-1 | Diphenhydramine | ToxRefDB |
| DTXSID6020561 | 72-20-8 | Endrin | (Ottolenghi et al., 1974) [*] |
| DTXSID5020601 | 96-45-7 | Ethylene thiourea | (Khera, 1987)[*] |
| DTXSID7032551 | 79622-59-6 | Fluazinam | ToxRefDB |
| DTXSID3020627 | 86386-73-4 | Fluconazole | (Tiboni & Giampietro, 2005) [*] |
| DTXSID3024235 | 85509-19-9 | Flusilazole | ToxRefDB |
| DTXSID4034150 | 52-86-8 | Haloperidol | (Szabo & Brent, 1974) [*] |
| DTXSID6025438 | 127-07-1 | Hydroxyurea | (Chaube & Murphy, 1966)[*] |
| DTXSID9020740 | 53-86-1 | Indomethacin | (Montenegro & Palomino, 1990)[*] |
| DTXSID7029879 | 65277-42-1 | Ketoconazole | (Mineshima et al., 2012) [*] |
| DTXSID2024163 | 330-55-2 | Linuron | (Matthiaschk & Roll, 1977)[*] |
| DTXSID0034695 | 8018-01-7 | Mancozeb | ToxRefDB |
| DTXSID4024195 | 94-74-6 | MCPA | (Roll & Matthiaschk, 1983)[*] |
| DTXSID4020822 | 59-05-2 | Methotrexate | ToxRefDB |
| DTXSID4040002 | 131-70-4 | Monobutyl phthalate | (Ema, Kurosaka, Amano, & Ogawa, 1995a)[*] |
| DTXSID1032646 | 4151-50-2 | N-Ethylperfluorooctanesulfonamide (Sulfluramid) | ToxRefDB |
| DTXSID1020930 | 54-11-5 | Nicotine | (Saad, Gartner, & Hiatt, 1990) [*] |
| DTXSID1034260 | 79-57-2 | Oxytetracycline | (Czeizel & Rockenbauer, 2000)[*] |
| DTXSID2024242 | 76738-62-0 | Paclobutrazol | ToxRefDB |
| DTXSID3031864 | 1763-23-1 | Perfluorooctanesulfonic acid (PFOS) | (Thibodeaux et al., 2003) [*] |
| DTXSID5021122 | 50-06-6 | Phenobarbital | (Sullivan & McElhatton, 1975) [*] |
| DTXSID5021124 | 108-95-2 | Phenol | ToxRefDB |
| DTXSID8024280 | 60207-90-1 | Propiconazole | ToxRefDB |
| DTXSID9021217 | 58-14-0 | Pyrimethamine | ToxRefDB |
| DTXSID3023556 | 68-26-8 | Retinol (Vitamin A) | (Lorente & Miller, 1978) [***] |
| DTXSID4047387 | NOCAS_47387 | SAR102779 | ToxRefDB |
| DTXSID1034212 | 118134-30-8 | Spiroxamine | ToxRefDB |
| DTXSID3047342 | NOCAS_47342 | SR125047 | ToxRefDB |
| DTXSID5021336 | 58-55-9 | Theophylline | ToxRefDB |
| DTXSID3023897 | 43121-43-3 | Triadimefon | ToxRefDB |
| DTXSID5024344 | 2303-17-5 | Tri-allate | ToxRefDB |
| DTXSID1040742 | 124-94-7 | Triamcinolone | ToxRefDB |
| DTXSID0040709 | 688-73-3 | Tributyltin | (Ema, Kurosaka, Amano, & Ogawa, 1995b) [*] |
| DTXSID0032497 | 55335-06-3 | Triclopyr | ToxRefDB |
| DTXSID9021427 | 51-79-6 | Urethane | (Nomura et al., 1996) [*] |
| DTXSID6023733 | 99-66-1 | Valproic acid | (Elmazar, Thiel, & Nau, 1992)[*] |
| DTXSID6047363 | 139290-65-6 | Volinanserin (MDL-100907) | ToxRefDB |
Some chemicals have multiple sources; only one is included here. For those chemicals identified through the literature, an indicator of number of articles is included in brackets:
0-5 articles
5-10 articles
over 10 articles.
Data elements
To represent chemical structural features, we used a publicly available set of fingerprints referred to as “ToxPrints”, also referred to as “chemotypes” (Yang et al., 2015). ToxPrints consist of structural fragments including groups of atoms, bonds, alkyl chains of varying lengths, rings with and without aromaticity or heteroatoms, and groups (e.g. carbohydrates, amino acids). A sample ToxPrint for a triazole moiety, that captures bond type (aromatic) and heterocycle information, is illustrated in Figure 1. The publicly available set of 729 ToxPrints was designed to capture the diversity of chemicals in public sources of toxicity data and, although they do not capture every structural element, they represent key features (alerts and scaffolds) that may trigger safety concerns in regulatory workflows (available for download at https://toxprint.org).
Figure 1.

Example of ToxPrint-617 chemotype “ring:hetero_[5]_N_triazole_(1_2_4-)” (gray bonds indicate aromaticity).
For this analysis, we used a filtered and summarized version of the ToxCast data outcomes referred to as “gene scores”. The filtering process removes ToxCast activity outcomes that are likely the result of cell stress and non-specific bioactivity (Judson et al., 2016). The remaining assay results were then passed to the summarization step, wherein the results from ToxCast assays that target the same gene are averaged using the logAC50 (M) as previously described (Leung et al., 2016) and also summarized in the Supplemental Material.
Construction of datasets and approach
The primary dataset used in this analysis consisted of chemical identifiers linked to chemical structures in EPA’s DSSTox database (assigned to a unique DTXSID substance ID and CASRN for each structure), gene scores, ToxPrint chemotype incidence (0 or 1), and an indicator for cleft palate activity (0 or 1) for each chemical. This full dataset consisted of 279 gene scores and 383 chemotypes across 63 CP-positive and 437 CP-negative chemicals (500 total chemicals). (Supplemental Material) The overall methodology is depicted in Figure 2 and an illustration of the modeling set construction is available in Supplemental Material Table 1. Phase I of the methodology includes the predictive modeling of the entire dataset using hybrid descriptors. Phase II consists of exploratory methods comprised of a clustering approach within the cleft palate active subspace using both ToxPrint descriptors and gene scores, whose results are then combined with literature inferences to inform the creation of initial decision trees and putative AOPs.
Figure 2.
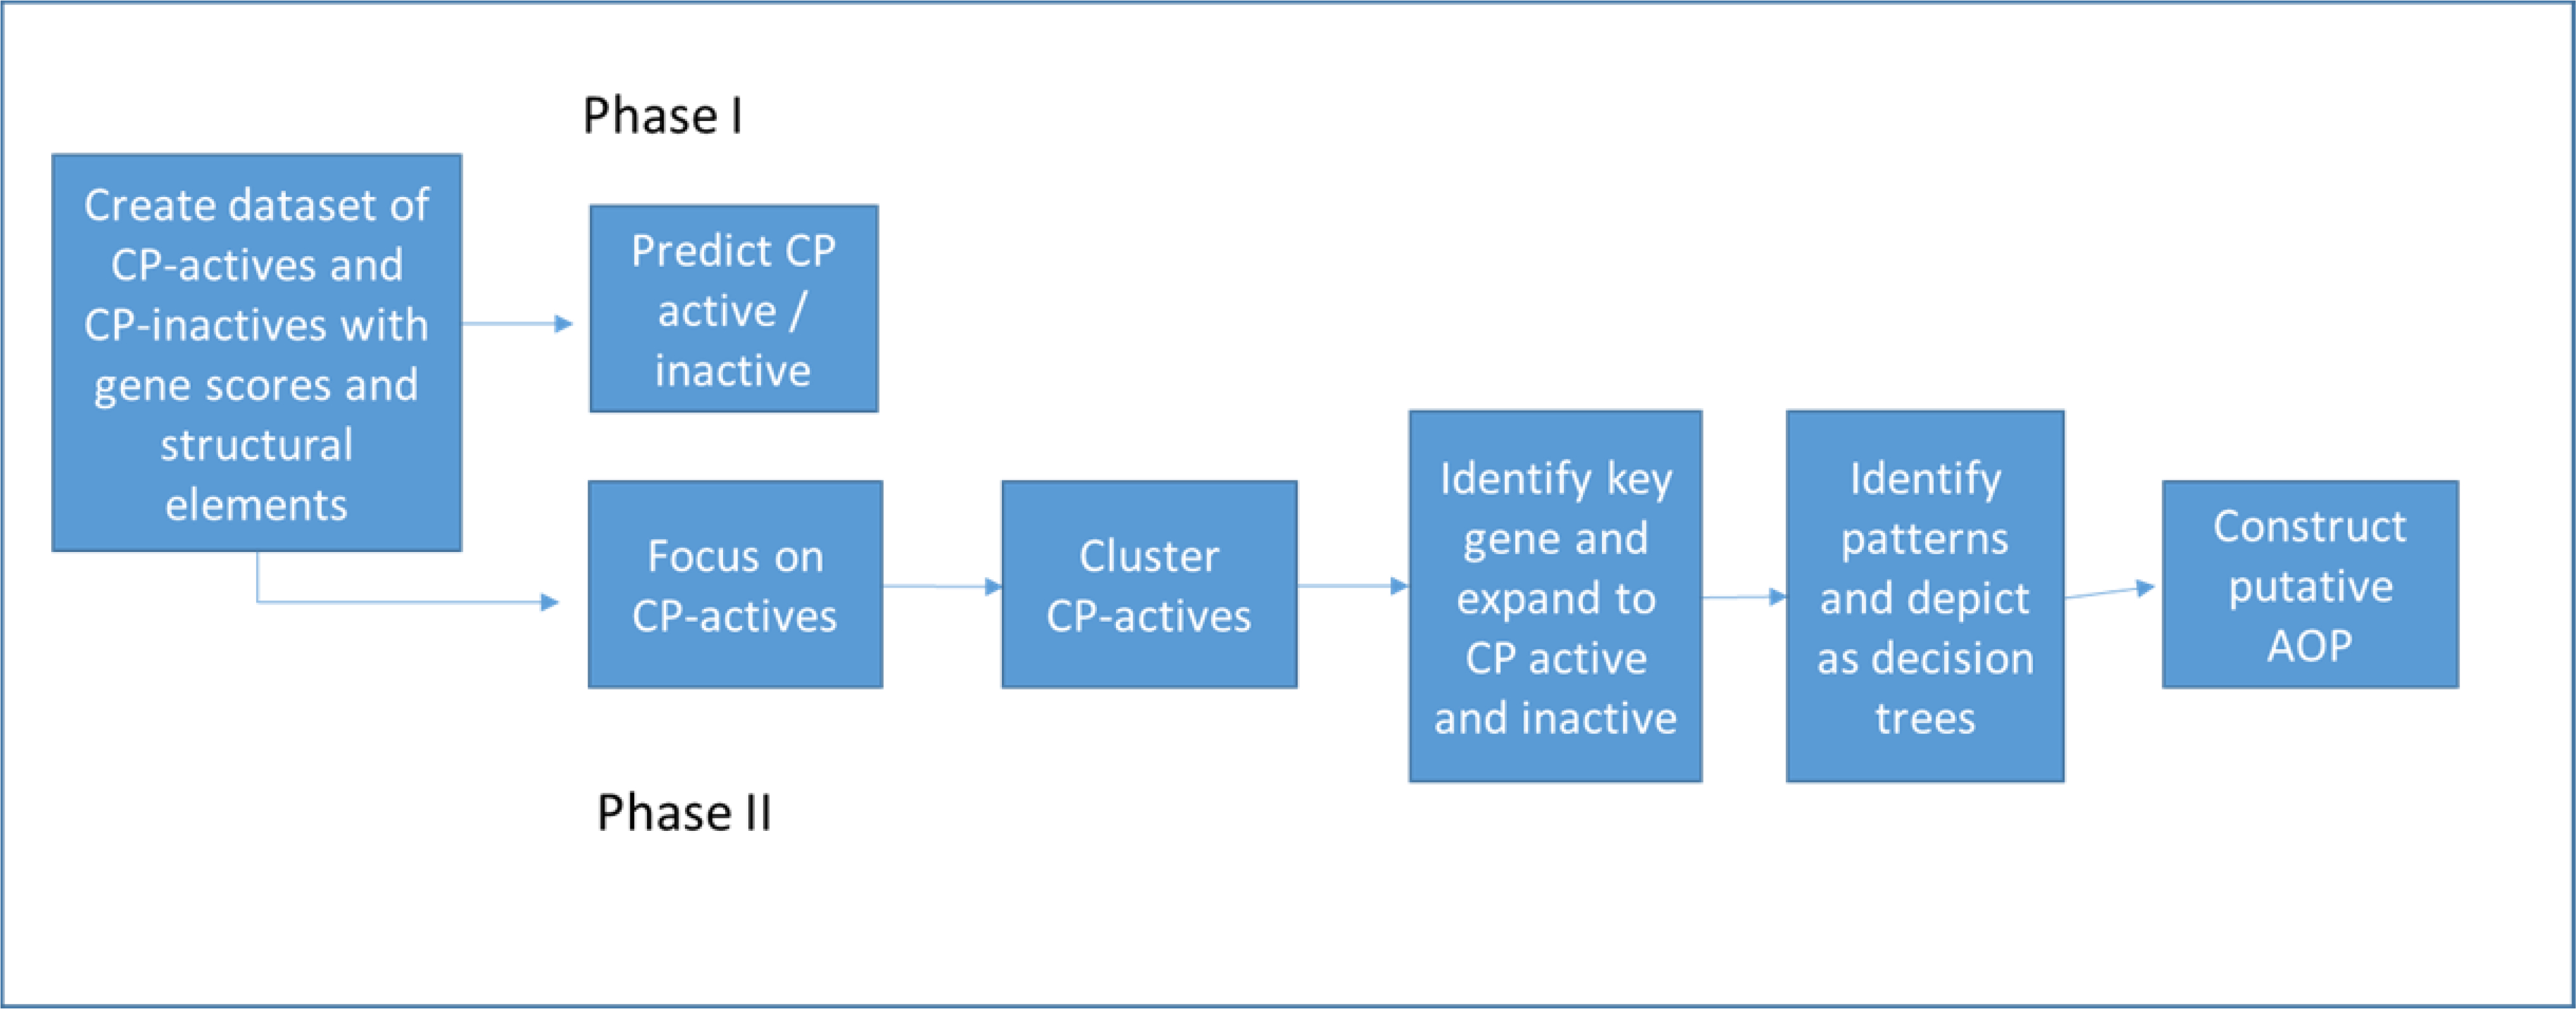
Flow diagram showing planned methodology and actual methods used.
Predictive Modeling and Clustering
The Weka data mining software (Hall et al., 2009) version 3.8.1 was used for the predictive model building. Preliminary range-finding runs were performed to find the best combinations of classifiers and attribute selection methods. The Naïve Bayes with Chi-squared attribute selection criteria produced consistent models and thus was used in the final model-building runs. There was a large imbalance in the number of chemicals that were cleft palate actives versus inactives. Classification algorithms are not effective in data sets with this extreme imbalance, so resampling was employed to equalize the sets. The resampling was performed before each run. Each dataset was tested with and without resampling over 50 iterations.
Partek Genomics Suite version 6.6 (Partek, Inc., Chesterfield, MO) was used to cluster the chemicals using the gene scores and ToxPrint chemotype fingerprints. In each case, the rows (representing chemical signatures) were clustered using Pearson’s Dissimilarity metric and Ward’s Method. A cluster colorization count of 10 was specified. To adjust for the difference between the range of values for gene scores and the binary 0/1 values of the chemotype columns, to give them approximately equal weights, the chemotype values were weighted by a factor of 3.
Results
I. Global Prediction
The goal of the prediction phase was to determine whether a global model for predicting cleft palate activity could be derived using machine-learning methods and a hybrid descriptor set comprised of chemical structural elements (ToxPrint chemotypes) and biological activity (gene scores). Three configurations of the full modeling set were tested in a series of exploratory machine-learning analyses to determine whether a hybrid training set of assay results and chemotypes was more predictive of cleft palate activity than either gene score assay results or chemotypes alone. The first dataset consisted of all attributes for the full set of 500 CP positives and negatives, including 279 gene scores from ToxCast and 383 ToxPrint chemotypes. Next, reduced sets of either gene sets alone or chemotypes alone were tested. The results (Table 2) show that algorithms run on the three datasets were not successful at predicting CP positive chemicals. The true positive rate measures the accuracy rate for identifying cleft palate active chemicals. The best true positive rate was achieved by prediction on the chemotype-only set (0.37); prediction using the gene score-only dataset yielded the worst true positive rate (0.28). These results showed weak capacity to predict CP-positives statistically by association with chemical structure or gene score information alone.
Table 2.
Results from predictive modeling.
| Dataset | True positive rate (avg) | False positive rate (avg) | True negative rate (avg) | False negative rate (avg) | True positive Std Dev |
|---|---|---|---|---|---|
| Entire set | 0.32 | 0.18 | 0.82 | 0.68 | 0.22 |
| Chemotypes only | 0.37 | 0.23 | 0.77 | 0.63 | 0.23 |
| Gene scores only | 0.28 | 0.18 | 0.82 | 0.72 | 0.21 |
II. Cluster analysis
The weak performance of the initial modeling attempts led us to reason that there were not enough chemical or biological features in common within either the CP-positive or CP-negative chemical subsets for the classifier to find patterns significant enough for successful models. To investigate this possibility, we focused just on the CP-positive chemicals and clustered this subset by gene scores and chemotype. The resulting cluster diagram (Figure 3) shows that the 63 CP-positive chemicals had a wide variety of bioactivity patterns and structural patterns, but some distinct clusters emerged when examined visually. We hypothesized that chemical-bioactivity profiles share an underlying pattern that could be used to infer an MIE. Six clusters were selected for further evaluation. This selection was based on prior interest and background knowledge. We examined each of the six clusters to determine what attribute (molecular activity or structural feature) contributed significantly to the cluster, and then we examined the CP-negatives and CP-positives together with regard to that significant attribute to see if any local predictivity emerged.
Figure 3.

Clustering of 63 cleft palate active chemicals by gene scores and chemotypes.
Cluster A (Figure 4) comprises six chemicals. Structurally, aldrin, endrin, and dieldrin appear very similar to each other, and retinol and retinoic acid are also highly related, whereas aspirin is a structural outlier. These distinct structure classes, in turn, are grouped by biological similarity with respect to retinoic acid receptor assay activity (Figure 4i). Five of the compounds in the cluster have potent activity at the RARA, RARB, and RARG targets, and the sixth chemical, aspirin, has low activity at RARA, RARB, and RARG. We restricted our biological focus to these three RARs but extended our chemical focus to both CP-positive and CP-negative chemicals. A dataset was created of both CP-positive and CP-negative chemicals that had activity at any of the three retinoic acid receptors RARA, RARB, and RARG. This dataset contained gene scores and chemotypes for 73 chemicals: 12 were CP-positives and the remaining 61 were CP-negatives. However, the CP-positives did not cluster together and were instead distributed throughout the space, indicating that this set of biologically focused features did not resolve CP-positives from CP-negatives (data not shown). We sorted the chemicals by their activity at each of the RAR targets, in turn. Whereas the sorted list of RARA and RARB did not show any visible enrichment for CP-positive chemicals, the sorted list of hits on the RARG gene score showed that all of the chemicals in Cluster A, except aspirin (with a low gene score of 4.39), were ranked in the top 10 with four at the top of the list (Figure 4iii). Bromuconazole, a chemical with no evidence linking it to cleft palate, had a high gene score (10.8) for RARG and is the only one of 7 chemicals with a score over 8.0 that is CP-negative (Supplementary Table 2).
Figure 4.

Analysis of Cluster A. i) Details of Cluster A for Gene Scores and Chemotypes; ii) Chemicals in Cluster A; iii) RARG activity of CP-positive and CP-negative chemicals. When activity at RARG gene is sorted by the score, chemicals with a gene score over 8.0 are enriched for CP-positive activity. This enrichment is supported by results from a Probit model run in R using the MASS library. RARG contributes to the probability of predicting CP-positives with a score of 0.07183 (p-value<.05).
Cluster B contains seven CP-positive chemicals that demonstrated activity in the cytochrome P450 in vitro assays (Figure 5). Six of these chemicals are conazoles and, consequently, contain several structural elements in common, including a triazole ring, represented by ToxPrint 617 (Figure 1). The seventh, monobutyl phthalate, does not contain the triazole ring common to the other chemicals in the cluster. The chemicals in Cluster B hit at least one of the cytochrome P450 genes. To begin our examination of Cluster B, we selected the 30 chemicals in our original dataset that contained a triazole ring or the similarly constructed thiadiazole and clustered them by their gene scores to see if this group of chemicals showed patterns in bioactivity that would discriminate between the CP-positives and CP-negatives. The resulting diagram shown in Figure 5iii has two primary subclusters: one (top cluster in the figure) has a mixture of CP-positives and CP-negatives, while the bottom cluster has CP-negative chemicals only. The CP-positives significantly associate with the top cluster in Figure 7 (P = 0.02) by a 2×2 chi-squared test of independence.
Figure 5.

Analysis of Cluster B. i) Details of Cluster B for Gene Scores and Chemotypes; ii) Chemicals in Cluster B; iii) Clustering gene scores for the subset of CP-positive and CP-negative chemicals that contain a triazole, the key descriptor in Cluster B, or the similar thiadiazole ring. The two main clusters differ in their makeup. One (top) has a mix of CP-negative and CP-positive chemicals (1 prefixed to name indicates CP-positive) and the other cluster (bottom) has only CP-negative chemicals.
Figure 7.
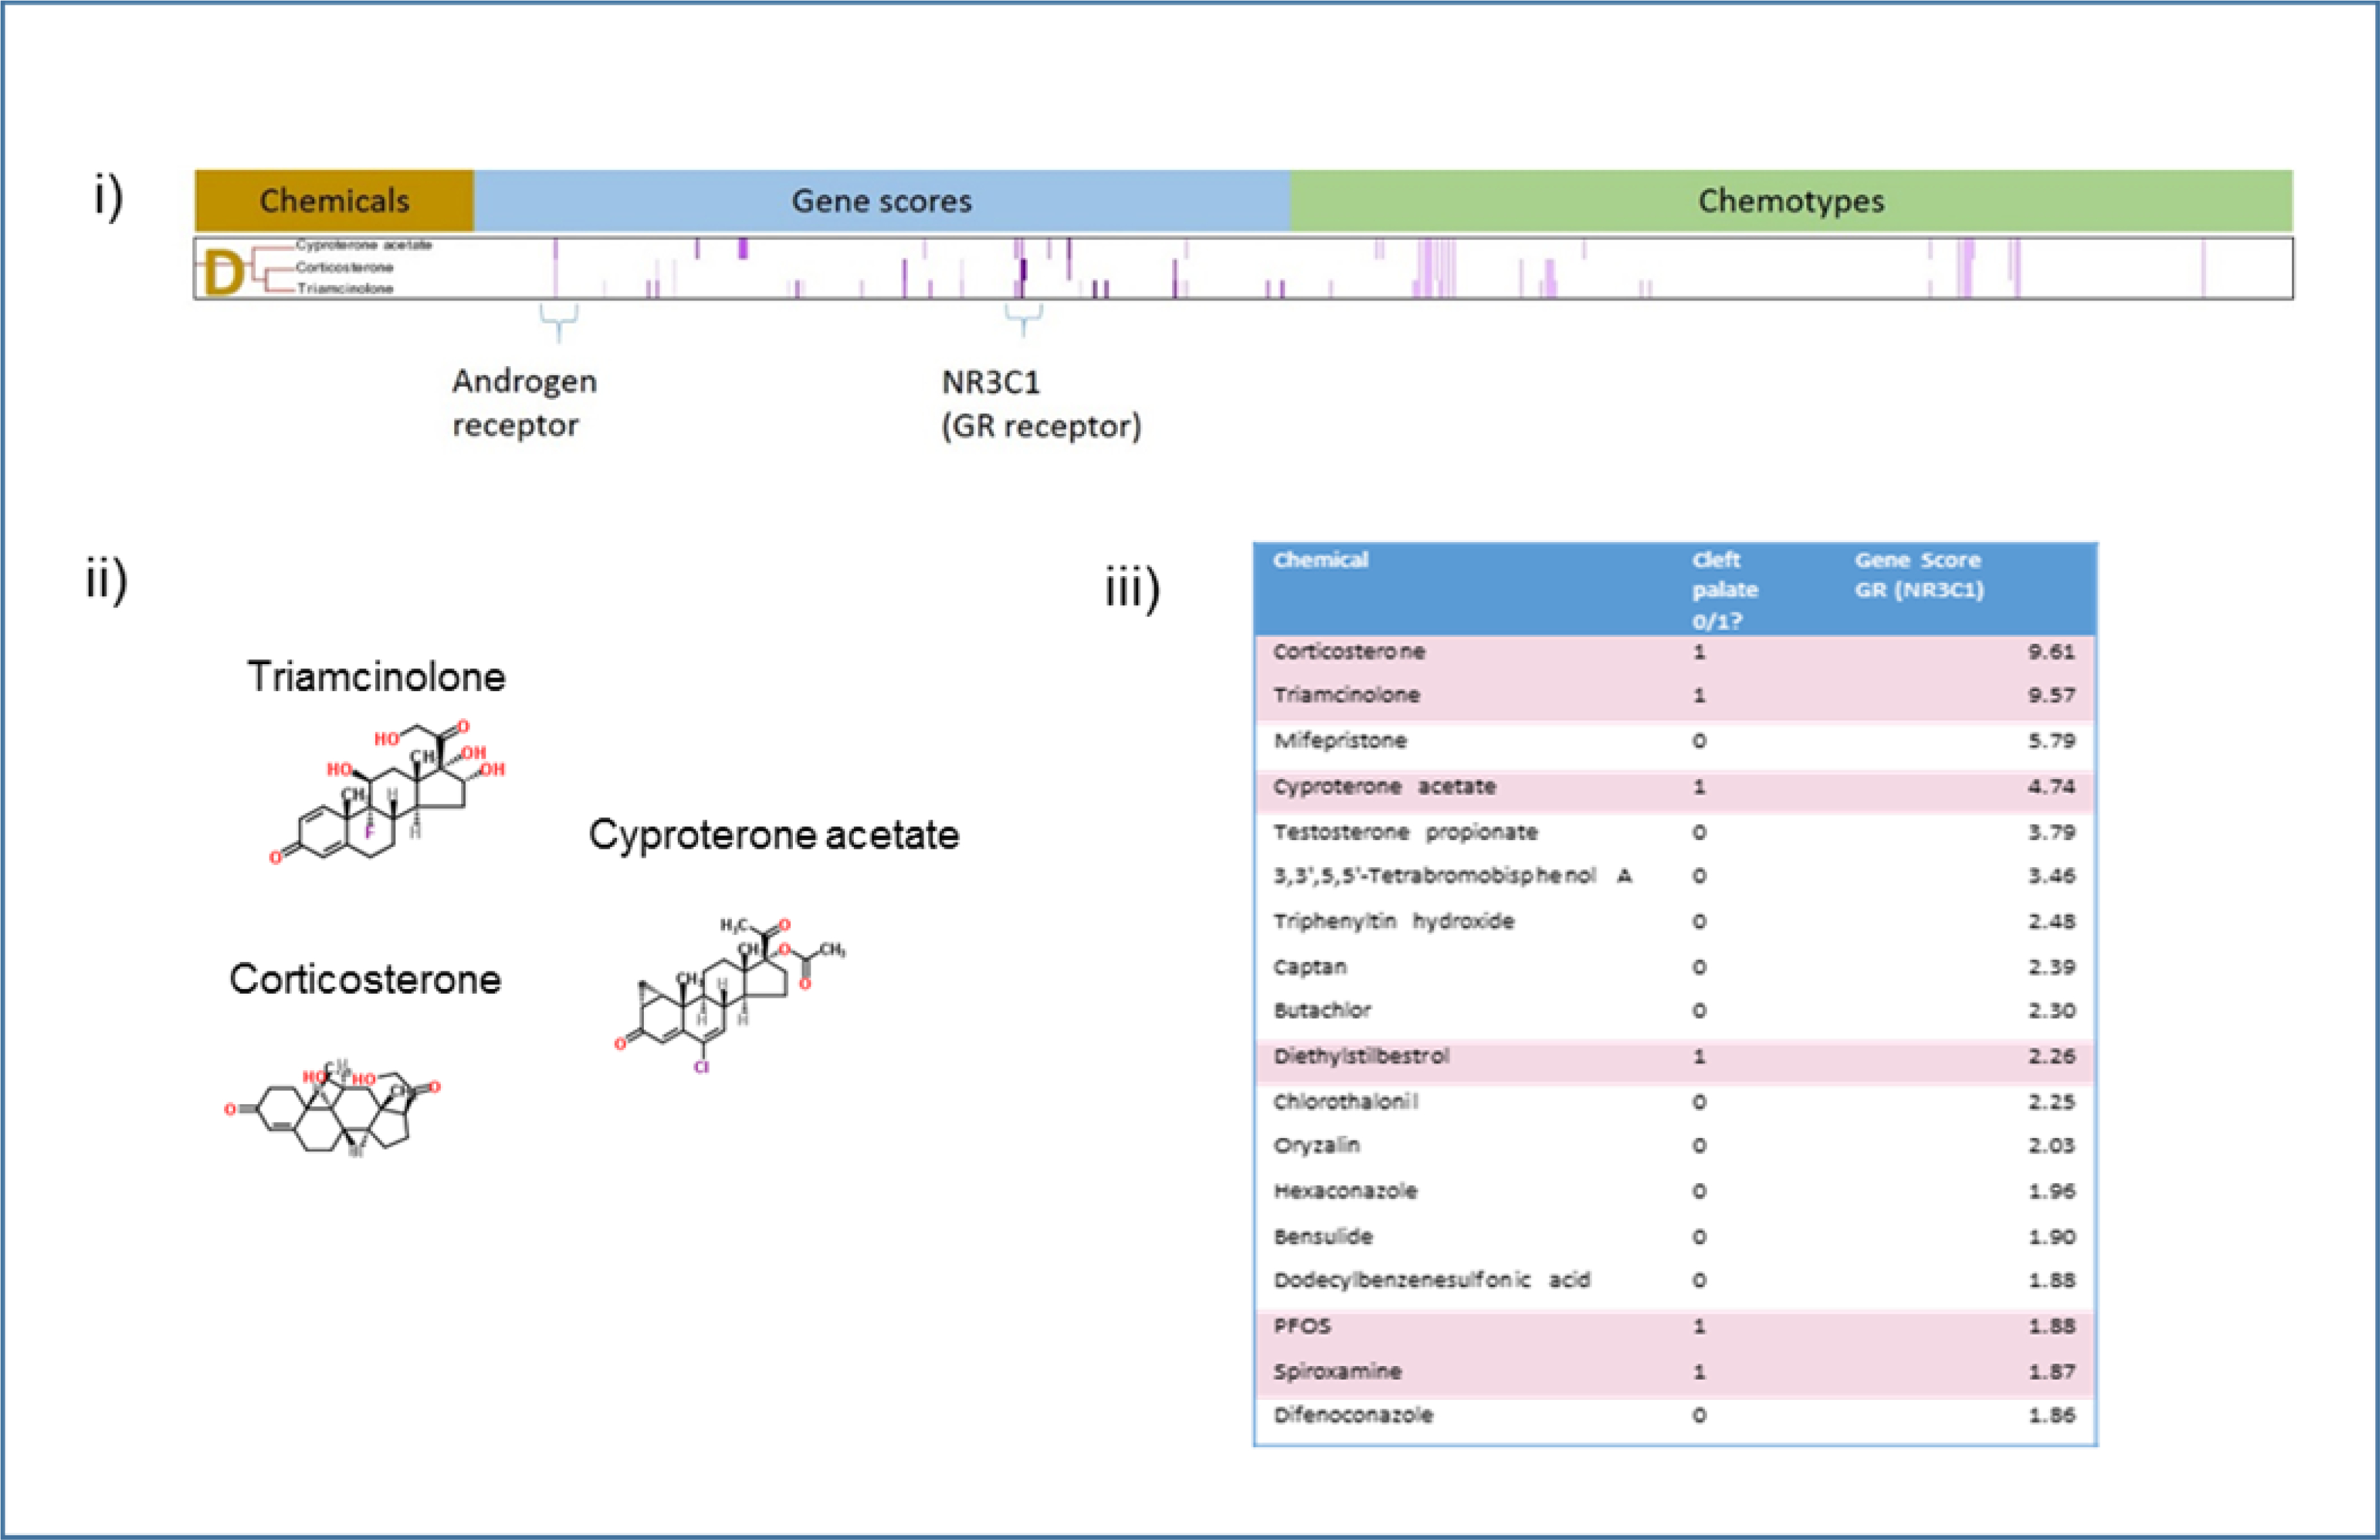
Analysis of Cluster D. i) Details of Cluster D for Gene Scores and Chemotypes; ii) Chemicals in Cluster D; iii) Clustering gene scores for the subset of CP-positive, the key descriptor in Cluster D. The two main clusters differ in their makeup. This enrichment is supported by results from a Probit model run in R using the MASS library. NR3C1 contributes to the probability of predicting CP-positives with a score of 0.22721 (p-value<.01).
Cluster C contains chemicals that hit a variety of G-protein coupled receptors (GPCRs) : SR125047 (a pharmaceutical), volinanserin (MDL 100907), haloperidol, chlorpromazine, and diphenhydramine. The ToxCast activity is consistent with their known, published activity. Volinanserin is a serotonin 5-HT2a receptor antagonist (Marek & Aghajanian, 1994); haloperidol and chlorpromazine are dopamine receptor antagonists; diphenhydramine is a histamine H1 receptor antagonist. Four of the five chemicals in Cluster C (chlorpromazine, volinanserin, haloperidol, and diphenhydramine) hit several genes in common, including the adrenergic alpha 2B receptor, dopamine D1 receptor, serotonin 5-HT1A receptors, and the serotonin 5-HT7 receptor (Figure 6). For each of these receptors in turn, we looked at both the CP-positives and CP-negatives with assay results and chemotypes to identify internal patterns in the restricted space. The clustering results for adrenergic alpha 2B (Figure 6iii) showed two coherent clusters determined by visual inspection. One cluster of 5 chemicals had no CP-positive chemicals, and the other had significantly associated CP-positives (P = 0.02) by a Chi-squared test of independence. We performed a similar clustering exercise on the 14 chemicals in the set that hit serotonin 5-HT1A, the 13 chemicals that hit serotonin 5-HT7, and the 13 chemicals that hit dopamine D1. None of these analyses showed a clean separation between CP-positives and CP-negatives. A visual inspection of the clusters showed that chemicals that fell into the CP-positive cluster bind more than one type of GPCR and could thus be considered “promiscuous” in this context.
Figure 6.
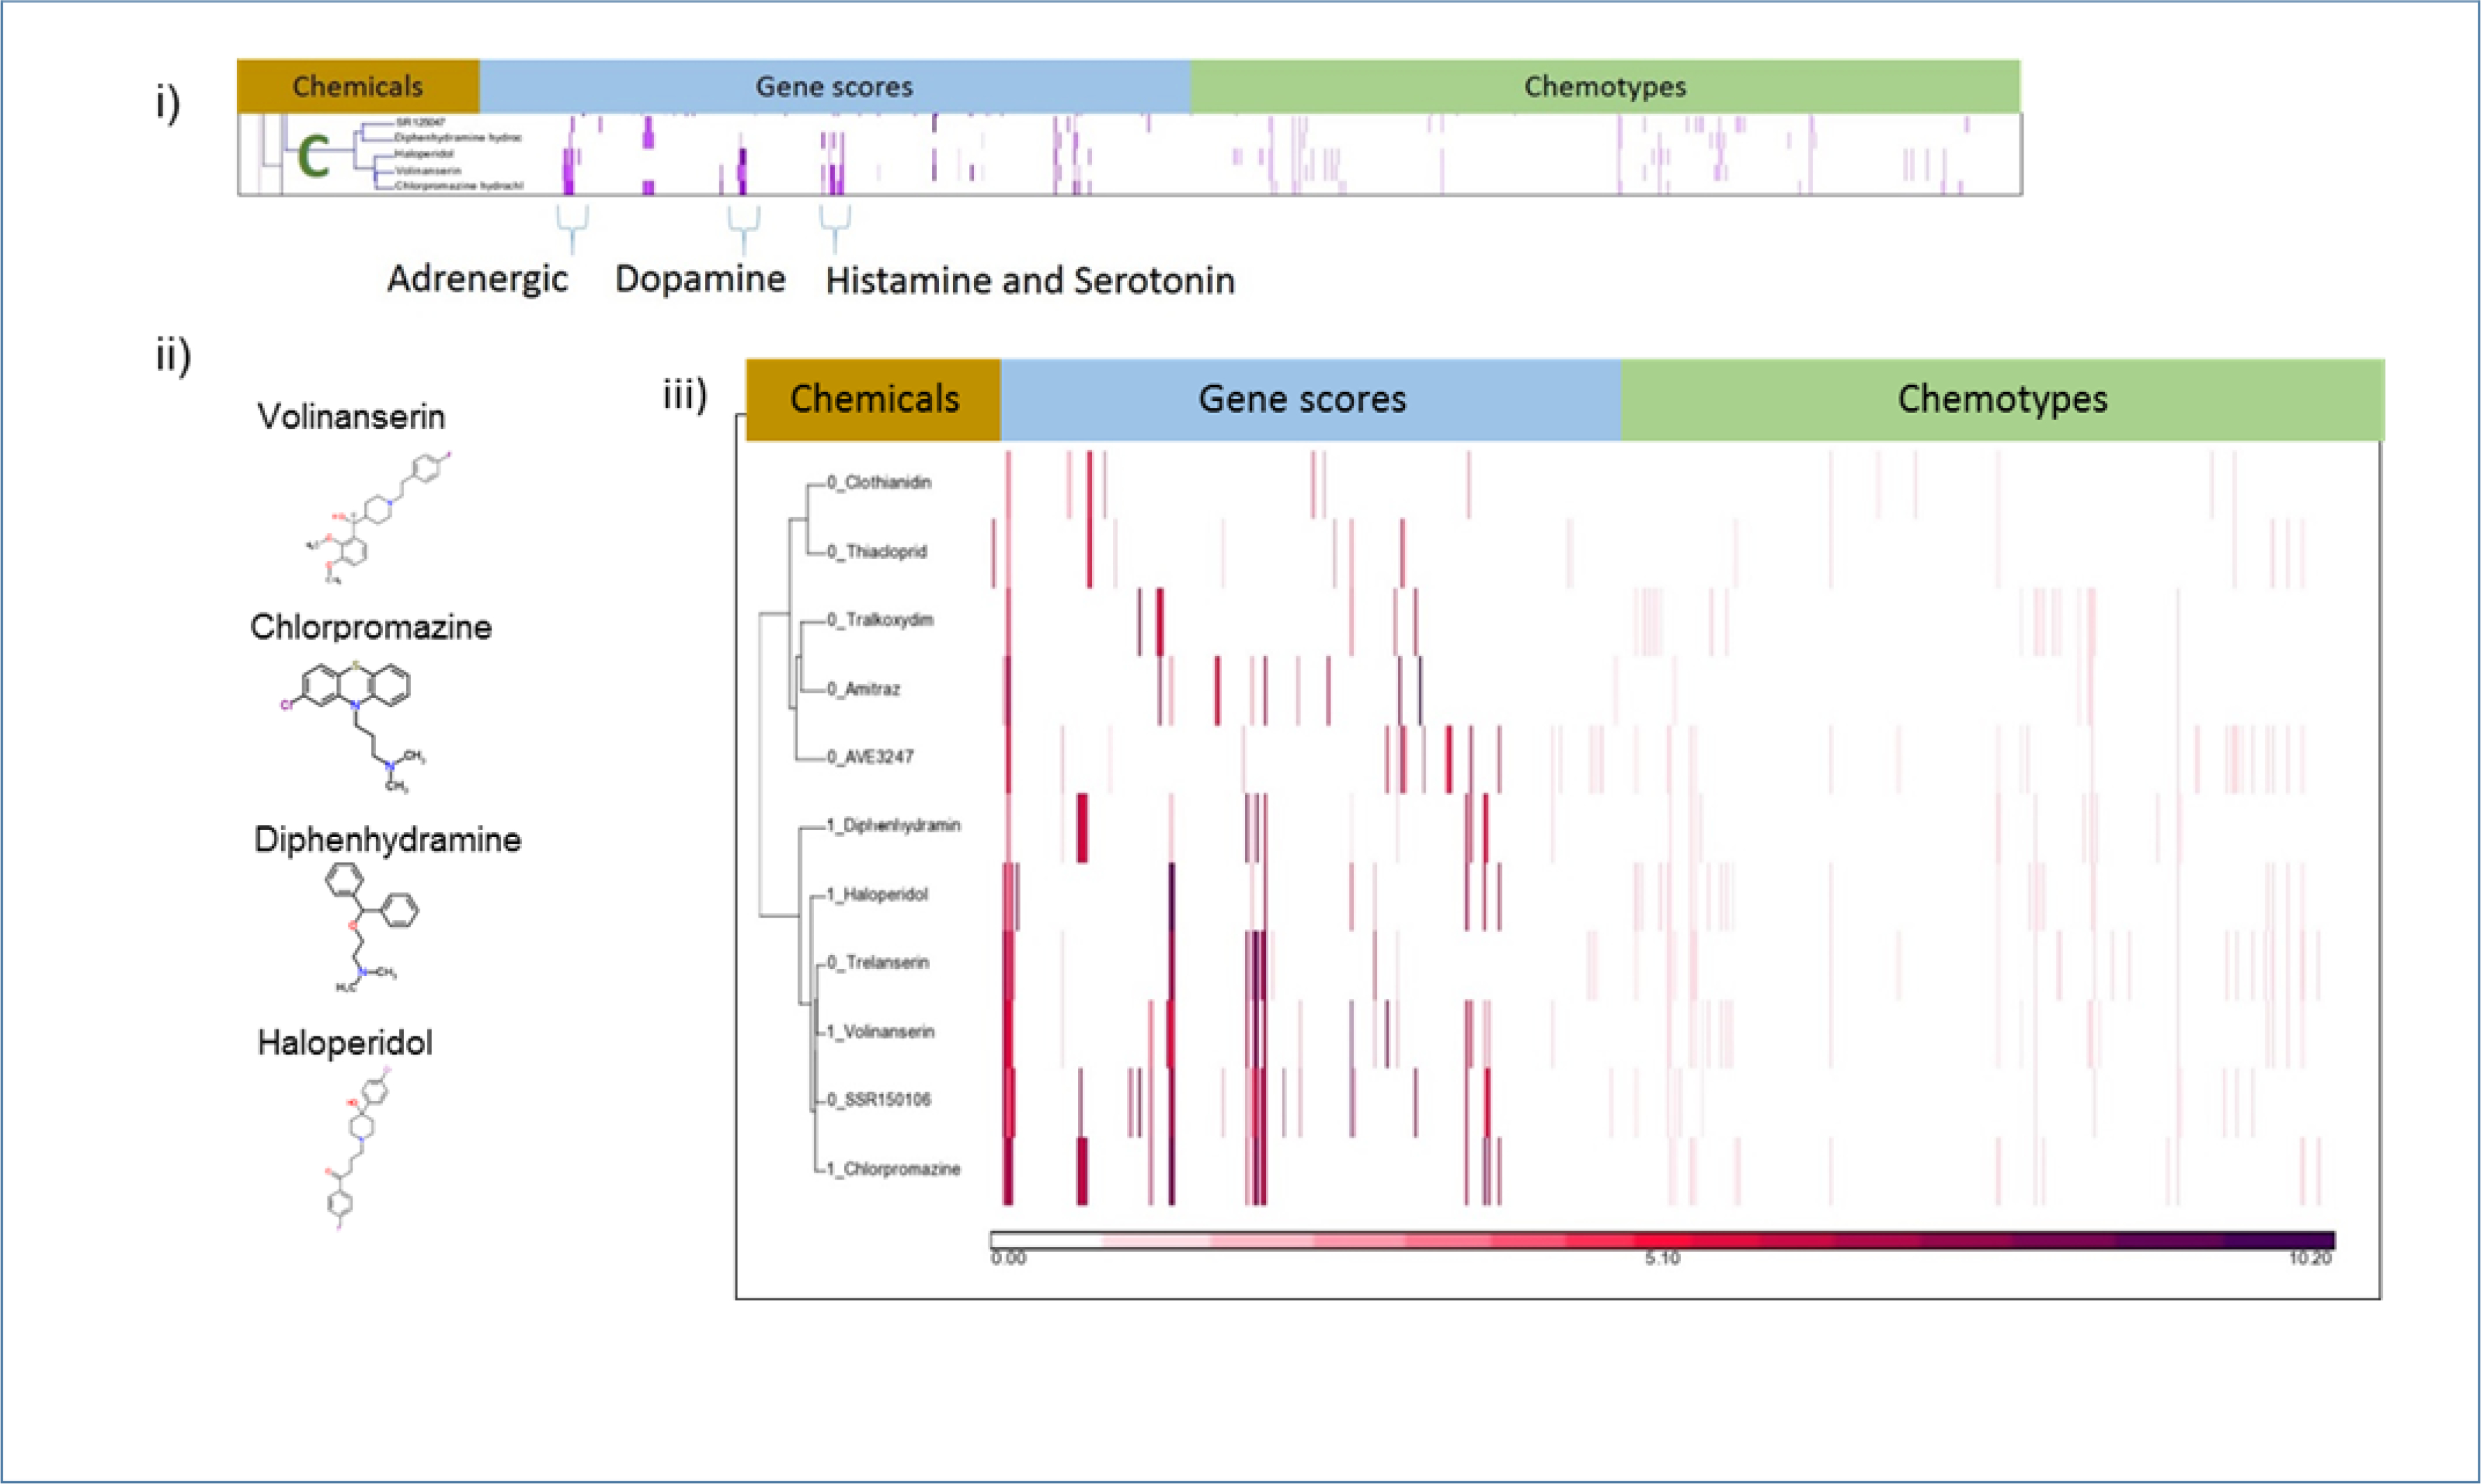
Analysis of Cluster C. i) Details of Cluster C for Gene Scores and Chemotypes; ii) Chemicals in Cluster C; iii) Clustering gene scores for the subset of CP-positive and CP-negative chemicals with activity at the adrenergic alpha 2B receptor, the key descriptor in Cluster C. The two main clusters differ in their makeup. One (bottom) has a mix of CP-negative and CP-positive chemicals (1 appended to name indicated CP-positive) and the other cluster (top) has only CP-negative chemicals.
Cluster D contains three known ligands of glucocorticoid receptor: triamcinolone, corticosterone, and cyproterone acetate (Figure 7). The central gene target in Cluster D is the glucocorticoid receptor (GR) (gene NR3C1). A simple ranking of the chemicals (both the CP-positives and CP-negatives) demonstrated a qualitative positive association between gene score and CP-positive chemicals. Of the 32 chemicals in this set that had activity at the glucocorticoid receptor, eight are known to cause cleft palate (Supplemental Table 3). When the chemical list is ranked by the potency, three of the top five chemicals are CP-positives: corticosterone, triamcinolone, and cyproterone acetate (Figure 7iii). Of the top four chemicals that hit the glucocorticoid receptor, mifepristone is the only one with no clear evidence that it causes CP.
Cluster E contains two chemicals: caffeine and theophylline. These chemicals have both similar structural elements and similar activity at the adenosine receptors and phosphodiesterase 10 (PDE10), the key gene targets behind the cluster (Figure 8). Caffeine and theophylline are the only two chemicals that hit PDE10. In contrast to Cluster B, the chemicals that hit the adenosine receptor represented in Cluster E are not particularly promiscuous. Most chemicals that hit ADORA1 (A1 adenosine receptors) also hit ADORA2A (A2a adenosine receptors), but there is little CP activity for these chemicals in the set of GPCR targets in Cluster C. When all the chemicals hitting the adenosine A1 receptor are sorted by gene score, an enrichment is apparent (Figure 8iii). Three of the five top chemicals in the sorted list are CP-positives.
Figure 8.
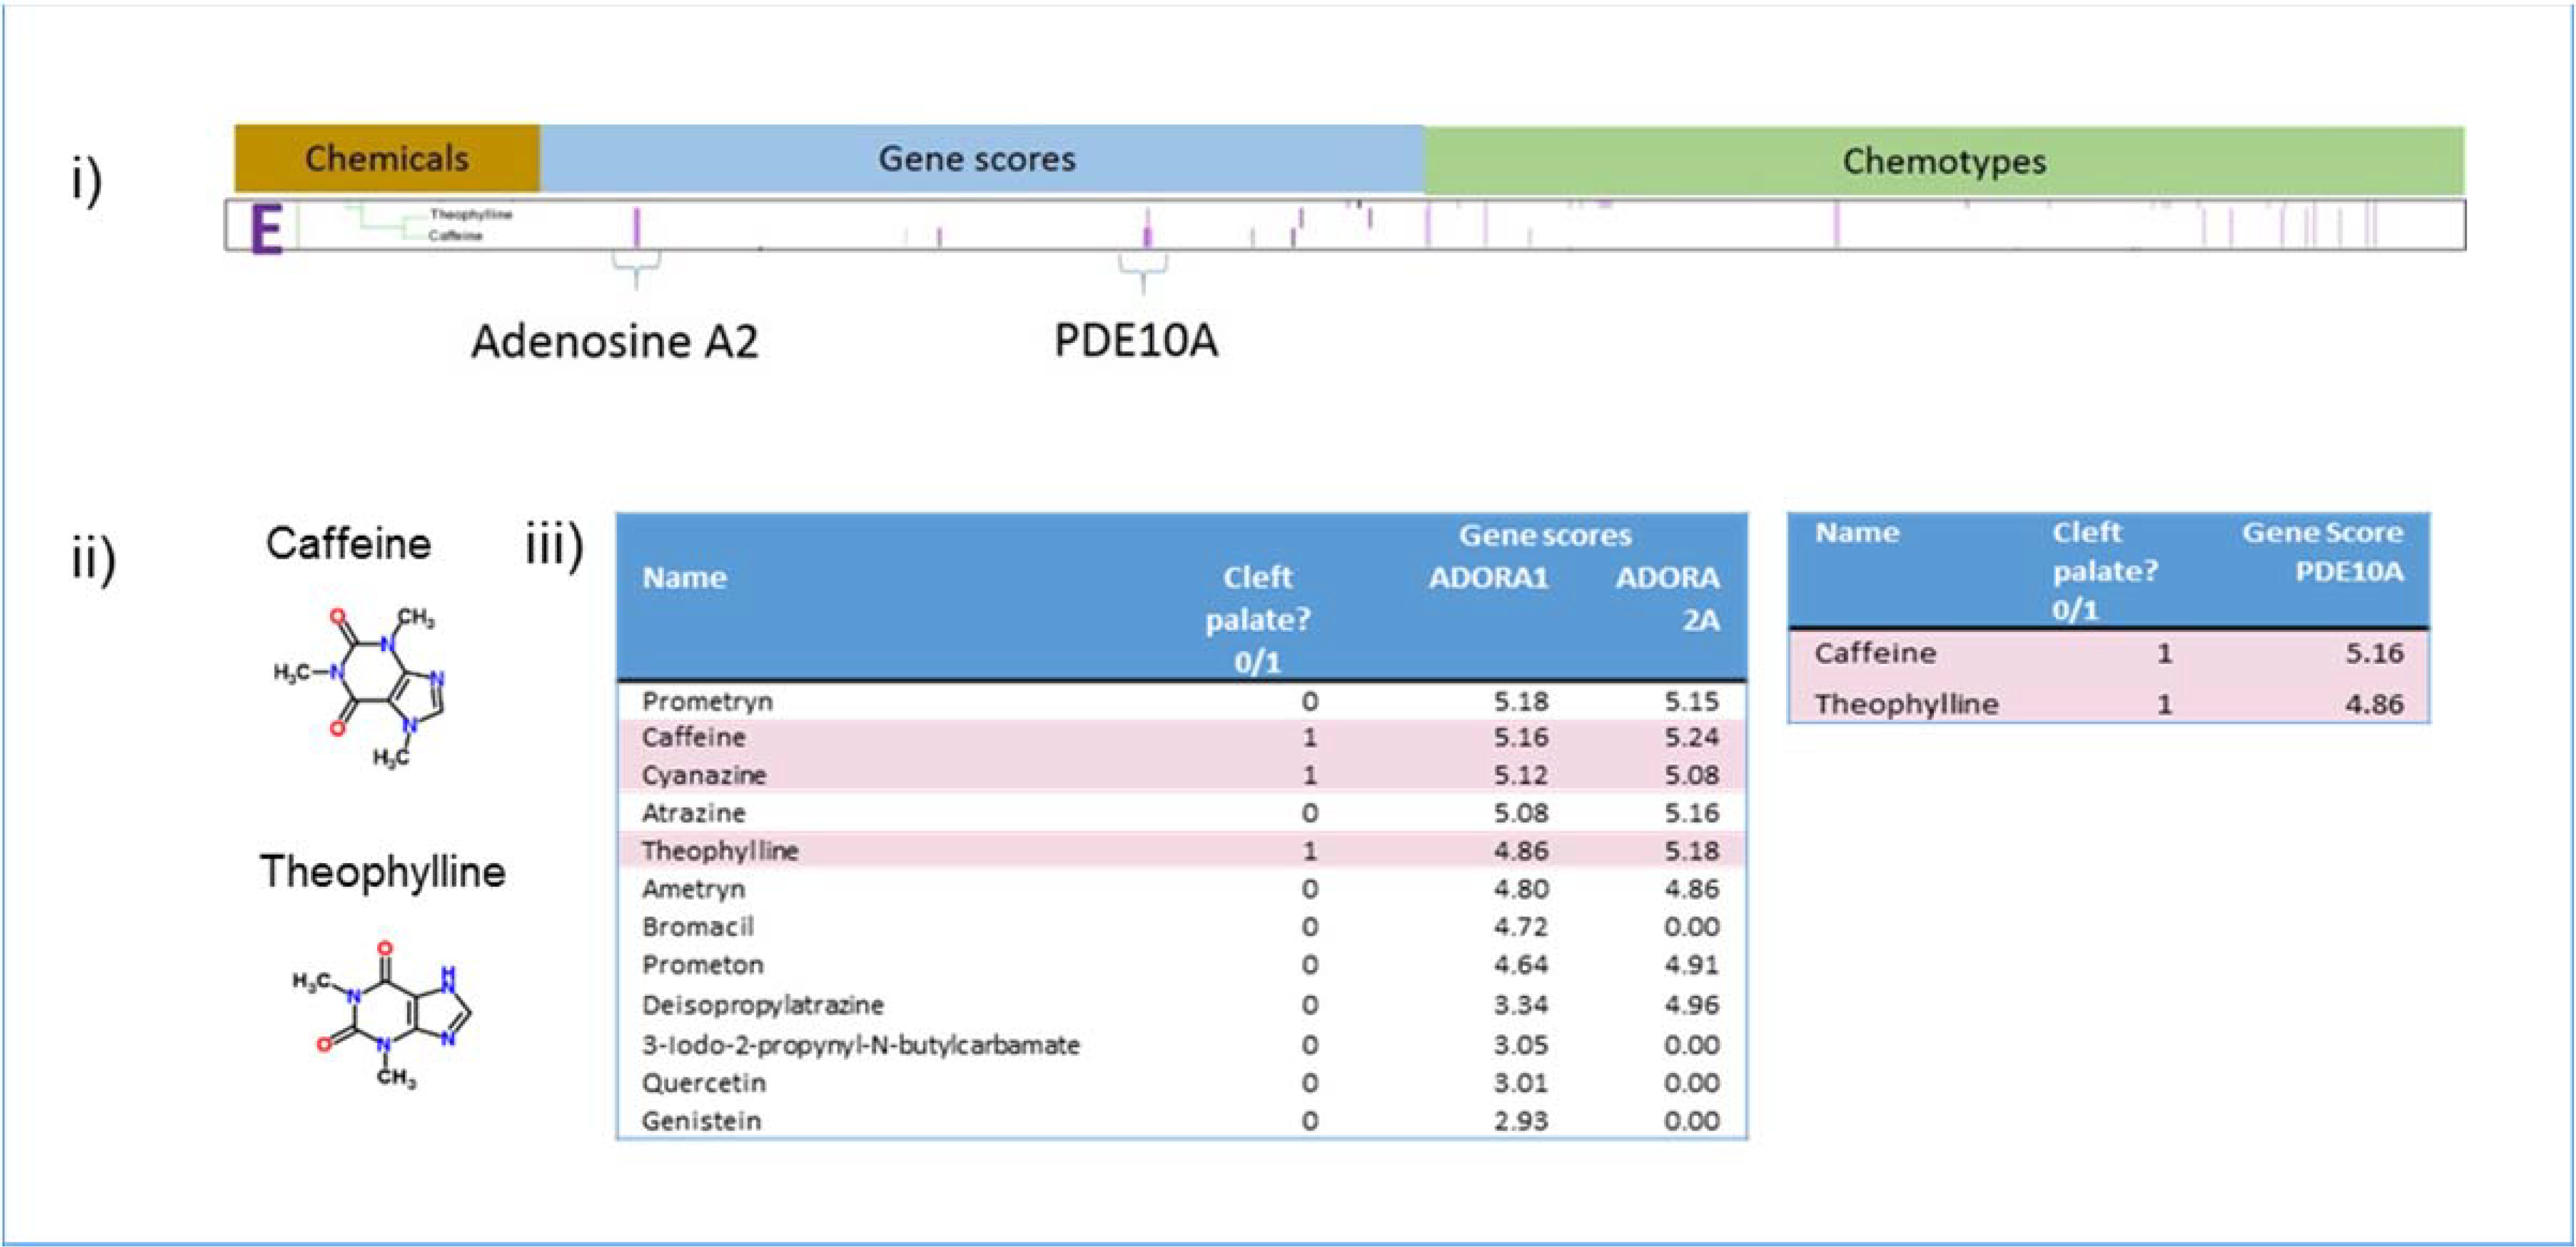
Analysis of Cluster E. i) Details of Cluster E for Gene Scores and Chemotypes; ii) Chemicals in Cluster E; iii) Gene scores sorted in descending order of potency for ADORA1, ADORA2A, and PDE10A showing enrichment at higher potencies for CP-positive chemicals. This enrichment is supported by results from a Probit model run in R using the MASS library. ADORA2A contributes to the probability of predicting CP-positives with a score of 0.11181 showing a trend with a non-significant probit coefficient. For PDE10A, 100% of hits were CP-positive.
Cluster F contains four chemicals: valproic acid, oxytetracycline dihydrate, mancozeb, and a metabolite of mancozeb, ethylene thiourea (Figure 9). Although the four chemicals in Cluster F do not share common structural features (Figure 9ii), all four hit protein tyrosine phosphatase, non-receptor type 4 (PTPN4), three hit protein tyrosine phosphatase, non-receptor type 9 (PTPN9), and three hit phosphatase and tensin homolog (PTEN). Four out of the top five chemicals in the sorted list of chemicals that hit PTPN4 are CP positives, with the only exception being maneb, which had the highest gene score for PTPN4 and is structurally related to mancozeb, yet maneb is not associated with cleft palate (Figure 9iii). PTPN9 and PTEN were less strongly associated with CP positive chemicals. Mancozeb and oxytetracycline dihydrate were both positive for phosphatases PTPN4, PTPN9, and PTEN and exhibited non-zero gene scores for receptor tyrosine kinases (RTK) FLT4, CSF1R, FGFR1, and IGF1R, which suggests that the activity of chemicals in cluster F may generally be associated with altered protein tyrosine kinase/phosphatase activity.
Figure 9.
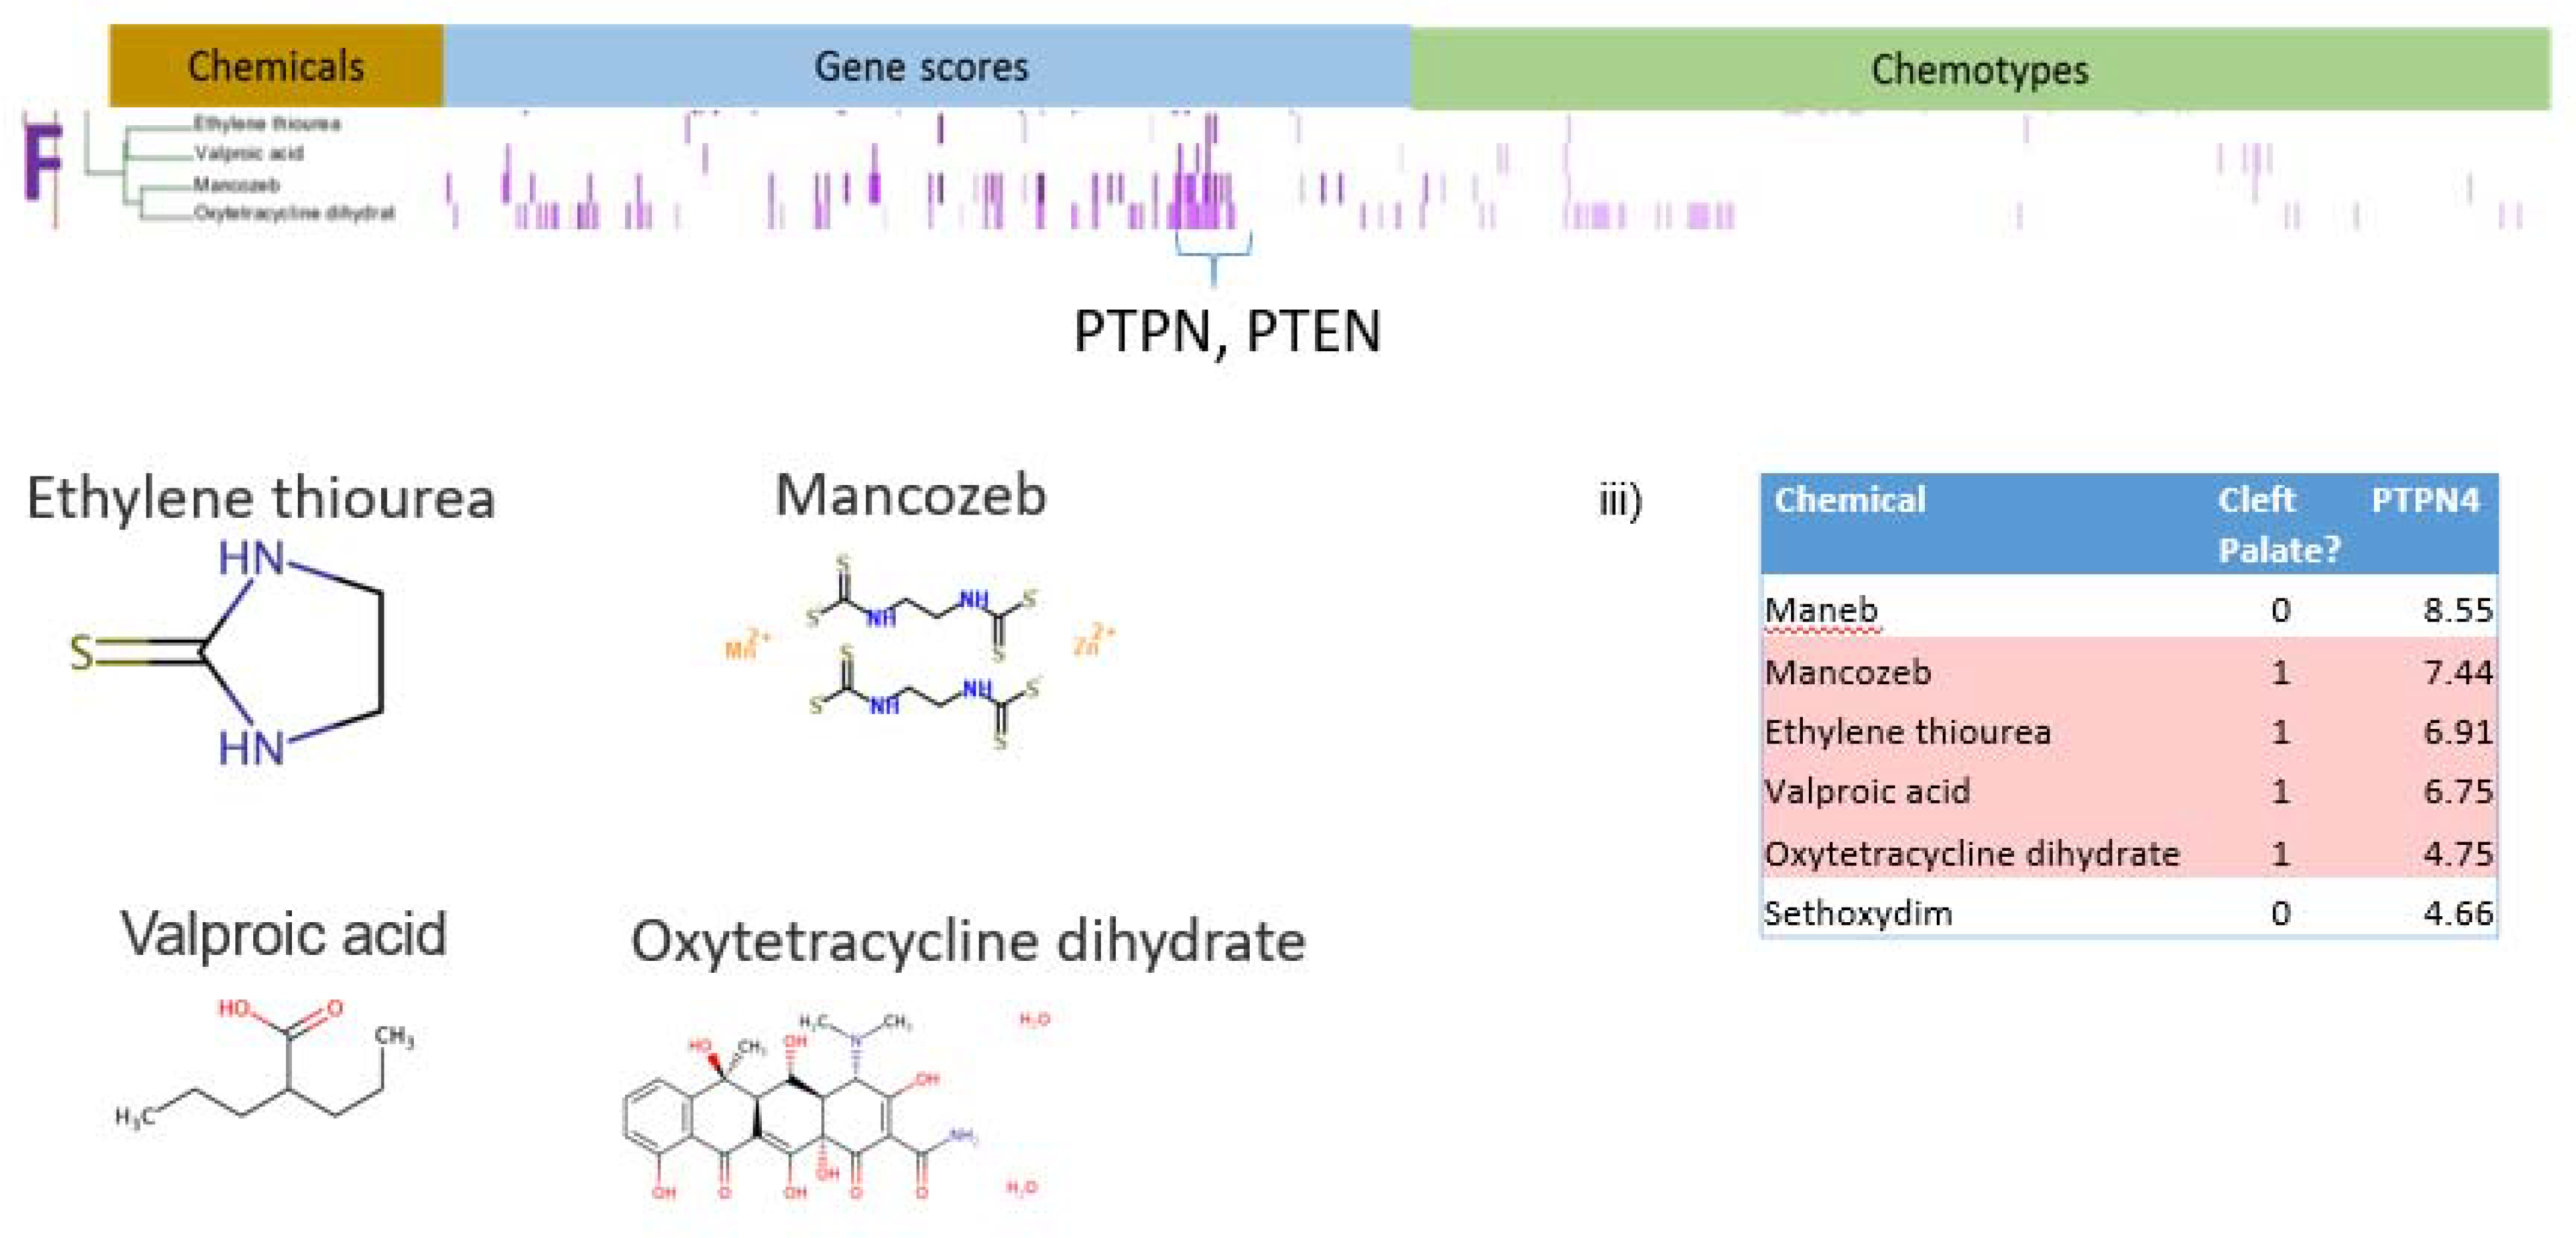
Analysis of Cluster F. i) Details of Cluster F for Gene Scores and Chemotypes; ii) Chemicals in Cluster F; iii) Gene scores sorted in descending order of potency for PTPN4 showing enrichment for CP-positive chemicals. This enrichment is supported by results from a Probit model run in R using the MASS library. PTPN4 contributes to the probability of predicting CP-positives with a score of 0.25377 (p-value<.01).
III. Decision Tree Stumps
Growth and fusion of the embryonic palate is a complex process involving many biochemical interactions with the potential of being disrupted by outside agents acting through various MIEs. This inherently complex biological phenomenon was difficult to predict globally using a modeling approach with a combination of biological and chemical descriptors, applied to a highly imbalanced dataset consisting of 13% CP-actives. We subsequently found that local chemical-bioactivity patterns identified through clustering of CP-actives had some predictive capability. Conceptually, the methods in the second phase of this work can be seen as the initial steps in building a decision tree framework for identifying putative CP-positive chemicals, a framework in which the initial nodes are indicated through clustering ToxCast bioactivity profile and chemotype information. (Initial nodes or one level decision trees are called stumps.)(Witten, Frank, & Hall, 2011) For example, RARG was a strong contributor to the formation of a cluster (Cluster A) and, when CP-positive and CP-negative chemicals were sorted by RARG gene score, the chemicals at the top of the list were enriched for CP-positives. If we transform these observations to a decision tree stump, RARG gene scores are the initial decision node (Figure 10a). A gene score cutoff of 8.0 parses two groups of chemicals, one with predominantly CP-positives and the other with predominantly CP-negative chemicals. The separation is far from complete, and so the next steps in tree-building would focus on confirming the initial branches, as well as finding attributes to be tested in subsequent branches to continue to separate CP-actives from inactives. The trees in Figures 10d, 10e, and 10g are similar; they can be seen as first decision branches in trees with GR receptor activity, ADORA1 activity, and PTPN4 activity, respectively, with initial node inputs and gene score cut-offs serving as decision points.
Figure 10a – 10g.
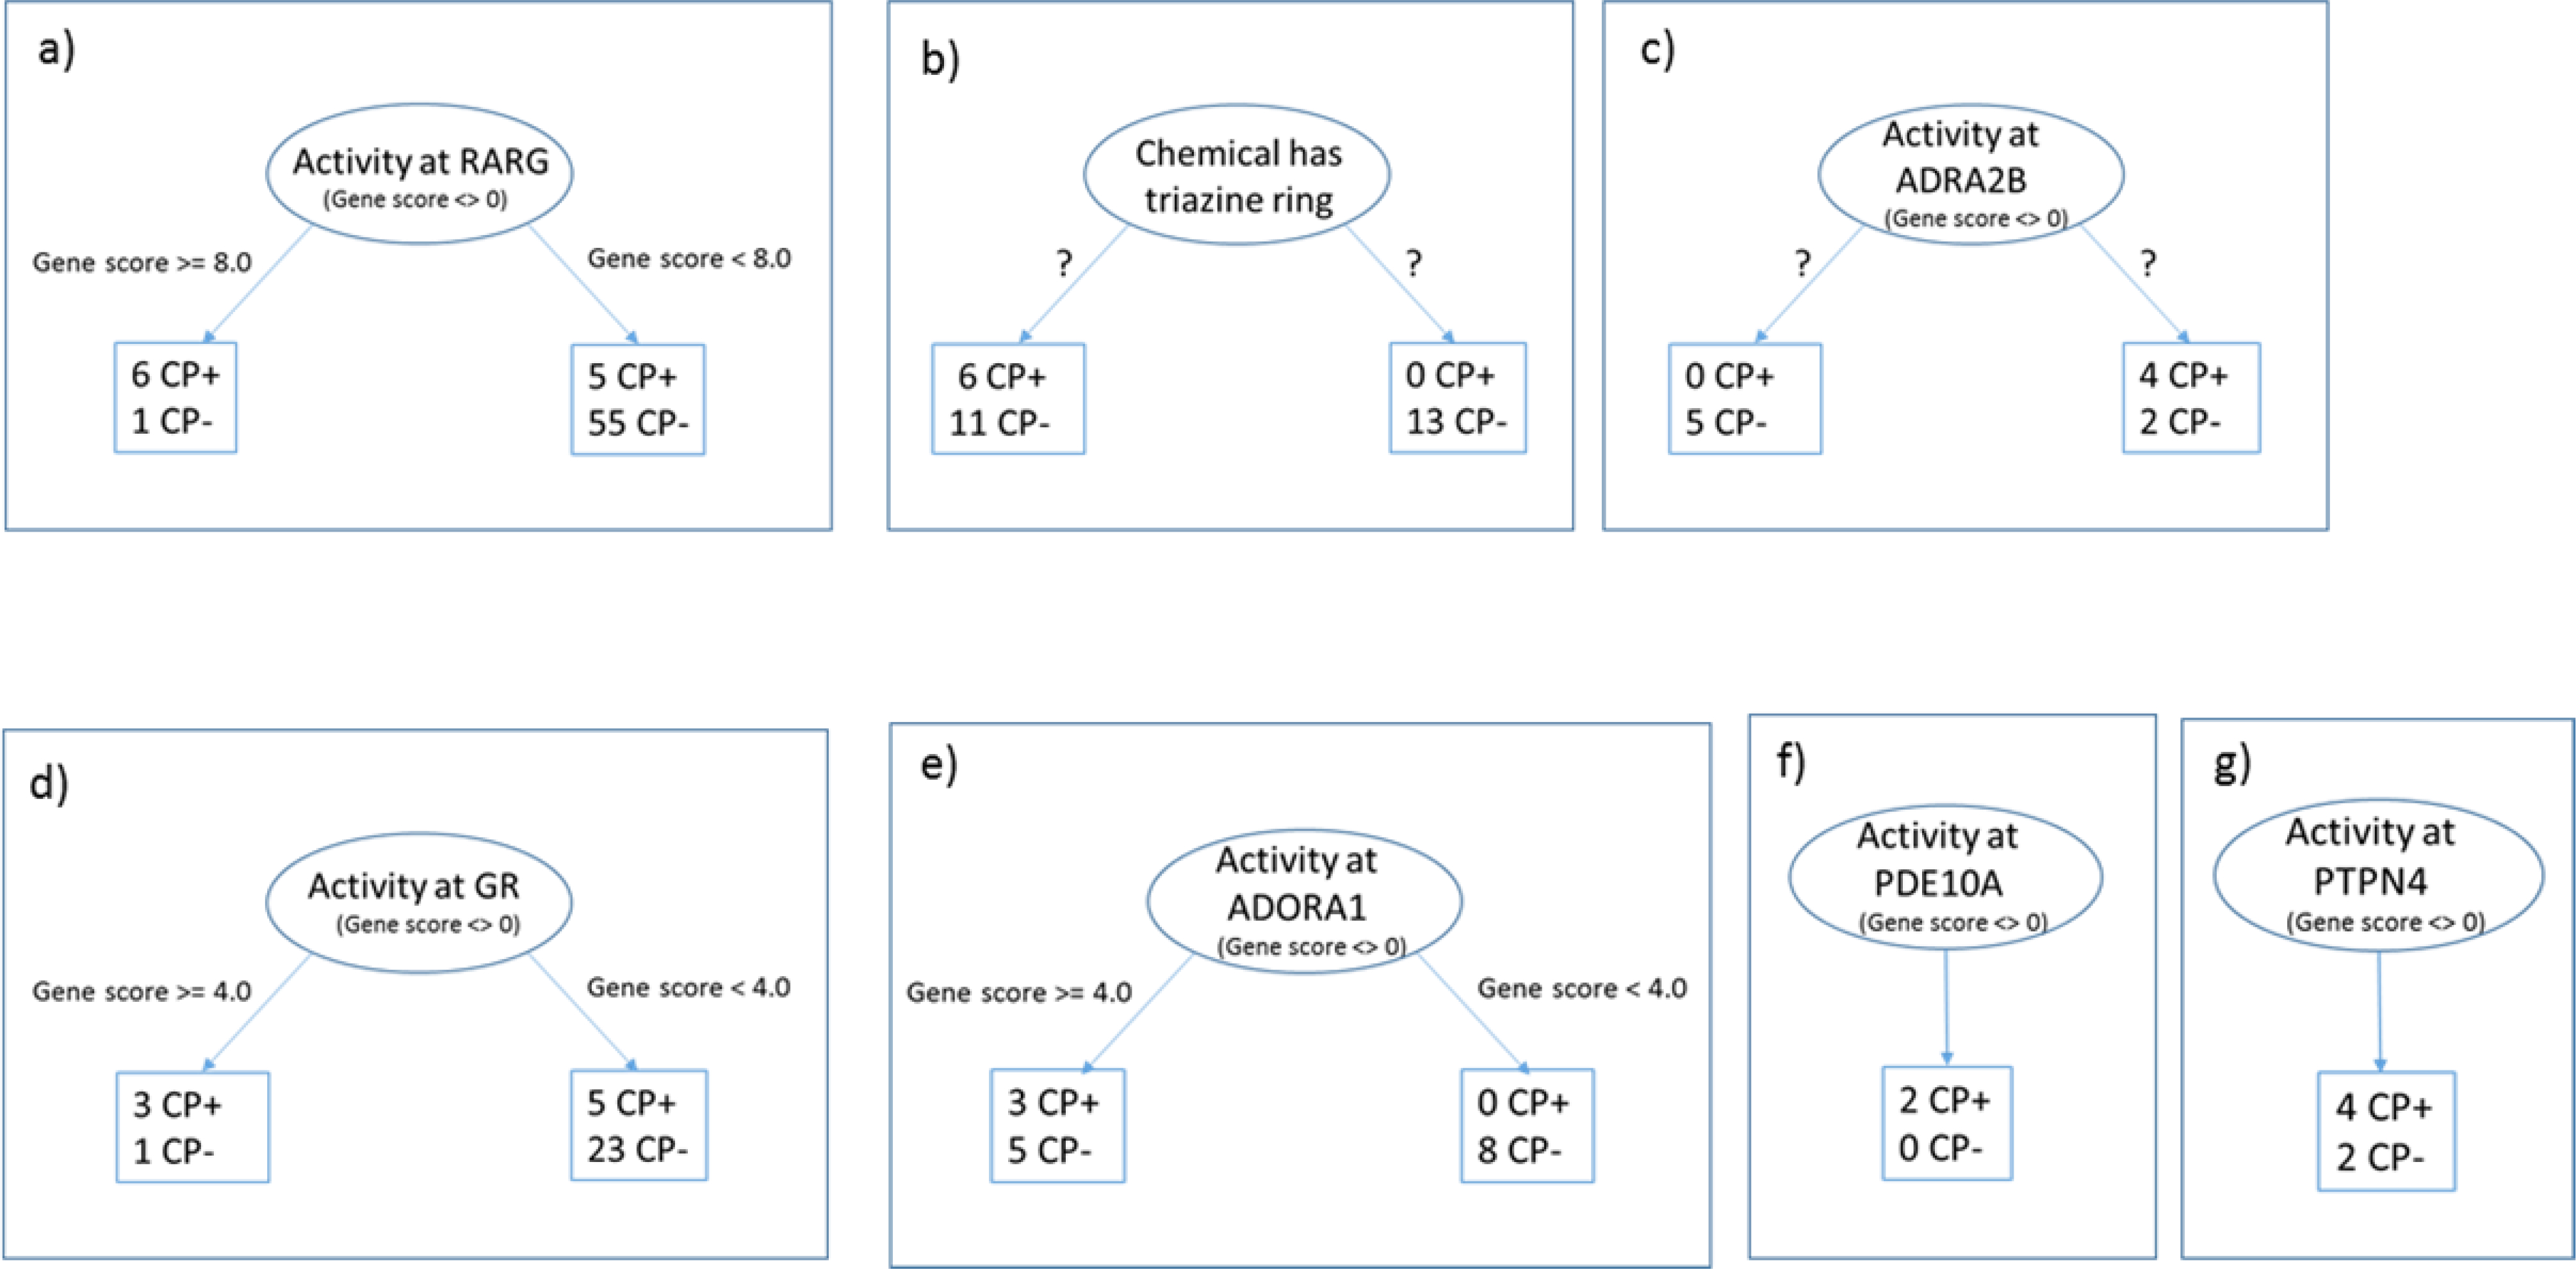
Decision tree stumps constructed using these results. The initial node in each diagram splits into sub-branches depending on the value of a descriptor. In branches a,d,e, f and g these decision points have been putatively identified as gene score ranges. For branches b and c, unsupervised clustering separates the chemicals, but the descriptors and value ranges are unknown. CP+ stands for CP-positive chemicals; CP- for CP-negative.
Figure 10b depicts a tree stump describing what was learned from investigating Cluster B. In this case the top node is entered if the chemical contains a triazole ring. The clustering of CP-positives and CP-negative chemicals with triazole rings shown in Figure 5iii shows two distinct clusters, one with no CP-positives, and one with a mix of CP-positives and CP-negative chemicals. The question marks on Figure 10b indicate that it is hard to tell what attribute, or more likely, combination of attributes, contribute to the separation of the two clusters in Figure 5iii. A decision tree that accurately separates triazole-containing compounds into CP-positives and CP-negatives could build upon early efforts using chemotype enrichment approaches, in which both expanded structural frameworks and physical chemical properties (e.g., charge on triazole linkage atom) were suggested to further discriminate CP-actives (Mostrag-Szlichtyng et al., 2013; Volarath et al., 2010; Yang et al., 2015). Similar constraints apply to the tree in Figure 10c. This tree is an attempt to depict what is shown in the subcluster diagram from Figure 6iii. Although there is some effective separation of chemicals visible in the diagram, it is difficult to tell what set of attributes likely contributed to the results. That ambiguity is reflected in the tree diagram by question marks. On the other hand, Figure 10f depicts a simpler tree stump: only two chemicals had gene scores >0 for PDE10A and they were both CP-positives.
IV. Adverse outcome pathway (AOP) construction
We have identified a number of gene targets that may be molecular initiating events (MIEs) in AOPs for cleft palate. To evaluate the hypothesis that the gene targets behind the clusters are likely MIEs for cleft palate, we performed a review of biomedical literature in PubMed (Baker, Knudsen, & Williams, 2017) for known links between the genes and cleft palate in order to construct putative AOPs. The broad steps in palate development are well characterized and provide pathways potentially involved in the disruption of that development. Palate development comprises a complex set of events that take place over several days in the developing embryo (Bush & Jiang, 2012). The beginning of palate development is considered the migration of neural crest cells to the first branchial arch. The formation of the secondary or hard palate begins in mice on day 11 (E11) with the outgrowth of the palatal shelves from each of the maxillary processes. The shelves initially grow vertically alongside the tongue. Between E13 and E14, the shelves elevate to a horizontal position above the tongue (Ray & Niswander, 2012). The elevation and subsequent expansion of the shelves across the oral cavity brings the two shelves into contact and allows fusion to take place. The fusion step is complex, requiring that the epithelium that covers each of the shelves adheres and the basal epithelium of the two opposing shelves forms a seam referred to as the midline epithelial seam (MES). In normal palatogenesis, the MES is removed and the central mesenchyme becomes continuous. Several events have been thought to contribute to the disappearance of the seam, including migration of the epithelial cells and transformation of epithelial to mesenchymal cells (Abbott, 2010; Bush & Jiang, 2012; Jin & Ding, 2006). More recent work attributes the disappearance of the seam to convergence and extrusion of the epithelial cells (Kim et al., 2015).
AOP for perturbation of retinoic acid receptor
High doses of retinoic acid have been shown to cause CP in the mouse and rat, both in vivo and in palate culture models. Retinoic acid is the physiological ligand for RARs, and retinol is a close structural analog. The activated RAR downregulates the TGFβ/Smad signaling pathway (Degitz, Morris, Foley, & Francis, 1998; Liu et al., 2014), which, in turn, modulates the ratio of MMP2 and MMP9 (Greene, Nugent, Mukhopadhyay, Warner, & Pisano, 2003) and tissue inhibitors of metalloproteinases (TIMP) (Li et al., 2014) in the extracellular matrix (ECM). The net effect of disrupting the ratio of MMPs and TIMPs would be perturbed remodeling of the structural proteins and proteoglycans of the palatal shelves and, thus, altered structural integrity of the palatal ECM (Li et al., 2014). Changes to the amount and stoichiometry of the proteoglycans can have important structural repercussions. Shelf elevation is thought to be powered by the hydration of glycosaminoglycans and hyaluronic acid, which are both hygroscopic molecules that sequester a significant amount of water. Their downregulated remodeling by excess retinoic acid during the critical period of palatogenesis could diminish palatal growth and retard the elevation of the palate into the position required for fusing into an intact structure (Li et al., 2014). Indeed, mice receiving high doses of retinoic acid have smaller palatal shelves (Huang, Lu, Chen, & Liao, 2003).
Excess retinoic acid may exert an influence during the later stages of fusion of the palatal shelves as well as during the growth and positioning of the palatal shelves. Literature supports the observation that excess retinoic acid signaling prevents the medial edge epithelial (MEE) cells from differentiating or transforming, thus preventing the palatal shelves from fusing (Abbott & Birnbaum, 1990; Abbott, Harris, & Birnbaum, 1989). Retinoic acid may also prevent apoptosis of the MEE cells (Shimizu, Aoyama, Hatakenaka, Kaneda, & Teramoto, 2001) thereby preventing their disappearance from the MES and the formation of the intact palate. Figure 11 shows a putative AOP framework for cleft palate. One plausible MIE is retinoic acid receptor activation associated with the chemicals in Cluster A (retinoic acid, retinol, Aldrin, Endrin, and Dieldrin).
Figure 11.

Integrated cleft palate AOPs. An analysis of HTS data, chemotypes, and evidence from mining the biomedical literature resulted in a networked set of cleft palate AOPs. (RA- retinoic acid; GPCR – g-protein coupled receptors; GRs – glucocorticoid receptors; RTKs – receptor tyrosine kinases; GF – growth factor; MMP - matrix metalloproteinases; /TIMP -Tissue Inhibitor of Metalloproteinase; TGF – transforming growth factor; ECM - extracellular matrix; EMT - epithelial-mesenchymal transition; MEE - medial edge epithelial)
AOP for CYP26 inhibition
The triazole compounds in Cluster B are anti-fungal agents used in agriculture and to treat human fungal infections. These compounds are thought to inhibit the cytochrome P450 enzyme CYP51 in fungi, thereby interfering with steroid biosynthesis involved in the construction of the fungal walls (Menegola, Broccia, Di Renzo, & Giavini, 2006). In mammals, triazoles inhibit a variety of CYPs, including CYP3A4, CYP2C9, CYPC19, and CYP26. In development, CYPs may play a role in controlling the synthesis and elimination of morphogenic compounds in a temporal and spatial manner to drive development of the embryo (Stoilov, Jansson, Sarfarazi, & Schenkman, 2001). In palate formation, the action of CYP26 is likely very important because the enzyme degrades retinoic acid. Blocking CYP26 causes endogenous retinoic acid to accumulate, disrupting the fine-tuned regulation of retinoic acid needed for correct development. The azole compounds ketoconazole and itraconazole are potent inhibitors of CYP26A1, one of the CYP26 isoforms, while fluconazole is a weak inhibitor (Thatcher et al., 2011). Further indirect evidence that fluconazole inhibits CYP26 is that administration of fluconazole causes transient increases in endogenous levels of retinoic acid in a dose-dependent manner and increases its half-life (Menegola, Broccia, Di Renzo, Massa, & Giavini, 2004; Schwartz, Hallam, Gallagher, & Wiernik, 1995; Van Wauwe, Coene, Goossens, Cools, & Monbaliu, 1990). In rat embryos, co-administration of low concentrations of retinoic acid and fluconazole worked synergistically to cause severe teratogenic effects, suggesting an interactive mechanism (Menegola et al., 2004). In summary, there is evidence that azole compounds bind not only the cytochrome P450s in ToxCast, but some of them may also bind one of the forms of CYP26. Because chemicals that inhibit CYP26 cause an increase in retinoic acid levels, these azole compounds likely cause CP by the same mechanism as exogenous retinoic acid. Therefore, disruption of CYP26 constitutes a plausible MIE for cleft palate (Figure 11).
AOP for perturbation of GPCR targets
The neurotransmitter GPCR targets in Clusters C and E have been linked to cleft palate in the literature. Palate mesenchyme is derived from neural crest cells. There is evidence that ligands and receptors for neurotransmitters are present and active in palate tissue (Garbarino & Greene, 1984; Greene, 1989). Norepinephrine, epinephrine, dopamine and serotonin have all been shown to be present in developing palate tissue (Greene, 1989; Wee, Babiarz, Zimmerman, & Zimmerman, 1979). Serotonin antagonists have been shown to inhibit palate shelf rotation in embryo culture. Serotonin activity has been hypothesized to engender a contractile motion in the palatal shelves that is non-muscular in basis and contributes to proper positioning of the shelves for fusion (Babiarz, Allenspach, & Zimmerman, 1975).
DNA synthesis in murine palate mesenchymal cells can be modulated by addition of beta-adrenergic agonists and antagonists. This activity is receptor-mediated and correlates with levels of cyclic adenosine monophosphate (cAMP) (Pisano, Schneiderman, & Greene, 1986). The cAMP pathway is modulated by a number of GPCRs. Because the CP-positive chemicals in Cluster C hit more than one GPCR, it may be that the MIE is not activity at one receptor, but activity at several receptors, in perhaps an additive or cooperative fashion (Chan, Yeung, & Wong, 2005; Selbie & Hill, 1998). Since cAMP modulation is correlated to cell proliferation, palate growth may be affected by GPCR disruption of cAMP. cAMP is also known to control the production of glycosaminoglycans in the extracellular matrix (Greene, MacAndrew, & Lloyd, 1982). Between day 15 and 16 of rat development, increasing levels of cAMP are associated with a slowdown in DNA synthesis and increase in synthesis of glycoprotein molecules important for adhesion of the palatal shelves and eventual fusion (Pratt & Martin, 1975). The AOP for cleft palate depicted in Figure 11 includes GPCR disruption as a MIE.
AOP for phosphodiesterase inhibition
Caffeine and theophylline are also known phosphodiesterase inhibitors. Phosphodiesterase is the enzyme that degrades cAMP and attenuates its signal, and blocking this enzyme results in higher levels of cAMP. Theophylline has been used experimentally to enhance the effect of cAMP on the increased synthesis of glycosaminoglycans in mouse embryo palate mesenchyme (Greene et al., 1982). Whether the effects of caffeine and theophylline stem from their effects on adenosine or on phosphodiesterase or both is unknown, but it is likely that the cAMP pathway is an important factor. Disruption of cAMP signaling via chemical interference of adenosine or phosphodiesterase (by the chemicals in Cluster E) is a plausible MIE for cleft palate that is intricately tied with disruption of GPCR signaling via the chemicals in Cluster C (Figure 11).
AOP for Protein Tyrosine Kinase/Phosphatase Inhibition
Growth factor signaling through receptor tyrosine kinases plays known roles in palatal shelf growth, elevation, adhesion, and fusion. Chemicals in cluster F were predominantly active in protein tyrosine phosphatase assays, while mancozeb and oxytetracycline dihydrate showed activity in receptor kinases with known (FGFR1) or suspected (IGF1R) activity during palatogenesis. Deficient FGFR2 signaling inhibits palatal shelf elevation (Rice et al., 2004), while deficient FGFR1 signaling in cranial neural crest cells inhibits both shelf elevation and fusion (Wang et al., 2013). TGFβ signaling is involved in palatal shelf adhesion and fusion (Bush & Jiang, 2012). However, only 4 CP positives and 28 CP negatives showed activity against TGFβ1, demonstrating poor specificity for cleft palate. Signaling through the epidermal growth factor receptor (EGFR) is critical for proper palatogenesis. Excess EGF signaling in vivo (Hassell, 1975) inhibits complete palate fusion, whereas Egfr knockout mice exhibit cleft palate in vivo and incomplete palatal explant fusion in vitro (Miettinen et al., 1999). EGF signaling is related to MMP activity during palatogenesis, as palates from Egfr knockout mice exhibit reduced MMP activity (Miettinen et al., 1999). Whereas 18/497 of the chemicals studied here hit EGFR, only 4 were CP positive, indicating only a weak enrichment. The poor predictivity of EGFR or TGFβ1 interference with cleft palate suggests synergistic interference of other pathways may segregate the effects of CP positives from CP negatives in cluster F. Other pathways including BMP (Bush & Jiang, 2012) and PDGFR (Xu, Bringas, Soriano, & Chai, 2005) are involved in palatogenesis but are not reflected in ToxCast. Phosphatases and kinases together fine-tune cell signaling and cellular processes and regulate palate fusion in rodents (Hale, Ter Steege, & den Hertog, 2017).Phosphatases with known roles during embryonic development include PTEN and PTPN (Hale et al., 2017). These genes contributed to the associations within Cluster F. PTPN4, for instance, was hit by all four chemicals in Cluster F. Our review of Cluster F and the biomedical literature indicate that kinase activity and phosphatase activity are indispensable for normal embryogenesis and palatogenesis and constitute a critical MIE for the cleft palate AOP.
Discussion
Building computational models that predict in vivo cleft palate teratogenicity is a challenging problem. Palatogenesis is a complex process that takes place over the course of days and involves the finely tuned interactions of many molecular players, perturbation of which by chemicals may initiate a cascade of effects leading to cleft palate. We found that, for a set of chemicals known to cause CP in ToxRefDB and in the biomedical literature, an analysis of HTS bioactivity data plus chemical structure data together point to potential molecular initiating events leading to CP, and that clustering this data revealed patterns centered on GPCR targets, triazole ring-containing compounds, cytochrome P450s, adenosine and adrenergic receptors, and receptor kinases/phosphatases. We found that rudimentary decision trees could be built on the features driving the clusters and these trees were able to separate CP-positives from CP-negative chemicals to some extent, further supporting our hypothesis that these targets play key initiating roles in CP. Finally, starting with these putative MIEs and searching literature reports of gene and protein interactions in PubMed, we were able to construct a logical and plausible AOP framework for CP that could reasonably be the basis for further confirmatory studies, and possibly extended to predict human CP.
This work builds on previous research directed at building models for developmental toxicity from HTS data in ToxCast. Sipes et al. was the first to use ToxCast Phase I data to build predictive models for developmental toxicity (Sipes, Martin, et al., 2011). Using ToxCast Phase I data and anchored to developmental defects identified in ToxRefDB, they built models that achieved >70% balanced accuracy. Their endpoint was broader than that used here, encompassing any adverse developmental outcome, although the set of chemicals they used was smaller. Kleinstreuer et al. used ToxCast Phase I data to find signatures for developmental vasculogenesis disruption (Kleinstreuer et al., 2011). As in our work, key molecular signals from the signatures were incorporated into a putative AOP (Knudsen & Kleinstreuer, 2011). Agent-based models (Kleinstreuer et al., 2013) and several in vitro models (Belair, Schwartz, Knudsen, & Murphy, 2016; Ellis-Hutchings et al., 2017; Nguyen et al., 2017) were used to test the AOP. Wu, et al (Wu et al., 2013) also assembled chemical structure and biological activity data for chemicals to build a decision tree framework to predict developmental and reproductive toxicity. They compiled 25 categories of chemicals, including 6 categories based on known molecular activity (e.g., estrogen receptor binders) and 19 structural features (e.g., fused aromatic ring). They then built a decision tree to sort the developmental or reproductive toxicants from nontoxicants and demonstrated how the tree can be used in initial steps of chemical screening. Whereas they started with a curated set of chemicals and categories to define their decision points, our work used clustering of CP-positive chemicals, followed by statistical analysis, to identify the initial tree nodes using HTS ToxCast data and chemical structural features. Combining their concepts with ours may prove fruitful, particularly if the decision points in the tree could be based on strategic combination of HTS data and structural features and properties. The large corpus of chemicals in ToxCast, for example, would expand the assessment to a broader chemical space and the assay data in ToxCast would extend the bioactivity space.
Limitations
The strategy we employed of assembling, following, and linking multiple lines of evidence for a chemical’s in vivo activity is a novel and promising approach to predicting and understanding chemical toxicity. By integrating and combining sources to accumulate weight-of-evidence, one can minimize the limitations of any one source of data, but these limitations still exist. For example, retinoic acid is a signaling molecule regulating animal morphogenesis as well as a well-known teratogen causing CP, and whereas some CP-positive chemicals were listed in the top 10 score in the analysis, others such as aspirin (CP-positive) were not. Additionally, bromuconazole was listed as a high score chemical even though the compound is CP-negative. Aspirin is a very weak actor at the RARG receptor based on the low gene score in our data. It did not rise to the top like retinol. Bromoconazole does however have a high score in the RARG assay and one would expect it to be positive, but we have no evidence. A number of reasons can explain the false positive and false negative results. The amount, strength or timing of chemical dose or metabolism are just two possible reasons. In order to compile a large set of CP-positive chemicals, we were inclusive and did not consider maternal toxicity, dose levels, dose timing, study type, diet, epigenetics or species differences. Any of these factors could have affected the observation of cleft palate and therefore the construction of the CP-positive chemical set. The gene score transformation of ToxCast data is designed to eliminate non-specific activity caused by cell stress and cytotoxicity, but these non-specific activities could cause developmental defects, including cleft palate. Additionally, the ToxCast data do not accurately reflect metabolism. A potential limitation of our approach is species-dependent differences in teratogenicity associated with select chemicals studied here. For instance, rodents modified to express human aryl hydrocarbon receptor (AhR) do not exhibit cleft palate in response to TCDD exposure (Moriguchi et al., 2003), though TCDD is a known cleft palate teratogen in wild-type rodents (Abbott, 2010), which suggests structural differences in AhR may underpin species-dependent responses to AhR-binding teratogens. Future embodiments of our approach will take into account species-dependent effects, which may further hone our list of CP positive chemicals and increase confidence in the MIEs constituting a cleft palate AOP.
Our methods included some arbitrary components, including weighting during clustering, the choice of chemical structural descriptors, and in selecting the six CP-positive subclusters for a deeper analysis. Prior knowledge and interest were factors in our selection of clusters. Modifying any one of these factors could lead to different results. The differing levels of specificity between the ToxCast DSSTox chemical identifiers (structure-specific with respect to stereo chemistry and salt form) and the less specific way in which chemicals are often identified in the literature introduces challenges during integration of these two sources. For instance, retinoic acid, retinol, and Vitamin A are used to refer to both specific (all-trans) and more broadly general forms of retinoids. The MeSH identifier for a chemical is even broader, often encompassing many forms (e.g., salts) of a chemical. When mapping programmatically from one set of data to another, mismatches can occur. Three forms of oxytetracycline are present in the ToxCast gene score data, whereas our algorithms mapped only one of these to the MeSH term. Future work will need to include a strategy to handle mapping complex relationships like this.
Chemotype enrichment approaches using the publicly available set of ToxPrint features have been previously applied to study of the cleft palate endpoint, with some preliminary insights generated for the triazole-containing subset of cleft palate actives based on unpublished datasets. Chemotype enrichments calculated for the full range of ToxCast assay endpoints also serve as a means for using generalized chemical structure features to identify potentially associated assay results (Strickland et al., 2018). Future work could build on those efforts to strengthen or augment the decision tree nodes proposed in the present study, with the goal of placing of the results entirely on a structure plane since the generation of ToxCast assay and gene-score results is not feasible for all chemicals.
Our aims in future work include using these findings to inform more complex models of CP. For example, relationships between AOPs and signaling pathways not robustly developed in ToxCast (eg, Wnt, Shh) would be useful for bridging cross-species responses to chemicals causing cleft palate. The in silico cell agent-based model of palate formation described in Hutson et al. (Hutson, Leung, Baker, Spencer, & Knudsen, 2017) could be extended to include the pathways identified in the current work and linked by chemical perturbation to CP. With these additions, the simulation will recapitulate more of the complexity of palate formation and, in turn, using ToxCast results to computationally disrupt molecular activity in a dose-dependent fashion will allow simulation of palate dysregulation through a broader range of MIEs and by a wider range of chemicals. In addition to computational models, organotypic culture models are an emerging platform for chemical toxicity screening (Belair et al., 2017; Grego et al., 2017; Knudsen et al., 2015; Wolf et al., 2018). These models must recapitulate the biology behind the chemical effects and be appropriately characterized with both CP positive and negative chemicals like those identified here. With these steps, we will come closer to being able to predict cleft palate teratogenesis for as yet untested chemicals, a major goal of the ToxCast program.
Supplementary Material
Acknowledgements
This work was funded by the U.S. Environmental Protection Agency. The authors would like to thank the internal and external reviewers for their thorough reading of the manuscript. The authors would additionally like to thank Todd Zurlinden for his valuable assistance.
Footnotes
The authors claim no conflict of interest.
DISCLAIMER: The views expressed in this article are those of the authors and do not necessarily reflect the views or policies of the U.S. Environmental Protection Agency. Mention of trade names or commercial products does not constitute endorsement or recommendation for use.
Data Availability
Phase II ToxCast assay data results are openly available at https://www.epa.gov/chemical-research/toxicity-forecaster-toxcasttm-data. (Judson et al., 2010) The Gene Score dataset derived from ToxCast is available as supplemental material to this publication.
ToxRefDB version 1 (Knudsen et al., 2009; Martin, Judson, et al., 2009) is openly available at ftp://newftp.epa.gov/comptox/High_Throughput_Screening_Data/Animal_Tox_Data/.
The ToxPrint chemotypes are available for download at https://toxprint.org. (Yang et al., 2015).
References
- Abbott BD (2010). The etiology of cleft palate: a 50-year search for mechanistic and molecular understanding. Birth Defects Res B Dev Reprod Toxicol, 89(4), 266–274. doi: 10.1002/bdrb.20252 [DOI] [PubMed] [Google Scholar]
- Abbott BD, & Birnbaum LS (1990). Retinoic acid-induced alterations in the expression of growth factors in embryonic mouse palatal shelves. Teratology, 42(6), 597–610. doi: 10.1002/tera.1420420604 [DOI] [PubMed] [Google Scholar]
- Abbott BD, Harris MW, & Birnbaum LS (1989). Etiology of retinoic acid-induced cleft palate varies with the embryonic stage. Teratology, 40(6), 533–553. doi: 10.1002/tera.1420400602 [DOI] [PubMed] [Google Scholar]
- Abbott BD, Lau C, Buckalew AR, Logsdon TR, Setzer W, Zucker RM, . . . Kavlock RJ (1993). Effects of 5-fluorouracil on embryonic rat palate in vitro: fusion in the absence of proliferation. Teratology, 47(6), 541–554. doi: 10.1002/tera.1420470606 [DOI] [PubMed] [Google Scholar]
- Ankley GT, Bennett RS, Erickson RJ, Hoff DJ, Hornung MW, Johnson RD, . . . Villeneuve DL (2010). Adverse outcome pathways: a conceptual framework to support ecotoxicology research and risk assessment. Environ Toxicol Chem, 29(3), 730–741. doi: 10.1002/etc.34 [DOI] [PubMed] [Google Scholar]
- Babiarz BS, Allenspach AL, & Zimmerman EF (1975). Ultrastructural evidence of contractile systems in mouse palates prior to rotation. Developmental Biology, 47(1), 32–44. [DOI] [PubMed] [Google Scholar]
- Bage G, Cekanova E, & Larsson KS (1973). Teratogenic and embryotoxic of the herbicides di- and trichlorophenoxyacetic acids (2,4-D and 2,4,5-T). Acta Pharmacol Toxicol (Copenh), 32(6), 408–416. [DOI] [PubMed] [Google Scholar]
- Baker N, & Hemminger B (2010). Mining connections between chemicals, proteins, and diseases extracted from Medline annotations. J Biomed Inform, 43(4), 510–519. doi: 10.1016/j.jbi.2010.03.008 [DOI] [PMC free article] [PubMed] [Google Scholar]
- Baker N, Knudsen T, & Williams A (2017). Abstract Sifter: a comprehensive front-end system to PubMed [version 1; referees: 1 approved]. F1000 Research, 6(Chem Inf Sci)(2164 ). doi: 10.12688/f1000research.12865.1 [DOI] [PMC free article] [PubMed] [Google Scholar]
- Belair DG, Schwartz MP, Knudsen T, & Murphy WL (2016). Human iPSC-derived endothelial cell sprouting assay in synthetic hydrogel arrays. Acta Biomater, 39, 12–24. doi: 10.1016/j.actbio.2016.05.020 [DOI] [PMC free article] [PubMed] [Google Scholar]
- Belair DG, Wolf CJ, Wood C, Ren H, Grindstaff R, Padgett W, . . . Abbott BD (2017). Engineering human cell spheroids to model embryonic tissue fusion in vitro. PLoS One, 12(9), e0184155. doi: 10.1371/journal.pone.0184155 [DOI] [PMC free article] [PubMed] [Google Scholar]
- Benfenati E, Piclin N, Roncaglioni A, & Vari MR (2001). Factors influencing predictive models for toxicology. SAR QSAR Environ Res, 12(6), 593–603. doi: 10.1080/10629360108039836 [DOI] [PubMed] [Google Scholar]
- Bush JO, & Jiang R (2012). Palatogenesis: morphogenetic and molecular mechanisms of secondary palate development. Development, 139(2), 231–243. doi: 10.1242/dev.067082 [DOI] [PMC free article] [PubMed] [Google Scholar]
- Chan AS, Yeung WW, & Wong YH (2005). Integration of G protein signals by extracellular signal-regulated protein kinases in SK-N-MC neuroepithelioma cells. J Neurochem, 94(5), 1457–1470. doi: 10.1111/j.1471-4159.2005.03304.x [DOI] [PubMed] [Google Scholar]
- Chaube S, & Murphy ML (1966). The effects of hydroxyurea and related compounds on the rat fetus. Cancer Res, 26(7), 1448–1457. [PubMed] [Google Scholar]
- Collins TF (2006). History and evolution of reproductive and developmental toxicology guidelines. Curr Pharm Des, 12(12), 1449–1465. [DOI] [PubMed] [Google Scholar]
- Czeizel A, & Rockenbauer M (2000). A population-based case-control teratologic study of oral oxytetracycline treatment during pregnancy. Eur J Obstet Gynecol Reprod Biol, 88(1), 27–33. [DOI] [PubMed] [Google Scholar]
- Degitz SJ, Morris D, Foley GL, & Francis BM (1998). Role of TGF-beta in RA-induced cleft palate in CD-1 mice. Teratology, 58(5), 197–204. doi: [DOI] [PubMed] [Google Scholar]
- Dixon MJ, Marazita ML, Beaty TH, & Murray JC (2011). Cleft lip and palate: understanding genetic and environmental influences. Nat Rev Genet, 12(3), 167–178. doi: 10.1038/nrg2933 [DOI] [PMC free article] [PubMed] [Google Scholar]
- Eibs H, Spielmann H, & Hagele M (1982). Teratogenic effects of cyproterone acetate and medroxyprogesterone treatment during the pre- and postimplantation period of mouse embryos. I. Teratology, 25(1), 27–36. doi: 10.1002/tera.1420250105 [DOI] [PubMed] [Google Scholar]
- Ellis-Hutchings RG, Settivari RS, McCoy AT, Kleinstreuer N, Franzosa J, Knudsen TB, & Carney EW (2017). Embryonic vascular disruption adverse outcomes: Linking high-throughput signaling signatures with functional consequences. Reprod Toxicol, 71, 16–31. doi: 10.1016/j.reprotox.2017.04.003 [DOI] [PubMed] [Google Scholar]
- Elmazar M, Thiel R, & Nau H (1992). Effect of supplementation with folinic acid, vitamin B6, and vitamin B12 on valproic acid-induced teratogenesis in mice. Fundam Appl Toxicol, 18(3), 389–394. [DOI] [PubMed] [Google Scholar]
- Ema M, Kurosaka R, Amano H, & Ogawa Y (1995a). Developmental toxicity evaluation of mono-n-butyl phthalate in rats. Toxicol Lett, 78(2), 101–106. [DOI] [PubMed] [Google Scholar]
- Ema M, Kurosaka R, Amano H, & Ogawa Y (1995b). Further evaluation of the developmental toxicity of tributyltin chloride in rats. Toxicology, 96(3), 195–201. [DOI] [PubMed] [Google Scholar]
- Gabriel-Robez O, Rohmer A, Clavert J, & Schneegans E (1972). [Teratogenic and lethal actions of diethylstilbestrol on the mouse embryo]. Arch Fr Pediatr, 29(2), 149–154. [PubMed] [Google Scholar]
- Garbarino MP, & Greene RM (1984). Identification of adenylate cyclase-coupled beta-adrenergic receptors in the developing mammalian palate. Biochem Biophys Res Commun, 119(1), 193–202. [DOI] [PubMed] [Google Scholar]
- Greene RM (1989). Signal transduction during craniofacial development. Crit Rev Toxicol, 20(3), 137–152. doi: 10.3109/10408448909017907 [DOI] [PubMed] [Google Scholar]
- Greene RM, MacAndrew VI, & Lloyd MR (1982). Stimulation of palatal glycosaminoglycan synthesis by cyclic AMP. Biochem Biophys Res Commun, 107(1), 232–238. [DOI] [PubMed] [Google Scholar]
- Greene RM, Nugent P, Mukhopadhyay P, Warner DR, & Pisano MM (2003). Intracellular dynamics of Smad-mediated TGFbeta signaling. J Cell Physiol, 197(2), 261–271. doi: 10.1002/jcp.10355 [DOI] [PubMed] [Google Scholar]
- Grego S, Dougherty ER, Alexander FJ, Auerbach SS, Berridge BR, Bittner ML, . . . Yoon M (2017). Systems biology for organotypic cell cultures. ALTEX, 34(2), 301–310. doi: 10.14573/altex.1608221 [DOI] [PubMed] [Google Scholar]
- Hale AJ, Ter Steege E, & den Hertog J (2017). Recent advances in understanding the role of protein-tyrosine phosphatases in development and disease. Developmental Biology, 428(2), 283–292. doi: 10.1016/j.ydbio.2017.03.023 [DOI] [PubMed] [Google Scholar]
- Hall M, Frank E, Holmes H, Pfahringer B, Reutemann P, & Witten I (2009). The WEKA Data Mining Software: An Update. SIGKDD Explorations, 11(1). [Google Scholar]
- Hassell JR (1975). The development of rat palatal shelves in vitro. An ultrastructural analysis of the inhibition of epithelial cell death and palate fusion by the epidermal growth factor. Developmental Biology, 45(1), 90–102. [DOI] [PubMed] [Google Scholar]
- Hu SW, & Shy CM (2001). Health effects of waste incineration: a review of epidemiologic studies. J Air Waste Manag Assoc, 51(7), 1100–1109. [DOI] [PubMed] [Google Scholar]
- Huang HZ, Lu BH, Chen YY, & Liao GQ (2003). [Study on etiology of retinoic acid-induced cleft palate in mouse]. Zhonghua Kou Qiang Yi Xue Za Zhi, 38(3), 185–187. [PubMed] [Google Scholar]
- Hutson MS, Leung MCK, Baker NC, Spencer RM, & Knudsen TB (2017). Computational Model of Secondary Palate Fusion and Disruption. Chem Res Toxicol, 30(4), 965–979. doi: 10.1021/acs.chemrestox.6b00350 [DOI] [PMC free article] [PubMed] [Google Scholar]
- Jack J, Wambaugh JF, & Shah I (2011). Simulating quantitative cellular responses using asynchronous threshold Boolean network ensembles. BMC Syst Biol, 5, 109. doi: 10.1186/1752-0509-5-109 [DOI] [PMC free article] [PubMed] [Google Scholar]
- Jin JZ, & Ding J (2006). Analysis of cell migration, transdifferentiation and apoptosis during mouse secondary palate fusion. Development, 133(17), 3341–3347. doi: 10.1242/dev.02520 [DOI] [PubMed] [Google Scholar]
- Judson R, Houck K, Kavlock R, Knudsen T, Martin M, Mortensen H, . . . Dix D (2010). In vitro screening of environmental chemicals for targeted testing prioritization: the ToxCast project. Environ Health Perspect, 118(4), 485–492. doi: 10.1289/ehp.0901392 [DOI] [PMC free article] [PubMed] [Google Scholar]
- Judson R, Houck K, Martin M, Richard AM, Knudsen TB, Shah I, . . . Thomas R. (2016). Editor’s Highlight: Analysis of the Effects of Cell Stress and Cytotoxicity on In Vitro Assay Activity Across a Diverse Chemical and Assay Space. Toxicol Sci, 152(2), 323–339. doi: 10.1093/toxsci/kfw092 [DOI] [PMC free article] [PubMed] [Google Scholar]
- Kavlock R, Chandler K, Houck K, Hunter S, Judson R, Kleinstreuer N, . . . Dix D (2012). Update on EPA’s ToxCast program: providing high throughput decision support tools for chemical risk management. Chem Res Toxicol, 25(7), 1287–1302. doi: 10.1021/tx3000939 [DOI] [PubMed] [Google Scholar]
- Khera K (1987). Ethylenethiourea: a review of teratogenicity and distribution studies and an assessment of reproduction risk. Crit Rev Toxicol, 18(2), 129–139. doi: 10.3109/10408448709089858 [DOI] [PubMed] [Google Scholar]
- Kim S, Lewis AE, Singh V, Ma X, Adelstein R, & Bush JO (2015). Convergence and extrusion are required for normal fusion of the mammalian secondary palate. PLoS Biol, 13(4), e1002122. doi: 10.1371/journal.pbio.1002122 [DOI] [PMC free article] [PubMed] [Google Scholar]
- Kleinstreuer N, Dix D, Rountree M, Baker N, Sipes N, Reif D, . . . Knudsen T (2013). A computational model predicting disruption of blood vessel development. PLoS Comput Biol, 9(4), e1002996. doi: 10.1371/journal.pcbi.1002996 [DOI] [PMC free article] [PubMed] [Google Scholar]
- Kleinstreuer N, Judson RS, Reif DM, Sipes NS, Singh AV, Chandler KJ, . . . Knudsen TB (2011). Environmental impact on vascular development predicted by high-throughput screening. Environ Health Perspect, 119(11), 1596–1603. doi: 10.1289/ehp.1103412 [DOI] [PMC free article] [PubMed] [Google Scholar]
- Knudsen TB, Keller DA, Sander M, Carney EW, Doerrer NG, Eaton DL, . . . Whelan M (2015). FutureTox II: in vitro data and in silico models for predictive toxicology. Toxicol Sci, 143(2), 256–267. doi: 10.1093/toxsci/kfu234 [DOI] [PMC free article] [PubMed] [Google Scholar]
- Knudsen TB, & Kleinstreuer NC (2011). Disruption of embryonic vascular development in predictive toxicology. Birth Defects Res C Embryo Today, 93(4), 312–323. doi: 10.1002/bdrc.20223 [DOI] [PubMed] [Google Scholar]
- Knudsen TB, Martin MT, Kavlock RJ, Judson RS, Dix DJ, & Singh AV (2009). Profiling the activity of environmental chemicals in prenatal developmental toxicity studies using the U.S. EPA’s ToxRefDB. Reprod Toxicol, 28(2), 209–219. doi: 10.1016/j.reprotox.2009.03.016 [DOI] [PubMed] [Google Scholar]
- Leung MC, Phuong J, Baker NC, Sipes NS, Klinefelter GR, Martin MT, . . . Knudsen TB (2016). Systems Toxicology of Male Reproductive Development: Profiling 774 Chemicals for Molecular Targets and Adverse Outcomes. Environ Health Perspect, 124(7), 1050–1061. doi: 10.1289/ehp.1510385 [DOI] [PMC free article] [PubMed] [Google Scholar]
- Li X, Zhang L, Yin X, Gao Z, Zhang H, Liu X, . . . Yu Z (2014). Retinoic acid remodels extracellular matrix (ECM) of cultured human fetal palate mesenchymal cells (hFPMCs) through down-regulation of TGF-beta/Smad signaling. Toxicol Lett, 225(2), 208–215. doi: 10.1016/j.toxlet.2013.12.013 [DOI] [PubMed] [Google Scholar]
- Lipinski R, Hutson P, Hannam P, Nydza R, Washington I, Moore R, . . . Bushman W (2008). Dose- and route-dependent teratogenicity, toxicity, and pharmacokinetic profiles of the hedgehog signaling antagonist cyclopamine in the mouse. Toxicol Sci, 104(1), 189–197. doi: 10.1093/toxsci/kfn076 [DOI] [PMC free article] [PubMed] [Google Scholar]
- Liu X, Zhang H, Gao L, Yin Y, Pan X, Li Z, . . . Yu Z (2014). Negative interplay of retinoic acid and TGF-beta signaling mediated by TG-interacting factor to modulate mouse embryonic palate mesenchymal-cell proliferation. Birth Defects Res B Dev Reprod Toxicol, 101(6), 403–409. doi: 10.1002/bdrb.21130 [DOI] [PubMed] [Google Scholar]
- Lorente C, & Miller S (1978). Vitamin A induction of cleft palate. Cleft Palate J, 15(4), 378–385. [PubMed] [Google Scholar]
- Marek GJ, & Aghajanian GK (1994). Excitation of interneurons in piriform cortex by 5-hydroxytryptamine: blockade by MDL 100,907, a highly selective 5-HT2A receptor antagonist. Eur J Pharmacol, 259(2), 137–141. [DOI] [PubMed] [Google Scholar]
- Martin MT, Judson RS, Reif DM, Kavlock RJ, & Dix DJ (2009). Profiling chemicals based on chronic toxicity results from the U.S. EPA ToxRef Database. Environ Health Perspect, 117(3), 392–399. doi: 10.1289/ehp.0800074 [DOI] [PMC free article] [PubMed] [Google Scholar]
- Martin MT, Mendez E, Corum DG, Judson RS, Kavlock RJ, Rotroff DM, & Dix DJ (2009). Profiling the reproductive toxicity of chemicals from multigeneration studies in the toxicity reference database. Toxicol Sci, 110(1), 181–190. doi: 10.1093/toxsci/kfp080 [DOI] [PubMed] [Google Scholar]
- Matthiaschk G, & Roll R (1977). [Studies on the embryotoxicity of monolinuron and buturon in NMRI-mice (author’s transl)]. Arch Toxicol, 38(4), 261–274. [DOI] [PubMed] [Google Scholar]
- McClure H, Wilk A, Horigan E, & Pratt R (1979). Induction of craniofacial malformations in rhesus monkeys (Macaca mulatta) with cyclophosphamide. Cleft Palate J, 16(3), 248–256. [PubMed] [Google Scholar]
- Menegola E, Broccia ML, Di Renzo F, & Giavini E (2006). Postulated pathogenic pathway in triazole fungicide induced dysmorphogenic effects. Reprod Toxicol, 22(2), 186–195. doi: 10.1016/j.reprotox.2006.04.008 [DOI] [PubMed] [Google Scholar]
- Menegola E, Broccia ML, Di Renzo F, Massa V, & Giavini E (2004). Relationship between hindbrain segmentation, neural crest cell migration and branchial arch abnormalities in rat embryos exposed to fluconazole and retinoic acid in vitro. Reprod Toxicol, 18(1), 121–130. doi: 10.1016/j.reprotox.2003.09.004 [DOI] [PubMed] [Google Scholar]
- Miettinen PJ, Chin JR, Shum L, Slavkin HC, Shuler CF, Derynck R, & Werb Z (1999). Epidermal growth factor receptor function is necessary for normal craniofacial development and palate closure. Nat Genet, 22(1), 69–73. doi: 10.1038/8773 [DOI] [PubMed] [Google Scholar]
- Mineshima H, Fukuta T, Kato E, Uchida K, Aoki T, Matsuno Y, & Mori C (2012). Malformation spectrum induced by ketoconazole after single administration to pregnant rats during the critical period - comparison with vitamin A-induced malformation spectrum. Journal of Applied Toxicology, 32(2), 98–107. doi: 10.1002/jat.1636 [DOI] [PubMed] [Google Scholar]
- Montenegro M, & Palomino H (1990). Induction of cleft palate in mice by inhibitors of prostaglandin synthesis. J Craniofac Genet Dev Biol, 10(1), 83–94. [PubMed] [Google Scholar]
- Moriguchi T, Motohashi H, Hosoya T, Nakajima O, Takahashi S, Ohsako S, . . . Yamamoto M (2003). Distinct response to dioxin in an arylhydrocarbon receptor (AHR)-humanized mouse. Proc Natl Acad Sci U S A, 100(10), 5652–5657. doi: 10.1073/pnas.1037886100 [DOI] [PMC free article] [PubMed] [Google Scholar]
- Mostrag-Szlichtyng A, Yang C, Rathman J, Mattingly C, Davis A, Planchart A, & Richard A (2013). Interactive data mining of toxicogenomics and in vivo toxicity databases using chemotypes to improve chemical-disease prediction inferences and MoA QSAR models. Paper presented at the Society of Toxicology Annual Meeting, San Antonio. [Google Scholar]
- Nguyen EH, Daly WT, Le NNT, Farnoodian M, Belair DG, Schwartz MP, . . . Murphy WL (2017). Versatile synthetic alternatives to Matrigel for vascular toxicity screening and stem cell expansion. Nat Biomed Eng, 1, 96. doi: 10.1038/s41551-017-0096 [DOI] [PMC free article] [PubMed] [Google Scholar]
- Nomura T, Tanaka S, Kurokawa N, Shibata K, Nakajima H, Kurishita A, . . . Ishii Y (1996). Cytogenotoxicities of sublimed urethane gas to the mouse embryo. Mutat Res, 369(1–2), 59–64. [DOI] [PubMed] [Google Scholar]
- Ortega A, Puig M, & Domingo JL (1991). Maternal and developmental toxicity of low doses of cytosine arabinoside in mice. Teratology, 44(4), 379–384. doi: 10.1002/tera.1420440404 [DOI] [PubMed] [Google Scholar]
- Ottolenghi A, Haseman J, & Suggs F (1974). Teratogenic effects of aldrin, dieldrin, and endrin in hamsters and mice. Teratology, 9(1), 11–16. doi: 10.1002/tera.1420090104 [DOI] [PubMed] [Google Scholar]
- Paulson RB, Paulson GW, & Jreissaty S (1979). Phenytoin and carbamazepine in production of cleft palates in mice. Comparison of teratogenic effects. Arch Neurol, 36(13), 832–836. [DOI] [PubMed] [Google Scholar]
- Pisano MM, Schneiderman MH, & Greene RM (1986). Catecholamine modulation of embryonic palate mesenchymal cell DNA synthesis. J Cell Physiol, 126(1), 84–92. doi: 10.1002/jcp.1041260112 [DOI] [PubMed] [Google Scholar]
- Pratt RM, & Martin GR (1975). Epithelial cell death and cyclic AMP increase during palatal development. Proc Natl Acad Sci U S A, 72(3), 874–877. [DOI] [PMC free article] [PubMed] [Google Scholar]
- Ray HJ, & Niswander L (2012). Mechanisms of tissue fusion during development. Development, 139(10), 1701–1711. doi: 10.1242/dev.068338 [DOI] [PMC free article] [PubMed] [Google Scholar]
- Rice R, Spencer-Dene B, Connor EC, Gritli-Linde A, McMahon AP, Dickson C, . . . Rice DP (2004). Disruption of Fgf10/Fgfr2b-coordinated epithelial-mesenchymal interactions causes cleft palate. J Clin Invest, 113(12), 1692–1700. doi: 10.1172/JCI20384 [DOI] [PMC free article] [PubMed] [Google Scholar]
- Richard A, Judson R, Houck K, Grulke C, Volarath P, Thillainadarajah I, . . . Thomas R (2016). ToxCast Chemical Landscape: Paving the Road to 21st Century Toxicology. Chem Res Toxicol, 29(8), 1225–1251. doi: 10.1021/acs.chemrestox.6b00135 [DOI] [PubMed] [Google Scholar]
- Richard A, Lougee R, Grulke C, Rathman J, Yang C, & Williams A (2018). Use of ToxPrint chemotypes for exploring chemical feature enrichments across the ToxCast chemical-assay landscape. Paper presented at the Society of Toxicology Annual Meeting, San Antonio, TX. [Google Scholar]
- Roll R, & Matthiaschk G (1983). [Comparative studies on the embryotoxicity of 2-methyl-4-chlorophenoxyacetic acid, mecoprop and dichlorprop in NMRI mice]. Arzneimittelforschung, 33(10), 1479–1483. [PubMed] [Google Scholar]
- Russo C, & Elixhauser A (2007). Hospitalizations for Birth Defects, 2004: Statistical Brief #24. Rockville (MD): Available from: https://www.ncbi.nlm.nih.gov/books/NBK63495/. [PubMed] [Google Scholar]
- Saad A, Gartner L, & Hiatt J (1990). Teratogenic effects of nicotine on palate formation in mice. Biol Struct Morphog, 3(1), 31–35. [PubMed] [Google Scholar]
- Schardein J (2000). Chemically Induced Birth Defects, Third Edition. Hoboken: Taylor and Francis. [Google Scholar]
- Schardein JL, & Macina OT (2007). Human developmental toxicants : aspects of toxicology and chemistry. Boca Raton, FL: CRC Taylor & Francis. [Google Scholar]
- Schwartz EL, Hallam S, Gallagher RE, & Wiernik PH (1995). Inhibition of all-trans-retinoic acid metabolism by fluconazole in vitro and in patients with acute promyelocytic leukemia. Biochem Pharmacol, 50(7), 923–928. [DOI] [PubMed] [Google Scholar]
- Sedykh A, Zhu H, Tang H, Zhang L, Richard A, Rusyn I, & Tropsha A (2011). Use of in vitro HTS-derived concentration-response data as biological descriptors improves the accuracy of QSAR models of in vivo toxicity. Environ Health Perspect, 119(3), 364–370. doi: 10.1289/ehp.1002476 [DOI] [PMC free article] [PubMed] [Google Scholar]
- Selbie LA, & Hill SJ (1998). G protein-coupled-receptor cross-talk: the fine-tuning of multiple receptor-signalling pathways. Trends Pharmacol Sci, 19(3), 87–93. [DOI] [PubMed] [Google Scholar]
- Shah I, Liu J, Judson RS, Thomas RS, & Patlewicz G (2016). Systematically evaluating read-across prediction and performance using a local validity approach characterized by chemical structure and bioactivity information. Regul Toxicol Pharmacol, 79, 12–24. doi: 10.1016/j.yrtph.2016.05.008 [DOI] [PubMed] [Google Scholar]
- Shah R, & Kilistoff A (1976). Cleft palate induction in hamster fetuses by glucocorticoid hormones and their synthetic analogues. J Embryol Exp Morphol, 36(1), 101–108. [PubMed] [Google Scholar]
- Shimizu N, Aoyama H, Hatakenaka N, Kaneda M, & Teramoto S (2001). An in vitro screening system for characterizing the cleft palate-inducing potential of chemicals and underlying mechanisms. Reprod Toxicol, 15(6), 665–672. [DOI] [PubMed] [Google Scholar]
- Sipes NS, Martin MT, Reif DM, Kleinstreuer NC, Judson RS, Singh AV, . . . Knudsen TB (2011). Predictive models of prenatal developmental toxicity from ToxCast high-throughput screening data. Toxicol Sci, 124(1), 109–127. doi: 10.1093/toxsci/kfr220 [DOI] [PubMed] [Google Scholar]
- Sipes NS, Padilla S, & Knudsen TB (2011). Zebrafish: as an integrative model for twenty-first century toxicity testing. Birth Defects Res C Embryo Today, 93(3), 256–267. doi: 10.1002/bdrc.20214 [DOI] [PubMed] [Google Scholar]
- Stoilov I, Jansson I, Sarfarazi M, & Schenkman JB (2001). Roles of cytochrome p450 in development. Drug Metabol Drug Interact, 18(1), 33–55. [DOI] [PubMed] [Google Scholar]
- Strickland JD, Martin MT, Richard AM, Houck KA, & Shafer TJ (2018). Screening the ToxCast phase II libraries for alterations in network function using cortical neurons grown on multi-well microelectrode array (mwMEA) plates. Arch Toxicol, 92(1), 487–500. doi: 10.1007/s00204-017-2035-5 [DOI] [PMC free article] [PubMed] [Google Scholar]
- Sullivan F, & McElhatton P (1975). Teratogenic activity of the antiepileptic drugs phenobarbital, phenytoin, and primidone in mice. Toxicol Appl Pharmacol, 34(2), 271–282. [DOI] [PubMed] [Google Scholar]
- Szabo K, & Brent R (1974). Letter: Species differences in experimental teratogenesis by tranquillising agents. Lancet, 1(7857), 565. [DOI] [PubMed] [Google Scholar]
- Thatcher JE, Buttrick B, Shaffer SA, Shimshoni JA, Goodlett DR, Nelson WL, & Isoherranen N (2011). Substrate specificity and ligand interactions of CYP26A1, the human liver retinoic acid hydroxylase. Mol Pharmacol, 80(2), 228–239. doi: 10.1124/mol.111.072413 [DOI] [PMC free article] [PubMed] [Google Scholar]
- Thibodeaux J, Hanson R, Rogers J, Grey B, Barbee B, Richards J, . . . Lau C (2003). Exposure to perfluorooctane sulfonate during pregnancy in rat and mouse. I: maternal and prenatal evaluations. Toxicol Sci, 74(2), 369–381. doi: 10.1093/toxsci/kfg121 [DOI] [PubMed] [Google Scholar]
- Tian Y, Ishikawa H, Yamaguchi T, Yamauchi T, & Yokoyama K (2005). Teratogenicity and developmental toxicity of chlorpyrifos. Maternal exposure during organogenesis in mice. Reprod Toxicol, 20(2), 267–270. doi: 10.1016/j.reprotox.2005.01.012 [DOI] [PubMed] [Google Scholar]
- Tiboni G, & Giampietro F (2005). Murine teratology of fluconazole: evaluation of developmental phase specificity and dose dependence. Pediatr Res, 58(1), 94–99. doi: 10.1203/01.pdr.0000166754.24957.73 [DOI] [PubMed] [Google Scholar]
- Tice RR, Austin CP, Kavlock RJ, & Bucher JR (2013). Improving the human hazard characterization of chemicals: a Tox21 update. Environ Health Perspect, 121(7), 756–765. doi: 10.1289/ehp.1205784 [DOI] [PMC free article] [PubMed] [Google Scholar]
- Van Wauwe JP, Coene MC, Goossens J, Cools W, & Monbaliu J (1990). Effects of cytochrome P-450 inhibitors on the in vivo metabolism of all-trans-retinoic acid in rats. J Pharmacol Exp Ther, 252(1), 365–369. [PubMed] [Google Scholar]
- Villeneuve DL, Crump D, Garcia-Reyero N, Hecker M, Hutchinson TH, LaLone CA, . . . Whelan M (2014). Adverse outcome pathway (AOP) development I: strategies and principles. Toxicol Sci, 142(2), 312–320. doi: 10.1093/toxsci/kfu199 [DOI] [PMC free article] [PubMed] [Google Scholar]
- Volarath P, Little S, Yang C, Martin M, Reif D, & Richard A (2010). Features analysis of ToxCast compounds. Paper presented at the American Chemical Society Fall Meeting, Boston, MA. [Google Scholar]
- Walker BE, & Patterson A (1974). Induction of cleft palate in mice by tranquilizers and barbiturates. Teratology, 10(2), 159–163. doi: 10.1002/tera.1420100212 [DOI] [PubMed] [Google Scholar]
- Wang C, Chang JY, Yang C, Huang Y, Liu J, You P, . . . Li X (2013). Type 1 fibroblast growth factor receptor in cranial neural crest cell-derived mesenchyme is required for palatogenesis. Journal of Biological Chemistry, 288(30), 22174–22183. doi: 10.1074/jbc.M113.463620 [DOI] [PMC free article] [PubMed] [Google Scholar]
- Wattanawong K, Rattanasiri S, McEvoy M, Attia J, & Thakkinstian A (2016). Association between IRF6 and 8q24 polymorphisms and nonsyndromic cleft lip with or without cleft palate: Systematic review and meta-analysis. Birth Defects Res A Clin Mol Teratol, 106(9), 773–788. doi: 10.1002/bdra.23540 [DOI] [PMC free article] [PubMed] [Google Scholar]
- Wee EL, Babiarz BS, Zimmerman S, & Zimmerman EF (1979). Palate morphogenesis. IV. Effects of serotonin and its antagonists on rotation in embryo culture. J Embryol Exp Morphol, 53, 75–90. [PubMed] [Google Scholar]
- Witten I, Frank E, & Hall M (2011). Data Mining: Practical Machine Learning Tools and Techniques. Amsterdam: Morgan Kaufmann Publishers Inc. [Google Scholar]
- Wolf CJ, Belair DG, Becker CM, Das KP, Schmid JE, & Abbott BD (2018). Development of an organotypic stem cell model for the study of human embryonic palatal fusion. Birth Defects Res. doi: 10.1002/bdr2.1394 [DOI] [PMC free article] [PubMed] [Google Scholar]
- Wu S, Fisher J, Naciff J, Laufersweiler M, Lester C, Daston G, & Blackburn K (2013). Framework for identifying chemicals with structural features associated with the potential to act as developmental or reproductive toxicants. Chem Res Toxicol, 26(12), 1840–1861. doi: 10.1021/tx400226u [DOI] [PubMed] [Google Scholar]
- Xu X, Bringas P Jr., Soriano P, & Chai Y (2005). PDGFR-alpha signaling is critical for tooth cusp and palate morphogenesis. Dev Dyn, 232(1), 75–84. doi: 10.1002/dvdy.20197 [DOI] [PubMed] [Google Scholar]
- Yang C, Arvidson K, Richard A, Worth A, Tarkhov A, Ringeissen S, . . . Schwab C (2013). Chemotypes and Chemotyper: A new structure representation standard to include atomic/bond properties into structural alerts for toxicity effects and mechanisms. Paper presented at the Society of Toxicology, San Antonio, TX. [Google Scholar]
- Yang C, Tarkhov A, Marusczyk J, Bienfait B, Gasteiger J, Kleinoeder T, . . . Rathman J (2015). New Publicly Available Chemical Query Language, CSRML, To Support Chemotype Representations for Application to Data Mining and Modeling. Journal of Chemical Information and Modeling. doi: 10.1021/ci500667v [DOI] [PubMed] [Google Scholar]
- Zhu H (2013). From QSAR to QSIIR: searching for enhanced computational toxicology models. Methods Mol Biol, 930, 53–65. doi: 10.1007/978-1-62703-059-5_3 [DOI] [PMC free article] [PubMed] [Google Scholar]
- Zhu H, Rusyn I, Richard A, & Tropsha A (2008). Use of cell viability assay data improves the prediction accuracy of conventional quantitative structure-activity relationship models of animal carcinogenicity. Environ Health Perspect, 116(4), 506–513. doi: 10.1289/ehp.10573 [DOI] [PMC free article] [PubMed] [Google Scholar]
- Zhu H, Ye L, Richard A, Golbraikh A, Wright FA, Rusyn I, & Tropsha A (2009). A novel two-step hierarchical quantitative structure-activity relationship modeling work flow for predicting acute toxicity of chemicals in rodents. Environ Health Perspect, 117(8), 1257–1264. doi: 10.1289/ehp.0800471 [DOI] [PMC free article] [PubMed] [Google Scholar]
Associated Data
This section collects any data citations, data availability statements, or supplementary materials included in this article.
Supplementary Materials
Data Availability Statement
Phase II ToxCast assay data results are openly available at https://www.epa.gov/chemical-research/toxicity-forecaster-toxcasttm-data. (Judson et al., 2010) The Gene Score dataset derived from ToxCast is available as supplemental material to this publication.
ToxRefDB version 1 (Knudsen et al., 2009; Martin, Judson, et al., 2009) is openly available at ftp://newftp.epa.gov/comptox/High_Throughput_Screening_Data/Animal_Tox_Data/.
The ToxPrint chemotypes are available for download at https://toxprint.org. (Yang et al., 2015).