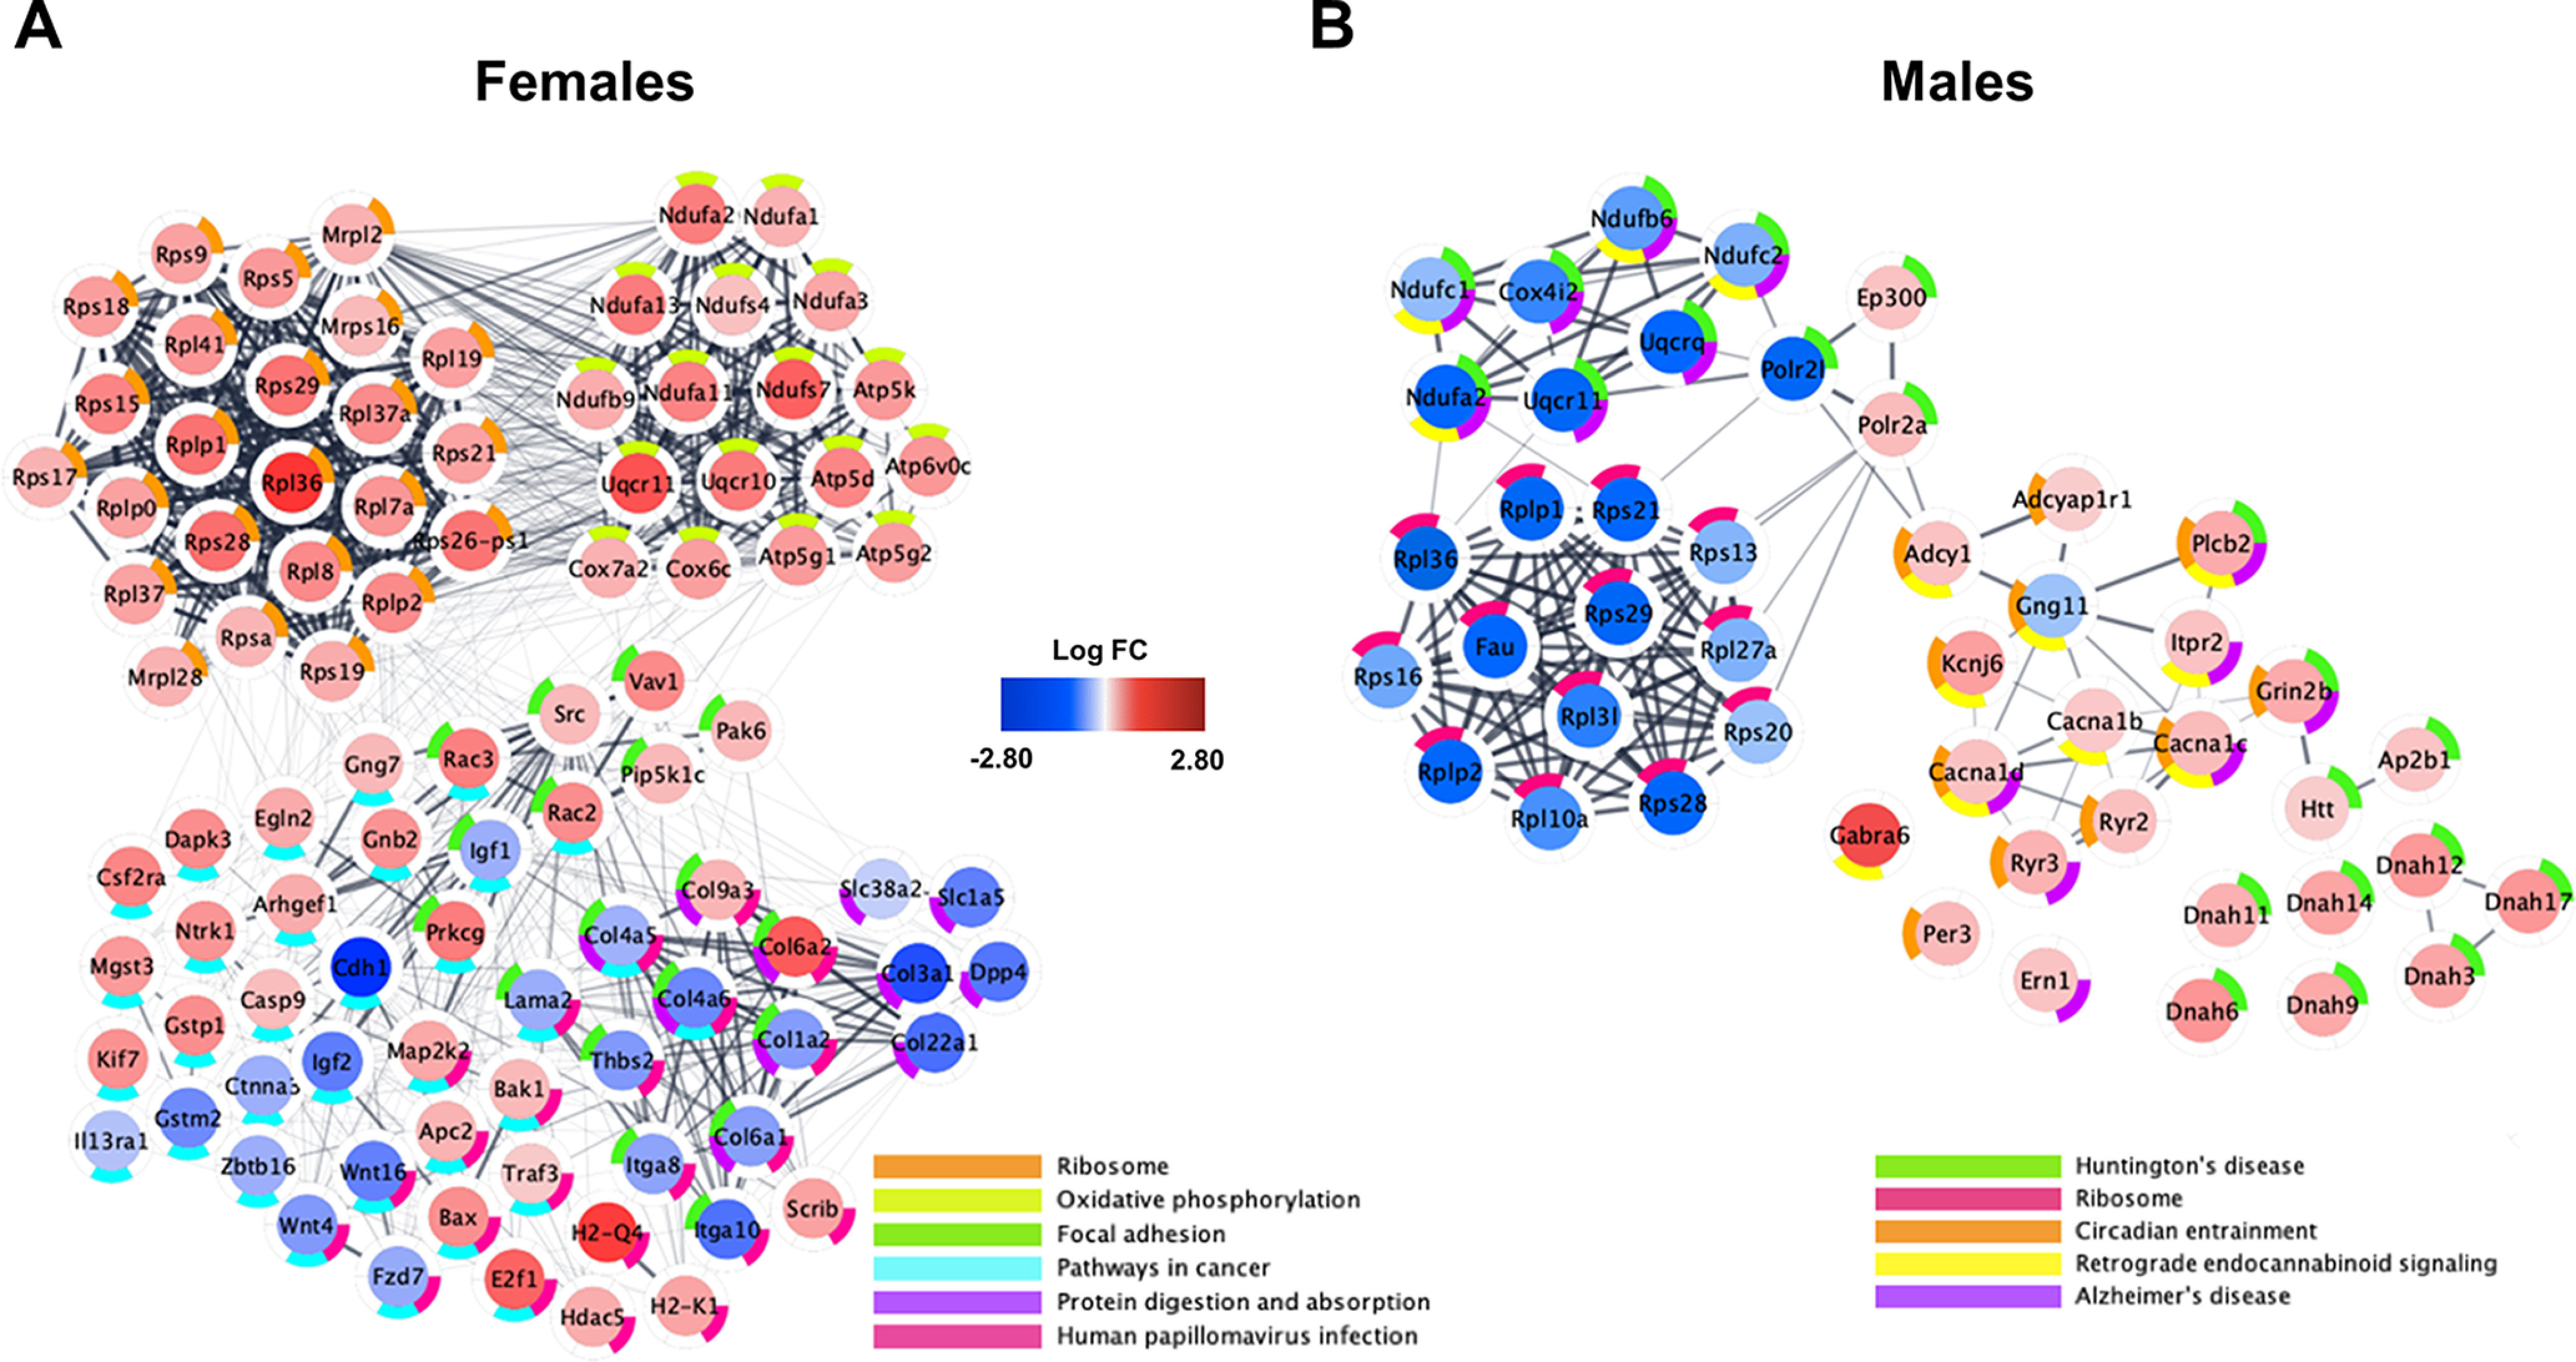
Figure 12.

Functional network plots of differential brainstem gene expression for each sex on P15 following repeated neonatal morphine exposure. A, B, Plots represent gene expression relative to saline controls for females (A; n = 3 saline, 3 morphine) and males (B; n = 3 saline, 3 morphine). Central color coding of individual genes reflects LogFC from −2.80 (blue) to 2.80 (red). Donut plots are color coded to reflect KEGG enrichment pathways containing <50 implicated genes. All genes with unadjusted p values < 0.10 were included in functional network identification. Plots were generated using Cytoscape software, and gene interactions were imported from the STRING database to reflect known gene interactions (shown via interconnecting lines, increased line opacity represents stronger known gene interaction). Complete enrichment data are presented in Extended Data Figure 12-1 (female-only analysis) and Extended Data Figure 12-2 (male-only analysis).
