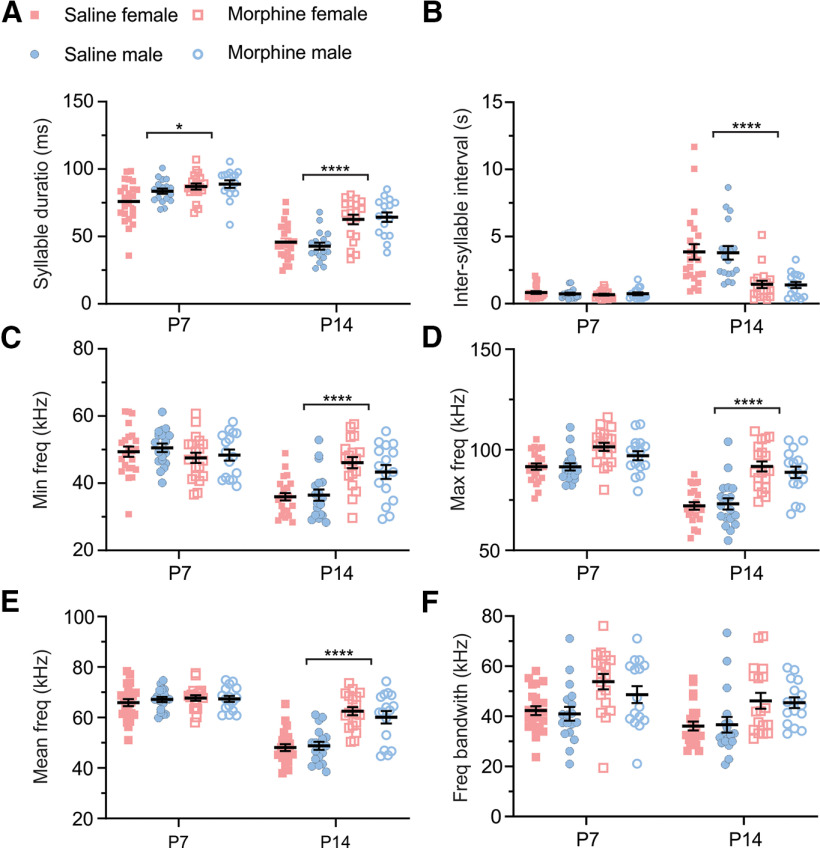
Figure 5.
Changes in ultrasonic vocalizations following repeated neonatal morphine exposure. A, There was an increase in normalized syllable duration in morphine-exposed females and males on P14 relative to saline controls. There were main effects of treatment (F(1,40) = 42.97, ****p < 0.0001), postnatal day (F(1,40) = 240.0, ****p < 0.0001), and a significant treatment × postnatal day interaction (F(1,28) = 6.15, *p = 0.02). There was no main effect of sex (F(1,72) = 0.75, p = 0.39) or any interactions with sex (treatment × sex: F(1,72) = 0.004, p = 0.95; age × treatment × sex: F(1,72) = 1.09, p = 0.30). Tukey’s post hoc comparisons revealed the following: P7: saline versus morphine, *p = 0.0249; P14: saline versus morphine, ****p < 0.0001. B, Repeated morphine exposure led to a decrease in normalized intersyllable interval in female and male P14 mice relative to saline controls. There were main effects of treatment (F(1,40) = 60.06, ****p < 0.0001) and postnatal day (F(1,40) = 138.3, ****p < 0.0001) as well as a significant treatment × postnatal day interaction (F(1,28) = 54.82, ****p < 0.0001). Again, there were no main effects of sex (F(1,144) = 0.15, p = 0.69) or any interactions with sex (treatment × sex: F(1,144) < 0.001, p = 0.9854; treatment × postnatal day × sex: F(1,144) = 0.08, p = 0.77). Tukey’s post hoc comparisons revealed the following: P7: saline versus morphine, p = 0.99; P14: saline versus morphine, ****p < 0.0001. C, Chronic opioid exposure led to an increase in normalized minimum frequency in female P14 mice relative to saline controls. There was a main effect of postnatal day (F(1,40) = 192.10, ****p < 0.0001) and a significant treatment × postnatal day interaction (F(1,28) = 25.55, ****p < 0.0001). There was no main effect of treatment (F(1,40) = 3.489, p = 0.0691), no main effect of sex (F(1,72) < 0.001, p = 0.98), and no interactions with sex (treatment × sex: F(1,72) = 0.22, p = 0.64; treatment × postnatal day × sex: F(1,72) = 0.46, p = 0.50). Tukey’s post hoc comparisons revealed the following: P7: saline versus morphine, p = 0.28; P14: saline versus morphine, ****p < 0.0001. D, Repeated morphine exposure led to an overall increase in normalized maximum frequency relative to saline controls. There were main effects of treatment (F(1,40) = 71.76, ****p < 0.0001) and postnatal day (F(1,40) = 71.08, ****p < 0.0001) and a significant treatment × postnatal day interaction (F(1,28) = 29.02, ****p < 0.0001). There was no main effect of sex (F(1,72) = 0.96, p = 0.33), and there were no interactions with sex (treatment × sex: F(1,72) = 1.11, p = 0.30; treatment × postnatal day × sex: F(1,72) = 0.10, p = 0.76). Tukey’s post hoc comparisons revealed the following: P7: saline versus morphine, p = 0.13; P14: saline versus morphine, ****p < 0.0001. E, Chronic opioid exposure led to an increase in normalized mean frequency in female and male P14 mice relative to saline controls. There were main effects of treatment (F(1,40) = 42.90, ****p < 0.0001) and postnatal day (F(1,40) = 107.1, ****p < 0.0001), and a significant treatment × postnatal day interaction (F(1,28) = 33.73, ****p < 0.0001). There was no main effect of sex (F(1,72) = 0.06, p = 0.82), and there were no interactions with sex (treatment × sex: F(1,72) = 0.78, p = 0.38; treatment × postnatal day × sex: F(1,72) = 0.16, p = 0.69). Tukey’s post hoc comparisons revealed the following: P7: saline versus morphine, p = 0.95; P14: saline versus morphine, ****p < 0.0001. F, Chronic opioid exposure led to an overall increase in frequency bandwidth across groups relative to saline controls. There were main effects of both treatment (F(1,40) = 28.50, ****p < 0.0001) and postnatal day (F(1,40) = 13.98, ***p = 0.0006), with no significant treatment × postnatal day interaction (F(1,28) = 1.676, p = 0.2068). There was no main effect of sex (F(1,72) = 0.4988, p = 0.4823), and there were no interactions with sex (treatment × sex: F(1,72) = 0.1259, p = 0.7238; treatment × postnatal day × sex: F(1,72) = 0.3515, p = 0.5551). For all parameters, we performed a three-way ANOVA mixed-effects model followed by a Tukey’s post hoc test.

