. 2021 Sep 2;10:e63377. doi: 10.7554/eLife.63377

Figure 1. DeepEthogram overview.

(A) Workflows for supervised behavior labeling. Left: a common traditional approach based on manual labeling. Middle: workflow with DeepEthogram. Right: Schematic of expected scaling of user time for each workflow. (B) Ethogram schematic. Top: example images from Mouse-Ventral1 dataset. Bottom: ethogram with human labels. Dark colors indicate which behavior is present. Example shown is from Mouse-Ventral1 dataset. Images have been cropped, brightened, and converted to grayscale for clarity. (C) DeepEthogram-fast model schematic. Example images are from the Fly dataset. Left: a sequence of 11 frames is converted into 10 optic flows. Middle: the center frame and the stack of 10 optic flows are converted into 512-dimensional representations via deep convolutional neural networks (CNNs). Right: these features are converted into probabilities of each behavior via the sequence model.

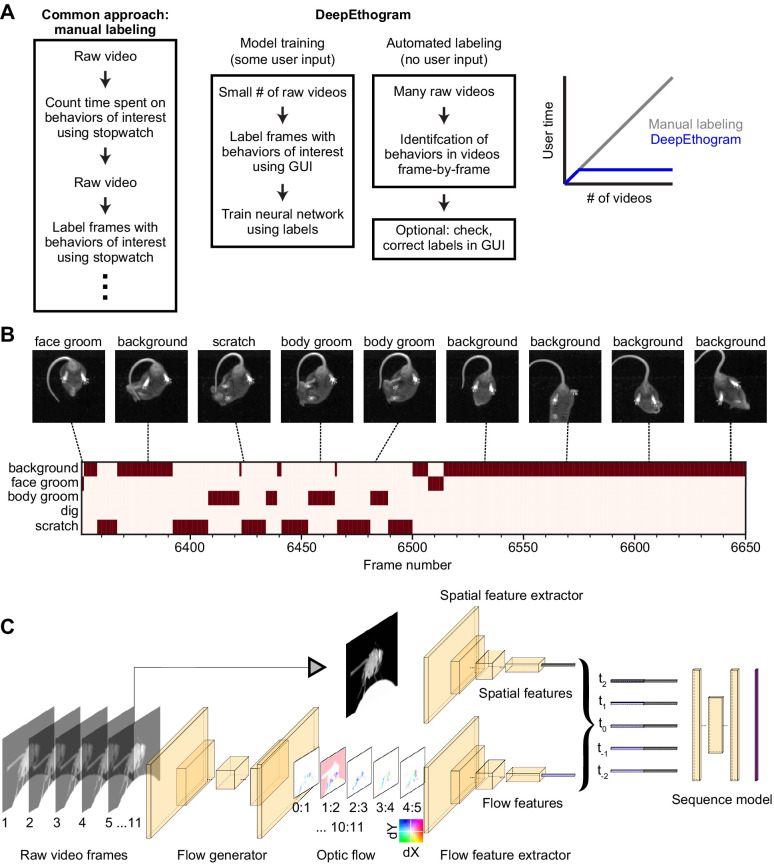
Figure 1.

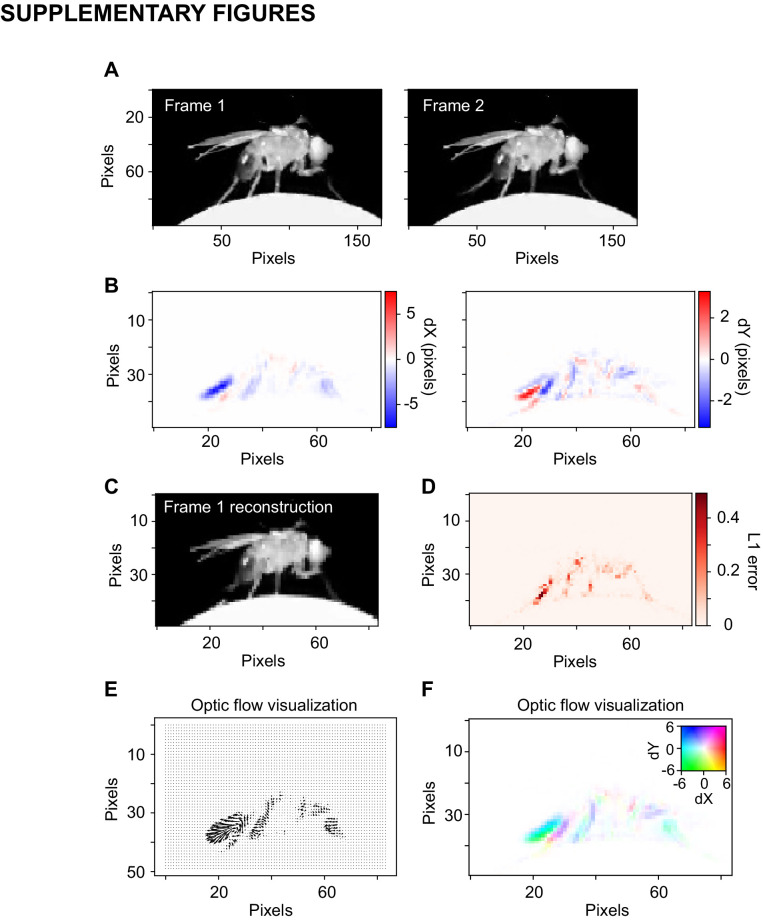
Figure 1—figure supplement 1. Optic flow.

Figure 1—figure supplement 1.

(A) Example images from the Fly dataset on two consecutive frames. (B) Optic flow estimated with TinyMotionNet. Note that the image size is half the original due to the TinyMotionNet architecture. Displacements in the x dimension (left) and y dimension (right) between the frames in (A). (C) The reconstruction of frame 1 estimated by sampling frame 2 according to the optic flow calculation. The image was resized with bilinear interpolation before resampling. (D) Absolute error between frame 1 and the frame 1 reconstructed from optic flow. (E) Visualization of optic flow using arrow lengths to indicate the direction and magnitude flow. (F) Visualization of optic flow using coloring according the inset color scale. Left displacements are mapped to cyan, right displacements to red, and so on. Saturation indicates the magnitude of displacement.