

Abstract
End-organ cytomegalovirus (CMV) disease can be life threatening to solid organ transplant recipients. Diagnosis is often complicated by variation in amount of CMV DNA in plasma and the need for an invasive procedure to obtain a biopsy of the suspected affected organ, which can delay recognition and treatment. Several inflammatory cytokines are elevated in CMV disease, and the purpose of this study was to determine if they could be used to distinguish solid organ transplant recipients with CMV DNAemia alone from those with possible end-organ CMV disease. We found that regardless of pre-transplant CMV serostatus, plasma interleukin (IL)-18, tumor necrosis factor-α (TNF-α), and amount of CMV DNA in plasma were increased in possible end-organ CMV disease, with elevated IL-18 associated with increased odds of possible end-organ CMV disease even after adjusting for amount of CMV DNA. These findings highlight IL-18 and TNF-α as potential non-invasive markers of possible end-organ CMV disease regardless of transplanted organ or serostatus in solid organ transplant recipients.
Keywords: cytokines, cytomegalovirus, end-organ disease
1 |. INTRODUCTION
Despite antiviral prophylaxis, cytomegalovirus (CMV) infection in solid organ transplant recipients (SOTRs) remains a significant cause of morbidity and mortality.1–4 This is particularly true in seronegative recipients of organs from seropositive donors (D+/R−), who are at increased risk for disease.5 CMV disease, defined as active CMV replication leading to clinical signs or symptoms, can progress to CMV syndrome and/or end-organ disease. CMV syndrome is often characterized by malaise, fever, or laboratory abnormalities in the setting of detection of CMV DNA in plasma, while end-organ CMV (EO-CMV) indicates the presence of replicating CMV in an organ (gastrointestinal tract, liver, lung, etc.) leading to direct viral-induced damage.1,6 Distinguishing between CMV syndrome and EO-CMV is important. While CMV syndrome can often be treated with oral valganciclovir alone, EO-CMV more often requires intravenous ganciclovir, especially in organ- or life-threatening cases, and often requires longer courses of therapy.2 The gold standard for diagnosing EO-CMV remains documenting evidence of CMV by histopathology, viral culture, DNA hybridization, or immunohistochemistry via biopsy of the suspected infected organ.1,7 This often necessitates an invasive procedure such as a colonoscopy, endoscopy, or bronchoscopy, which are expensive and confer additional risk to the patient. Clinicians therefore sometimes prefer to treat as “CMV colitis,” for example, without formally documenting this diagnosis with a colonoscopy and biopsy. Though CMV DNA is often detected in plasma from kidney and liver transplant recipients with gastrointestinal EO-CMV, this is not always the case, particularly among R+ patients.8 Hence, a rapid, non-invasive method of diagnosing EO-CMV is desirable.
A hallmark of CMV infection and replication in epithelial and myeloid cells is the induction of a number of innate immunity pathways.9–11 One such innate signaling pathway is the inflammasome, which, when activated, leads to an inflammatory type of cell death called pyroptosis and the release of the proinflammatory cytokines interleukin (IL)-1β and IL-18.12 CMV infection leads directly to activation of the inflammasome, and IL-18 is elevated in D+/R− kidney transplant recipients who develop CMV DNAemia without prophylaxis.13,14 Plasma IL-18 levels are a sensitive indicator of acute infection with other chronic viruses, such as HIV and hepatitis C virus (HCV),15,16 and begin to rise prior to alanine transaminase levels in acute HCV infection.17
Therefore, we sought to determine if IL-18 or other cytokines produced by innate immune recognition of CMV would distinguish SOTRs with EO-CMV from those with CMV DNAemia but not EO-CMV. We report that elevated levels of IL-18 and TNF-α are markers of possible EO-CMV and may prove useful in distinguishing this disease entity from more mild forms of CMV disease.
2 |. MATERIALS AND METHODS
2.1 |. Study participants
This is a retrospective observational study of adult SOTRs (>18 years old) with CMV DNAemia tested within the Johns Hopkins Health System between September 2018 and June 2019 using residual plasma from CMV DNA testing that had been obtained for purposes of clinical care. This study was approved by the Johns Hopkins Institutional Review Board (IRB00196960). CMV DNAemia was diagnosed and quantified via polymerase chain reaction (PCR) in plasma by the Johns Hopkins Medical Microbiology Laboratory using the Roche Cobas CMV assay for quantitative CMV measurement from plasma, run on a Roche Cobas 6800 instrument (Roche, Basel, Switzerland). The lower detection limit for this assay is 34.5 IU/ml and the reportable range is 34.5–10,000,000 IU/ml (1.53–7 log10 [IU/ml]). Patients were identified for inclusion in the study by the Core for Clinical Research Data Acquisition (CCDA) and were those who had received a solid organ transplant, were over 18 years of age at time of testing, and had a positive CMV plasma PCR during the indicated time period. Patients were excluded if residual plasma was unavailable or if the CMV DNAemia occurred in the setting of another infection as determined by transplant/oncology infectious disease physicians.
2.2 |. Clinical data collection
Clinical and demographic data were extracted from the electronic health record (EHR) via manual chart review as outlined in Table 1. Possible EO-CMV was defined based on previously established guidelines6 as having organ-specific symptoms (i.e., diarrhea, respiratory failure) without alternative explanation, and concomitant CMV DNAemia Patients were determined to have either CMV DNAemia alone or possible EO-CMV by an experienced reviewer (Andrew H. Karaba, Maria Veronica Dioverti, or Seema Mehta Steinke) blinded to the cytokine measurement results and based on review of the transplant/oncology infectious disease consultation notes in the EHR. EO-CMV was considered the most likely diagnoses by the transplant/oncology infectious disease consulting physician at the time of diagnosis for every patient placed in the possible EO-CMV group by the blinded reviewers. While one patient met criteria for probable CMV pneumonia, that patient was grouped with the possible EO-CMV. There were two patients who had simultaneous liver and kidney transplants and they were grouped with the liver transplant recipients. There were four patients who had kidney and pancreas transplants and they were grouped with the kidney transplant recipients. None of the patients with more than one solid organ transplanted were in the possible EO-CMV group.
TABLE 1.
Demographic and clinical characteristics of the cohort
| CMV DNAemia alone | Possible end-organ CMVa | p-Value | |
|---|---|---|---|
| n | 22 | 7 | |
| Age (median [IQR]) | 56.5 [48.0, 62.7] | 60.0 [58.5, 62.0] | .28 |
| Male (%) | 14 (63.6) | 5 (71.4) | >.99 |
| Graft type (%) | .72 | ||
| Kidney | 12 (54.5) | 3 (42.9) | |
| Liver | 4 (18.2) | 2 (28.6) | |
| Heart | 1 (4.5) | 1 (14.3) | |
| Lung | 5 (22.7) | 1 (14.3) | |
| CMV R- | 7 (31.8) | 5 (71.4) | .16 |
| Prior history of CMV disease (%) | 11 (50.0) | 0 (0.0) | .054 |
| Days of DNAemiab (median [IQR]) | 13.5 [3.3, 24.0] | 1.0 [1.0, 20.0] | .27 |
| ALC cells/μl (median [IQR]) | 690 [402, 1277] | 400 [320, 1047] | .31 |
| Months post transplant (median [IQR]) | 11.60 [6.68, 47.99] | 9.77 [6.92, 46.22] | .84 |
| Antithymocyte globulin-based induction (%) | 9 (40.9) | 5 (71.4) | .33 |
| Immunosuppresives (%) | |||
| Tacrolimus | 21 (95.5) | 7 (100.0) | >.99 |
| Mycophenolate | 13 (59.1) | 7 (100.0) | .12 |
| Prednisone | 19 (86.4) | 7 (100.0) | .75 |
Abbreviations: ALC, absolute lymphocyte count; CMV, cytomegalovirus; EO, end organ; IQR, interquartile range.
Six SOTRs in the possible EO-CMV group had gastrointestinal disease and one had probable pulmonary disease. Additional data about those with suspected EO-CMV can be found in Table S1.
Days from start of DNAemia to peak CMV levels and measurement of cytokines.
2.3 |. Cytokine measurement
Residual plasma from peak CMV DNAemia time points and undetectable CMV time points (when available) was thawed and cytokines (interferon [IFN]-γ, IL-10, IL-12p70, IL-13, IL-18, IL-1β, IL-2, IL-4, IL-6, IL-8, and tumor necrosis factor [TNF]-α) were measured using a custom multiplex kit from Meso Scale Diagnostics (MSD, Rockville, MD) according to the manufacturer’s protocol and data were acquired on a MESO QuickPlex SQ 120. Each sample was measured on first thaw. If an analyte signal was below background, it was set to 0 and if detectable, but below the manufacturer’s internal lower limit of detection, to the lower limit of detection.
2.4 |. Statistical analysis
Data were analyzed using the statistical computing software R version 3.6.3. Differences in categorical and continuous clinical and demographic variables between the CMV DNAemia and possible EO-CMV groups were determined by a Fisher’s exact test and Wilcoxon–Mann–Whitney test, respectively. The Wilcoxon–Mann–Whitney test was also applied to cytokine values to determine differences between the DNAemia and EO-CMV groups. A paired Wilcoxon–Mann–Whitney test was applied to cytokine values to determine differences between peak and undetectable CMV DNAemia. Generalized linear models with logit link function and binomial distribution were used to generate odds ratios (OR) and 95% confidence intervals (CI) for possible EO-CMV. Two-sided p-values <.05 were considered significant. An exploratory analysis comparing models was performed by generating predictions of the original dataset using the generalized linear models, and modeling the discrimination of those predictions by calculating the area under the receiver operator curve (AUC) using the pROC and lmtest packages in R.18,19 Linear regression models were generated to compare possible correlation between time from transplant and cytokine levels.
3 |. RESULTS
3.1 |. Cohort characteristics
A total of 275 SOTRs had CMV DNAemia within the health system during the study period. Of those, 44 had residual plasma stored in the microbiology lab, and 29 of those patients were determined to have CMV DNAemia not attributable to secondary reactivation in the context of another infectious process (Figure 1). Seven (24%) had possible or probable EO-CMV, while the remaining 22 had CMV DNAemia and/or CMV syndrome without end-organ involvement. Six of the seven possible EO-CMV SOTRs had gastrointestinal disease, while the remaining patient had pulmonary disease (Table S1). The two disease groups were not statistically significantly different with regard to age, sex, type of transplant received, absolute lymphocyte count (ALC) at time of diagnosis, use of antithymocyte globulin-based induction therapy, months since transplant, days between the start of CMV DNAemia and peak CMV levels, and types of immunosuppressive agents (Table 1). Approaching a statistically significant difference, none of the patients in the EO-CMV group had a prior history of CMV disease, whereas 50% of the CMV DNAemia group did have prior CMV DNAemia. In general, the institution utilizes a prophylactic approach to CMV disease prevention in SOTR, but none of the patients in this cohort were on anti-CMV prophylaxis or treatment prior to the onset of CMV DNAemia.
FIGURE 1.
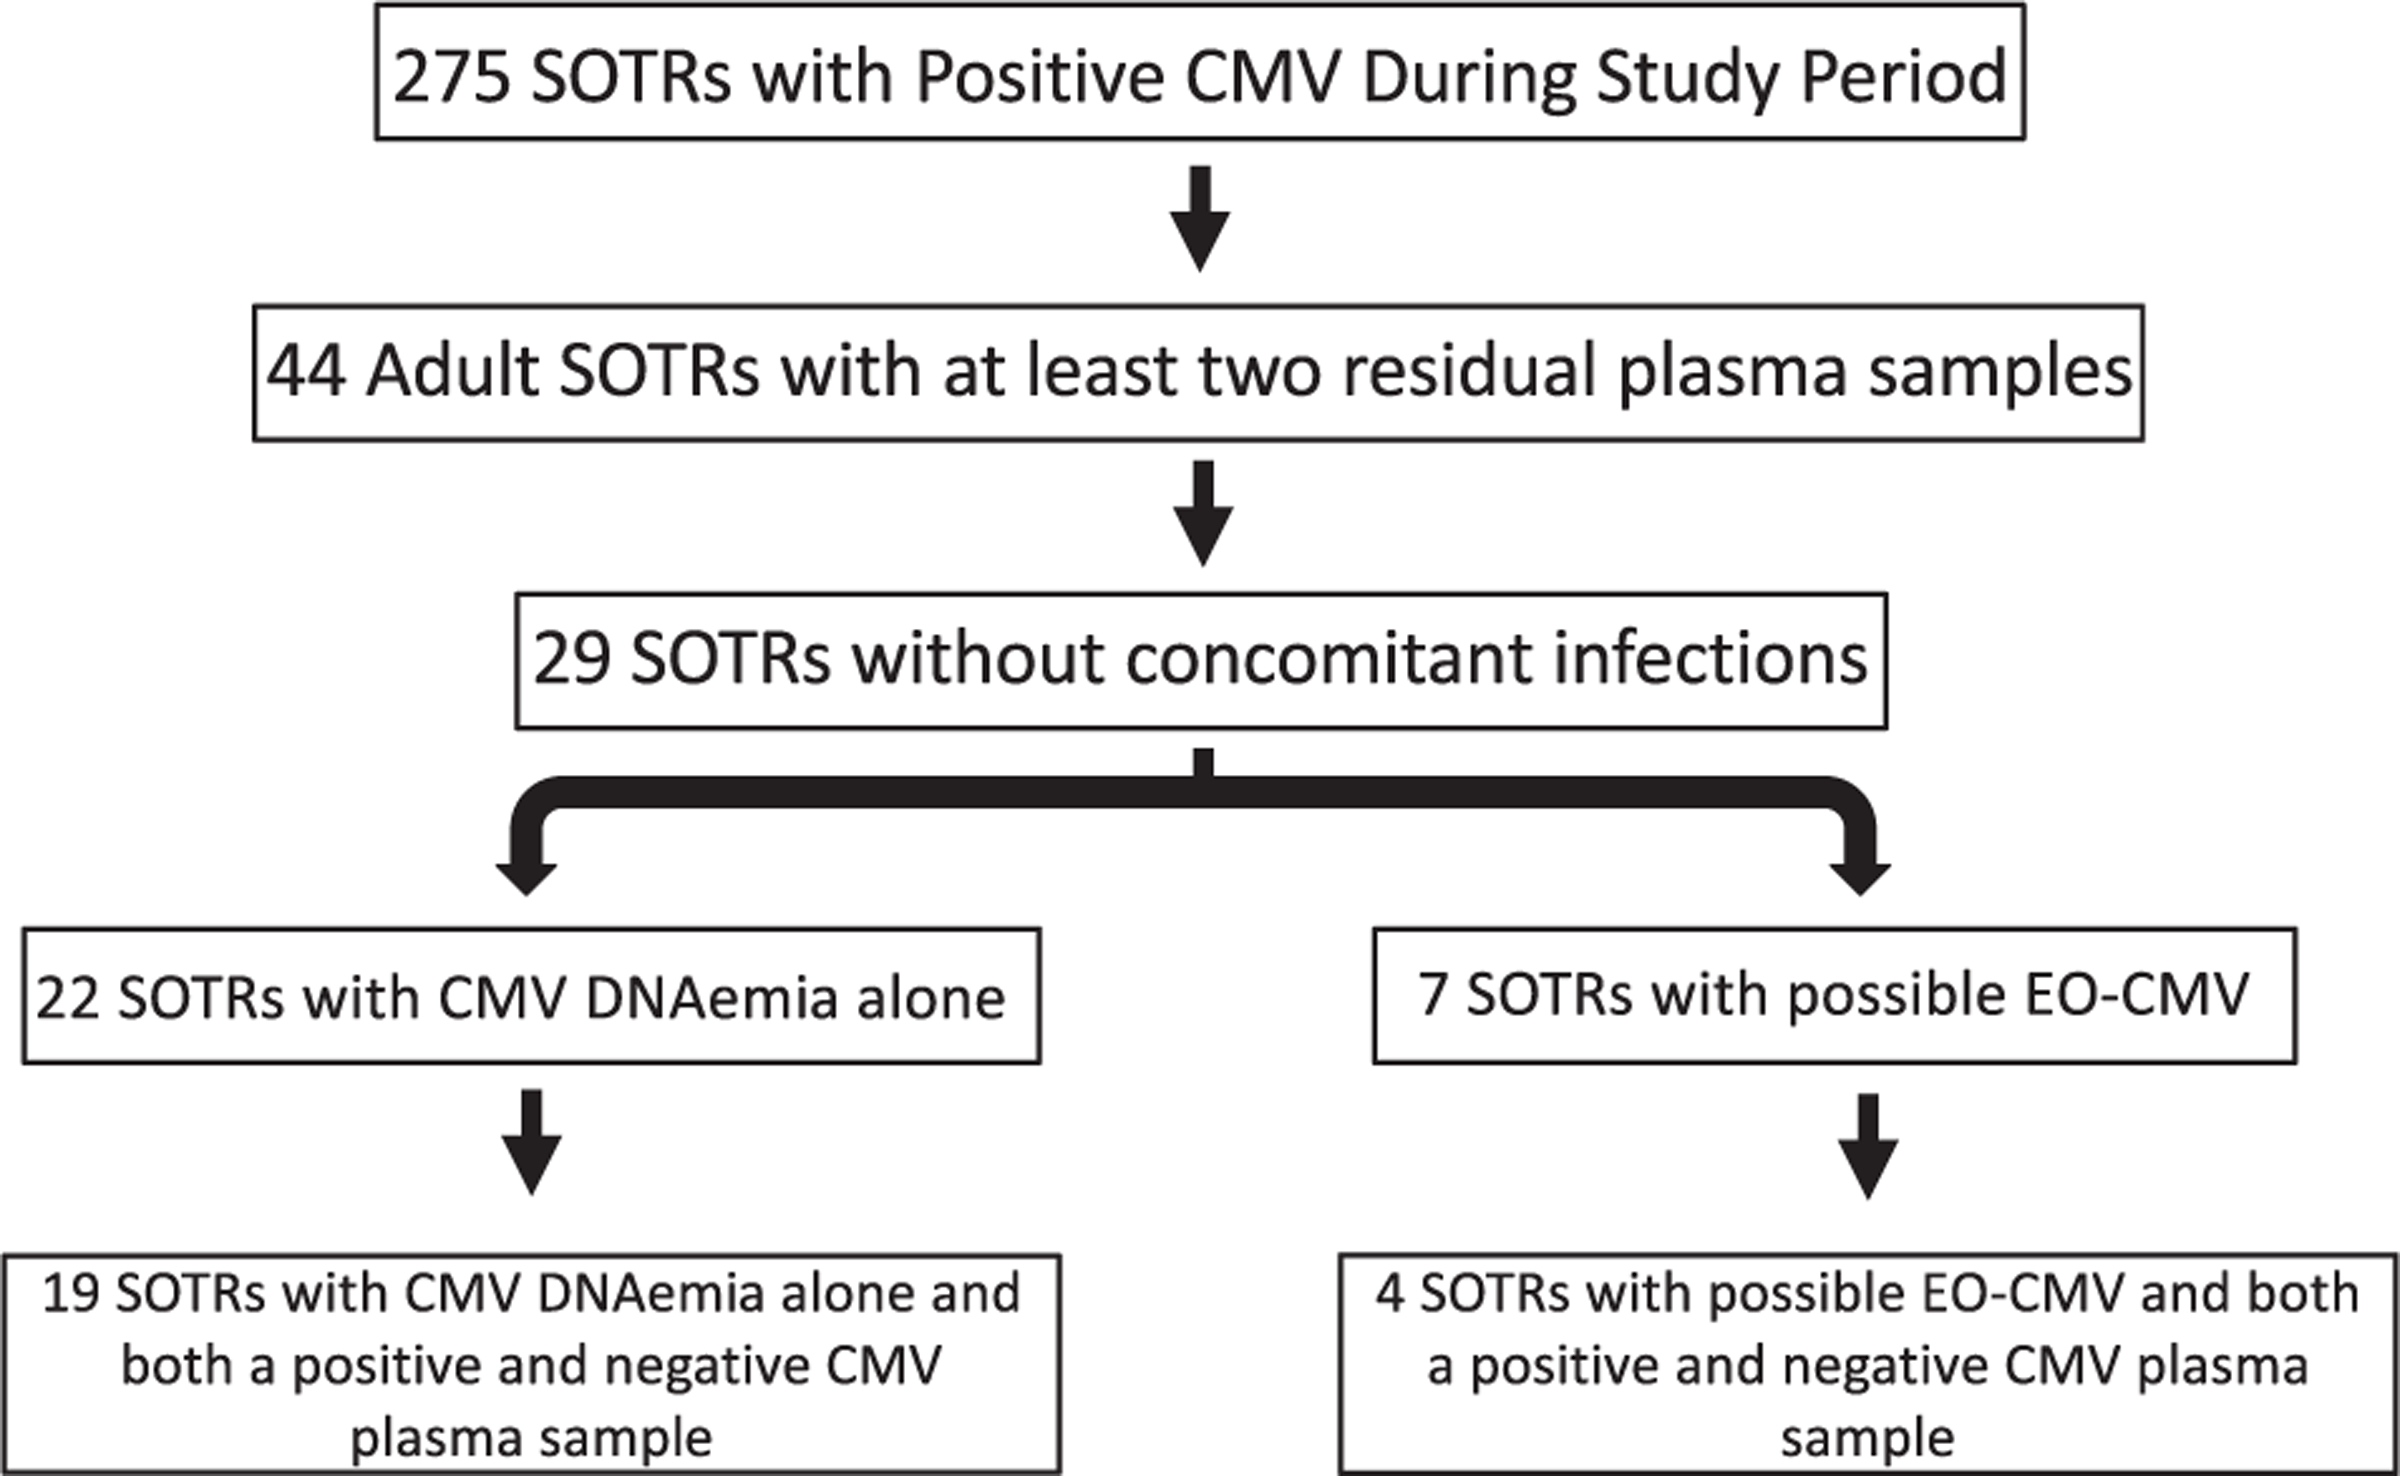
Study flowchart
3.2 |. CMV DNA plasma levels are higher in possible CMV end-organ disease
Peak plasma levels of CMV DNA were significantly higher in the possible EO-CMV group than in the group with DNAemia alone (Figure 2). However, there was significant overlap between the two groups. Four of the 22 SOTRs with DNAemia had higher CMV DNA levels than the median of the possible EO-CMV group, and two of the seven patients with possible EO-CMV had peak levels within the interquartile range (IQR) of the DNAemia group. This overlap highlights that plasma CMV DNA level is not a reliable predictor of end-organ disease.8
FIGURE 2.
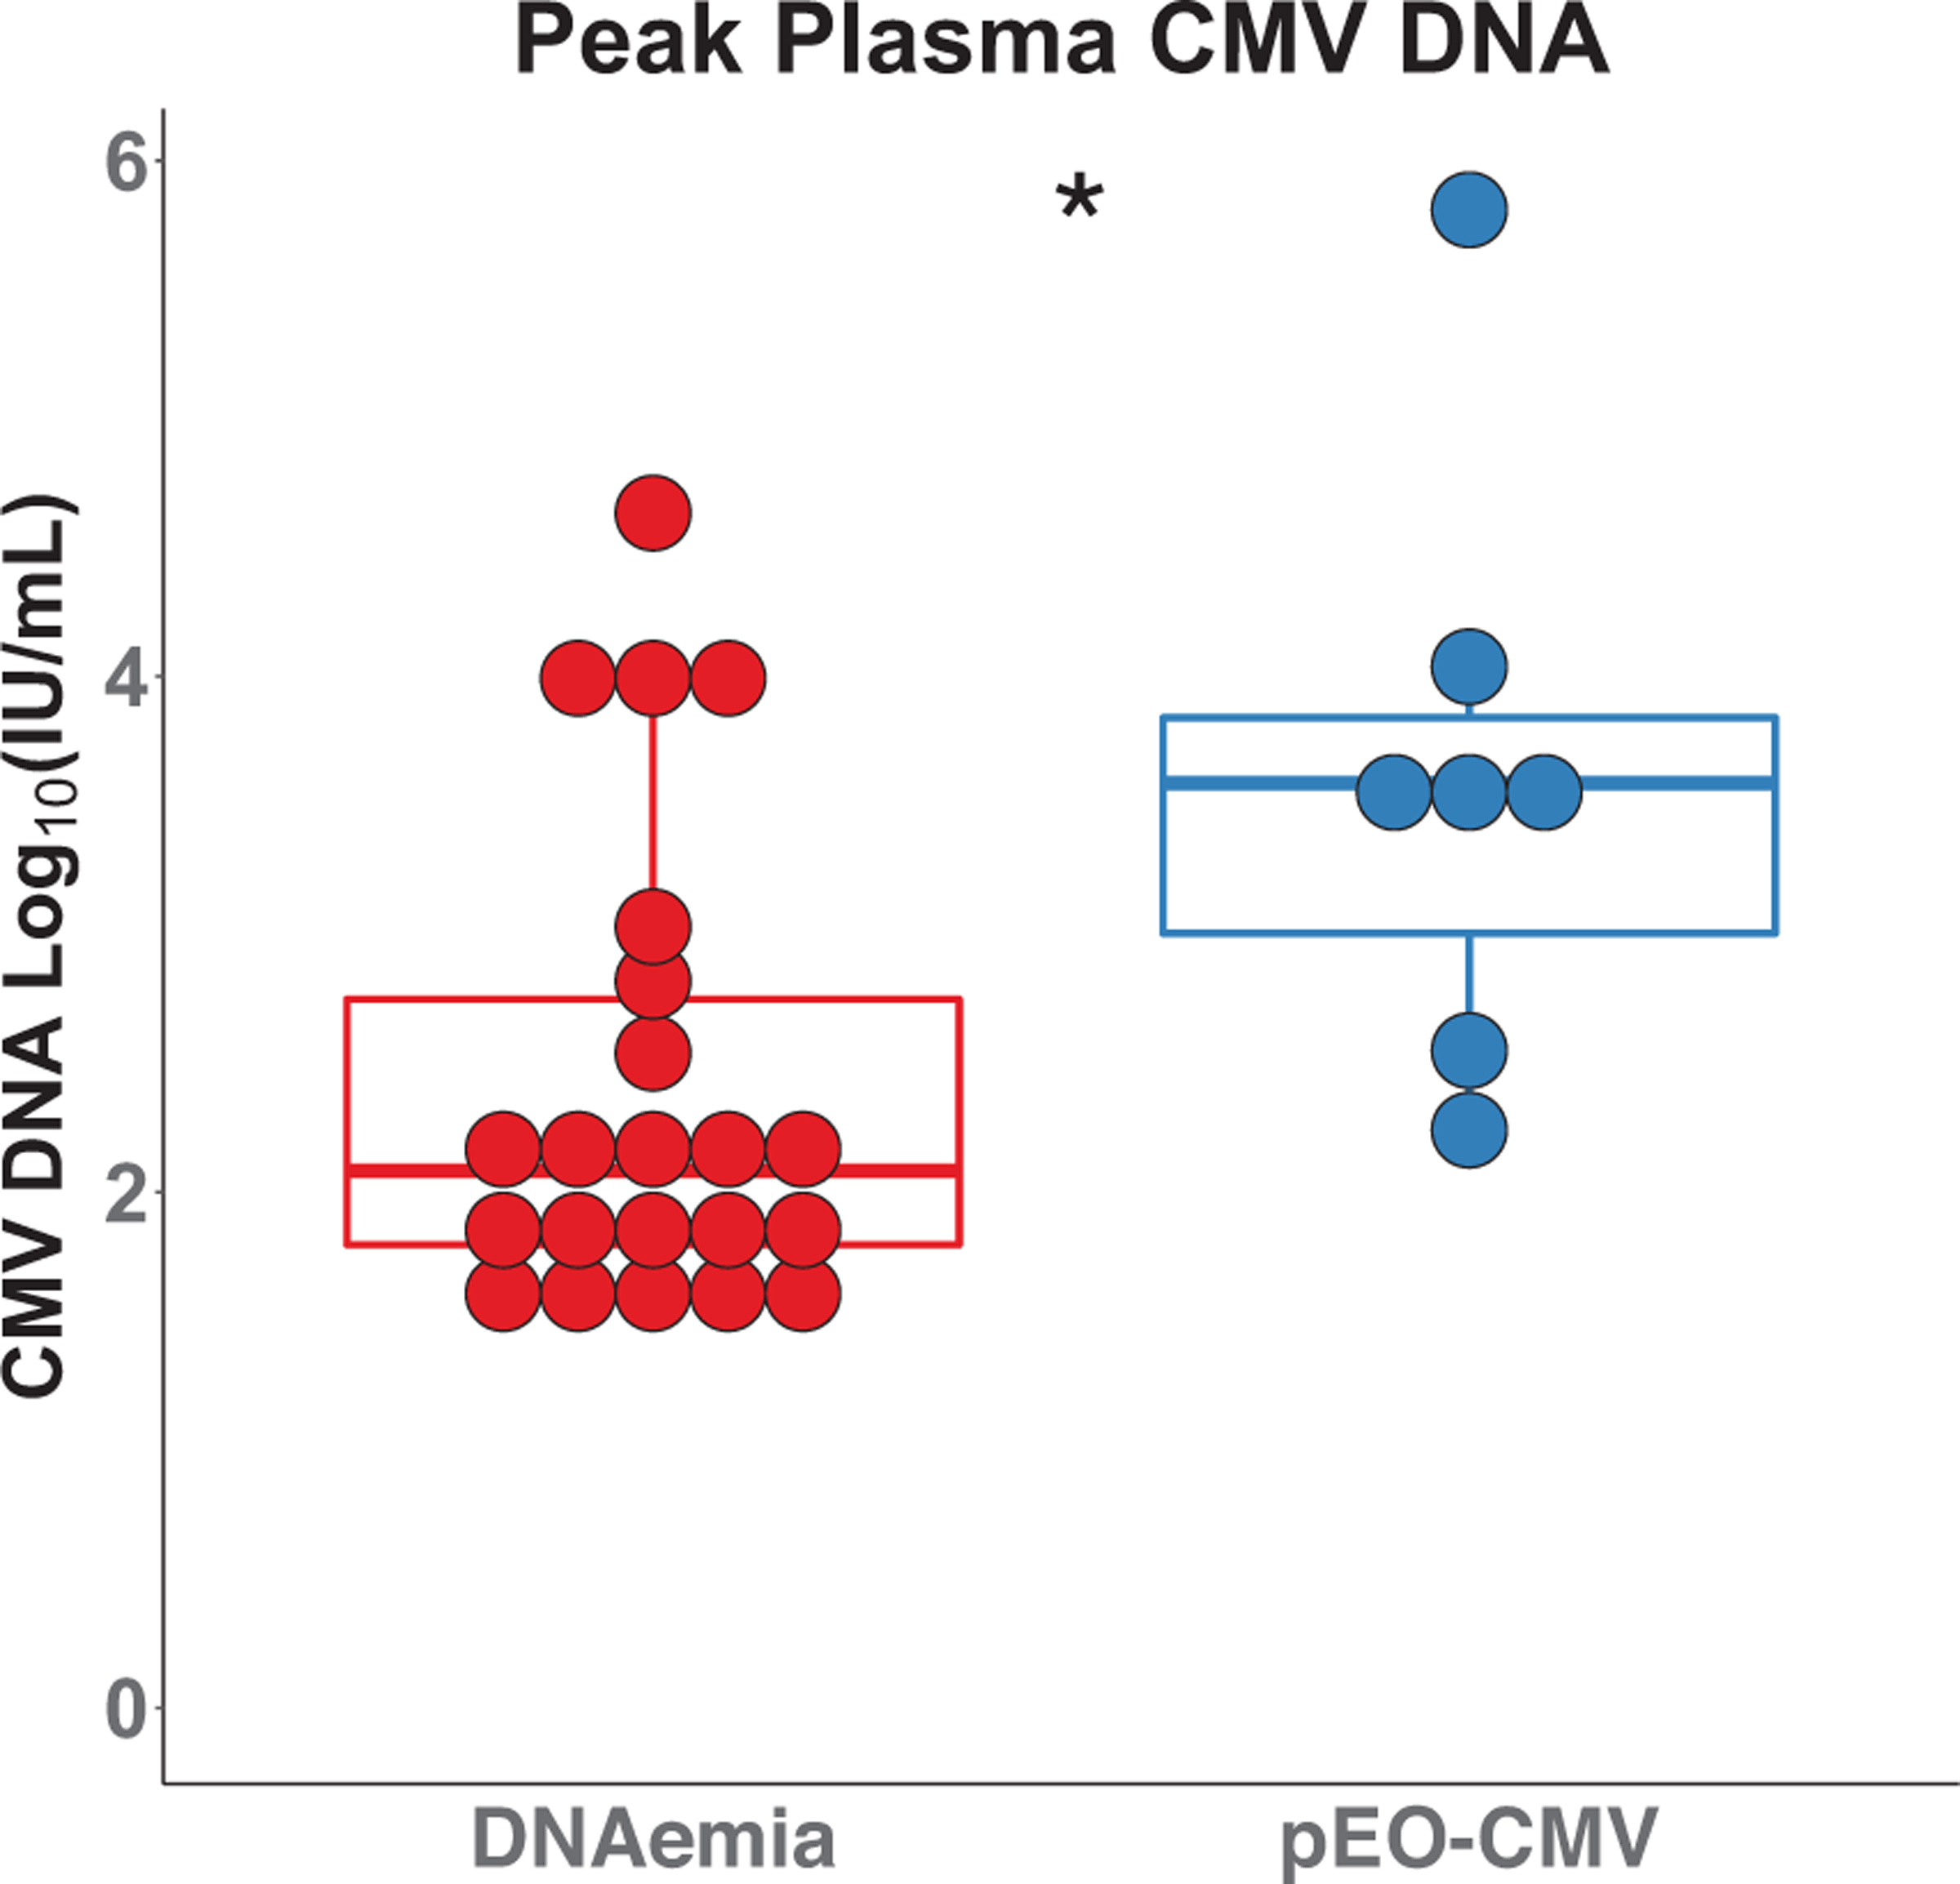
Plasma cytomegalovirus (CMV) DNA levels. Peak CMV DNA plasma levels were compared between the CMV DNAemia group (left, red) and the possible end-organ (EO)-CMV group (right, blue) using a Wilcoxon–Mann–Whitney test; p-value = .013. The boxplots represent the interquartile range (IQR). The median is represented by a horizontal line in the box. The lower and upper whiskers represent 1.5× the IQR beyond the quartiles. Each dot represents an individual sample
3.3 |. Only a subset of measured cytokines increased during CMV DNAemia
A total of 23 of the 29 subjects in the cohort had residual plasma available from a time point where no CMV DNA was detected in plasma (either before or after an episode of CMV DNAemia). To evaluate how changes in cytokines track with CMV DNAemia, the cytokines were measured in the undetectable CMV samples and compared to the values at peak CMV DNAemia. The median values of IFN-γ, IL-10, IL-12p70, IL-18, and TNF-α were significantly increased at peak CMV compared to the paired samples with undetectable CMV, while levels of IL-2 were significantly decreased, and levels of IL-1β, IL-4, IL-6, IL-8, and IL-13 were not significantly different at the two time points (Figure 3A). Given that CMV DNA can be low or undetectable in D+/R+ liver transplant recipients with gastrointestinal EO-CMV,8 we also examined the R+ subset in the cohort and found that IFN-γ, IL-10, IL-12p70, IL-18, and TNF-α increase during CMV DNAemia in patients that were CMV R+ prior to transplant (Figure 3B). This also suggests that these cytokines are elevated during CMV reactivation, and not just primary infection.13
FIGURE 3.
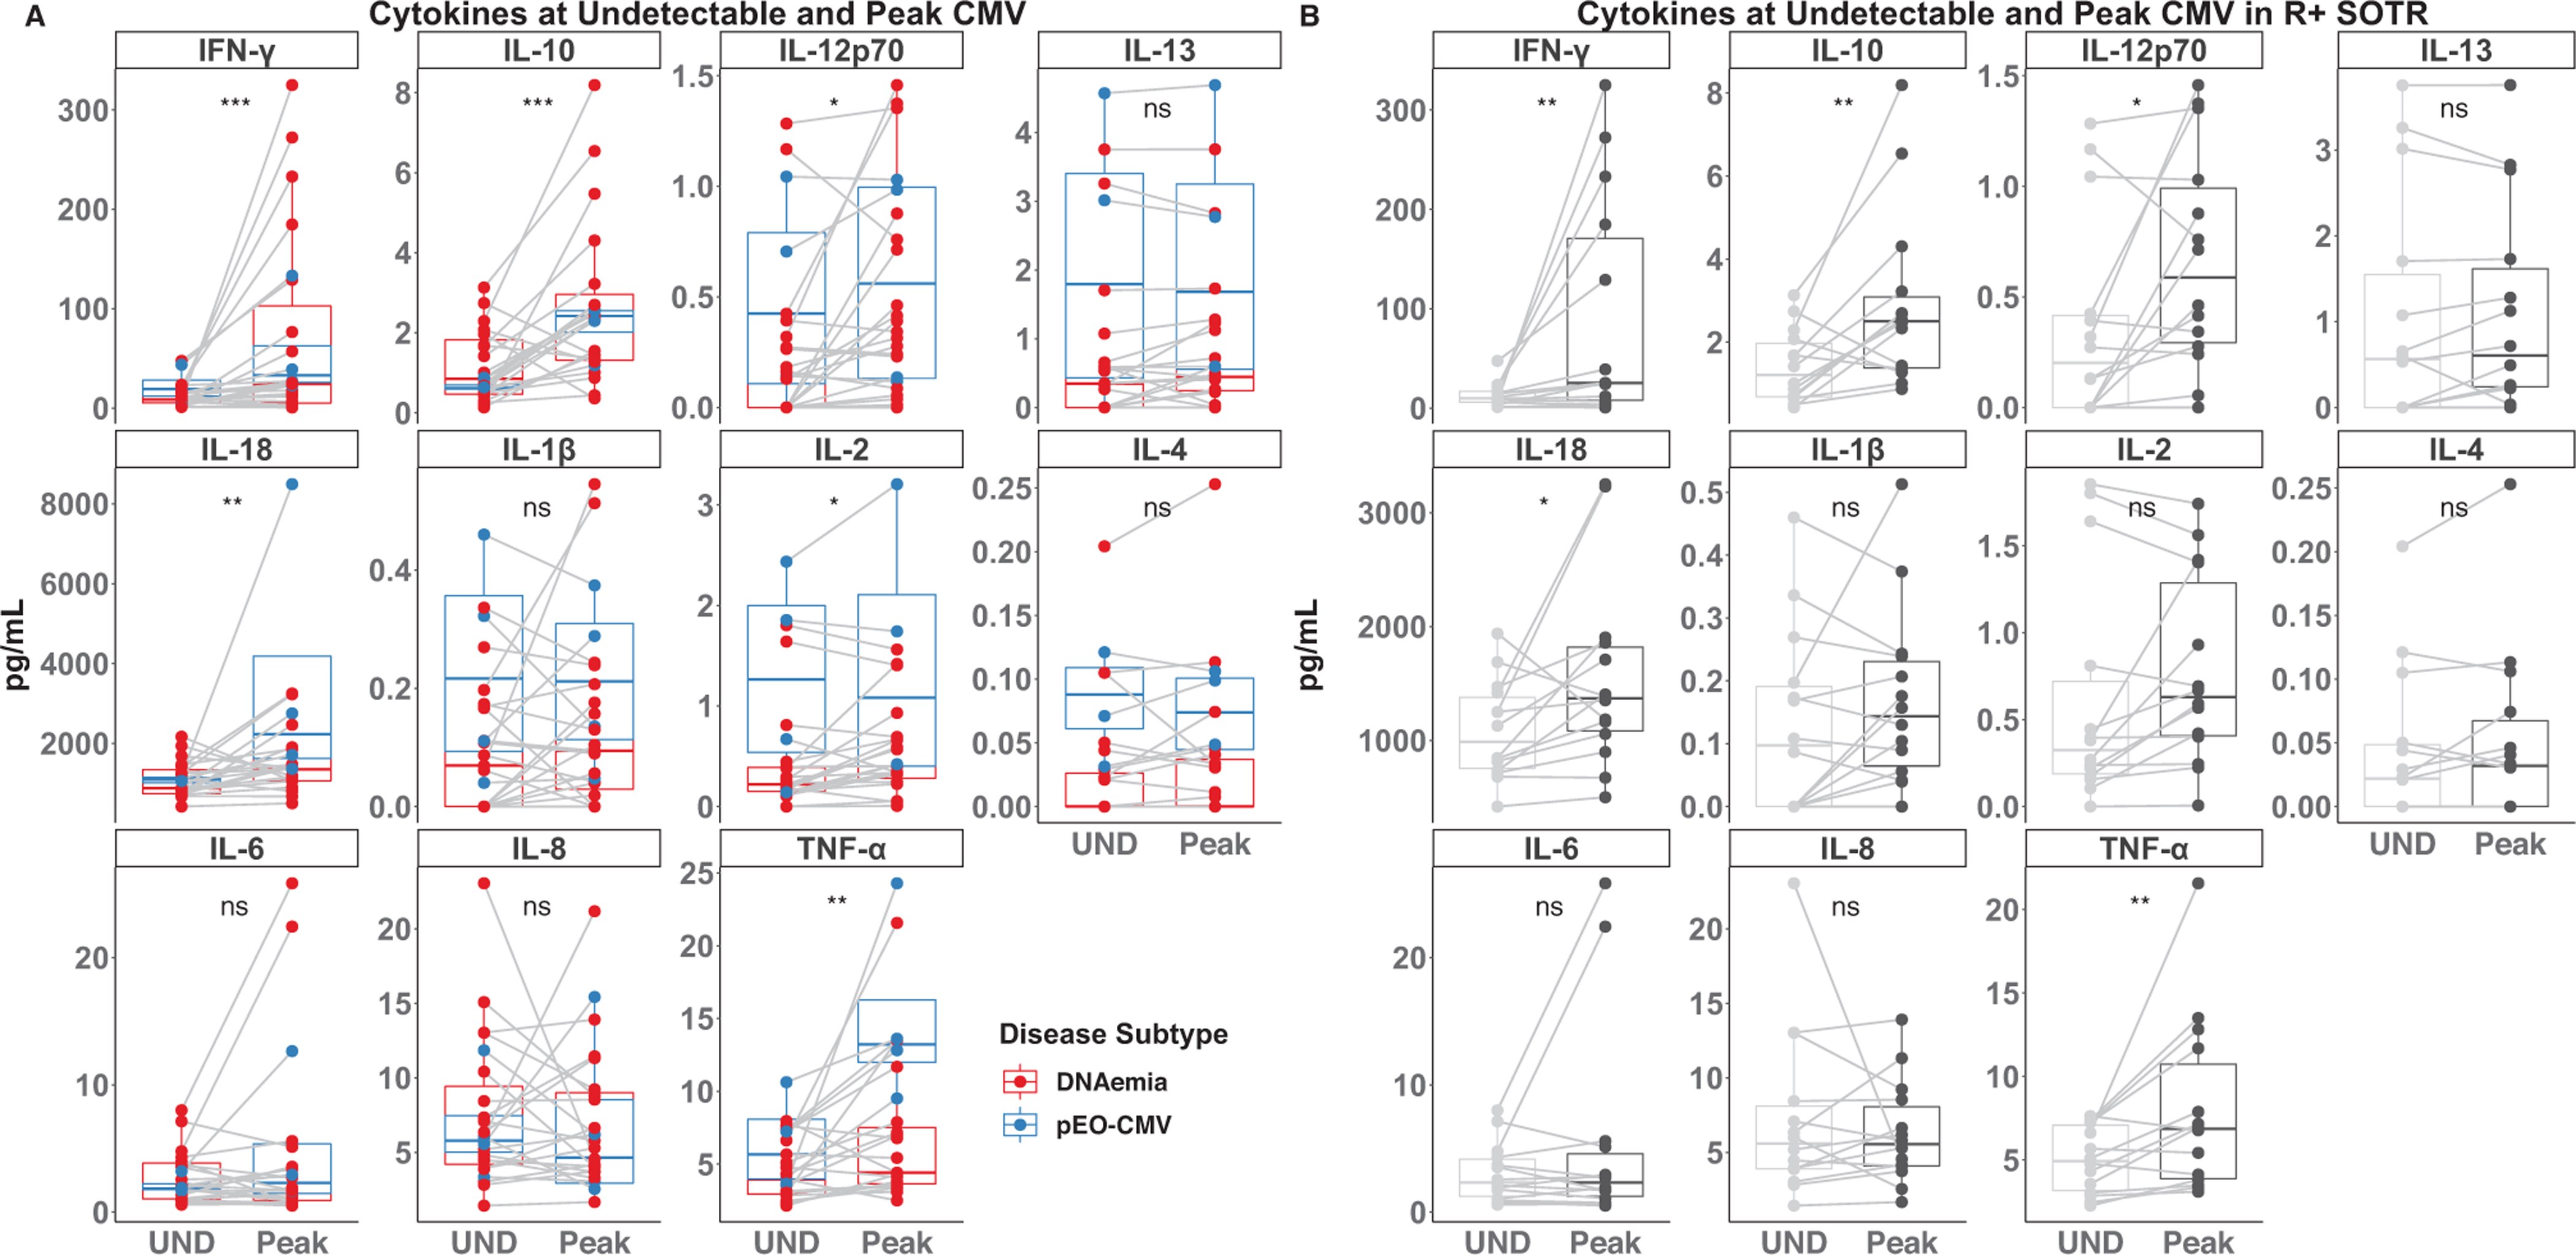
Cytokine levels when cytomegalovirus (CMV) is undetectable and at its peak. (A) The indicated cytokines were measured in plasma when CMV was undetectable (UND) and at peak CMV (Peak) in the 23 SOTRs with residual plasma from both undetectable and peak CMV DNAemia. Data points corresponding to patients with CMV DNAemia alone are colored red, while those with possible EO-CMV are colored blue. (B) Subset of R+ SOTRs. Differences between the UND and Peak measurements were determined by a paired Wilcoxon–Mann–Whitney test. NS, *, **, and *** indicate p-values >.05, <.05, <.01, <.001, respectively.
3.4 |. Elevated levels of IL-18 and TNF-α are associated with possible CMV end-organ disease
To determine if any of these cytokines were elevated in possible EO-CMV compared to DNAemia alone, differences in the median value of these cytokines at peak CMV DNAemia between the two disease subgroups were compared. Levels of IL-18, IL-1β, IL-4, and TNF-α at peak CMV DNAemia were significantly higher in the possible EO-CMV group compared to the DNAemia alone group (Figure 4). There was no significant difference in IFN-γ, IL-10, IL-12p70, IL-13, IL-2, IL-6, or IL-8 between the groups. Furthermore, there was no significant correlation between months since transplant and peak cytokine levels (Figure S1).
FIGURE 4.
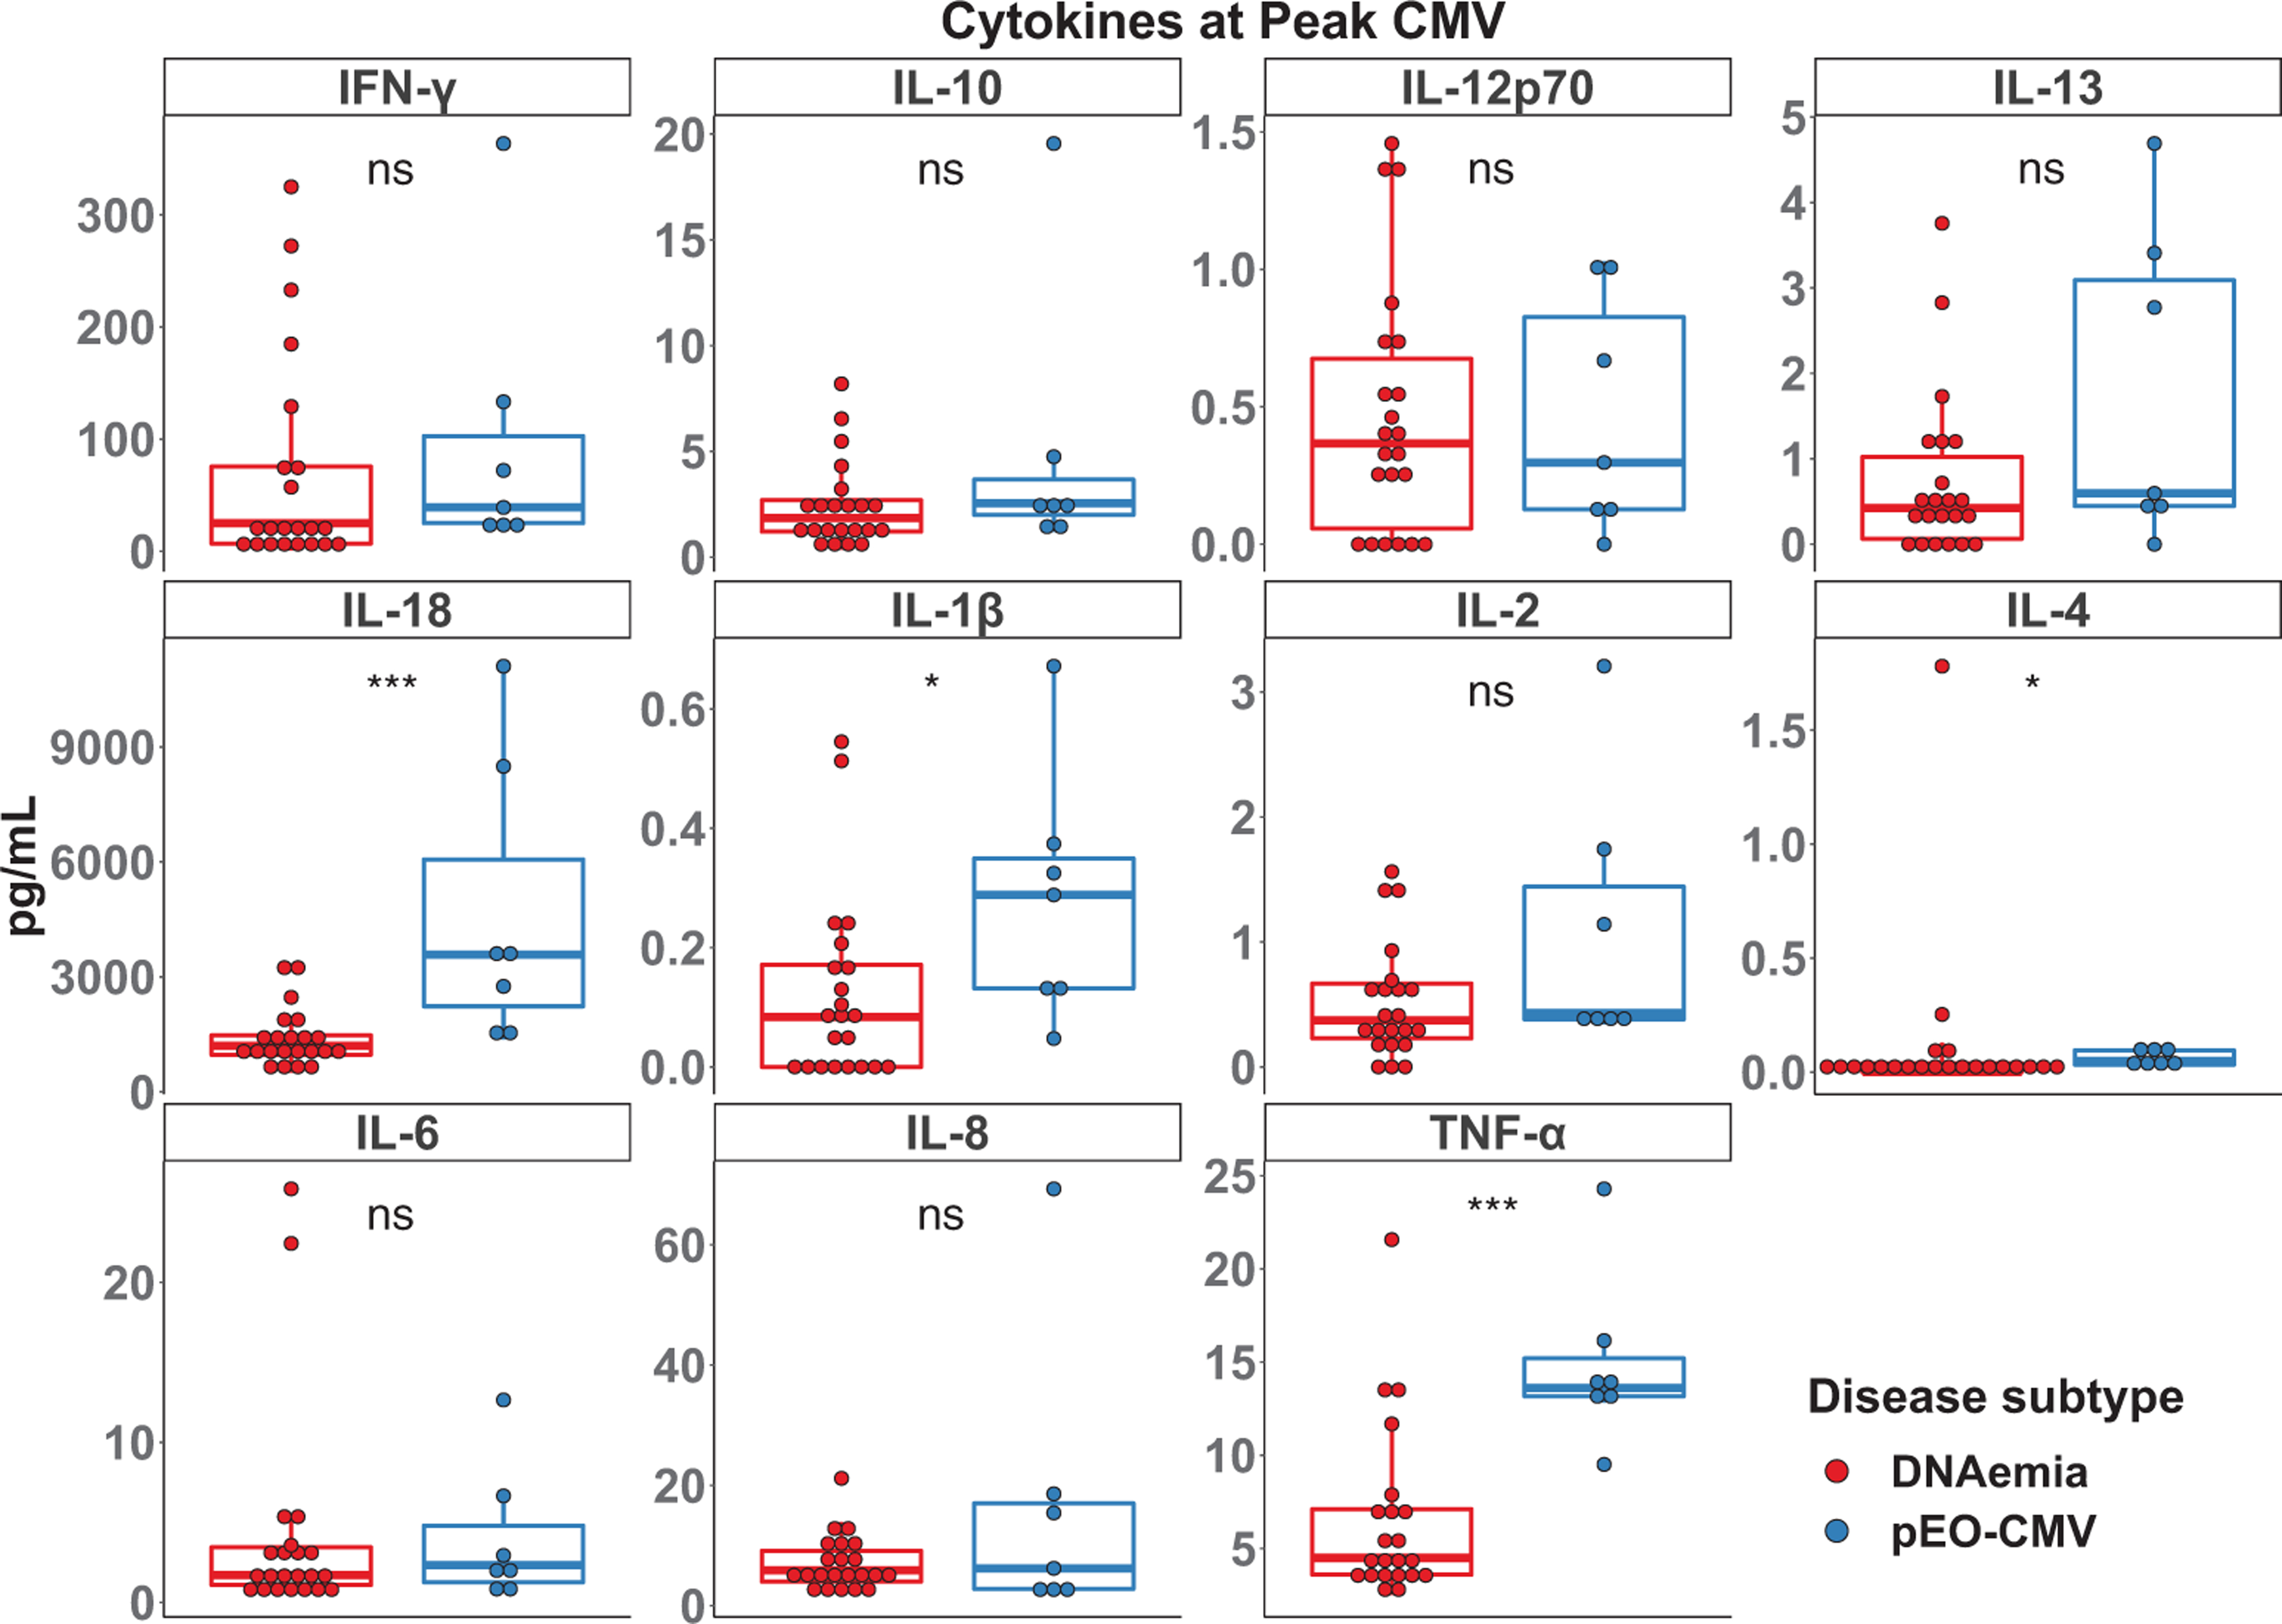
Cytokine levels at peak cytomegalovirus (CMV) levels. The indicated cytokines were measured in plasma at peak CMV levels. Differences between the CMV DNAemia (red) and possible end-organ (EO)-CMV (blue) groups were determined by a Wilcoxon–Mann–Whitney test. NS, *, **, and *** indicate p-values >.05, <.05, <.01, <.001, respectively.
Next, we computed unadjusted ORs (and 95% CIs) associated with possible EO-CMV for each of the measured plasma cytokines and amount of CMV DNA in plasma. Only TNF-α (pg/ml) (OR 1.36, 95% CI [1.07–1.74]), IL-18 (Log2 [pg/ml]) (8.35 [1.58–44.08]), and CMV DNA (Log10 IU/ml) (2.87 [1.13–7.28]) were significantly associated with an increased odds of having possible EO-CMV (Table 2). Given that IL-18 was previously associated with CMV DNAemia in D+/R− kidney recipients,13 we also computed ORs of having possible EO-CMV while adjusting for CMV DNA in plasma. IL-18 (6.97 [1.19–40.84]) remained significantly associated with an increased odds of possible EO-CMV when adjusting for CMV DNA (Table 2). In contrast, CMV DNA (1.41 [0.40–5.01]) was no longer significant when adjusting for IL-18 levels, with attenuation of the OR toward the null (Table 2). In an exploratory analysis of IL-18 as a predictor of possible EO-CMV disease, CMV DNA did not add substantially to the univariable IL-18 model, confirmed by likelihood of nested models (Akaike information criteria [AIC] 24.78 for multivariable model vs. AIC 23.06 for univariable model, p-value = .595), as well as by visual inspection of exploratory receiver operator curves (multivariable AUC 0.903 vs. univariable AUC 0.896 (Figure S2).
TABLE 2.
Odds ratio of possible end-organ disease
| Unadjusted odds ratio of possible EO-CMV | 95% CI | p-Value | |
|---|---|---|---|
| TNF-α (pg/ml) | 1.36 | 1.07–1.74 | .01 |
| IL-18 Log2 (pg/ml) | 8.35 | 1.58–44.08 | .01 |
| CMV Log10 (IU/ml) | 2.87 | 1.13–7.28 | .03 |
| IL-1β (0.1 pg/ml) | 1.61 | 0.97–2.66 | .06 |
| IL-13 (pg/ml) | 1.79 | 0.92–3.46 | .09 |
| IL-2 (pg/ml) | 3.29 | 0.8–13.44 | .10 |
| IL-10 (pg/ml) | 1.19 | 0.91–1.54 | .20 |
| IL-8 (pg/ml) | 1.07 | 0.96–1.18 | .22 |
| IFN-g (pg/ml) | 1.00 | 0.99–1.01 | .53 |
| IL-4 (pg/ml) | 0.56 | 0.02–20.22 | .75 |
| IL-6 (pg/ml) | 1.00 | 0.86–1.15 | .97 |
| IL-12p70 (pg/ml) | 0.97 | 0.13–7.27 | .97 |
| Adjusted odds ratio of possible EO-CMV | |||
| IL-18 Log2 (pg/ml) | 6.97 | 1.19–40.84 | .03 |
| CMV Log10 (IU/ml) | 1.41 | 0.40–5.01 | .54 |
Note: Unadjusted odds ratios and 95% CI were generated using a generalized linear model as described in materials and methods. Adjusted odds ratios and 95% CI were generated using a model containing both Log2IL-18 and Log10CMV.
4 |. DISCUSSION
Here we present evidence that elevations of IL-18 and TNF-α are associated with possible EO-CMV in SOTRs, and high IL-18 levels are associated with increased odds of possible EO-CMV after controlling for amount of CMV DNA in plasma. This is a novel and important finding because the amount of CMV DNA in plasma is not a reliable marker of EO-CMV8 due to both patient and assay factors. Furthermore, this pattern of cytokine elevation indicates that the innate immune system is activated in end-organ damage caused by CMV in SOTRs. Both IL-18 and TNF-α are largely produced by cells of the innate immune system, particularly macrophages, in response to recognition of pathogen-associated molecular patterns (PAMPs) or damage-associated molecular patterns (DAMPs).20,21 CMV infection is known to induce both IL-18 and TNF-α,14,22 but tissue damage caused by CMV in the affected organ could also be activating innate immune pathways. Thus, there are multiple explanations for why these innate cytokines might be elevated during EO-CMV. However, previous investigations into TNF-α and IL-18 in the context of CMV disease in SOTRs focused on renal transplant recipients, and in the case of IL-18, only on CMV R− patients.13,23 Thus, our study is the first to evaluate the role of these important proinflammatory cytokines in thoracic and multiorgan abdominal SOTRs, as well as among those patients who are CMV R+ at the time of transplant.
Both IL-18 and IL-1β are products of inflammasome activation. While IL-18 was both significantly higher in the possible EO-CMV group and associated with increased odds of possible EO-CMV, IL-1β was numerically, albeit not statistically significantly, increased in the possible EO-CMV group. This could be explained by the small sample size, but another relevant factor is the extremely low levels of IL-1β found in plasma compared to IL-18 (the max value of IL-18 in this study was over 10,000 pg/ml while the max value of IL-1β was less than 1 pg/ml). This is not unique to the SOT population and reflects previous studies that demonstrate IL-18 is a more robust measure of inflammasome activation in plasma.16,17 Furthermore, there may be a specific relationship between IL-18 and CMV disease in SOTRs as was pointed out by a recent study that found certain polymorphisms in the IL-18 promoter were associated with CMV DNAemia after stopping prophylaxis in renal transplant recipients.24
While IFN-γ and IL-10 were not significantly different between those with CMV DNAemia and those with possible EO-CMV, they were elevated during CMV DNAemia overall. This is consistent with previous literature that found these cytokines are elevated during CMV DNAemia and/or disease.13,25 However, these cytokines are more commonly associated with adaptive immunity rather than innate immunity.26,27
While there were some outliers in the cytokines measured in both groups, there was significant heterogeneity among the outliers, meaning that an outlier in one cytokine was rarely an outlier in another. However, there was one patient in the pEO-CMV group that had the highest value in IFN-γ, IL-18, IL-10, IL-1β, and IL-8. Changes in immunosuppressive medications can trigger episodes of CMV disease. However, in reviewing this patient’s medical record, immunosuppressive medications were increased more than 5 months prior to the episode of pEO-CMV (5 mg of prednisone was added) and mycophenolate was held indefinitely during and after the episode making this an unlikely explanation for these findings.
This study was limited to one center, a relatively small number of patients, and predominantly abdominal organ transplant recipients. Clinical management was per clinician preference in this retrospective study and included patients whom clinicians elected to treat for suspected EO-CMV without formally documenting this diagnosis with a biopsy. Furthermore, this was a retrospective study, without multiple serial measurements, so we cannot draw conclusions about the prognostic nature of these cytokines on the development of EO-CMV. Therefore, before we can conclude that increases in IL-18, TNF-α, or any other cytokine are definitively associated with EO-CMV disease, we would need to study them in a cohort with proven EO-CMV. However, possible EO-CMV is a recognized clinical research entity,6 and given the limitations in EO-CMV diagnostics, these results likely reflect real clinical scenarios. The study was also limited to the use of residual specimens, and therefore the time between disease onset and measurement of cytokines was not uniform. However, we did not find a significant difference between the two groups with regard to start of CMV DNAemia and the measurement of the cytokines. Inflammasome activation and IL-18 elevations are not specific to CMV infection. Rather, this pathway is active in a number of infectious and noninfectious inflammatory conditions.12,15,16 Therefore, IL-18 may increase in the setting of other infections, not just CMV. For this reason, we did not include patients with other infectious or inflammatory conditions and negative CMV studies. This does, however, limit the potential usefulness of IL-18 to situations in which CMV disease is already expected or diagnosed.
Despite these limitations, this study raises the possibility that a non-invasive measurement of one or more of these cytokines, in combination with plasma CMV DNA, may prove useful in the clinical evaluation of patients with possible EO-CMV. Under circumstances where a tissue biopsy is impractical or contraindicated, these assays could lend weight to clinical decision-making and formulation of treatment plans. This conclusion is both supported by the novel data presented here, as well as by a priori biological plausibility related to the important role of IL-18 and TNF-α in CMV infection. Future prospective studies with biopsy-proven EO-CMV would be helpful to confirm these findings.
Supplementary Material
ACKNOWLEDGMENTS
This work was supported by a grant from the Physician Scientist Training Program at Johns Hopkins University (Andrew H. Karaba). Andrew H. Karaba was also supported by the National Institutes of Health T32 AI007291-27. Alexis Figueroa was supported, in part, by grant D18HP29037 from the U.S. Health Resources and Services Administration, Bureau of Health Workforce, Health Careers Opportunity Program. William A. Werbel is supported by a grant from the Transplantation and Immunology Research Network of the American Society of Transplantation (gSAN-201C0WW). The authors thank Nicholas Cox and Carter Gray for their assistance with sample recovery. We also thank Karen Carroll, Michael Forman, and Heba Mostafa in the Clinical Microbiology Laboratory at Johns Hopkins and the Core for Clinical Research Data Acquisition of the Institute for Clinical and Translational Research at Johns Hopkins for their assistance in identifying and retrieving samples.
Funding information
American Society of Transplantation, Grant/Award Number: gSAN-201C0WW; U.S. Health Resources and Services Administration, Bureau of Health Workforce, Health Careers Opportunity Program; National Institute of Allergy and Infectious Diseases, Grant/Award Number: T32 AI007291-27; Physician Scientist Training Program at Johns Hopkins University
Abbreviations:
- AIC
Akaike information criteria
- AUC
area under the curve
- CI
confidence interval
- CMV
cytomegalovirus
- D(+/−)/R(+/−)
donor seropositive/seronegative for CMV/recipient seropositive/seronegative for CMV
- EO-CMV
end-organ cytomegalovirus disease
- HCV
hepatitis C virus
- IFN
interferon
- IL
interleukin
- OR
odds ratio
- PCR
polymerase chain reaction
- SOTR
solid organ transplant recipient
- TNF-α
tumor necrosis factor-α
Footnotes
DATA AVAILABILITY STATEMENT
Reasonable requests to the corresponding author for deidentified data will be granted.
SUPPORTING INFORMATION
Additional supporting information may be found online in the Supporting Information section at the end of the article.
CONFLICT OF INTEREST
The authors declare that there is no relevant conflict of interest to disclose.
REFERENCES
- 1.Razonable RR, Humar A. Cytomegalovirus in solid organ transplant recipients—guidelines of the American Society of Transplantation Infectious Diseases Community of Practice. Clin Transplant. 2019;33(9):e13512. [DOI] [PubMed] [Google Scholar]
- 2.Kotton CN, Kumar D, Caliendo AM, et al. The Third International Consensus Guidelines on the management of cytomegalovirus in solid-organ transplantation. Transplantation. 2018;102(6):900–931. [DOI] [PubMed] [Google Scholar]
- 3.van Delden C, Stampf S, Hirsch HH, et al. Burden and timeline of infectious diseases in the first year after solid organ transplantation in the Swiss Transplant Cohort Study. Clin Infect Dis. 2020;71(7):e159–e169. [DOI] [PMC free article] [PubMed] [Google Scholar]
- 4.Avery RK, Silveira FP, Benedict K, et al. Cytomegalovirus infections in lung and hematopoietic cell transplant recipients in the Organ Transplant Infection Prevention and Detection Study: a multi-year, multicenter prospective cohort study. TransplInfectDis. 2018;20(3):e12877. [DOI] [PMC free article] [PubMed] [Google Scholar]
- 5.Haidar G, Boeckh M, Singh N. Cytomegalovirus infection in solid organ and hematopoietic cell transplantation: state of the evidence. J Infect Dis. 2020;221(Supplement_1):S23–S31. [DOI] [PMC free article] [PubMed] [Google Scholar]
- 6.Ljungman P, Boeckh M, Hirsch HH, et al. Definitions of cytomegalovirus infection and disease in transplant patients for use in clinical trials. Clin Infect Dis. 2017;64(1):87–91. [DOI] [PubMed] [Google Scholar]
- 7.Razonable RR, Inoue N, Pinninti SG, et al. Clinical diagnostic testing for human cytomegalovirus infections. J Infect Dis. 2020;221(Supplement_1):S74–S85. [DOI] [PMC free article] [PubMed] [Google Scholar]
- 8.Durand CM, Marr KA, Arnold CA, et al. Detection of cytomegalovirus DNA in plasma as an adjunct diagnostic for gastrointestinal tract disease in kidney and liver transplant recipients. Clin Infect Dis. 2013;57(11):1550–1559. [DOI] [PMC free article] [PubMed] [Google Scholar]
- 9.Dengler TJ, Raftery MJ, Werle M, Zimmermann R, Schönrich G. Cytomegalovirus infection of vascular cells induces expression of proinflammatory adhesion molecules by paracrine action of secreted interleukin-1beta. Transplantation. 2000;69(6):1160–1168. [DOI] [PubMed] [Google Scholar]
- 10.Bayer C, Varani S, Wang L, et al. Human cytomegalovirus infection of M1 and M2 macrophages triggers inflammation and autologous T-cell proliferation. J Virol. 2013;87(1):67–79. [DOI] [PMC free article] [PubMed] [Google Scholar]
- 11.Zhu H, Cong J-P, Mamtora G, Gingeras T, Shenk T. Cellular gene expression altered by human cytomegalovirus: global monitoring with oligonucleotide arrays. Proc Natl Acad Sci. 1998;95(24):14470–14475. [DOI] [PMC free article] [PubMed] [Google Scholar]
- 12.Evavold CL, Kagan JC. Inflammasomes: threat-assessment organelles of the innate immune system. Immunity. 2019;51(4):609–624. [DOI] [PMC free article] [PubMed] [Google Scholar]
- 13.van de Berg PJ, Heutinck KM, Raabe R, et al. Human cytomegalovirus induces systemic immune activation characterized by a type 1 cytokine signature. J Infect Dis. 2010;202(5):690–699. [DOI] [PubMed] [Google Scholar]
- 14.Botto S, Abraham J, Mizuno N, et al. Human cytomegalovirus immediate early 86-kDa protein blocks transcription and induces degradation of the immature interleukin-1β protein during virion-mediated activation of the AIM2 inflammasome. mBio. 2019;10(1): e02510–e02518. [DOI] [PMC free article] [PubMed] [Google Scholar]
- 15.Balagopal A, Gupte N, Shivakoti R, et al. Continued elevation of interleukin-18 and interferon-γ after initiation of antiretroviral therapy and clinical failure in a diverse multicountry human immunodeficiency virus cohort. Open Forum Infect Dis. 2016;3(3):ofw118. [DOI] [PMC free article] [PubMed] [Google Scholar]
- 16.Osburn WO, Levine JS, Chattergoon MA, Thomas DL, Cox AL. Anti-inflammatory cytokines, pro-fibrogenic chemokines and persistence of acute HCV infection. J Viral Hepat. 2013;20(6):404–413. [DOI] [PMC free article] [PubMed] [Google Scholar]
- 17.Chattergoon MA, Levine JS, Latanich R, Osburn WO, Thomas DL, Cox AL.High plasmainterleukin-18 levels mark the acute phase of hepatitis C virus infection. J Infect Dis. 2011;204(11):1730–1740. [DOI] [PMC free article] [PubMed] [Google Scholar]
- 18.Robin X, Turck N, Hainard A, et al. pROC: an open-source package for R and S+ to analyze and compare ROC curves. BMC Bioinformatics. 2011;12(1):77. [DOI] [PMC free article] [PubMed] [Google Scholar]
- 19.Zeileis A, Hothorn T. Diagnostic checking in regression relationships. R News. 2002;2(3):7–10. [Google Scholar]
- 20.Dinarello CA. Overview of the IL-1 family in innate inflammation and acquired immunity. Immunol Rev. 2018;281(1):8–27. [DOI] [PMC free article] [PubMed] [Google Scholar]
- 21.Parameswaran N, Patial S. Tumor necrosis factor-α signaling in macrophages. Crit Rev Eukaryot Gene Expr. 2010;20(2):87–103. [DOI] [PMC free article] [PubMed] [Google Scholar]
- 22.Humar A, St Louis P, Mazzulli T, et al. Elevated serum cytokines are associated with cytomegalovirus infection and disease in bone marrow transplant recipients. J Infect Dis. 1999;179(2):484–488. [DOI] [PubMed] [Google Scholar]
- 23.Tong CYW, Bakran A, Williams H, Cuevas LE, Peiris JSM, Hart CA. Association of tumour necrosis factor alpha and interleukin 6 levels with cytomegalovirus DNA detection and disease after renal transplantation. J Med Virol. 2001;64(1):29–34. [DOI] [PubMed] [Google Scholar]
- 24.Pérez-Flores I, Santiago JL, Fernández-Pérez C, et al. Impacts of interleukin-18 polymorphisms on the incidence of delayed-onset cytomegalovirus infection in a cohort of kidney transplant recipients. Open Forum Infect Dis. 2019;6(9):ofz325. [DOI] [PMC free article] [PubMed] [Google Scholar]
- 25.Limaye AP, La Rosa C, Longmate J, Diamond DJ. Plasma IL-10 levels to guide antiviral prophylaxis prevention of late-onset cytomegalovirus disease, in high risk solid kidney and liver transplant recipients. Transplantation. 2016;100(1):210–216. [DOI] [PMC free article] [PubMed] [Google Scholar]
- 26.Ouyang W, O’Garra A. IL-10 family cytokines IL-10 and IL-22: from basic science to clinical translation. Immunity. 2019;50(4):871–891. [DOI] [PubMed] [Google Scholar]
- 27.Kumar D, Mian M, Singer L, Humar A. An interventional study using cell-mediated immunity to personalize therapy for cytomegalovirus infection after transplantation. Am J Transplant. 2017;17(9):2468–2473. [DOI] [PubMed] [Google Scholar]
Associated Data
This section collects any data citations, data availability statements, or supplementary materials included in this article.