

Abstract
Purpose:
Multi-energy CT (MECT) has a great potential to enable many novel clinical applications such as simultaneous multi-contrast imaging. The purpose of this study was to implement triple-beam MECT on traditional energy-integrating-detector (EID) CT platform (EID-MECT).
Methods:
This was accomplished by mounting a z-axis split-filter (0.05 mm Au, 0.6 mm Sn) on Tube A of a dual-source EID CT scanner. With the two split x-ray beams from Tube A and the third beam from Tube B, three beams with different x-ray spectra can be simultaneously acquired. With Tube B operated at 70 or 80 kV and Tube A at 120 or 140 kV, four different triple-beam configurations were calibrated for MECT measurements: 70/Au120/Sn120, 80/Au120/Sn120, 70/Au140/Sn140, and 80/Au140/Sn140 kV. Iodine (I), gadolinium (Gd), bismuth (Bi) samples, and their mixtures were prepared for 2 three-material-decomposition tasks and 1 four-material-decomposition task. For each task, samples were placed in a water phantom and scanned using each of the four triple-beam configurations. For comparison, the same phantom was also scanned using three other dual-energy CT (DECT) or MECT technologies: twin-beam DECT (TB-DECT), dual-source DECT (DS-DECT), and photon-counting-detector CT (PCD-CT), all with optimal x-ray spectrum settings and at equal volume CT dose index (CTDIvol). The phantom for four-material decomposition (I/Gd/Bi/Water imaging) was scanned using the PCD-CT only (140 kV with 25, 50, 75, and 90 keV). Image-based material decomposition was performed to acquire material-specific images, on which the mean basis material concentrations and noise levels were measured and compared across all triple-beam configurations in EID-MECT and various DECT/MECT systems.
Results:
The optimal triple-beam configuration was task dependent with 70/Au120/Sn120, 70/Au140/Sn140, and 70/Au120/Sn120 kV for I/Gd/Water, I/Bi/Water, and I/Gd/Bi/Water material decomposition tasks, respectively. At equal radiation dose level, EID-MECT provided comparable or better quantification accuracy in material-specific images for all three material decomposition tasks, compared to EID based DECT and PCD-CT systems. In terms of noise level comparison, EID-MECT-derived material-specific images showed lower noise level than TB-DECT and DS-DECT, but slightly higher than that from PCD-CT in I/Gd/Water imaging. For I/Bi/Water imaging, EID-MECT showed comparable noise level to DS-DECT, and much lower noise level than TB-DECT and PCD-CT in all material-specific images. For the four-material decomposition task involving I/Gd/Bi/Water, the bismuth-specific image derived from EID-MECT was slightly noisier, but both iodine- and gadolinium-specific images showed much lower noise levels in comparison to PCD-CT.
Conclusions:
For the first time, an EID-based MECT system that can simultaneously acquire three x-ray spectra measurements was implemented on a clinical scanner, which demonstrated comparable or better imaging performance than existing DECT and MECT systems.
Keywords: Multi-energy CT (MECT), energy-integrating-detector (EID), twin-beam design, dual-energy CT (DECT), photon-counting-detector CT (PCD-CT), material decomposition
1. Introduction
Many clinical CT applications may benefit from simultaneous imaging of multiple contrast agents with one single dual-energy CT (DECT) or multi-energy CT (MECT), for example, iodine and gadolinium, or iodine and tungsten in multi-phase abdominal, renal, or cardiovascular imaging [1–3], iodine and bismuth in small bowel imaging [2, 4, 5], and three contrast agents (e.g., iodine/gadolinium/bismuth or iodine/gadolinium/gold) in other potential CT imaging applications [6, 7]. Different from traditional multiphase single-energy CT (SECT) scans, which may suffer from depths of breathing and motions of visceral organs caused by bowel peristalsis among different scans, one single DECT/MECT scan of different phases simultaneously could provide perfect or near perfect image co-registration among different phases due to high temporal resolution among different x-ray beam measurements, which is particularly critical for lower abdomen imaging or contrast-enhanced imaging [2, 8, 9].
Dual-energy CT (DECT) with two x-ray spectral measurements has been used for quantifying of up to three materials in a mixture when an additional physical constraint such as volume conservation is incorporated [10–12]. However, it may be challenging to perform accurate and precise material decomposition for three- or more materials using DECT, especially for contrast agents with K-edge within the spectrum energy range. In order to improve material decomposition and to provide a capability of decomposing more than three materials, multi-energy CT (MECT) enabled by energy-resolved photon-counting-detector CT (PCD-CT) has been investigated in material-specific imaging with multiple contrast agents [2]. The spectral performance in PCD-CT, however, is severely degraded by non-idealities of the PCD such as pulse pileup, K-edge escape, and charge sharing [13–15]. Because of these non-ideal effects, the radiation dose in PCD-CT was actually inefficient in comparison with existing energy-integrating-detector (EID) based DECT scanners for typical DECT applications [16].
To perform material-specific imaging with multiple contrast agents, attempts have been made to implement MECT on EID-based CT platform by acquiring three or more different x-ray beam measurements. Based on a multi-source CT concept, for example, each x-ray tube could be operated at a different tube voltage providing MECT imaging capability [17]. Another example is to place a spatial-spectral filter, composed of a repeating pattern of K-edge filter materials, in front of the x-ray source dividing the full x-ray beam into several spectral varied beamlets [6, 18]. Recently, a new scanner configuration was proposed to acquire triple- or quadruple-beam measurements nearly simultaneously on a dual-source (DS) CT scanner [19]. This design was motivated by Siemens’ twin-beam (TB) split-filter technique, which was implemented on their single-source scanners to enable dual-energy acquisition [20]. In the proposed DS MECT configuration, the split-filter could be applied to one or both x-ray sources to acquire three or four distinct x-ray beam measurements, which correspond to triple-beam and quadruple-beam configurations, respectively. Main advantages of this EID-based MECT approach include (1) easy implementation on existing DS CT scanner platform; (2) flexible adjustment of x-ray spectra; and (3) flexible adjustment of dose distribution among different spectra. Computer simulations were performed in our previous study, which demonstrated similar or better spectral separation and material decomposition noise performance, particularly the triple-beam configuration, compared to a PCD-CT scanner for a three-material decomposition task involving two contrast agents (iodine and bismuth) [19].
Motivated by the promising results shown in the simulation studies, we aim to implement the triple-beam MECT on a DS CT scanner in this study. In addition, we performed a phantom study on this new implementation of MECT to compare its performance with other EID-DECT systems and a research whole-body PCD-CT system with four energy bins.
2. Materials and Methods
2.1. EID-MECT Implementation on DS CT Platform
Figure 1a showed the schematic of EID-MECT with triple-beam configuration in which one of the subsystems (e.g., A-system consisting of Tube A and Detector A) is operated at the twin-beam mode, while the other (e.g., B-system consisting of Tube B and Detector B) is operated at the single-energy mode. Together, three distinct x-ray beam measurements can be obtained [19]. Helical pitch value needs to be limited to 0.5 or less in order to acquire data from each voxel element with all three energy levels [21]. Figure 1b demonstrated the practical implementation of the EID-MECT with triple-beam configuration on a DS CT platform (SOMATOM Definition Flash, Siemens Healthineers) by mounting a z-axis split-filter on Tube A, which was operated at 120 or 140 kV. The split-filter was selected as 0.05 mm gold (Au) and 0.6 mm tin (Sn) to be consistent with the existing twin-beam design on the TB-DECT system (SOMATOM Definition Edge, Siemens Healthineers), and mounted with the Sn side facing patient table and the Au side facing the backside of the gantry, as demonstrated in Figure 1c. Tube B can be operated at 70 or 80 kV. Four triple-beam configurations were available with different beam combinations of Tubes A and B: 70/Au120/Sn120, 80/Au120/Sn120, 70/Au140/Sn140, and 80/Au140/Sn140 kV.
Figure 1.
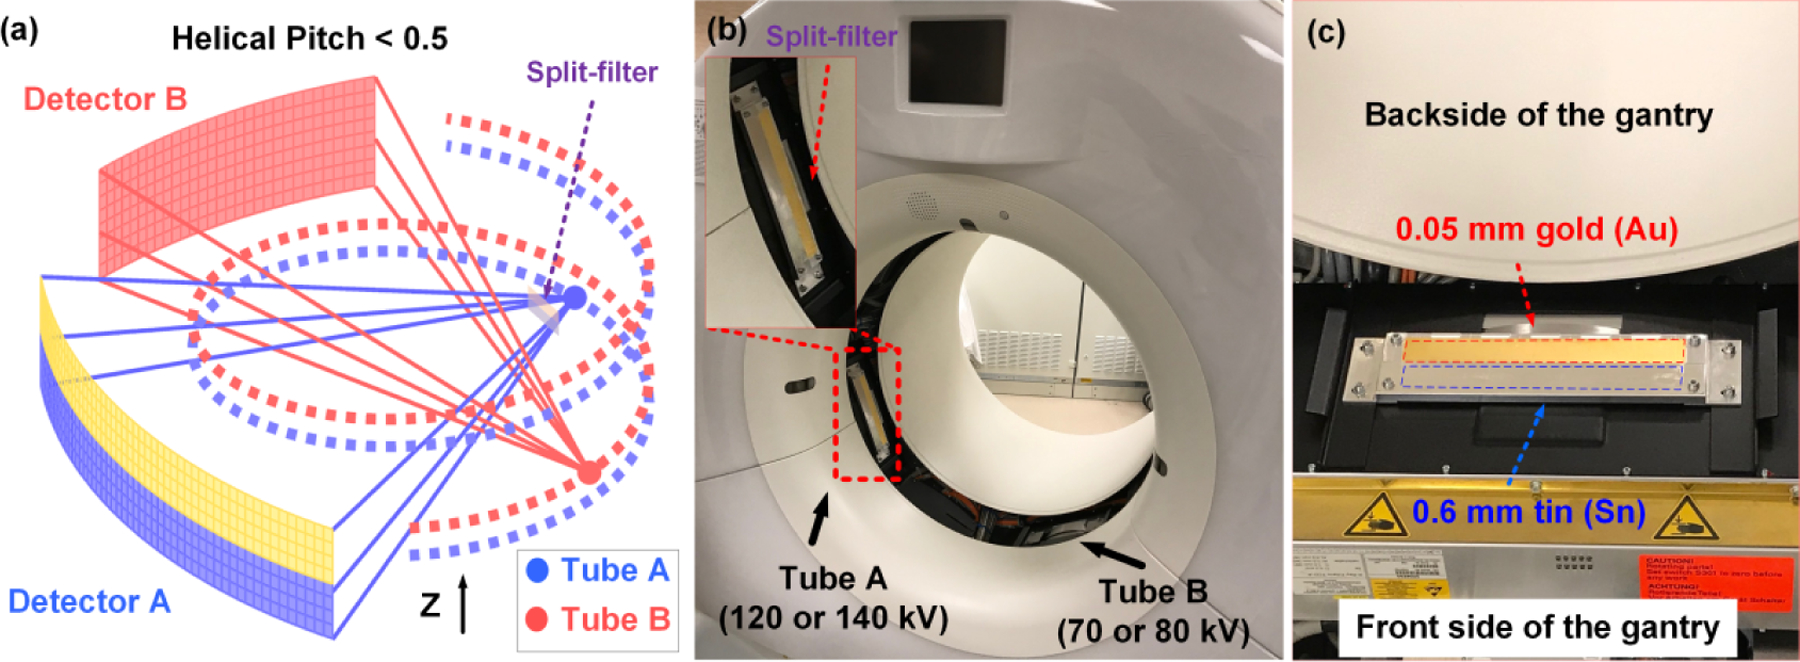
Implementation of EID-MECT with triple-beam configuration on a DS CT scanner with a split-filter installed on Tube A: (a) schematic illustration; (b) practical implementation; (c) zoomed-in picture of the split-filter with gantry cover removed, which consists of Au (0.05 mm thick) and Sn (0.6 mm thick).
To convert the standard DECT mode to the triple-beam MECT mode, both A- and B-systems were recalibrated in the Service Mode in the order of 1) air calibration, 2) beam hardening calibration, and 3) water scaling calibration. A dedicated water phantom from Siemens was used to perform the above 2nd and 3rd standard calibration procedures for each energy spectrum generated by the split filter, including Au120, Sn120, Au140, and Sn140 kV. After these calibration procedures, the reconstruction system from the scanner would convert the reconstructed images in linear attenuation coefficients to CT numbers utilizing the corresponding water linear attenuation coefficients determined in the calibration. Due to penumbra effects, a few detector rows close to the boundary of the filtered beams are affected, as they see a mixture of both Au and Sn spectra [22]. The data on these detector rows are still included in the computation of the mixed images, which ensures full utilization of all radiation dose. But for multi-energy imaging, the Au and Sn images are created by two slice-dependent weighting functions, similar to a Parker weighting in cardiac reconstruction. This is to ensure optimal spectral performance and dose efficiency. The cross-scatter correction of the DS CT was enabled and worked without further calibration or modifications, because it is based on dedicated sensors on both CT detectors outside of their primary beam collimation along the detector rows. As this cross-scatter correction is based on measured signal amplitudes, it is to a large extend independent of the incident spectra and can also be applied in this system configuration [23]. Note that the x-ray protective window ring, which was not shown in Figure 1b and 1c to reveal the installation of the split-filter, was elevated to provide extra space for the installed split-filter. All acquisition modes (kV, collimation, rotation time) that are relevant to the 4 triple-beam configurations were recalibrated. Water phantom was scanned to verify that the CT number was in tolerance and images were free of artifacts.
2.2. Phantom Design
We prepared three sets of contrast agent samples to be placed in a water tank phantom (lateral dimension: 25 cm). The first set of samples consists of iodine, gadolinium, and their mixtures made from iodine-based Iohexol (Omnipaque 350, GE Healthcare, Princeton, NJ) and gadolinium-based gadopentetate dimeglumine (Magnevist, Bayer Healthcare, Whippany, NJ) (Figure 2a). The second set of samples consists of iodine, bismuth, and their mixtures made from iodine-based Iohexol and bismuth-based bismuth subsalicylate (Pepto-Bismol, Proctor & Gamble, Cincinnati, Ohio) (Figure 2b). The third set of samples consists of all three contrast agents, iodine, gadolinium, bismuth, and their mixtures (Figure 2c), which was used to evaluate a potential four-material decomposition task (i.e., iodine/gadolinium/bismuth/water). Figure 2 shows the locations of those three sets of samples inside the water tank. The concentration value in mg/mL of each contrast agent is labelled for each sample. As listed in Table. 1, all prepared contrast samples were divided into two subgroups for calibration and test in each material decomposition task (details discussed in Section 2.4).
Figure 2.
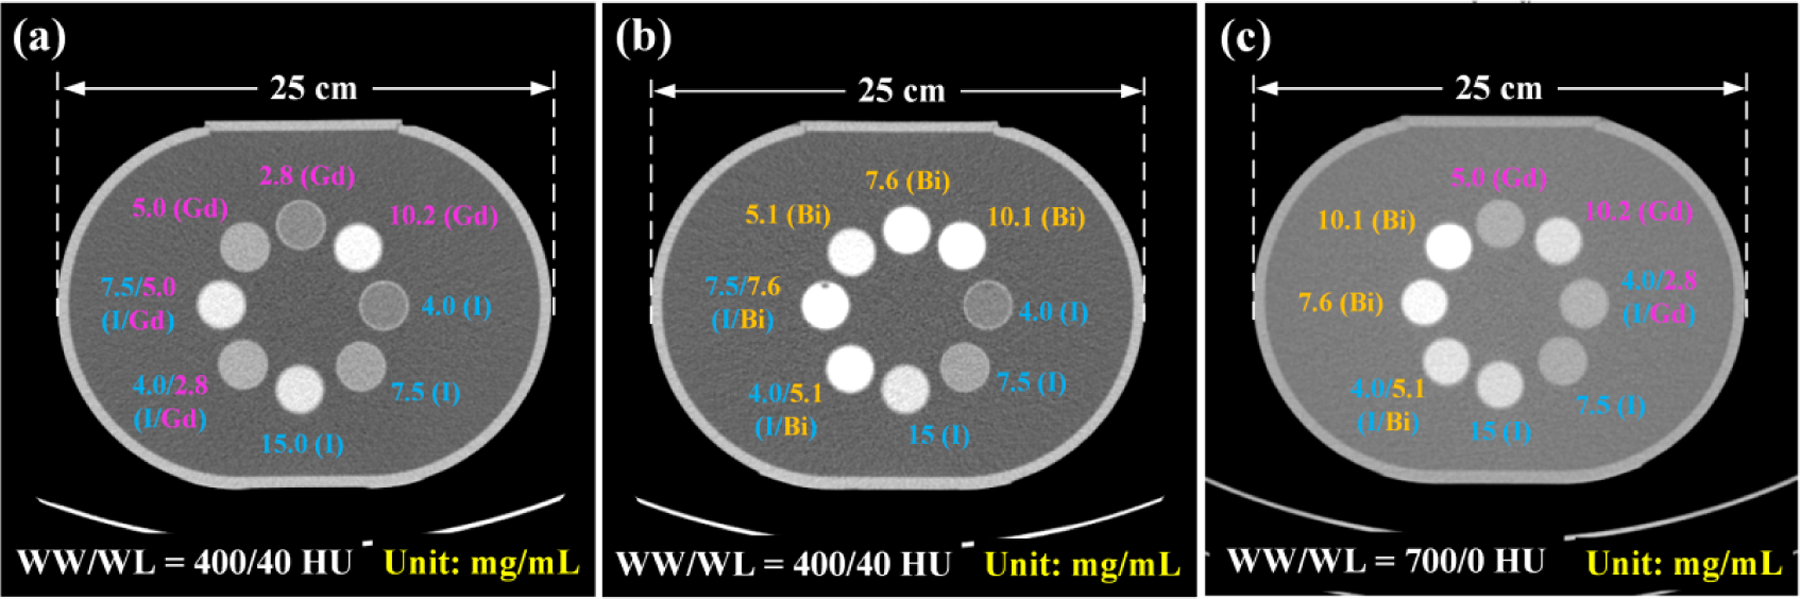
Illustration of three sets of contrast agent samples inside a water tank: (a) iodine, gadolinium, and their mixtures to evaluate a three-material decomposition task: iodine/gadolinium/water; (b) iodine, bismuth, and their mixtures to evaluate a three-material decomposition task: iodine/bismuth/water; (c) iodine, gadolinium, bismuth, and their mixtures to evaluate a four-material decomposition task: iodine/gadolinium/bismuth/water. Concentration value is labelled for each sample (unit: mg/mL). Water phantom lateral dimension: 25 cm (iodine: I; gadolinium: Gd; bismuth: Bi).
Table 1.
Subgroups of prepared samples for calibration and test in each material decomposition task (iodine: I; gadolinium: Gd; bismuth: Bi).
| I/Gd/water (unit: mg/mL) |
I/Bi/water (unit: mg/mL) |
I/Gd/Bi/water (unit: mg/mL) |
|||
|---|---|---|---|---|---|
| Calibration | Test | Calibration | Test | Calibration | Test |
| 4.0 (I)* | 7.5 (I) | ||||
| 4.0 (I) | 7.5 (I) | 4.0 (I) | 7.5 (I) | 15.0 (I) | 5.0 (Gd) |
| 15.0 (I) | 5.0 (Gd) | 15.0 (I) | 7.6 (Bi) | 2.8 (Gd)* | 4.0/2.8 (I/Gd) |
| 2.8 (Gd) | 4.0/2.8 (I/Gd) | 5.1 (Bi) | 4.0/5.1 (I/Bi) | 10.2 (Gd) | 7.6 (Bi) |
| 10.2 (Gd) | 7.5/5.0 (I/Gd) | 10.1 (Bi) | 7.5/7.6 (I/Bi) | 5.1 (Bi)* | 4.0/5.1 (I/Bi) |
| 10.1 (Bi) | |||||
these samples used for calibration were not shown in Figure 2c.
2.3. CT Data Acquisition
All phantoms were scanned on the EID-MECT system with each of the four triple-beam configurations (70/Au120/Sn120, 80/Au120/Sn120, 70/Au140/Sn140, and 80/Au140/Sn140 kV). The same phantoms were also scanned on a research whole-body PCD-CT system (SOMATOM CounT, Siemens Healthineers) operated in a “chess” mode, which provided the capability of multi-energy imaging with 4 energy bins [24–27]. Optimal x-ray tube potential and energy threshold settings in the PCD-CT system were empirically determined for each imaging task to yield optimal or near optimal material decomposition performance: 80 kV with energy thresholds of 25, 35, 50, and 55 keV for iodine/gadolinium/water imaging, and 140 kV with energy thresholds of 25, 50, 75, and 90 keV for other imaging tasks [2, 7, 28]. A lower (e.g., 80 kV) and a higher (e.g., 140 kV) x-ray tube potential are desired to allocate more photons near the K-edges of gadolinium and bismuth, respectively. Specifically, the 25 keV was set to reject electronic noise while not sacrificing the photon statistics in all imaging tasks. To capture the K-edges of gadolinium at 50.2 keV and bismuth at 90.5 keV respectively, the thresholds of 50 keV in iodine/gadolinium/water imaging and 90 keV in iodine/bismuth/water imaging were particularly selected. The other two thresholds, 35 and 55 keV in iodine/gadolinium/water imaging and 50 and 75 keV in iodine/bismuth/water imaging were determined to better utilize the K-edges through balancing the number of photons within adjacent energy bins. For iodine/gadolinium/bismuth/water imaging, 140 kV with 25, 50, 75, and 90 keV was determined to capture both K-edges of gadolinium and bismuth while providing balanced spectral separation. Since DECT can also solve the three-material problems, the two phantoms involving two contrast agents (Figure 2a and 2b) were also scanned on a TB-DECT scanner (SOMATOM Definition Edge, Siemens Healthineers) with the twin-beam setting of Au120/Sn120 kV, and a 2nd generation DS-DECT (SOMATOM Definition Flash, Siemens Healthineers) at 80/Sn140 kV, which was selected due to its superior spectral separation than 100/Sn140 kV. The data acquisition geometry, radiation dose, and image reconstruction parameters are summarized in Table 1. All the DECT and MECT measurements were performed at equal total radiation dose. Note that the CTDIvol was doubled in PCD-CT to compensate for 50% dose efficiency in the “chess” mode [24–27]. A simulation tool (DRASIM, Siemens Healthineers), which has previously proved to be accurate [29–31], was used for generating the spectra for all above DECT/MECT systems.
2.4. Basis Material Decomposition
A generic image-based material decomposition method was applied on all reconstructed DECT/MECT images to determine the basis material concentrations at each location through solving a linear equation system, as given by [15, 19]
| (1) |
where μ(Ei), i = 1,2, … , N (unit: cm−1) represent the linear attenuation coefficient measured at ith energy (E) beam/bin; , m = 1,2, … , M, i = 1,2, … , N (unit: cm2/mg) represent the mass attenuation coefficient of the mth basis material at ith energy beam/bin; N is the number of energy beams/bins (N = 2 for EID-DECT, N = 3 for EID-MECT, and N = 4 for PCD-CT); M is the number of basis materials (M = 3 for three-material decomposition and M = 4 for four-material decomposition); ρm (unit: mg/mL) and ρm0 (unit: mg/cm3) represent the basis material concentration in the mixtures for each location and the mass density in their pure forms, respectively; the last row refers to volume conservation.
A generalized least square optimization method was used to solve the above linear equation system, and the cost function is given by
| (2) |
where , , and denote energy beam/bin measurements, basis material concentrations, and coefficient matrix, respectively. The coefficient matrix excluding the last row for each imaging task was determined by using a calibration procedure on all samples pre-selected for calibration, as indicated in Table. 1. Specifically, the coefficient was fit as the slope of data points plotted with linear attenuation coefficient, μ(E) against the known basis material concentration ρm for each material m. V represents the variance-covariance matrix defining the variance Vnn(n ≤ N) in energy beam/bin image μ(En) and covariance Vnn′ (n, n′ ≤ N) between energy images μ(En) and μ(En′). The variance-covariance matrix V(n, n′ ≤ N) can be calculated using an identical region of interest (ROI) with P pixels in all the energy beam/bin images, as given by [16]
| (3) |
| (4) |
where and are the mean values in the chosen ROI in energy images denoted by μ(En) and μ(En′). Note that V(N+1)j = Vj(N+1) = 0, j=1,2, ⋯ , (N + 1), since the last element of is equal to a constant of 1. Thus, the inverse of V is calculated using the Moore-Penrose pseudoinverse.
In the current study, the material decomposition was directly performed on images with CT numbers without the need of converting to linear attenuation coefficients. It was shown in our previous work [10] that the material decomposition using CT numbers inherently incorporates the volume conservation and thus is equivalent to using linear attenuation coefficients in Eq. (1).
2.5. Quantitative Analysis
In order to evaluate the quantification accuracy and noise level, 8 slices from each set of material-specific image derived after material decomposition were selected from 15 consecutive slices with every other slice skipped to mitigate image correlations, as shown in Figure 3.
Figure 3.
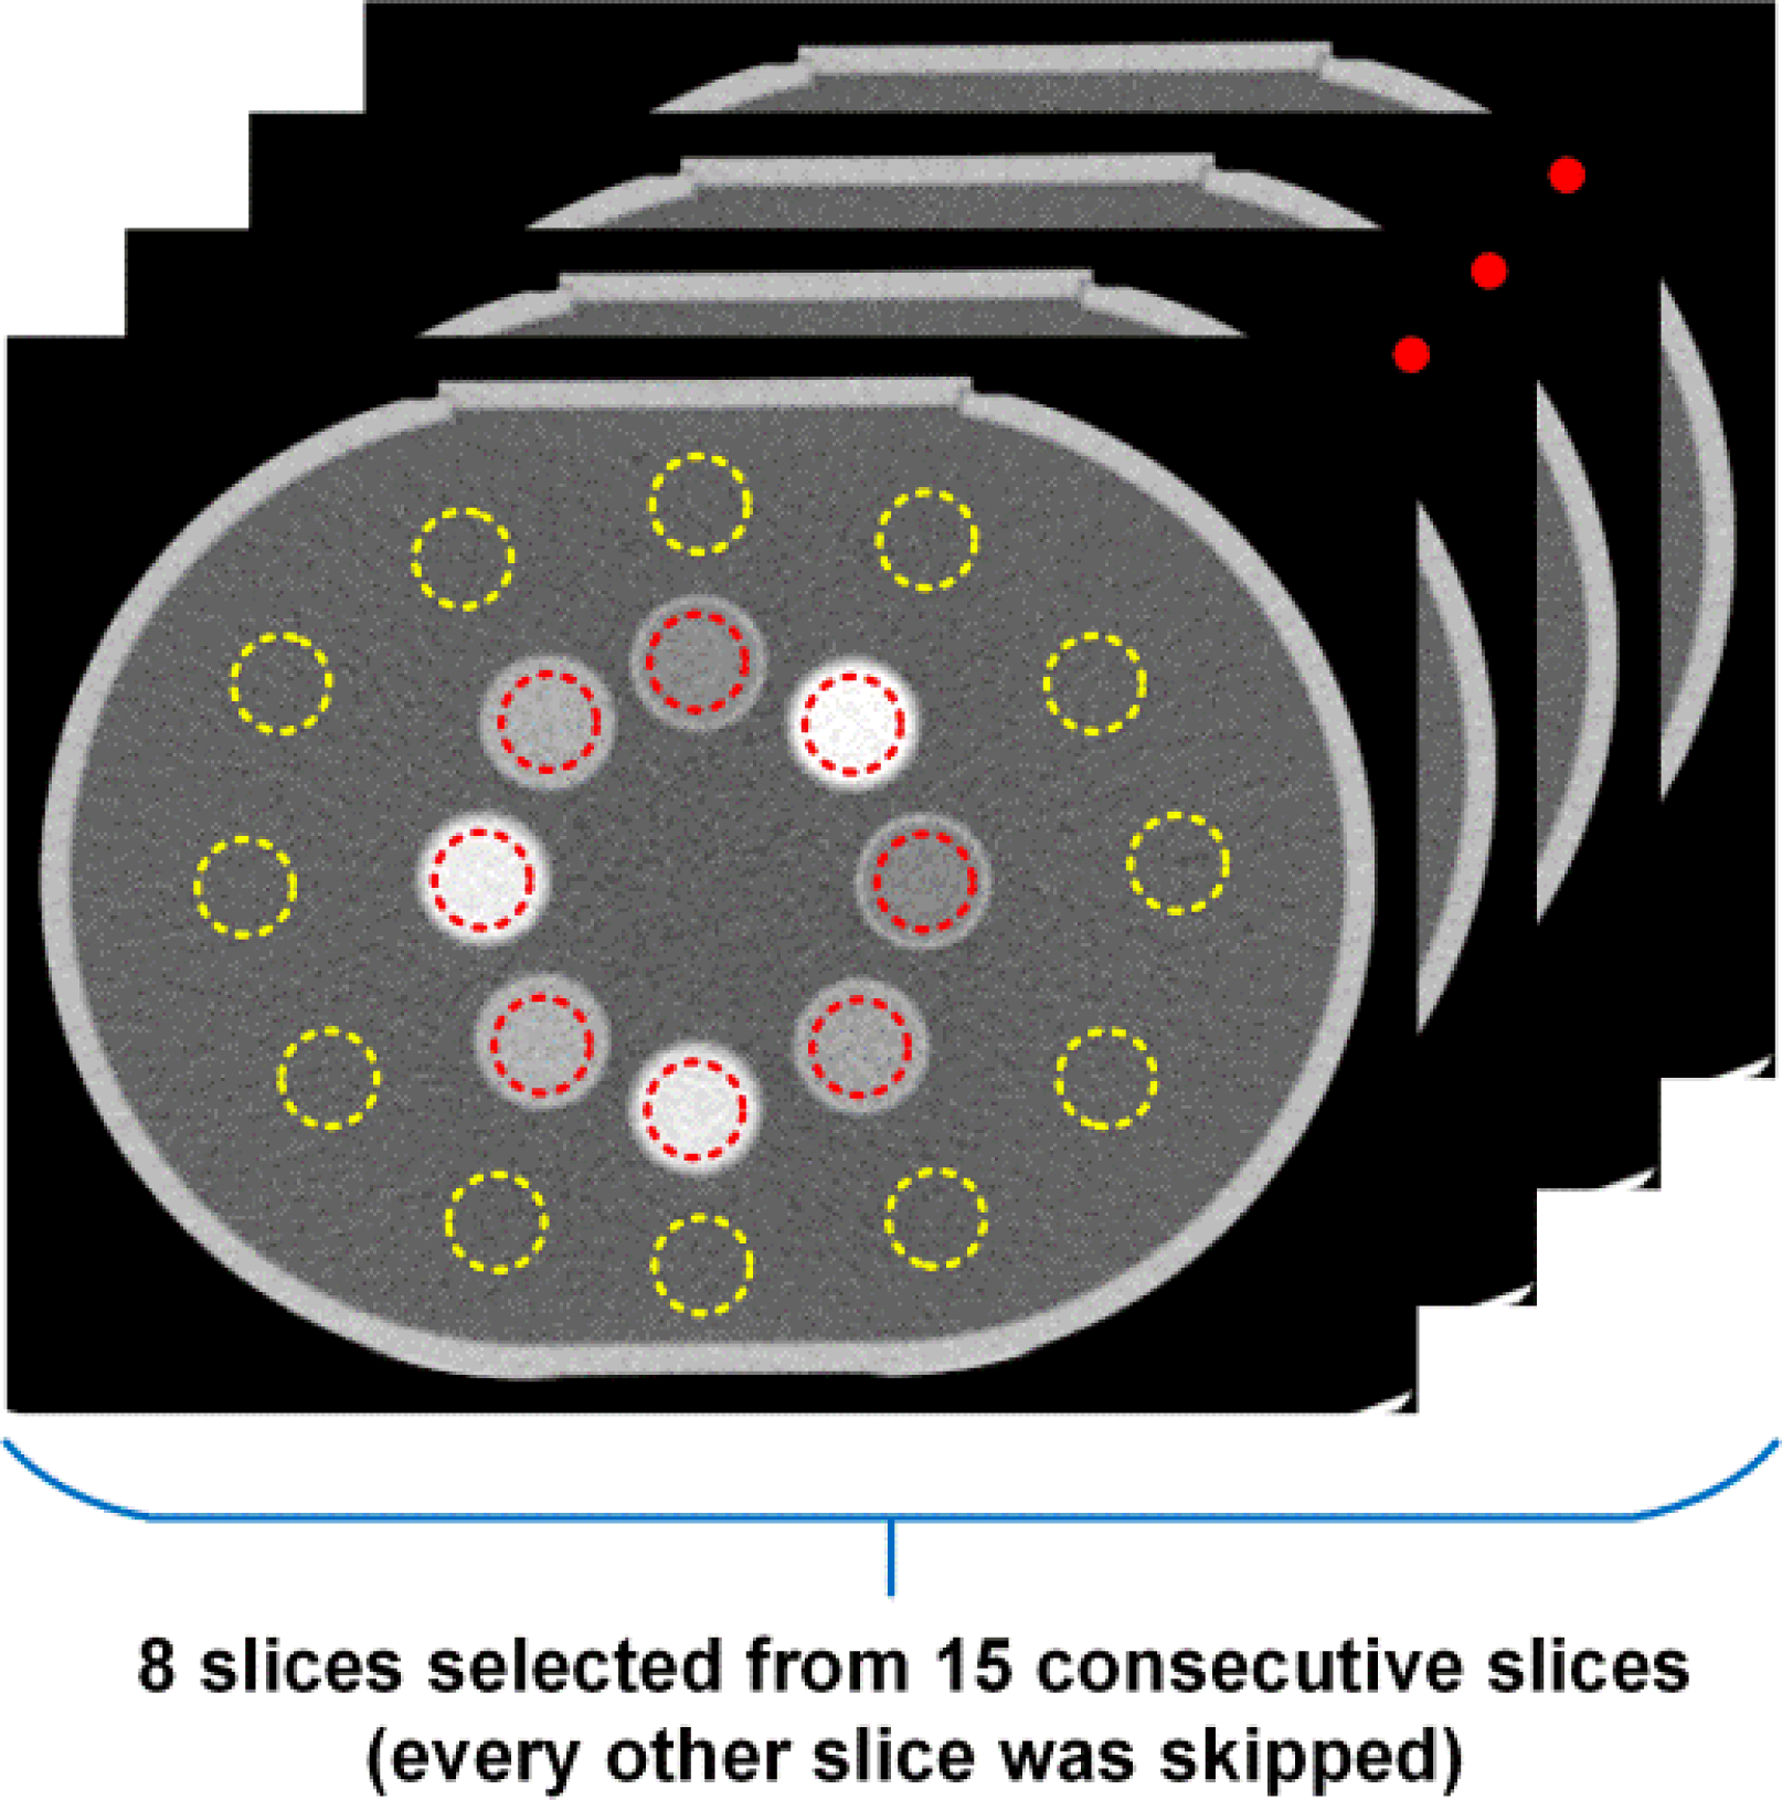
Selection of region of interests (ROIs) for evaluations of quantification accuracy and noise level.
On each selected slice, circular ROIs (indicated in red ROIs in Figure 3) without touching the boundary of contrast samples were drawn to measure the mean mass concentration values (unit: mg/mL), in total resulting in 8 ROIs for each sample, one on each selected slice. Each ROI had around 1000 pixels providing sufficient statistics for quantitative measurements. Since part of the samples were used in material decomposition calibration procedure, only those pre-determined for material decomposition test were reported for quantification analysis, in which the resultant mass concentration of each sample was determined as the average of all 8 mean values, each determined over the corresponding ROI. For each contrast sample, the standard deviation of mean values and the percentage error between measured mass concentration and nominal values, [(ρmeasured – ρnominal)/ρnominal × 100]%, were also reported.
Another 12 ROIs with identical size as to those placed on the samples were drawn in the uniform water region (indicated in yellow ROIs in Figure 3), resulting in totally 96 ROIs on 8 eight selected slices, for noise level measurements. Specifically, the noise level was calculated as the mean (± standard deviation) of the 96 standard deviations each calculated over one ROI. The evaluations of quantification accuracy and noise level were performed on all material-specific images across all material decomposition tasks and CT scanners.
3. Results
3.1. X-ray Beam Spectra in EID-MECT, EID-DECT, and PCD-CT
Figure 4 provides the x-ray beam spectra generated by the four triple-beam configurations in EID-MECT, namely 70/Au120/Sn120, 80/Au120/Sn120, 70/Au140/Sn140, and 80/Au140/Sn140 kV [13, 32]. Figure 5 provides the x-ray beam spectra generated by TB-DECT at Au120/Sn120 kV, DS-DECT at 80/Sn140 kV, PCD-CT at 80 kV with energy thresholds of 25, 35, 50, and 55 keV, and PCD-CT at 140 kV with energy thresholds of 25, 50, 75, and 90 keV, respectively [13, 32].
Figure 4.
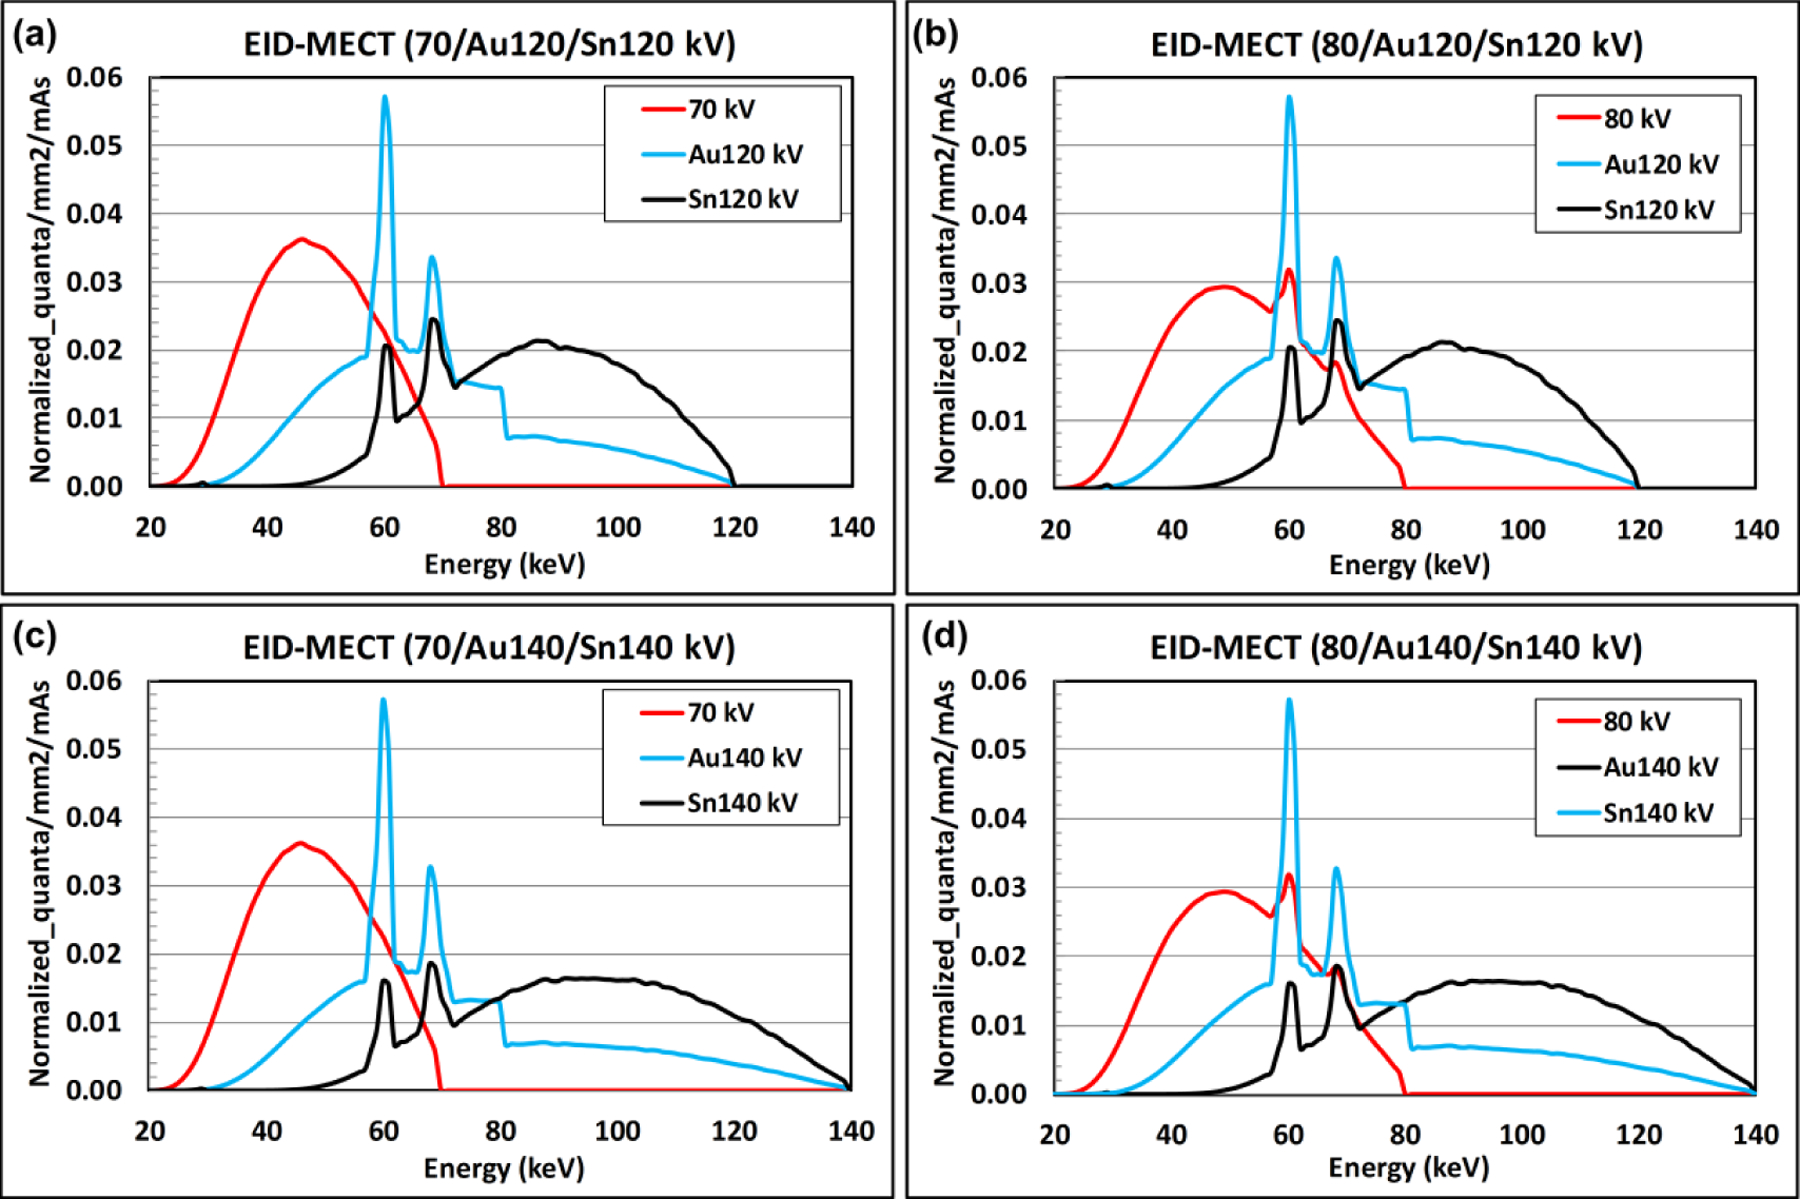
X-ray beam spectra generated by EID-MECT with four triple-beam configurations: (a) 70/Au120/Sn120, (b) 70/Au140/Sn140, (c) 80/Au120/Sn120, and (d) 80/Au140/Sn140 kV.
Figure 5.
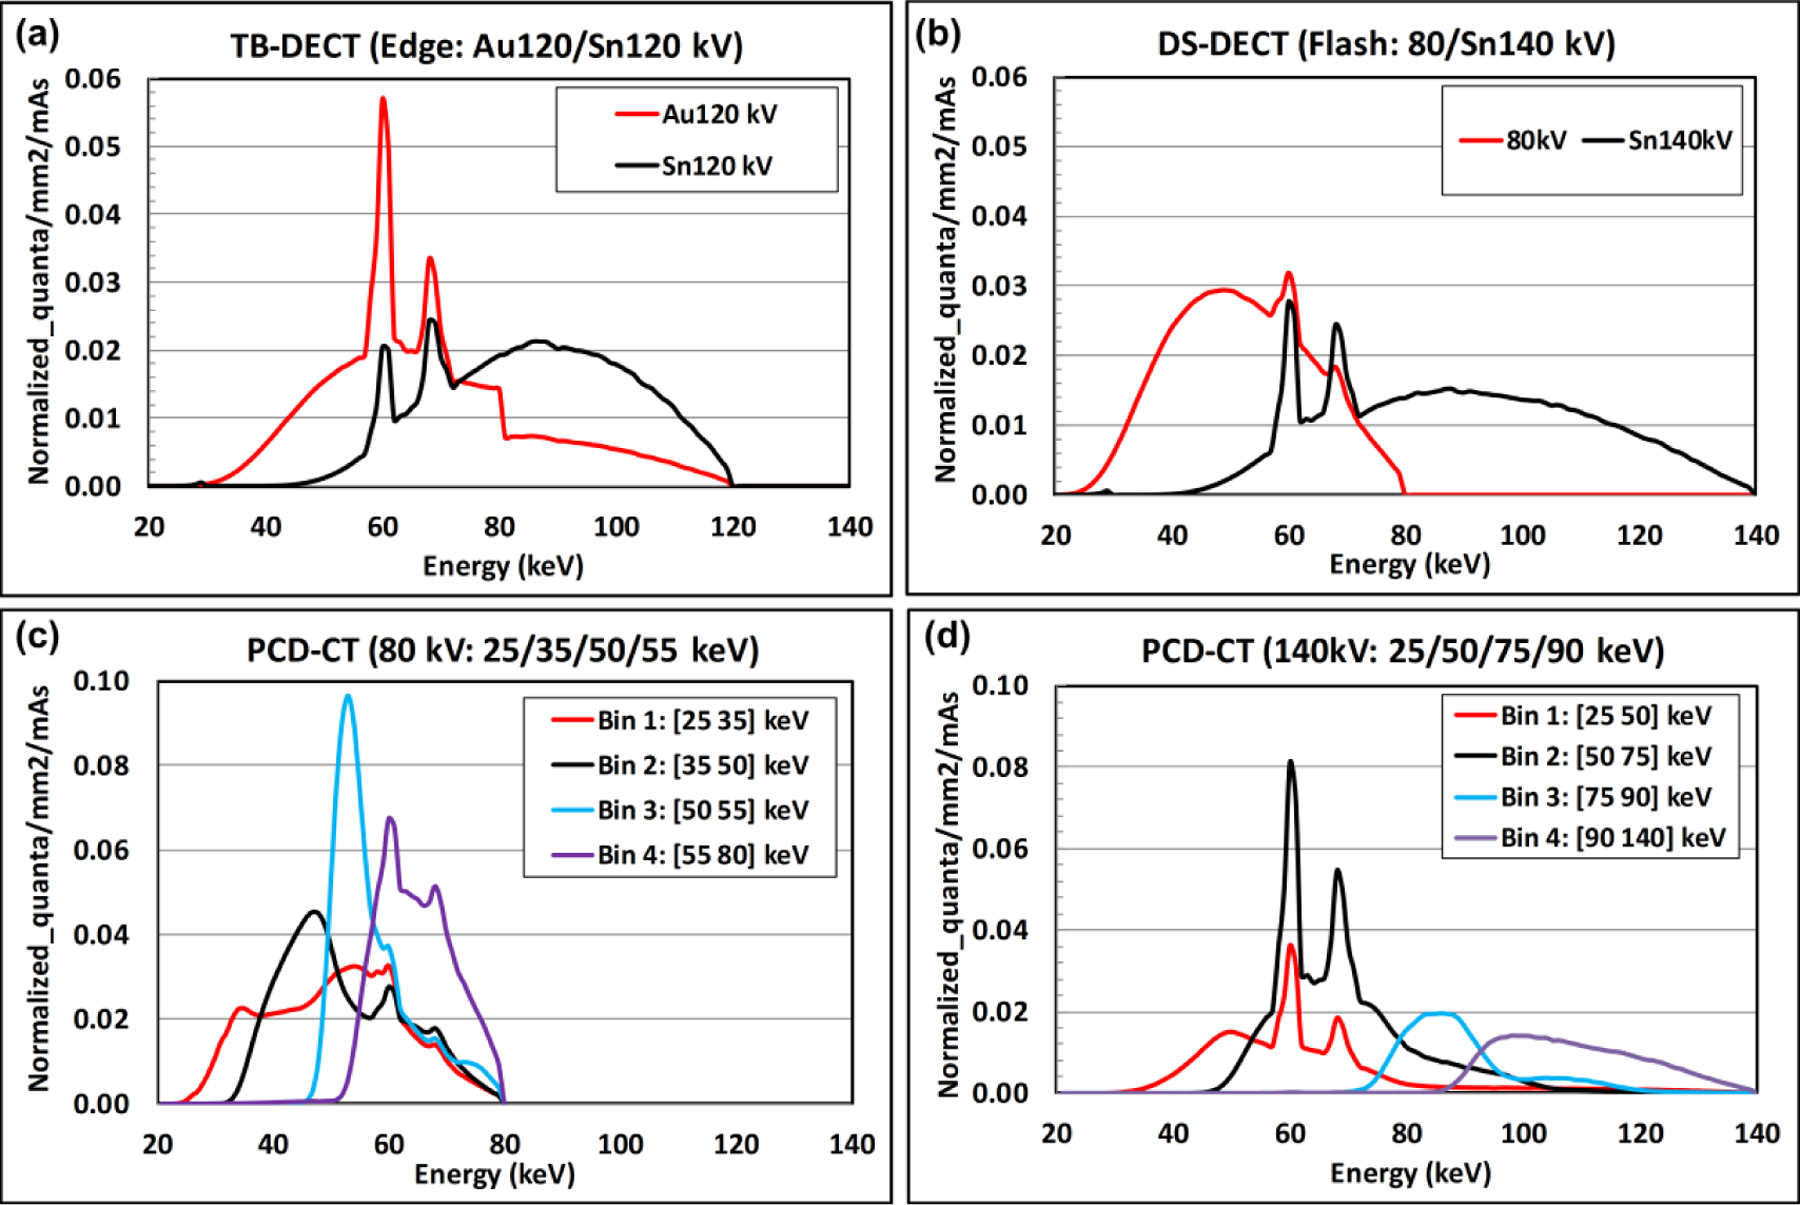
X-ray beam spectra generated by EID-DECT and PCD-CT: (a) TB-DECT at Au120/Sn120 kV, (b) DS-DECT at 80/Sn140 kV, (c) PCD-CT at 80 kV with 25/35/50/55 keV, and (d) PCD-CT at 140 kV with 25/50/75/90 keV.
3.2. Three-material Decomposition: Iodine, Gadolinium, and Water
Figure 6 compares the noise levels measured on iodine- and gadolinium-specific images after three-material decomposition among the four triple-beam configurations on the EID-MECT scanner. The lowest noise level in both iodine- and gadolinium-specific images was achieved with the triple-beam configuration of 70/Au120/Sn120 kV in this specific three-material decomposition task.
Figure 6.
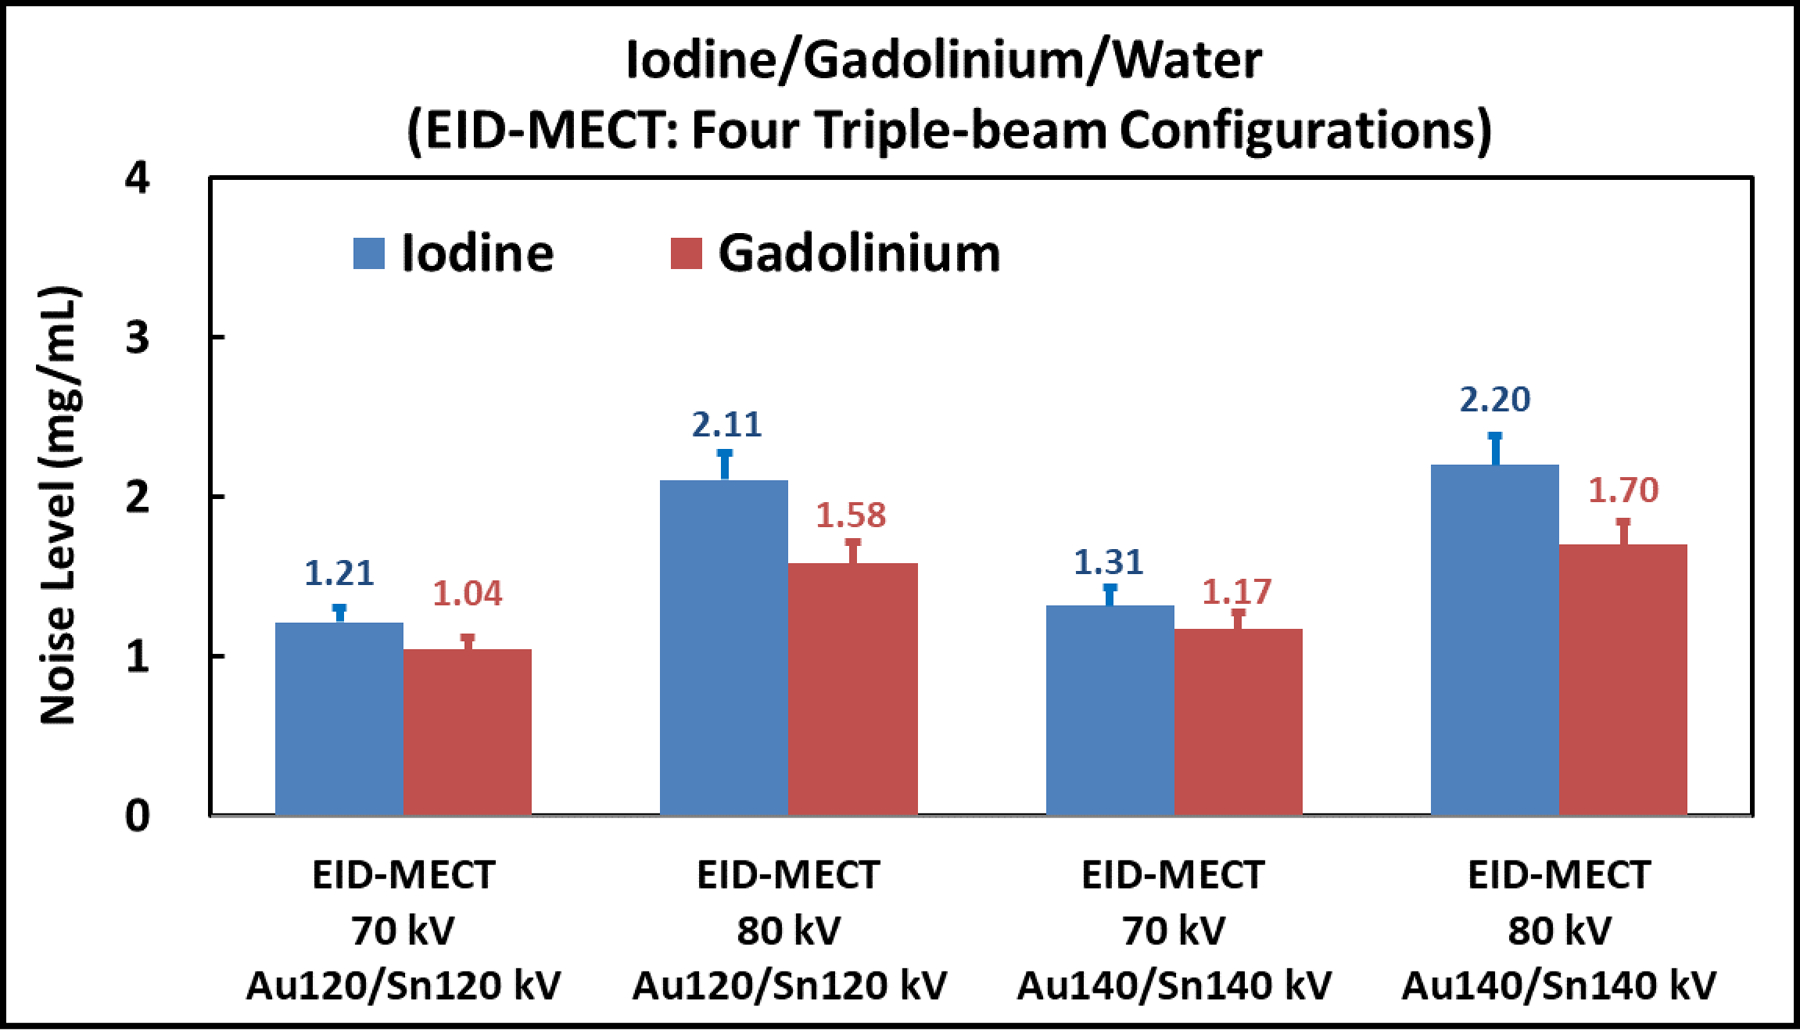
Noise comparison among the four triple-beam configurations on the EID-MECT scanner for the iodine/gadolinium/water decomposition task.
Figure 7 shows the iodine-specific, gadolinium-specific, and water images after three-material decomposition using TB-DECT at Au120/Sn120 kV (1st column), DS-DECT at 80/Sn140 kV (2nd column), EID-MECT with the optimal triple-beam configuration at 70/Au120/Sn120 kV (3rd column), and PCD-CT at 80 kV with four energy thresholds of 25, 35, 50, and 55 keV (4th column). One can observe that the noise levels on all three basis material images acquired from EID-MECT with the optimal triple-beam configuration are lower than those from TB-DECT and DS-DECT, and slightly higher than those from PCD-CT. The noise levels on iodine- and gadolinium-specific images across all four CT systems are summarized in Figure 8.
Figure 7.
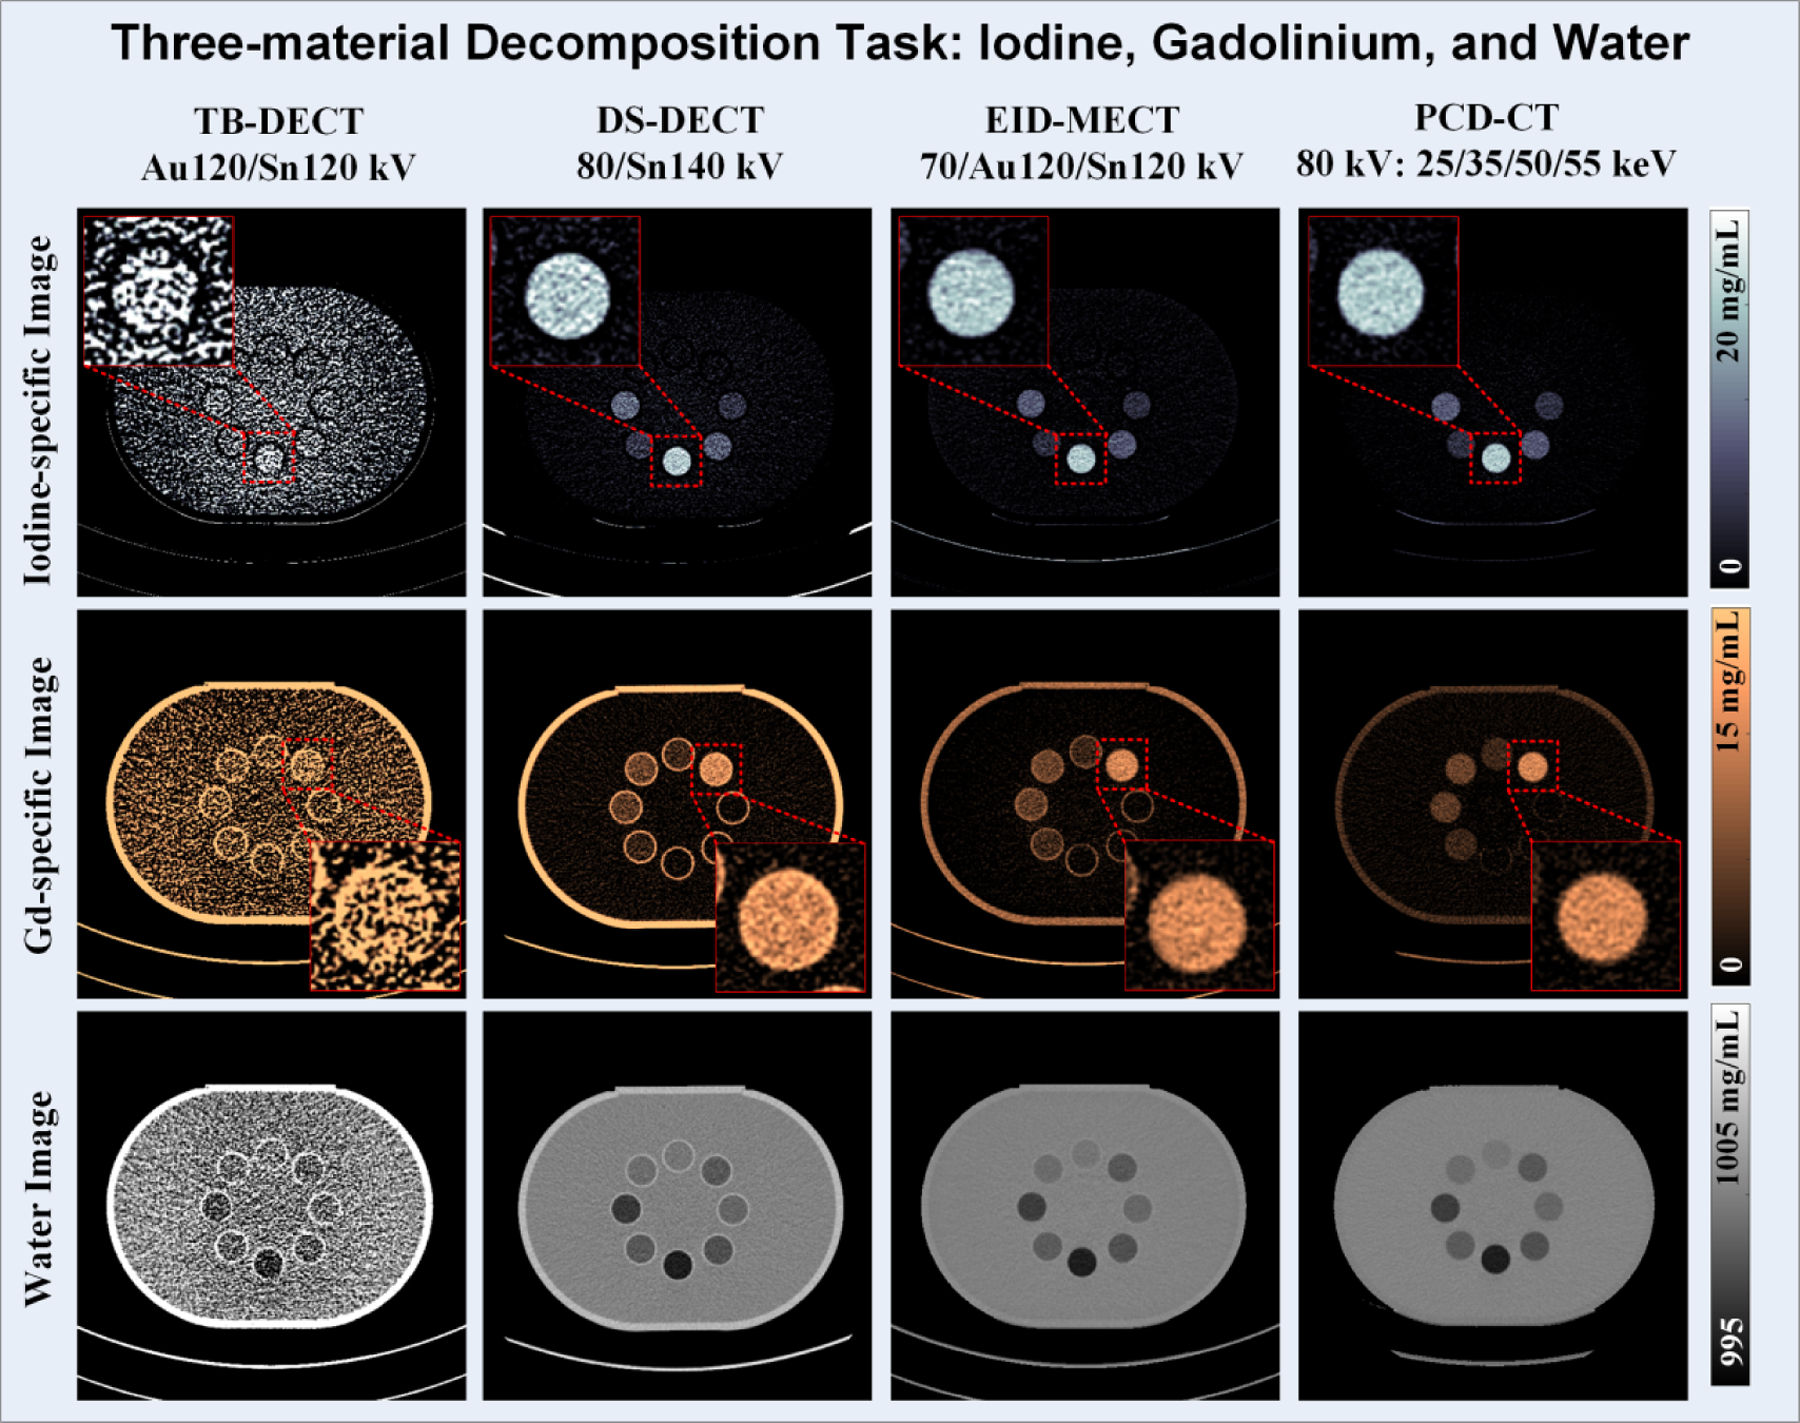
Iodine-specific (1st row), gadolinium-specific (2nd row), and water (3rd row) images acquired from TB-DECT at Au120/Sn120 kV (1st column), DS-DECT at 80/Sn140 kV (2nd column), EID-MECT at 70/Au120/Sn120 kV (3rd column), and PCD-CT at 80 kV with 25, 35, 50, and 55 keV (4th column).
Figure 8.
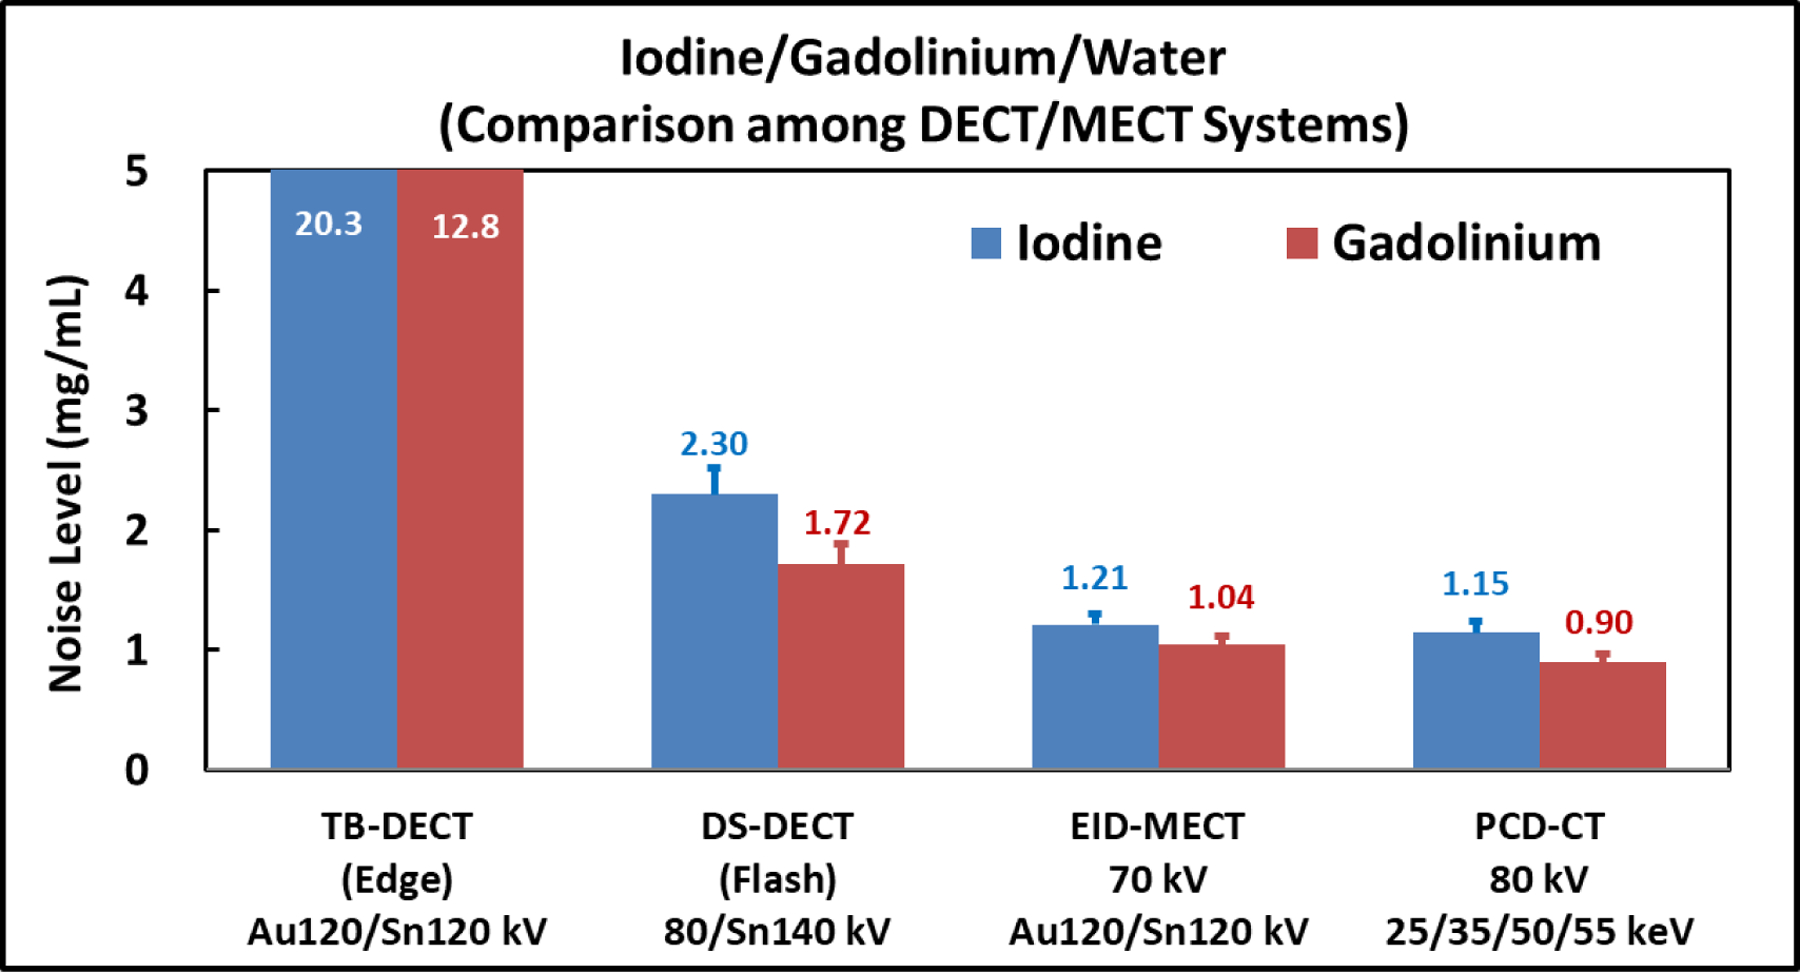
Noise comparison on iodine- and gadolinium-specific images after three-material decomposition for the four CT systems.
Table 3 summarizes the mean concentration values and standard deviations measured from all iodine and gadolinium samples (the percent error between mean measured and nominal concentration values is reported in parenthesis). All CT systems except TB-DECT show low quantification bias in the measurements against the corresponding nominal values.
Table 3.
Iodine (I) and gadolinium (Gd) mass concentration measurements (mean ± standard deviation; units: mg/mL) for each sample on iodine- and gadolinium-specific images acquired from four CT systems.
| Nominal basis material concentration (mg/mL) | I (7.5) | Gd (5.0) | Mixture 1 I (4.0) + Gd (2.8) |
Mixture 2 I (7.5) + Gd (5.0) |
|---|---|---|---|---|
| TB-DECT | 7.2±0.5 (−4.0%) | 4.4±0.4 (−12.0%) | 3.3±0.5 (I: −17.5%) | 5.9±0.6 (I: 21.3%) |
| (Au120/Sn120 kV) | 3.2±0.6 (Gd: +14.3%) | 5.4±0.6 (Gd: 8.0%) | ||
| DS-DECT | 7.8±0.1 (4.0%) | 5.1±0.1 (2.0%) | 4.6±0.1 (I: 15.0%) | 8.7±0.3 (I: 16.0%) |
| (80/Sn140 kV) | 2.5±0.1 (Gd: −10.7%) | 4.2±0.2 (Gd: −16.0%) | ||
| EID-MECT | 7.1±0.3 (−5.3%) | 5.0±0.2 (0.0%) | 3.6±0.4 (I: −10.0%) | 7.2±0.5 (I: −4.0%) |
| (70/Au120/Sn120 kV) | 3.0±0.3 (Gd: 7.1%) | 4.7±0.3 (Gd: −6.0%) | ||
| PCD-CT | 7.4±0.1 (−1.3%) | 4.9±0.2 (−2.0%) | 4.2±0.1 (I: 5.0%) | 7.7±0.1 (I: 2.7%) |
| (80 kV: 25/35/50/55 keV) | 2.7±0.1 (Gd: −3.6%) | 4.2±0.1 (Gd: −16.0%) |
3.3. Three-material Decomposition: Iodine, Bismuth, and Water
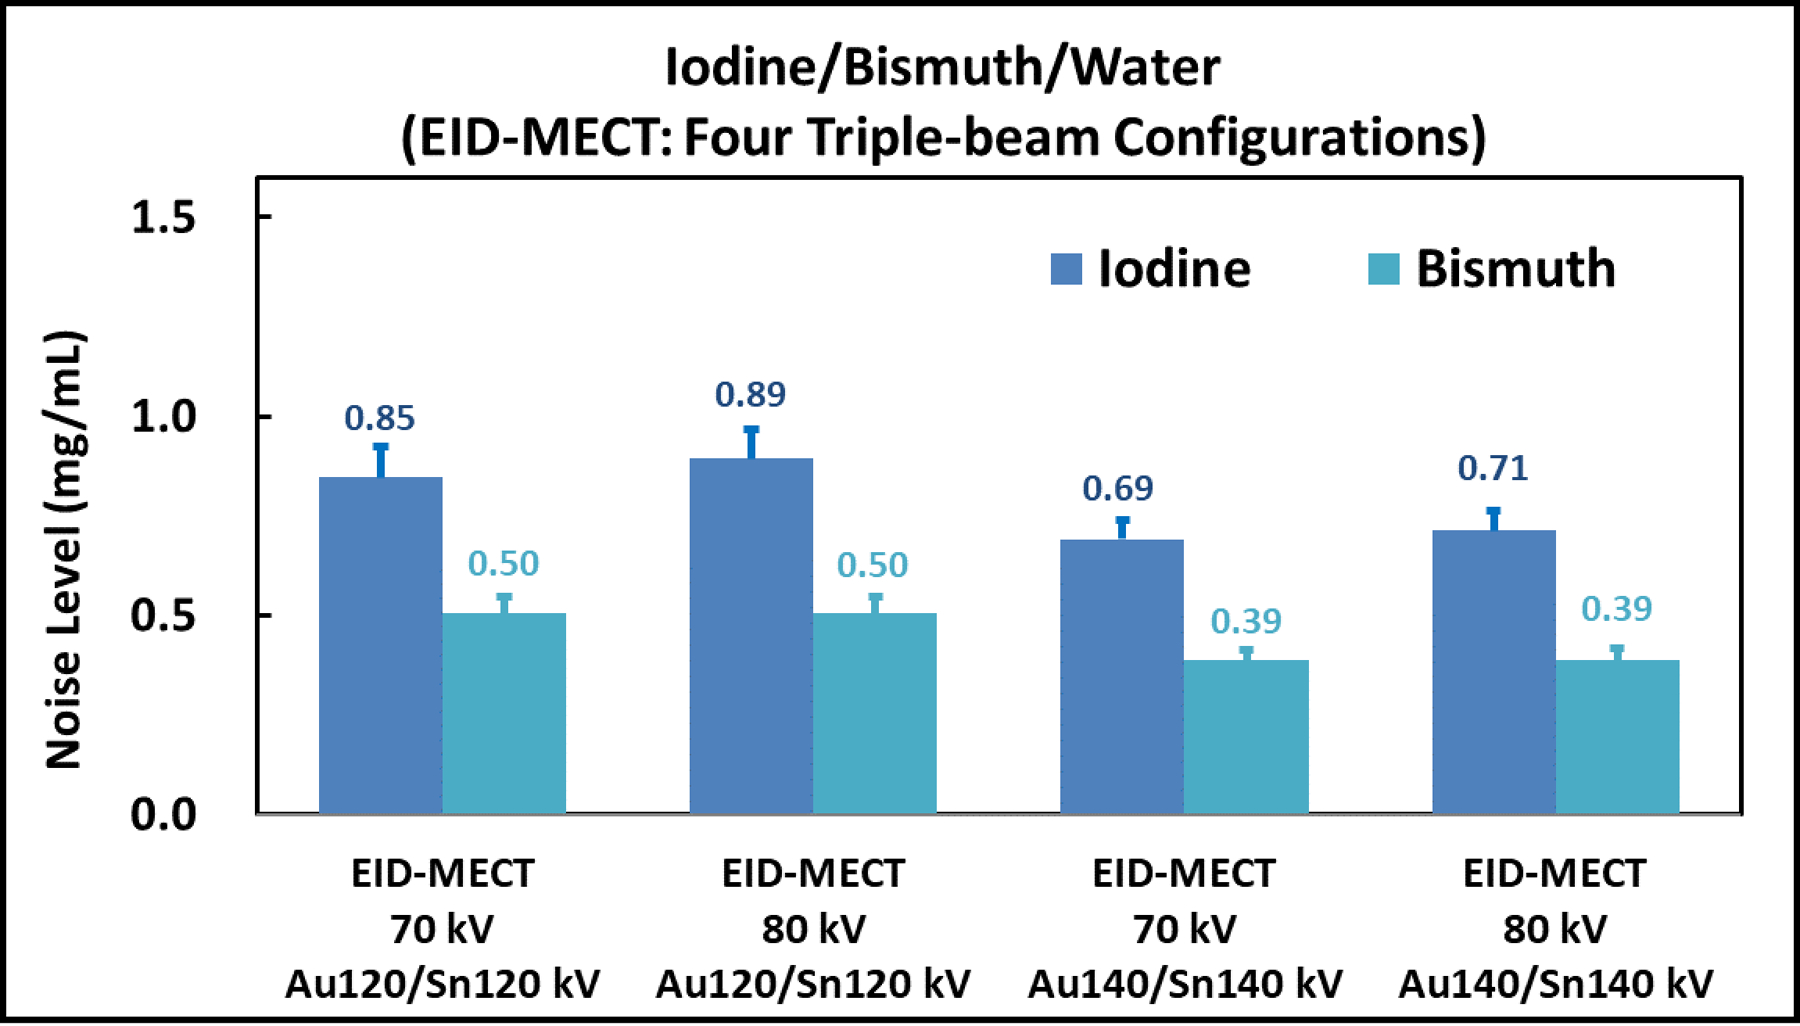
Figure 9 compares the noise level measured on iodine- and bismuth-specific images after three-material decomposition among the four triple-beam configurations on the EID-MECT scanner. The results show that the triple-beam configuration of 70/Au140/Sn140 kV provides the lowest noise levels on both iodine- and bismuth-specific images in this three-material decomposition task.
Figure 9.
Noise comparison among the four triple-beam configurations on the EID-MECT scanner for the iodine/bismuth/water decomposition task.
Figure 10 shows all three material-specific images after three-material decomposition using TB-DECT at Au120/Sn120 kV (1st column), DS-DECT at 80/Sn140 kV (2nd column), EID-MECT with the optimal triple-beam configuration at 70/Au140/Sn140 kV (3rd column), and PCD-CT at 140 kV with four energy thresholds of 25, 50, 75 and 90 keV (4th column). One can observe that the noise level on all material-specific images acquired from EID-MECT with the optimal triple-beam configuration is comparable to DS-DECT, and better than TB-DECT and PCD-CT. The noise levels measured on iodine- and bismuth-specific images across four CT systems are summarized in Figure 11.
Figure 10.
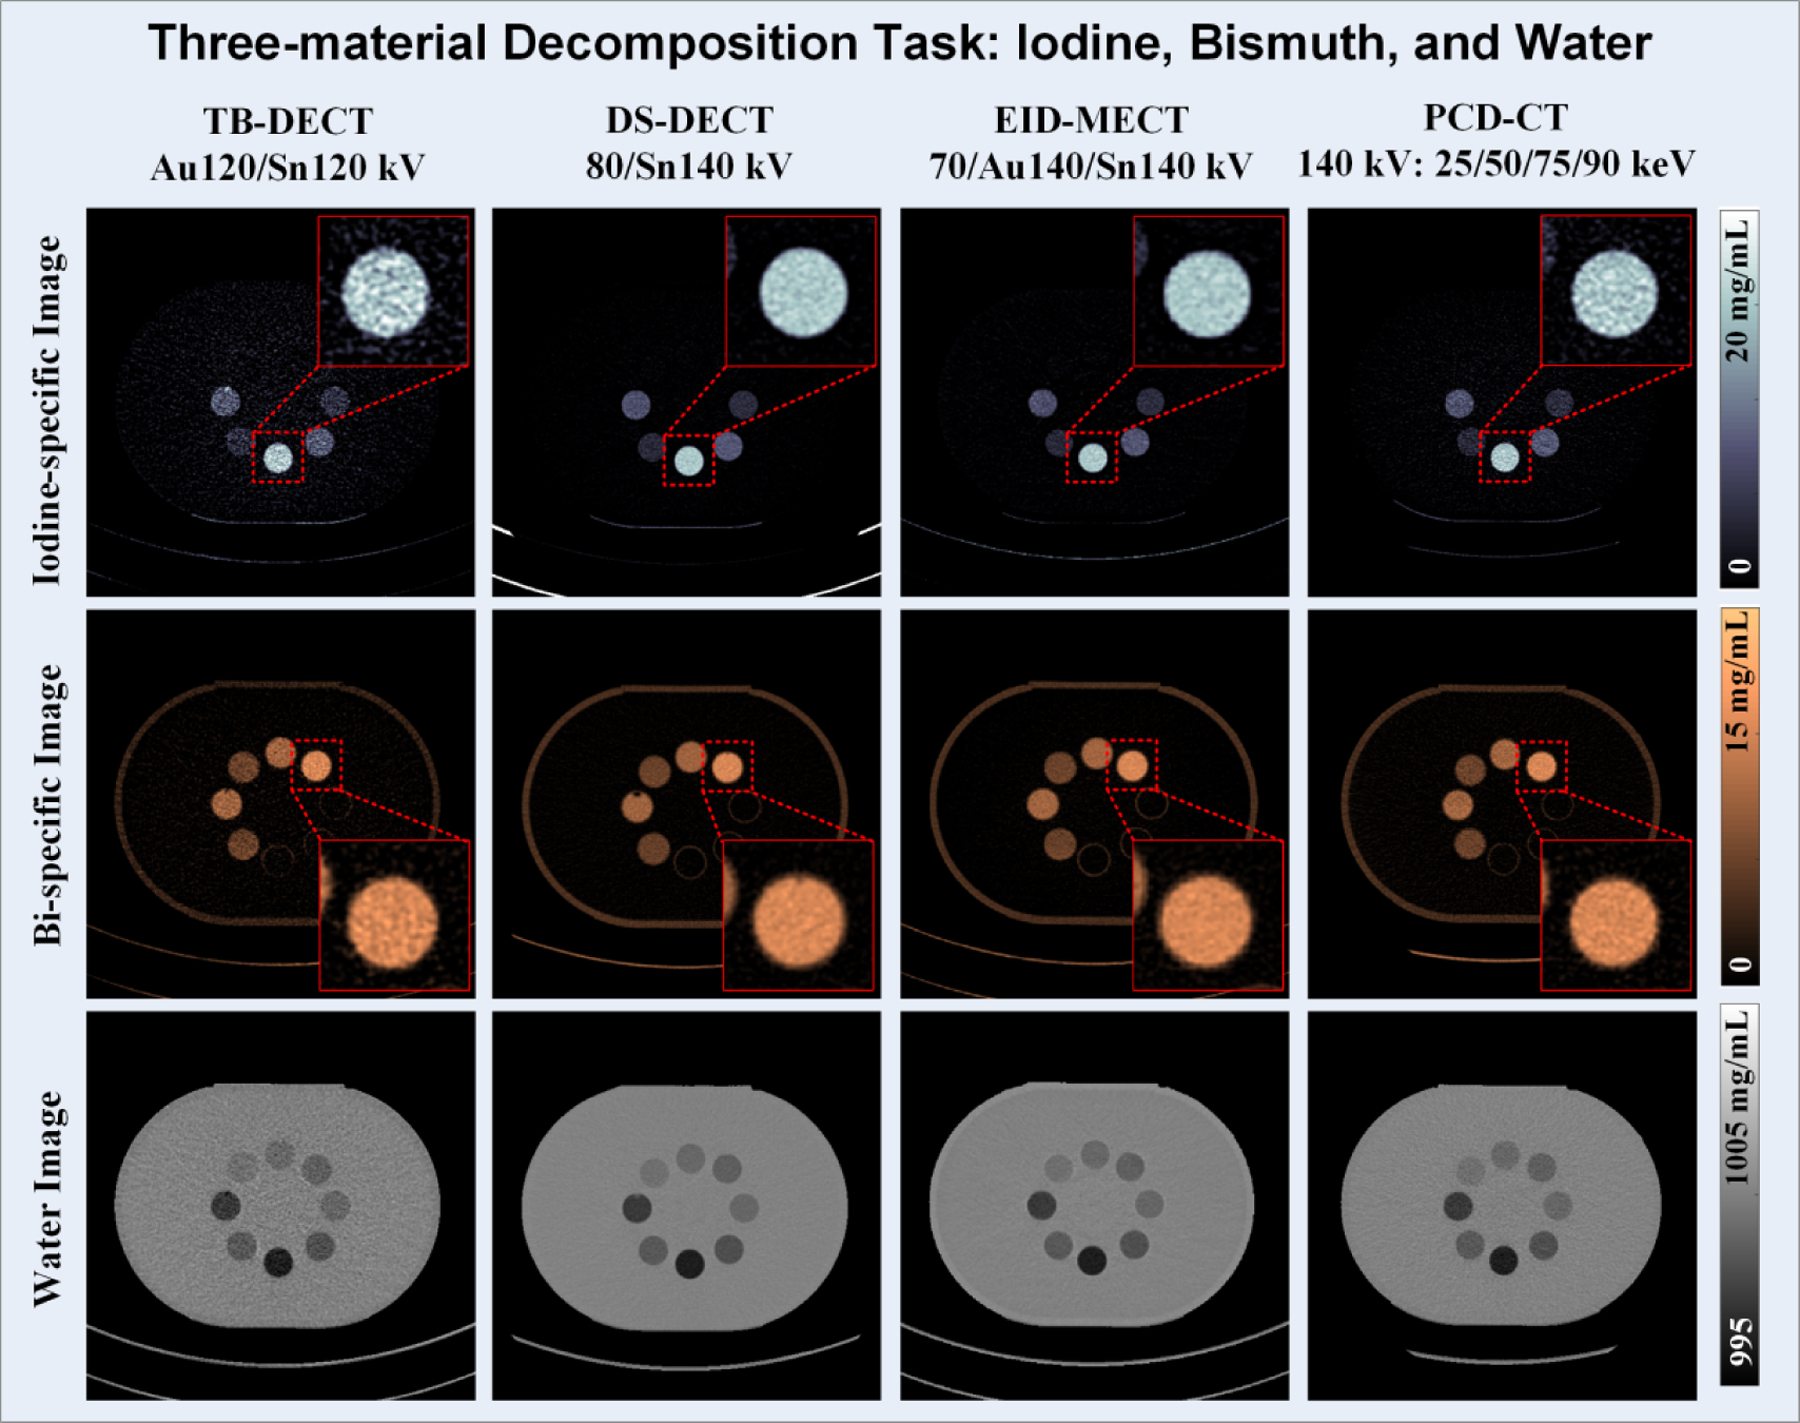
Iodine-specific (1st row), bismuth-specific (2nd row), and water (3rd row) images acquired from TB-DECT at Au120/Sn120 kV (1st column), DS-DECT at 80/Sn140 kV (2nd column), EID-MECT at 70/Au140/Sn140 kV (3rd column), and PCD-CT at 140 kV with 25, 50, 75, and 90 keV (4th column).
Figure 11.
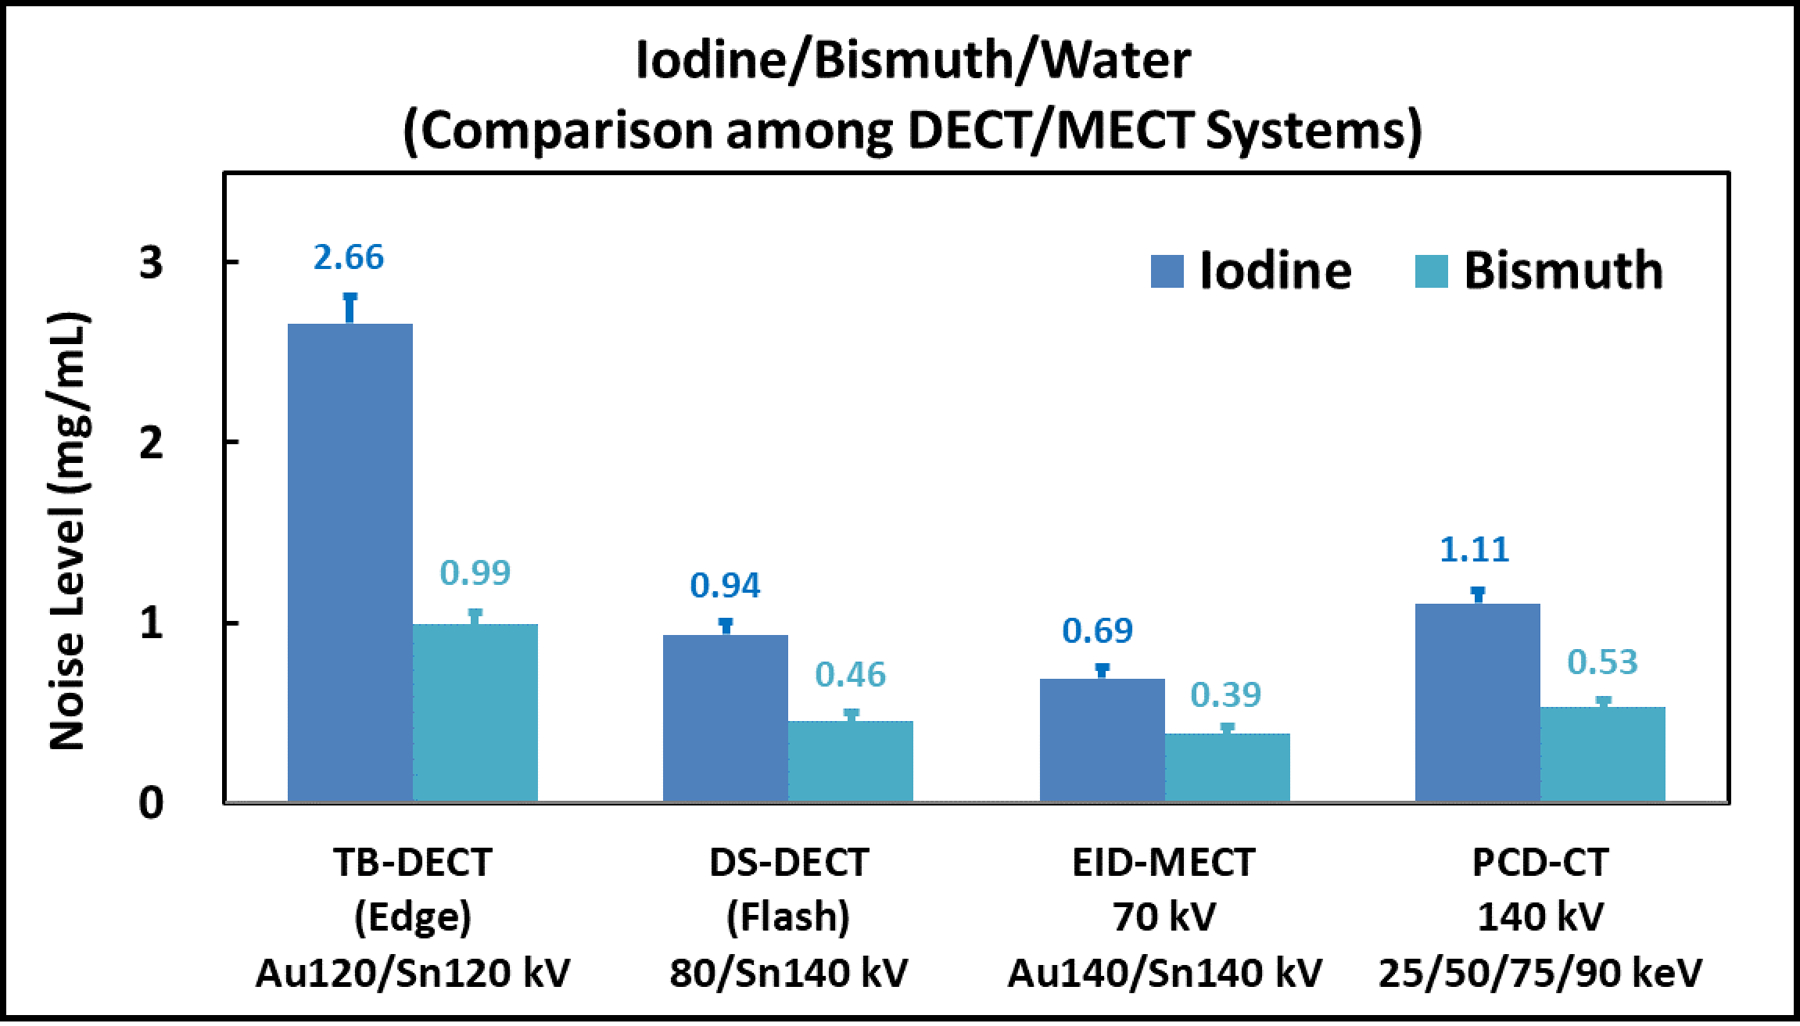
Noise comparison on iodine- and bismuth-specific images after three-material decomposition for all four CT systems.
Table 4 summarizes the mean concentration values and standard deviations measured on all iodine and bismuth samples (the percent error between mean measured and nominal concentration values is reported in parenthesis). All CT systems show low quantification bias in the measurements against the corresponding nominal values.
Table 4.
Iodine (I) and bismuth (Bi) mass concentration measurements (mean ± standard deviation; units: mg/mL) for each sample on iodine- and bismuth-specific images acquired with four CT systems.
| Nominal basis material concentration (mg/mL) | I (7.5) | Bi (7.6) | Mixture 1 I (4.0) + Bi (5.0) |
Mixture 2 I (7.5) + Bi (7.6) |
|---|---|---|---|---|
| TB-DECT | 7.3±0.2 (−2.7%) | 7.7±0.2 (1.3%) | 3.6±0.2 (I: −10.0%) | 7.2±0.3 (I: −4.0%) |
| (Au120/Sn120 kV) | 4.8±0.2 (Bi: −4.0%) | 7.4±0.2 (Bi: −2.6%) | ||
| DS-DECT | 7.5±0.1 (0.0%) | 7.5±0.0 (−1.3%) | 3.8±0.1 (I: −5.0%) | 7.0±0.1 (I: −6.7%) |
| (80/Sn140 kV) | 4.8±0.0 (Bi: −4.0%) | 7.5±0.0 (Bi: −1.3%) | ||
| EID-MECT | 7.2±0.2 (−4.0%) | 7.6±0.1 (0.0%) | 3.4±0.1 (I: −15.0%) | 6.8±0.1 (I: −9.3%) |
| (70/Au140/Sn140 kV) | 4.9±0.0 (Bi: −2.0%) | 7.6±0.1 (Bi: 0.0%) | ||
| PCD-CT | 7.6±0.1 (1.3%) | 7.6±0.1 (0.0%) | 3.6±0.1 (I: −10.0%) | 7.2±0.1 (I: −4.0%) |
| (140 kV: 25/50/75/90 keV) | 4.9±0.0 (Bi: −2.0%) | 7.4±0.1 (Bi: −2.6%) |
3.4. Four-material Decomposition: Iodine, Gadolinium, Bismuth, and Water
Figure 12 compares the noise level measured on all three contrast-material-specific images after four-material decomposition among the four triple-beam configurations on the EID-MECT scanner. It can be seen that the triple-beam configuration of 70/Au120/Sn120 kV provides the best noise performance in this four-material decomposition task.
Figure 12.
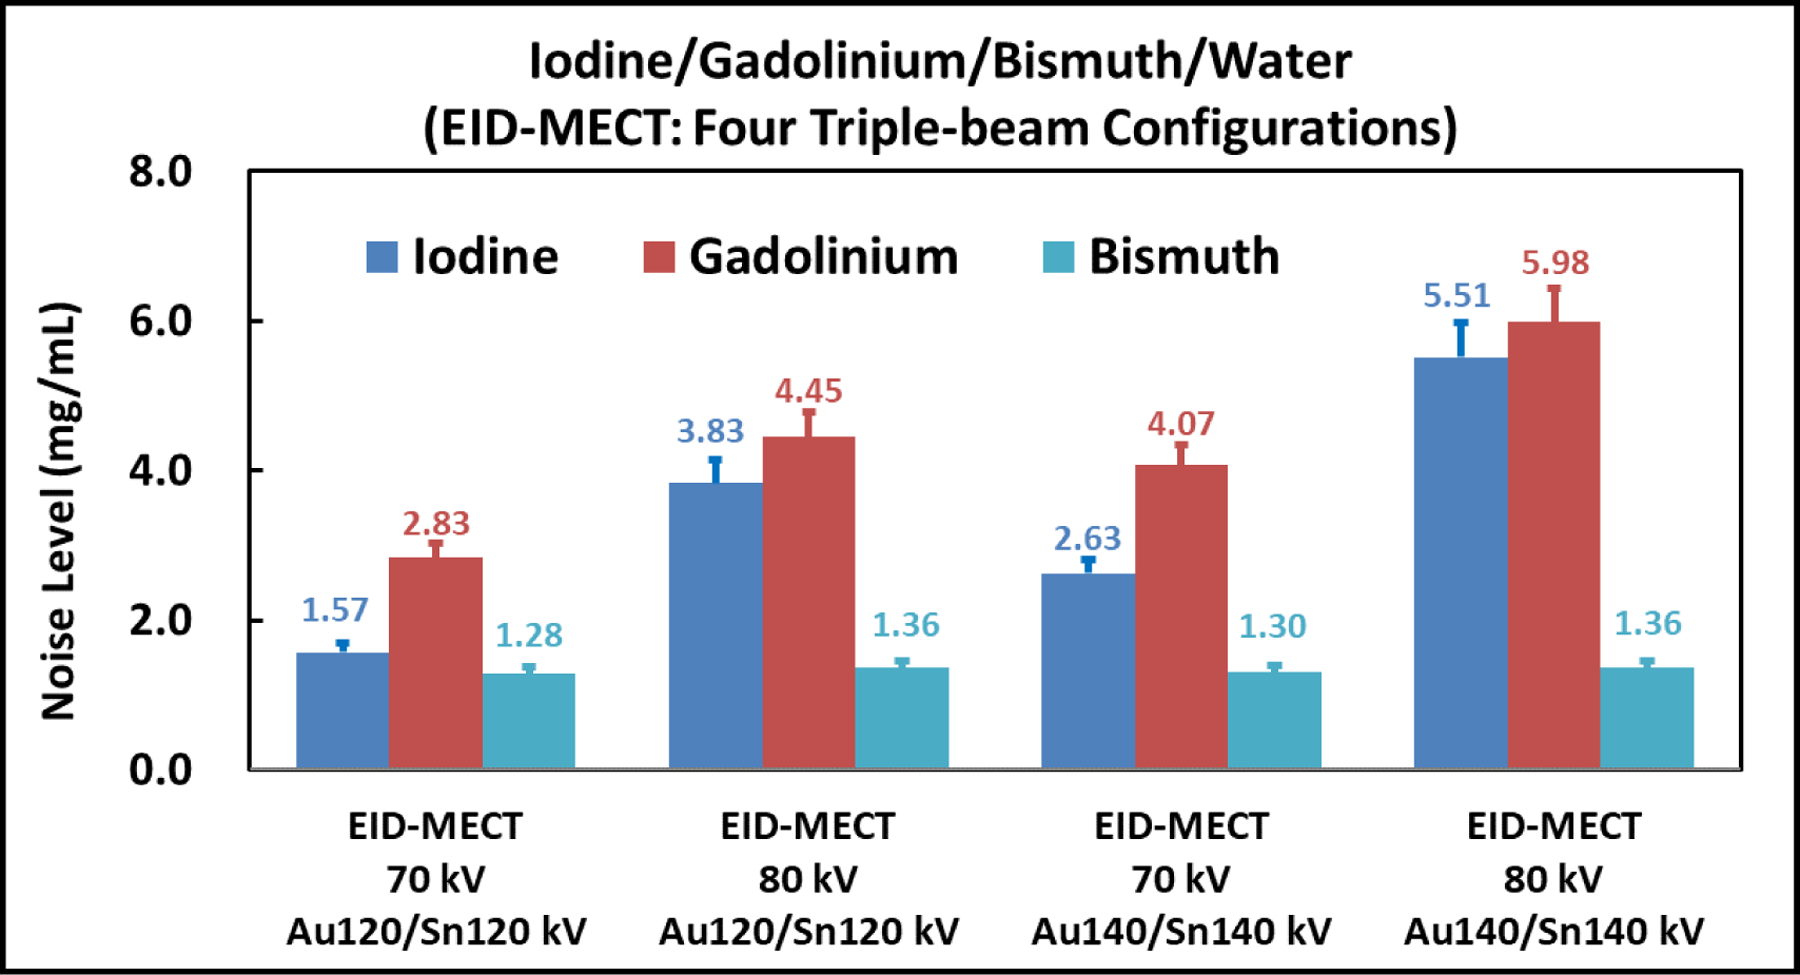
Noise comparison among the four triple-beam configurations on the EID-MECT scanner for the iodine/gadolinium/bismuth/water decomposition task.
Figure 13 shows all material-specific images after four-material decomposition using EID-MECT with the optimal triple-beam configuration at 70/Au120/Sn120 kV (1st row) and PCD-CT at 140 kV with four energy thresholds of 25, 50, 75 and 90 keV (2nd row). In comparison with PCD-CT, the noise levels on iodine- and gadolinium-specific images are much lower, whereas bismuth-specific image appears to be slightly noisier. The noise levels measured on each material-specific image for the two MECT systems are summarized in Figure 14.
Figure 13.
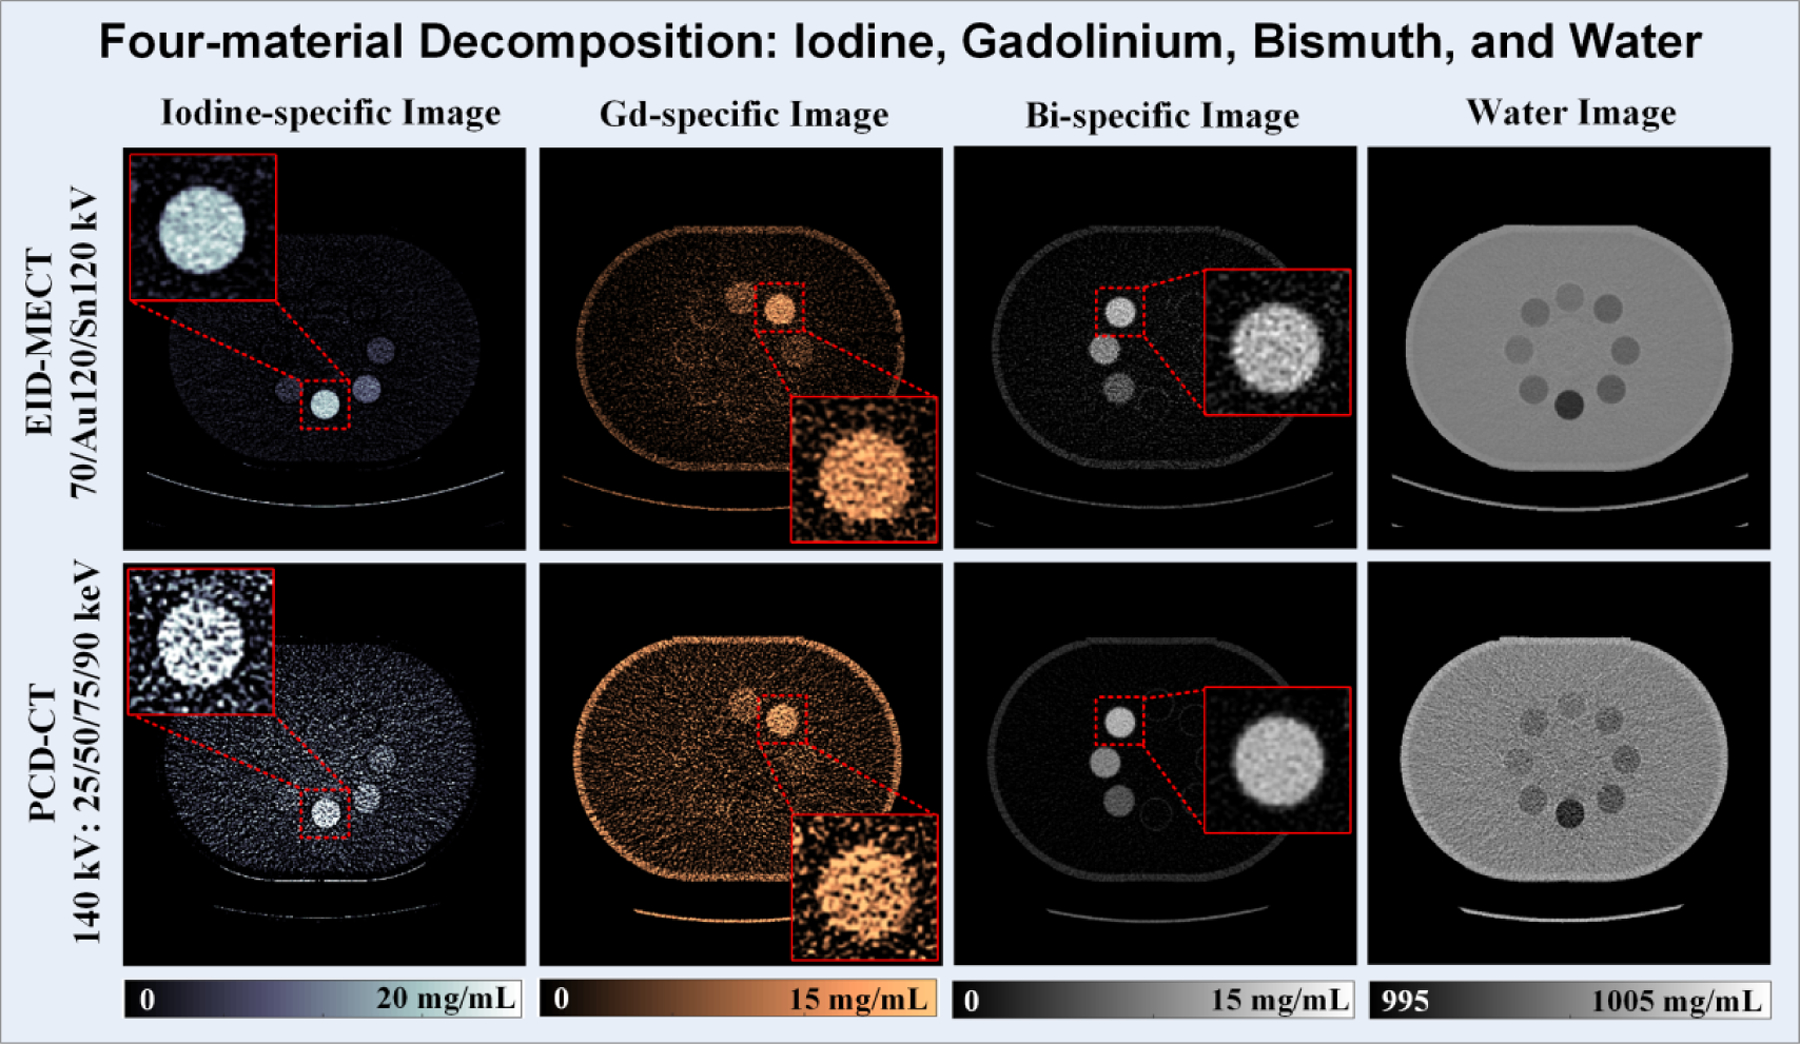
Iodine-specific (1st column), gadolinium-specific (2nd column), bismuth-specific (3rd column), and water (4th column) images acquired from EID-MECT at 70/Au120/Sn120 kV (1st row) and PCD-CT at 140 kV with 25, 50, 75, and 90 keV (2nd row).
Figure 14.
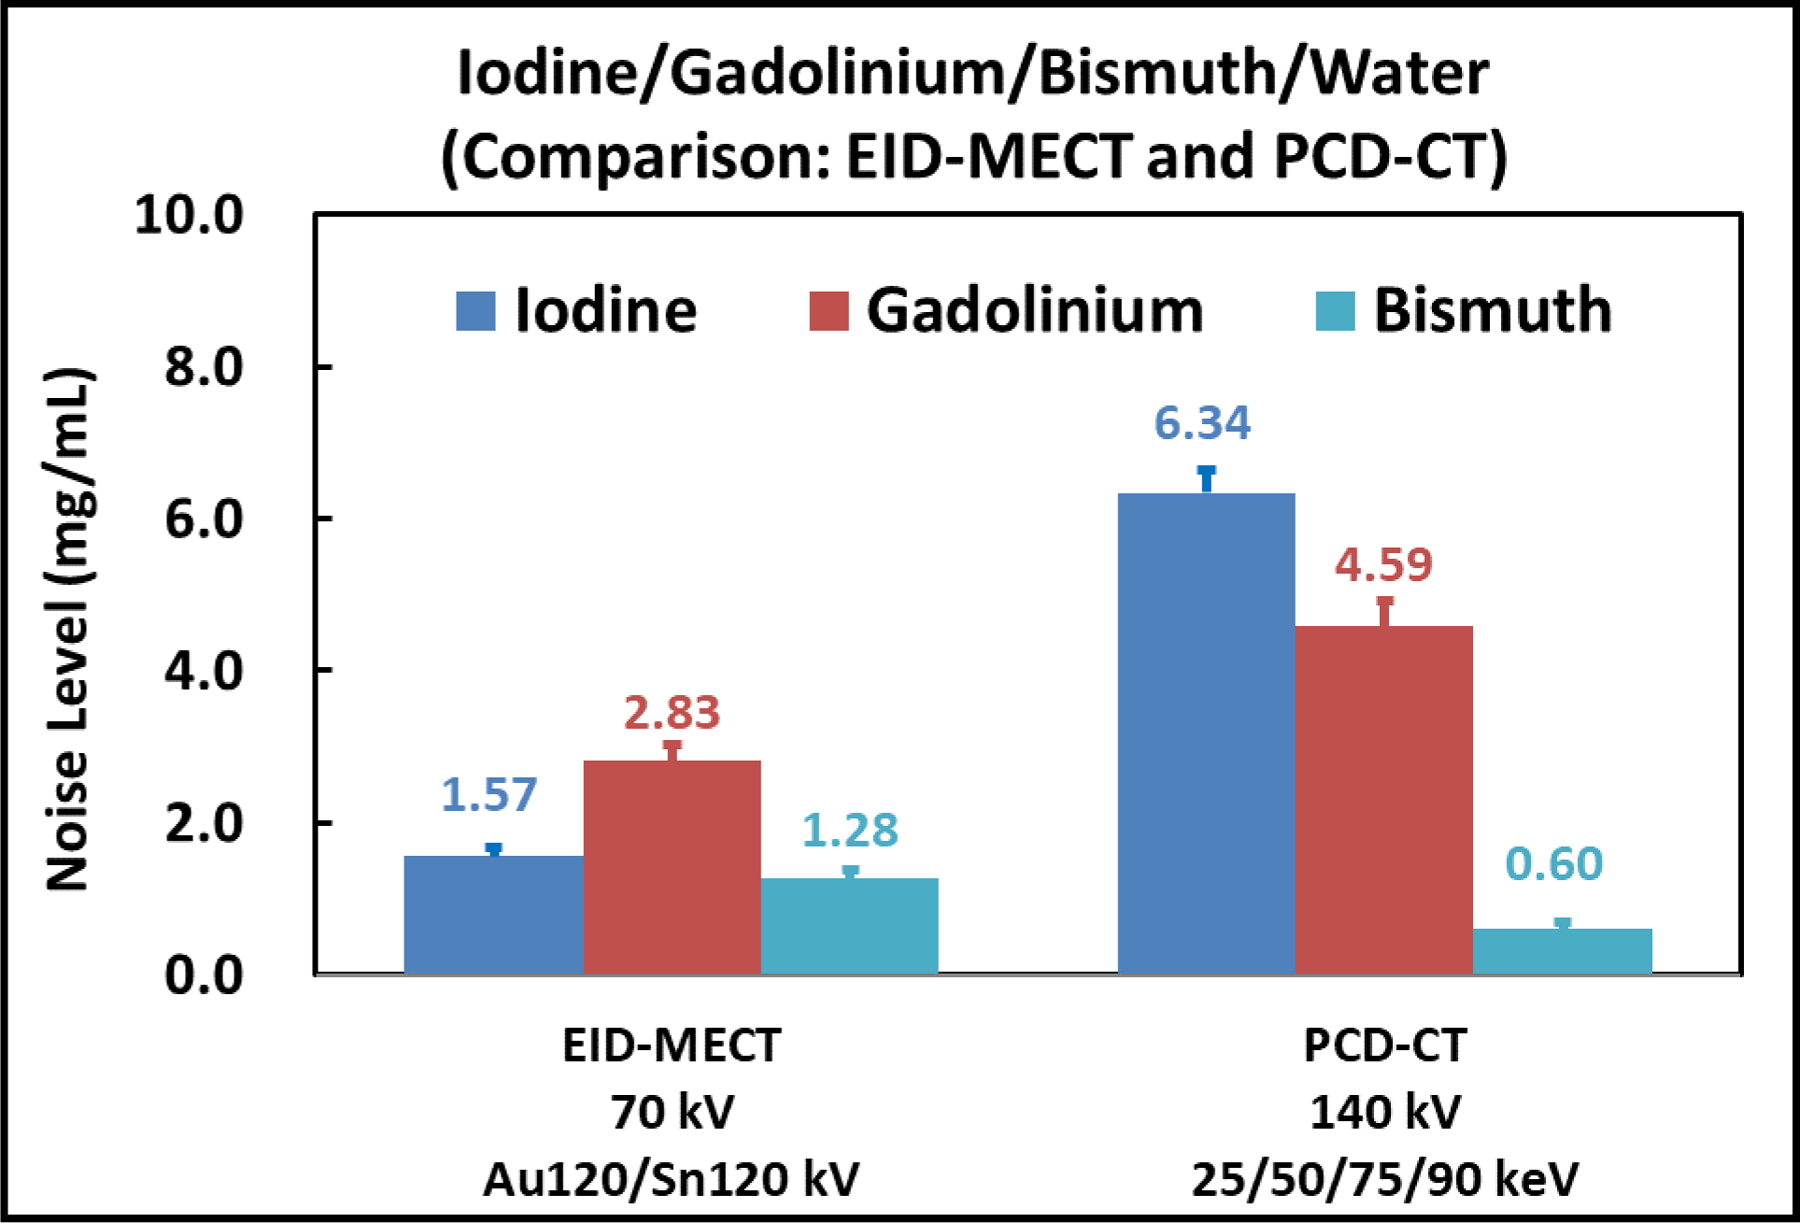
Noise comparison on iodine-, gadolinium-, and bismuth-specific images after four-material decomposition for both MECT systems.
Table 5 summarizes the mean concentration values and standard deviations measured from all iodine, gadolinium, and bismuth samples (the percent error between mean measured and nominal concentration values is reported in parenthesis). Compared to PCD-CT, EID-MECT shows lower quantification bias in the measurements against the corresponding nominal values.
Table 5.
Iodine (I), gadolinium (Gd), and bismuth (Gd) mass concentration measurements (mean ± standard deviation; units: mg/mL) for each sample on iodine-, gadolinium-, and bismuth-specific images acquired with the two MECT systems.
| Nominal basis material concentration (mg/mL) | I (7.5) | Gd (5.0) | Bi (7.6) | Mixture 1 I (4.0) + Gd (2.8) |
Mixture 2 I (4.0) + Bi (5.0) |
|---|---|---|---|---|---|
| EID-MECT | 7.4±0.2 (−1.3%) | 4.5±0.3 (−10.0%) | 7.6±0.2 (0.0%) | 3.9±0.2 (I: −2.5%) | 3.3±0.4 (I: −17.5%) |
| (70/Au120/Sn120 kV) | 3.0±0.3 (Gd: 7.1%) | 5.0±0.3 (Bi: 0.0%) | |||
| PCD-CT | 8.3±0.3 (10.7%) | 4.8±0.3 (−4.0%) | 7.4±0.1 (−2.6%) | 5.4±0.7 (I: 35.0%) | 3.7±0.6 (I: −7.5%) |
| (140 kV: 25/50/75/90 keV) | 2.0±0.5 (Gd: −28.6%) | 4.8±0.1 (Bi: −4.0%) |
4. Discussion
In this work, we implemented an EID-based MECT system that can acquire three different x-ray spectra measurements simultaneously. This system involves minimal hardware changes on an existing DS CT scanner by adding a split-filter to one of the x-ray tubes. Although the split-filter approach was previously implemented on a Siemens single-source CT scanner to enable DECT, our work represents the first implementation of EID-based MECT system on clinical multi-detector CT scanners. This system can be used as a cost-effective alternative to PCD-based MECT system to explore many potentially important clinical applications of multiple contrast agents, including multi-phase imaging with iodine and gadolinium, and small bowel imaging with iodine and bismuth [2–5, 15, 19, 33, 34]. To evaluate the performance of this new MECT system, we performed a phantom study to characterize the material quantification accuracy and noise properties in 3 three- and four-material-decomposition tasks compared to EID-DECT and PCD-CT systems.
The optimal triple-beam configuration in EID-MECT was task dependent. Due to the relatively low K-edge energy of iodine (33.2 keV), more spectrum separation is believed to be beneficial for improving noise performance in typical iodine/water imaging tasks [35]. When another contrast agent with distinct K-edge in the x-ray beam energy range was involved, for example, gadolinium (K-edge: 50.2 keV) and bismuth (K-edge: 90.5 keV), the imaging performance is highly dependent on how well the x-ray spectra in the MECT acquisition capture this additional contrast agent’s K-edge. To improve noise properties of material decomposition, sufficient photons should be allocated below and above this additional K-edge while maintaining sufficient spectral separation. This explains why 70/Au120/Sn120 kV and 70/Au140/Sn140 kV were determined to be optimal for iodine/gadolinium/water and iodine/bismuth/water imaging tasks, respectively. When both gadolinium and bismuth were present, priority appears to be given to gadolinium’s K-edge, which is more challenging to be captured compared to bismuth’s K-edge, leading to the optimal triple-beam configuration as 70/Au120/Sn120 kV, as shown in Figure 12.
At equal radiation dose, the relative noise performance among the 4 DECT/MECT systems is dependent on the specific material decomposition tasks. a) For the task of iodine/gadolinium/water material decomposition, EID-MECT-derived material-specific images showed better quantification accuracy (Table 2) and lower noise level (Figures 7 and 8) than TB-DECT- and DS-DECT. Compared to PCD-CT for the same imaging task, comparable quantification accuracy and slightly higher noise level were observed. Three-material decomposition of iodine/gadolinium/water may find potential clinical applications in simultaneous multi-phase imaging such as biphasic liver imaging [1–3, 15, 36]. b) For the task of iodine/bismuth/water material decomposition, all DECT/MECT systems showed comparable accuracy in iodine and bismuth quantifications (Table 3). In terms of noise comparison, EID-MECT had noise level comparable to DS-DECT, and lower noise level than TB-DECT and PCD-CT in all material-specific images (Figures 10 and 11). Three-material decomposition of iodine/bismuth/water may find potential clinical applications in simultaneous arterial and enteric imaging of small bowel [4, 5, 15, 19, 33, 34, 36]. c) For the task of iodine/gadolinium/bismuth/water material decomposition, EID-MECT demonstrated comparable or slightly better accuracy in quantifications of all three contrast materials (Table 4). The bismuth-specific images derived from EID-MECT were noisier, but both iodine- and gadolinium-specific images had much lower noise level in comparison to PCD-CT (Figures 13 and 14). It is noteworthy that the material decomposition results presented in the current study were derived in an idealistic setting where the calibration was performed with a subset of the samples in the same phantom and CT scan, which may differ from clinical practice where the calibration was performed in a separate set of scans.
Table 2.
Data acquisition geometry, radiation dose, and image reconstruction parameters (iodine: I; gadolinium: Gd; bismuth: Bi)
| DECT/MECT Technique |
TB-DECT | DS-DECT | EID-MECT | PCD-CT | PCD-CT |
|---|---|---|---|---|---|
| Imaging Task | I/Gd/Water; I/Bi/Water |
I/Gd/Water; I/Bi/Water; I/Gd/Bi/Water |
I/Gd/Water | I/Bi/Water; I/Gd/Bi/Water |
|
| Voltage (kV) | Au120/Sn120 | 80/Sn140 | 70/Au120/Sn120; 80/Au120/Sn120; 70/Au140/Sn140; 80/Au140/Sn140 |
80: 25, 35, 50, 55 keV | 140: 25, 50, 75, 90 keV |
| Mean Energies (keV) | 67, 85 | 52, 89 | 48, 67, 85; 52, 67, 85; 48, 73, 94; 52, 73, 94 |
51, 52, 57, 65 | 63, 71, 90, 107 |
| Pitch | 0.35 | 0.6 | 0.25 | 0.6 | |
| Rotation time (s) | 0.33 | 0.5 | 0.33 | 1.0 | 0.5 |
| Slice-thickness/increment (mm) | 3.0/2.8 | ||||
| Detector | EID | PCD | |||
| CTDIvol (mGy)* | 11.8 | 23.6** | |||
| Reconstruction kernel | Qr40*** | D30 | Qr40*** | D30 | |
On the existing TB-DECT system, the two energy beams after the split-filter attenuation have significant overlap (Figure 5a) because they are originated from the same x-ray spectrum at 120 kV. The suboptimal spectral separation led to low quantification accuracy and high noise level in decomposed material-specific images, as also shown in some of the recent evaluation studies [37, 38]. With the addition of a low-energy x-ray beam (e.g., 70 or 80 kV) in EID-MECT with triple-beam configuration, the performance was much improved, as shown in Figures 7 and 10. Compared to DS-DECT, the benefit of adding an x-ray beam (e.g., Au120 or Au140 kV) between the low- and high-energy beams in EID-MECT is task dependent. For iodine/gadolinium/water material decomposition, the added x-ray beam improved noise properties in both iodine- and gadolinium-specific images, as demonstrated in Figure 7. This is because the gadolinium’s K-edge was better utilized by allocating more x-ray photons right above the K-edge from the additional x-ray beam. For the other three-material decomposition task involving iodine/bismuth/water, the additional x-ray beam between the low- and high-energy beams did not add much benefit (Figure 10), probably because the bismuth’s K-edge has already been well captured by the x-ray beam spectra in DS-DECT operated at 80/Sn140 kV.
Compared to PCD-CT, the performance of EID-MECT is slightly worse in the iodine/gadolinium/water decomposition task, but superior in the other two tasks. The energy bins in PCD-CT have been optimized to provide the best imaging performance in each material decomposition task. The multi-energy datasets acquired with PCD-CT, however, still suffer from imperfect PCD energy response which results in severe spectral distortions and degraded spectral separations, as shown in Figure 5c–5d, which is the reason why current PCD-CT systems have not demonstrated obvious benefit over existing DECT and the proposed EID-MECT systems in many material decomposition tasks. With the development of novel PCD technology and correction methods, the spectral performance may improve in the future [39].
Note that the acquisition parameters such as pitch values and rotation time are determined based on the clinical protocols for routine abdomen scan on each scanner. The total radiation dose levels (CTDIvol) and reconstruction kernels were, however matched across all the DECT and MECT measurements (Table 2) to conduct fair comparisons of quantification accuracy and noise level. The collimation parameters are slightly different due to hardware variations on different systems. Since the spatial resolutions including in-plane and cross-plane resolution are primarily determined by the detector bin size along the two dimensions, the focal spot size, and the reconstruction kernel, the overall beam collimation has minimal impact on the spatial resolution.
We would like to acknowledge two limitations of current implementations. First, the split-filter in the current EID-MECT implementation is 0.05 mm Au and 0.6 mm Sn, which is the same as that installed on the existing TB-DECT system. As previously demonstrated [40], the selection of filter material as well as thickness, and the associated dose partitioning between two twin-beams and two x-ray tubes may further be optimized to improve the material-specific imaging performance, which warrants future studies. Second, this implementation requires the scan to be performed at a relatively low pitch value (less than 0.5), which may be susceptible to potential misalignment among different energy beams and longer acquisition time compared to DECT/MECT systems at equal power and scan speed utilization. We are currently performing an in vivo animal study to evaluate the practical feasibility of this technique.
5. Conclusion
For the first time, an EID-based MECT system that can simultaneously acquire three x-ray spectra measurements was implemented by adding a split-filter onto one of the x-ray tubes in a DS CT scanner. Material-specific imaging performance was evaluated for various three- and four-material decomposition tasks in a phantom study. At equal radiation dose level, EID-MECT with the optimal triple-beam configuration provided comparable or better quantification accuracy and noise performance in material decomposition images, compared to EID-DECT and PCD-CT systems.
Acknowledgements
Research reported in this publication was supported by the National Institutes of Health under award numbers R21 EB024071, R01 EB016966, and C06 RR018898. The content is solely the responsibility of the authors and does not necessarily represent the official views of the National Institutes of Health. This work was supported in part by the Mayo Clinic X-ray Imaging Research Core. The research CT system used in this work was provided by Siemens Healthcare GmbH; it is not commercially available. Siemens Healthcare GmbH also provided additional technical support with regards to the installation and calibration of the split filter.
Conflicts of Interest:
Drs. Allmendinger, Halaweish, Schmidt, and Flohr are employees of Siemens Healthcare GmbH. Dr. McCollough receives industry grant support from Siemens Healthcare GmbH. No other potential conflicts of interest were declared. Some of the information contained in the manuscript was presented at the Radiological Society of North America 2019 annual meeting, Chicago, IL.
Footnotes
Publisher's Disclaimer: This article has been accepted for publication and undergone full peer review but has not been through the copyediting, typesetting, pagination and proofreading process, which may lead to differences between this version and the Version of Record. Please cite this article as doi:10.1002/MP.14943
Data availability statement
The data that support the findings of this study are available from the corresponding author upon reasonable request.
References
- 1.Dangelmaier J, et al. , Experimental feasibility of spectral photon-counting computed tomography with two contrast agents for the detection of endoleaks following endovascular aortic repair. European Radiology, 2018. [DOI] [PMC free article] [PubMed] [Google Scholar]
- 2.Rolf S, et al. , Photon- counting CT for simultaneous imaging of multiple contrast agents in the abdomen: An in vivo study. Medical Physics, 2017. 44(10): p. 5120–5127. [DOI] [PMC free article] [PubMed] [Google Scholar]
- 3.Muenzel D, et al. , Simultaneous dual-contrast multi-phase liver imaging using spectral photon-counting computed tomography: a proof-of-concept study. European Radiology Experimental, 2017. 1(1): p. 25. [DOI] [PMC free article] [PubMed] [Google Scholar]
- 4.Qu M, et al. , Toward Biphasic Computed Tomography (CT) Enteric Contrast: Material Classification of Luminal Bismuth and Mural Iodine in a Small-Bowel Phantom Using Dual-Energy CT. Journal of Computer Assisted Tomography, 2012. 36(5): p. 554–559. [DOI] [PubMed] [Google Scholar]
- 5.Ren L, et al. , Simultaneous Dual-Contrast Imaging of Small Bowel With Iodine and Bismuth Using Photon-Counting-Detector Computed Tomography A Feasibility Animal Study. Investigative Radiology, 2020. [DOI] [PMC free article] [PubMed] [Google Scholar]
- 6.Stayman JW and II ST. Model-based Multi-material Decomposition using Spatial-Spectral CT Filters. in The fifth international conference on image formation in X-ray computed tomography. 2018. [PMC free article] [PubMed] [Google Scholar]
- 7.Tao S, et al. , Feasibility of multi-contrast imaging on dual-source photon counting detector (PCD) CT: An initial phantom study. Medical Physics. 0(0). [DOI] [PMC free article] [PubMed] [Google Scholar]
- 8.Cormode DP, et al. , Multicolor spectral photon-counting computed tomography: in vivo dual contrast imaging with a high count rate scanner. Scientific Reports, 2017. 7(1): p. 4784. [DOI] [PMC free article] [PubMed] [Google Scholar]
- 9.Muenzel D, et al. Photon counting CT of the liver with dual-contrast enhancement. in SPIE Medical Imaging. 2016. SPIE. [Google Scholar]
- 10.Ren L, et al. , Impact of prior information on material decomposition in dual- and multienergy computed tomography. Journal of Medical Imaging, 2019. 6(1): p. 013503. [DOI] [PMC free article] [PubMed] [Google Scholar]
- 11.Kelcz F, Joseph PM, and Hilal SK, Noise considerations in dual energy CT scanning. Medical Physics, 1979. 6(5): p. 418–425. [DOI] [PubMed] [Google Scholar]
- 12.Alvarez RE and Macovski A, Energy-selective reconstructions in X-ray computerised tomography. Physics in Medicine & Biology, 1976. 21(5): p. 733. [DOI] [PubMed] [Google Scholar]
- 13.Katsuyuki T and I.J. S, Vision 20/20: Single photon counting x- ray detectors in medical imaging. Medical Physics, 2013. 40(10): p. 100901. [DOI] [PMC free article] [PubMed] [Google Scholar]
- 14.Ren L, Zheng B, and Liu H, Tutorial on X-ray photon counting detector characterization. Journal of X-Ray Science and Technology, 2018. 26(1): p. 1–28. [DOI] [PMC free article] [PubMed] [Google Scholar]
- 15.Ren L, et al. , Radiation dose efficiency of multi-energy photon-counting-detector CT for dual-contrast imaging. Physics in Medicine & Biology, 2019. 64(24): p. 245003. [DOI] [PMC free article] [PubMed] [Google Scholar]
- 16.Faby S, et al. , Performance of today’s dual energy CT and future multi energy CT in virtual non-contrast imaging and in iodine quantification: A simulation study. Medical Physics, 2015. 42(7): p. 4349–4366. [DOI] [PubMed] [Google Scholar]
- 17.Neculaes VB, et al. , Multisource X-Ray and CT: Lessons Learned and Future Outlook. IEEE Access, 2014. 2: p. 1568–1585. [Google Scholar]
- 18.Tivnan M, II ST, and Stayman JW, Physical modeling and performance of spatial-spectral filters for CT material decomposition. SPIE Medical Imaging. Vol. 10948. 2019: SPIE. [DOI] [PMC free article] [PubMed] [Google Scholar]
- 19.Yu L, et al. , Dual-source multienergy CT with triple or quadruple x-ray beams. Journal of Medical Imaging, 2018. 5: p. 9. [DOI] [PMC free article] [PubMed] [Google Scholar]
- 20.Saba L, et al. , Dual Energy CT: Basic Principles, in Dual Energy CT in Oncology, De Cecco CN, et al., Editors. 2015, Springer International Publishing: Cham. p. 1–20. [Google Scholar]
- 21.Kaemmerer N, et al. , Dual-Energy Computed Tomography Angiography of the Head and Neck With Single-Source Computed Tomography: A New Technical (Split Filter) Approach for Bone Removal. Investigative Radiology, 2016. 51(10): p. 618–623. [DOI] [PubMed] [Google Scholar]
- 22.Almeida IP, et al. , Dual-energy CT quantitative imaging: a comparison study between twin-beam and dual-source CT scanners. Medical Physics, 2017. 44(1): p. 171–179. [DOI] [PubMed] [Google Scholar]
- 23.Petersilka M, et al. , Strategies for scatter correction in dual source CT. Medical Physics, 2010. 37(11): p. 5971–5992. [DOI] [PubMed] [Google Scholar]
- 24.Tao S, et al. , Material decomposition with prior knowledge aware iterative denoising (MD-PKAID). Physics in Medicine & Biology, 2018. 63(19): p. 195003. [DOI] [PubMed] [Google Scholar]
- 25.Leng S, et al. , 150-mum Spatial Resolution Using Photon-Counting Detector Computed Tomography Technology: Technical Performance and First Patient Images. Invest Radiol, 2018. 53(11): p. 655–662. [DOI] [PMC free article] [PubMed] [Google Scholar]
- 26.Li Z, et al. Estimation of signal and noise for a whole-body research photon-counting CT system. 2017. SPIE. [DOI] [PMC free article] [PubMed] [Google Scholar]
- 27.Yu Z, et al. , Evaluation of conventional imaging performance in a research whole-body CT system with a photon-counting detector array. Physics in Medicine & Biology, 2016. 61(4): p. 1572. [DOI] [PMC free article] [PubMed] [Google Scholar]
- 28.Tao S, et al. , Optimal acquisition setting for dual-contrast imaging with gadolinium and iodine on a research whole-body photon-counting-detector (PCD) CT. SPIE Medical Imaging. Vol. 10948. 2019: SPIE. [Google Scholar]
- 29.Flohr TG, et al. , Image reconstruction and image quality evaluation for a dual source CT scanner. Med Phys, 2008. 35(12): p. 5882–97. [DOI] [PMC free article] [PubMed] [Google Scholar]
- 30.Liu X, et al. , Quantitative evaluation of noise reduction algorithms for very low dose renal CT perfusion imaging. Proc. of SPIE, 2009. 7258: p. 72581T. [Google Scholar]
- 31.Taguchi K and Iwanczyk JS, Vision 20/20: Single photon counting x-ray detectors in medical imaging. Medical physics, 2013. 40(10): p. 100901. [DOI] [PMC free article] [PubMed] [Google Scholar]
- 32.Fung GSK, et al. XCAT/DRASIM: a realistic CT/human-model simulation package. in SPIE Medical Imaging. 2011. SPIE. [Google Scholar]
- 33.Mongan J, et al. , Extravasated Contrast Material in Penetrating Abdominopelvic Trauma: Dual-Contrast Dual-Energy CT for Improved Diagnosis—Preliminary Results in an Animal Model. Radiology, 2013. 268(3): p. 738–742. [DOI] [PMC free article] [PubMed] [Google Scholar]
- 34.Mongan J, et al. , In Vivo Differentiation of Complementary Contrast Media at Dual-Energy CT. Radiology, 2012. 265(1): p. 267–272. [DOI] [PMC free article] [PubMed] [Google Scholar]
- 35.Primak AN, et al. , Improved dual-energy material discrimination for dual-source CT by means of additional spectral filtration. Medical Physics, 2009. 36(4): p. 1359–1369. [DOI] [PMC free article] [PubMed] [Google Scholar]
- 36.Ren L, et al. , Quantitative accuracy and dose efficiency of dual-contrast imaging using dual-energy CT: a phantom study. Medical Physics, 2020. 47(2): p. 441–456. [DOI] [PMC free article] [PubMed] [Google Scholar]
- 37.Almeida IP, et al. , Dual-energy CT quantitative imaging: a comparison study between twin-beam and dual-source CT scanners. Medical physics, 2017. 44(1): p. 171–179. [DOI] [PubMed] [Google Scholar]
- 38.Jacobsen MC, et al. , Intermanufacturer Comparison of Dual-Energy CT Iodine Quantification and Monochromatic Attenuation: A Phantom Study. Radiology, 2017: p. 170896. [DOI] [PubMed] [Google Scholar]
- 39.Taguchi K, Multi-energy inter-pixel coincidence counters for charge sharing correction and compensation in photon counting detectors. Medical Physics. n/a(n/a). [DOI] [PMC free article] [PubMed] [Google Scholar]
- 40.Ren L, McCollough CH, and Yu L. Optimization of dose distribution and filter thickness in energy-integrating-detector-based multi-energy CT. in The fifth international conference on image formation in X-ray computed tomography. 2018. [Google Scholar]
Associated Data
This section collects any data citations, data availability statements, or supplementary materials included in this article.
Data Availability Statement
The data that support the findings of this study are available from the corresponding author upon reasonable request.