

SUMMARY
The emerging role of mitochondria as signaling organelles raises the question of whether individual mitochondria can initiate heterotypic communication with neighboring organelles. Using fluorescent probes targeted to the endoplasmic-reticulum-mitochondrial interface, we demonstrate that single mitochondria generate oxidative bursts, rapid redox oscillations, confined to the nanoscale environment of the interorganellar contact sites. Using probes fused to inositol 1,4,5-trisphosphate receptors (IP3Rs), we show that Ca2+ channels directly sense oxidative bursts and respond with Ca2+ transients adjacent to active mitochondria. Application of specific mitochondrial stressors or apoptotic stimuli dramatically increases the frequency and amplitude of the oxidative bursts by enhancing transient permeability transition pore openings. Conversely, blocking interface Ca2+ transport via elimination of IP3Rs or mitochondrial calcium uniporter channels suppresses ER-mitochondrial Ca2+ feedback and cell death. Thus, single mitochondria initiate local retrograde signaling by miniature oxidative bursts and, upon metabolic or apoptotic stress, may also amplify signals to the rest of the cell.
Graphical abstract
In brief
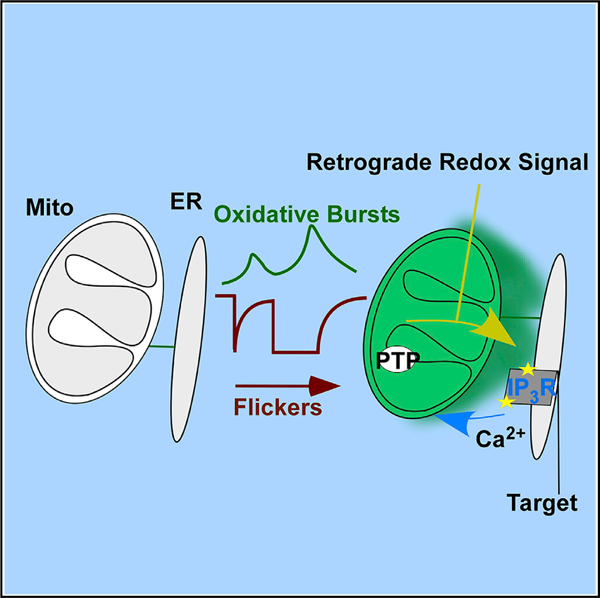
Booth et al. demonstrate that flickers, transient depolarizations of single mitochondria, generate nanoscale oxidative bursts at the ER-mitochondrial interface. These bursts constitute retrograde signaling that promotes mitochondrial Ca2+ uptake through oxidative sensitization of ER-resident Ca2+ inositol trisphosphate receptor.
INTRODUCTION
Mitochondria have become appreciated not only as energy providers but as key participants in biosynthetic processes, cell signaling, and dynamics (Giacomello et al., 2020; Madreiter-Sokolowski et al., 2019; Martínez-Reyes and Chandel, 2020; Sies and Jones, 2020; Tan and Finkel, 2020). In signaling, mitochondria participate as modulators and receptors of signals emitted by other organelles but also produce their own signaling molecules (Martínez-Reyes and Chandel, 2020; Sies and Jones, 2020; Tan and Finkel, 2020). Between the nucleus and mitochondria, two-way communication exists, in which the mitochondria-to-nucleus direction is referred to as retrograde signaling (Butow and Avadhani, 2004; Tan and Finkel, 2020). Mitochondria also receive signaling input from other organelles such as the endoplasmic reticulum (ER), and “retrograde” mitochondrial signaling is also speculated in this context. Although mitochondria are usually considered single entities, in most cell types they represent a dynamic network of discrete organelles with asynchronous activity (Aryaman et al., 2019). Therefore, it is important to understand the nature and relevance of the signals transmitted from single mitochondria to other organelles. A premier opportunity for such signaling to make an impact is at the close proximities of mitochondria with other organelles. In this context, of particular interest are the contacts between the ER and mitochondria.
Physically tethered contacts between mitochondria and ER enclose a nanometer-scale interface that responds dynamically to stimuli including metabolic and disease states (Csordás et al., 2006; Fan and Simmen, 2019; Morciano et al., 2018; Vallese et al., 2020). The contacts form a communication hub for membrane dynamics, lipid synthesis, fatty acid oxidation, and Ca2+ transfer (Csordás et al., 2018; Fan and Simmen, 2019; Raffaello et al., 2016; Tan and Finkel, 2020). Ca2+ released from the ER via inositol 1,4,5-trisphosphate receptors (IP3R) exposes mitochondria locally to high Ca2+ nanodomains that overcome the threshold of the mitochondrial Ca2+ uniporter (Csordás et al., 2018; Raffaello et al., 2016). The ensuing mitochondrial matrix Ca2+ ([Ca2+]m) rise regulates key Krebs cycle and oxidative phosphorylation (OXPHOS) proteins to meet physiological ATP demands.
Redox signals such as reactive oxygen species (ROS) derive from the oxidation of metabolic intermediates by enzymes of the Krebs cycle and electron transport chain (ETC) within mitochondria. The rate and location of signal generation is acutely sensitive to metabolic flux and status of each component of the bioenergetic cascade. A local mismatch between supply of metabolites, O2, and electromotive force leads to the perturbation of the redox equilibrium and production of specific redox signals. The ER-mitochondrial interface is continuous with the cytosol but defines a small volume and short-range path for redox signals to propagate locally from single mitochondria to the ER surface. Such signals may drive both physiological and pathological processes by tuning Ca2+ signals via reactive cysteine residues within proteins such as IP3R (Bánsághi et al., 2014). Through modulation of the sensitivity of ER Ca2+ machinery, mitochondrial redox signals provide a feedback loop able to tune mitochondrial bioenergetics at the local level. However, events that allow single mitochondria to initiate communication on their own condition with the neighboring ER remain elusive.
In this context, we became interested in the “flickers,” described as transient depolarizations of discrete subsets of mitochondria (Duchen et al., 1998) that can also propagate as waves of depolarization and pyridine nucleotide oxidation (Aon et al., 2003). Importantly, flickers were also documented in isolated single mitochondria (Hüser and Blatter, 1999), suggesting that flickers are inherent to mitochondria. Depolarization within single mitochondria have also been linked to “mitoflashes,” matrix pH oscillations (Santo-Domingo et al., 2013) that coincide with matrix ROS oscillations (Wang et al., 2008). Mechanistically, all these phenotypes have been linked to mitochondrial permeability transition pore (mPTP) opening (Wang et al., 2012). However, it remains elusive whether flickers/mitoflashes initiate any heterotypic communication with the neighboring organelles. In this study, we tested the hypothesis that during the transient mPTP openings, single mitochondria emit miniature ROS bursts, which serve as a second messenger to alter locally the function of the adjacent ER.
RESULTS
We first used superresolution microscopy to image the inner mitochondrial membrane (IMM) potential (ΔΨm) and permeability in single mitochondria of HepG2 cells labeled with the voltage sensor TMRE and with calcein, which crosses the IMM upon opening of the mPTP (Nieminen et al., 1995; Petronilli et al., 1998). Calcein fluorescence was confined to the mitochondria because the cytoplasmic fraction was quenched by a pulse of CoCl2 (1 mM) before imaging. In unstimulated cells, whole-cell ΔΨm remained relatively stable, whereas calcein fluorescence declined gradually (Figure 1A). Loss of calcein fluorescence may reflect transient mPTP formation manifesting as transient loss of ΔΨm in subsets of mitochondria. Using difference image analysis (DIA), short (Figure 1B) and long (Figure 1C) single mitochondrial transient depolarization events were resolved, which were closely coupled to falling calcein fluorescence that stabilized upon ΔΨm recovery. These single mitochondria are zoomed in in the insets and highlighted in red (Figures 1B and 1C). The surrounding mitochondria showed stable ΔΨm and calcein fluorescence at the same time (Figure 1B, inset). The frequency of the events in unstimulated cells was unchanged during the 1 h of imaging (Figures 1E and 1G), indicating that the observed single mitochondrial flickering was not induced by the recording.
Figure 1. Spontaneous and stimulated mPTP events underpin the intra- and extra-mitochondrial features of mitochondrial flickers.
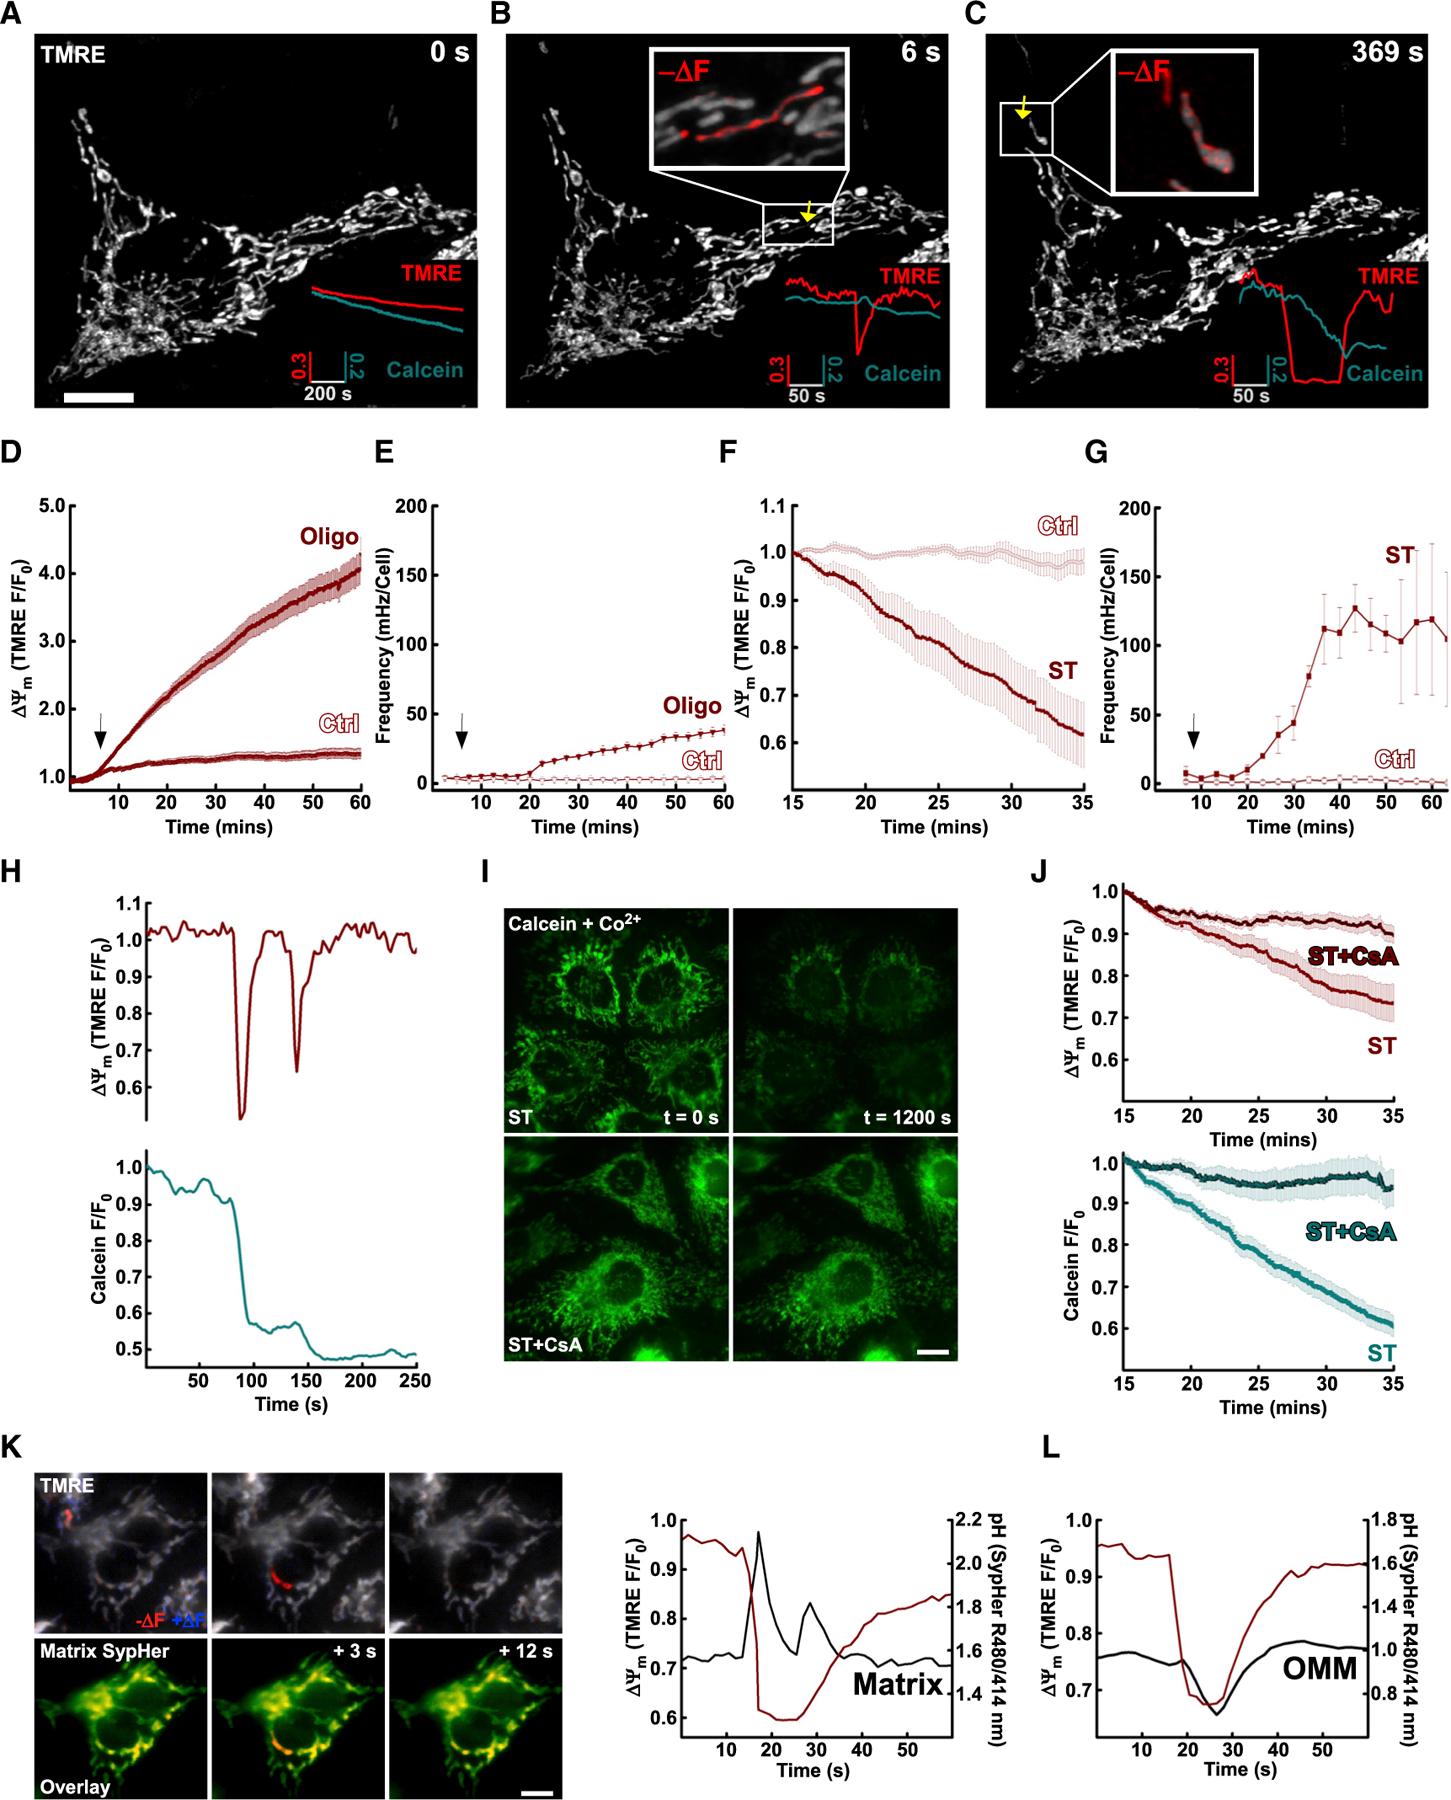
(A) Airyscan imaging of TMRE and calcein-labeled HepG2 cells. Plots of whole-cell ROI of TMRE (inset; red) and calcein (inset; teal).
(B) Calcein decline following transient depolarization events in single mitochondria.
(C) Decline in calcein proportional to duration of depolarization event.
(D) Oligo increased mitochondrial membrane potential (ΔΨm).
(E) Increased flicker frequency induced by Oligo.
(F) ST promoted global depolarization.
(G) Increased flicker frequency induced by ST (Pearson’s correlation: Ctrl, 0.4075; ST, 0.927).
(H) ΔΨm flickers accompanied by stepwise declines in calcein fluorescence.
(I) Mitochondrial calcein decreases sensitivity to CsA.
(J) ΔΨm flickers and calcein decrease sensitivity to CsA.
(K) ST-induced ΔΨm flickers accompanied by transient elevation in matrix pH measured by SypHer.
(L) OMM-targeted SypHer reports acidification at the cytosolic surface of the OMM during flickers.
(D)–(G) and (J) present mean ± SEM. Scale bars, 10 µm.
Various cellular stress conditions promote flickers and mitoflashes (Feng et al., 2017). We chose to challenge the cells with a mitochondrion-specific drug, oligomycin (Oligo; 2.5 µg/mL; Figures 1D and 1E), and a broad cellular stressor, staurosporine (ST; 2 µM; Figures 1F and 1G). Inhibition of the F1F0 ATP synthase with Oligo induced a progressive increase in whole-cell ΔΨm, as indicated by mitochondrial TMRE accumulation (Figure 1D). DIA revealed that Oligo-induced ΔΨm increase coincided with an increase in the frequency (Figure 1E), amplitude (Figure S1C), and duration (Figure S1D) of flickers over time compared with control (Ctrl).
Following ST pretreatment, a global ΔΨm decrease was observed (Figure S1A; Figure 1F). DIA revealed that the ST-induced ΔΨm decrease was composed of discrete transient depolarization events like those in unstimulated mitochondria (Figure S1B). ST increased the frequency (Figure 1F), amplitude (Figure S1C), and duration (Figure S1E) of flickers over time compared with Ctrl, although measurements of amplitude are likely limited by probe diffusion kinetics in short-duration events. When frequency and duration were considered together as a proxy of mitochondrial depolarization (Figure S1F), a strong correlation with time was observed with a large increase ~15 min following ST treatment. Because ST can harm mitochondria by multiple mechanisms (Oakes et al., 2003), we decided to confirm that the single mitochondrial depolarizations and stepwise decreases in calcein fluorescence (Figure 1H) resulted from mPTP. Cyclosporine A (CsA; 5 µM), an inhibitor of the mPTP activation, preserved mitochondrial calcein fluorescence and global ΔΨm during ST challenge (Figures 1I and 1J). Collectively, these results provide evidence that single mitochondrial and transient mPTP openings occur manifesting as flickers in unchallenged cells, and their frequency and duration increase very early during both cell-wide and mitochondrion-specific insults.
Transient mitochondrial depolarizations have been shown to concur with mitoflashes, which are detected as cpYFP/pH transients (Demaurex and Schwarzländer, 2016; Wang et al., 2008). Using the pH probe SypHer targeted to the matrix, we observed ΔΨm flickers coincident with alkaline pH shifts followed by their rapid reversal in the matrix of the same mitochondrion (Figure 1K; Figure S1G). For further analysis, we split events into those associated with transient (<20 s; Figure S1H, left) or sustained (>20 s; Figure S1H, center) loss of ΔΨm. Direct comparison of the pH responses in these two groups revealed that pH remained in the alkaline range during short-lasting flickers/mPTP openings, whereas an acidic overshoot followed the alkaline transient during prolonged flickers/mPTP openings (Figures S1H and S1G, right). Analysis throughout the period of ST treatment revealed the pH component of flickers to be remarkably constrained to a narrow time window compared with the ΔΨm events associated with their induction (Figures S1I and S1J versus Figure S1E). The pH component of flickers was independent of the length of ST treatment (Figure S1J) or iteration (Figure S1K), consistent with previous studies in diverse cell models (Wang et al., 2008).
When we targeted SypHer to the outer mitochondrial membrane (OMM-SypHer), ΔΨm depolarizations were coupled to transient acidification events (Figure 1L). Such extra-mitochondrial pH transients lead to the conclusion that mitochondrial flickers signal beyond the matrix to their immediate environment. pH transients are poorly suited to long-range signaling but might crosstalk to other signaling cascades (e.g., acidification of the interface would decrease local Ca2+ chelation by modulating the affinity of resident buffers). Furthermore, we hypothesized that flickers would engage powerful mitochondrial redox machinery to generate ROS that upon release from the mitochondria could effectively signal within the local ER-mitochondrial interface (Figure 2A).
Figure 2. Mitochondrial flickers generate dynamic redox signals at the ER-mitochondrial interface.
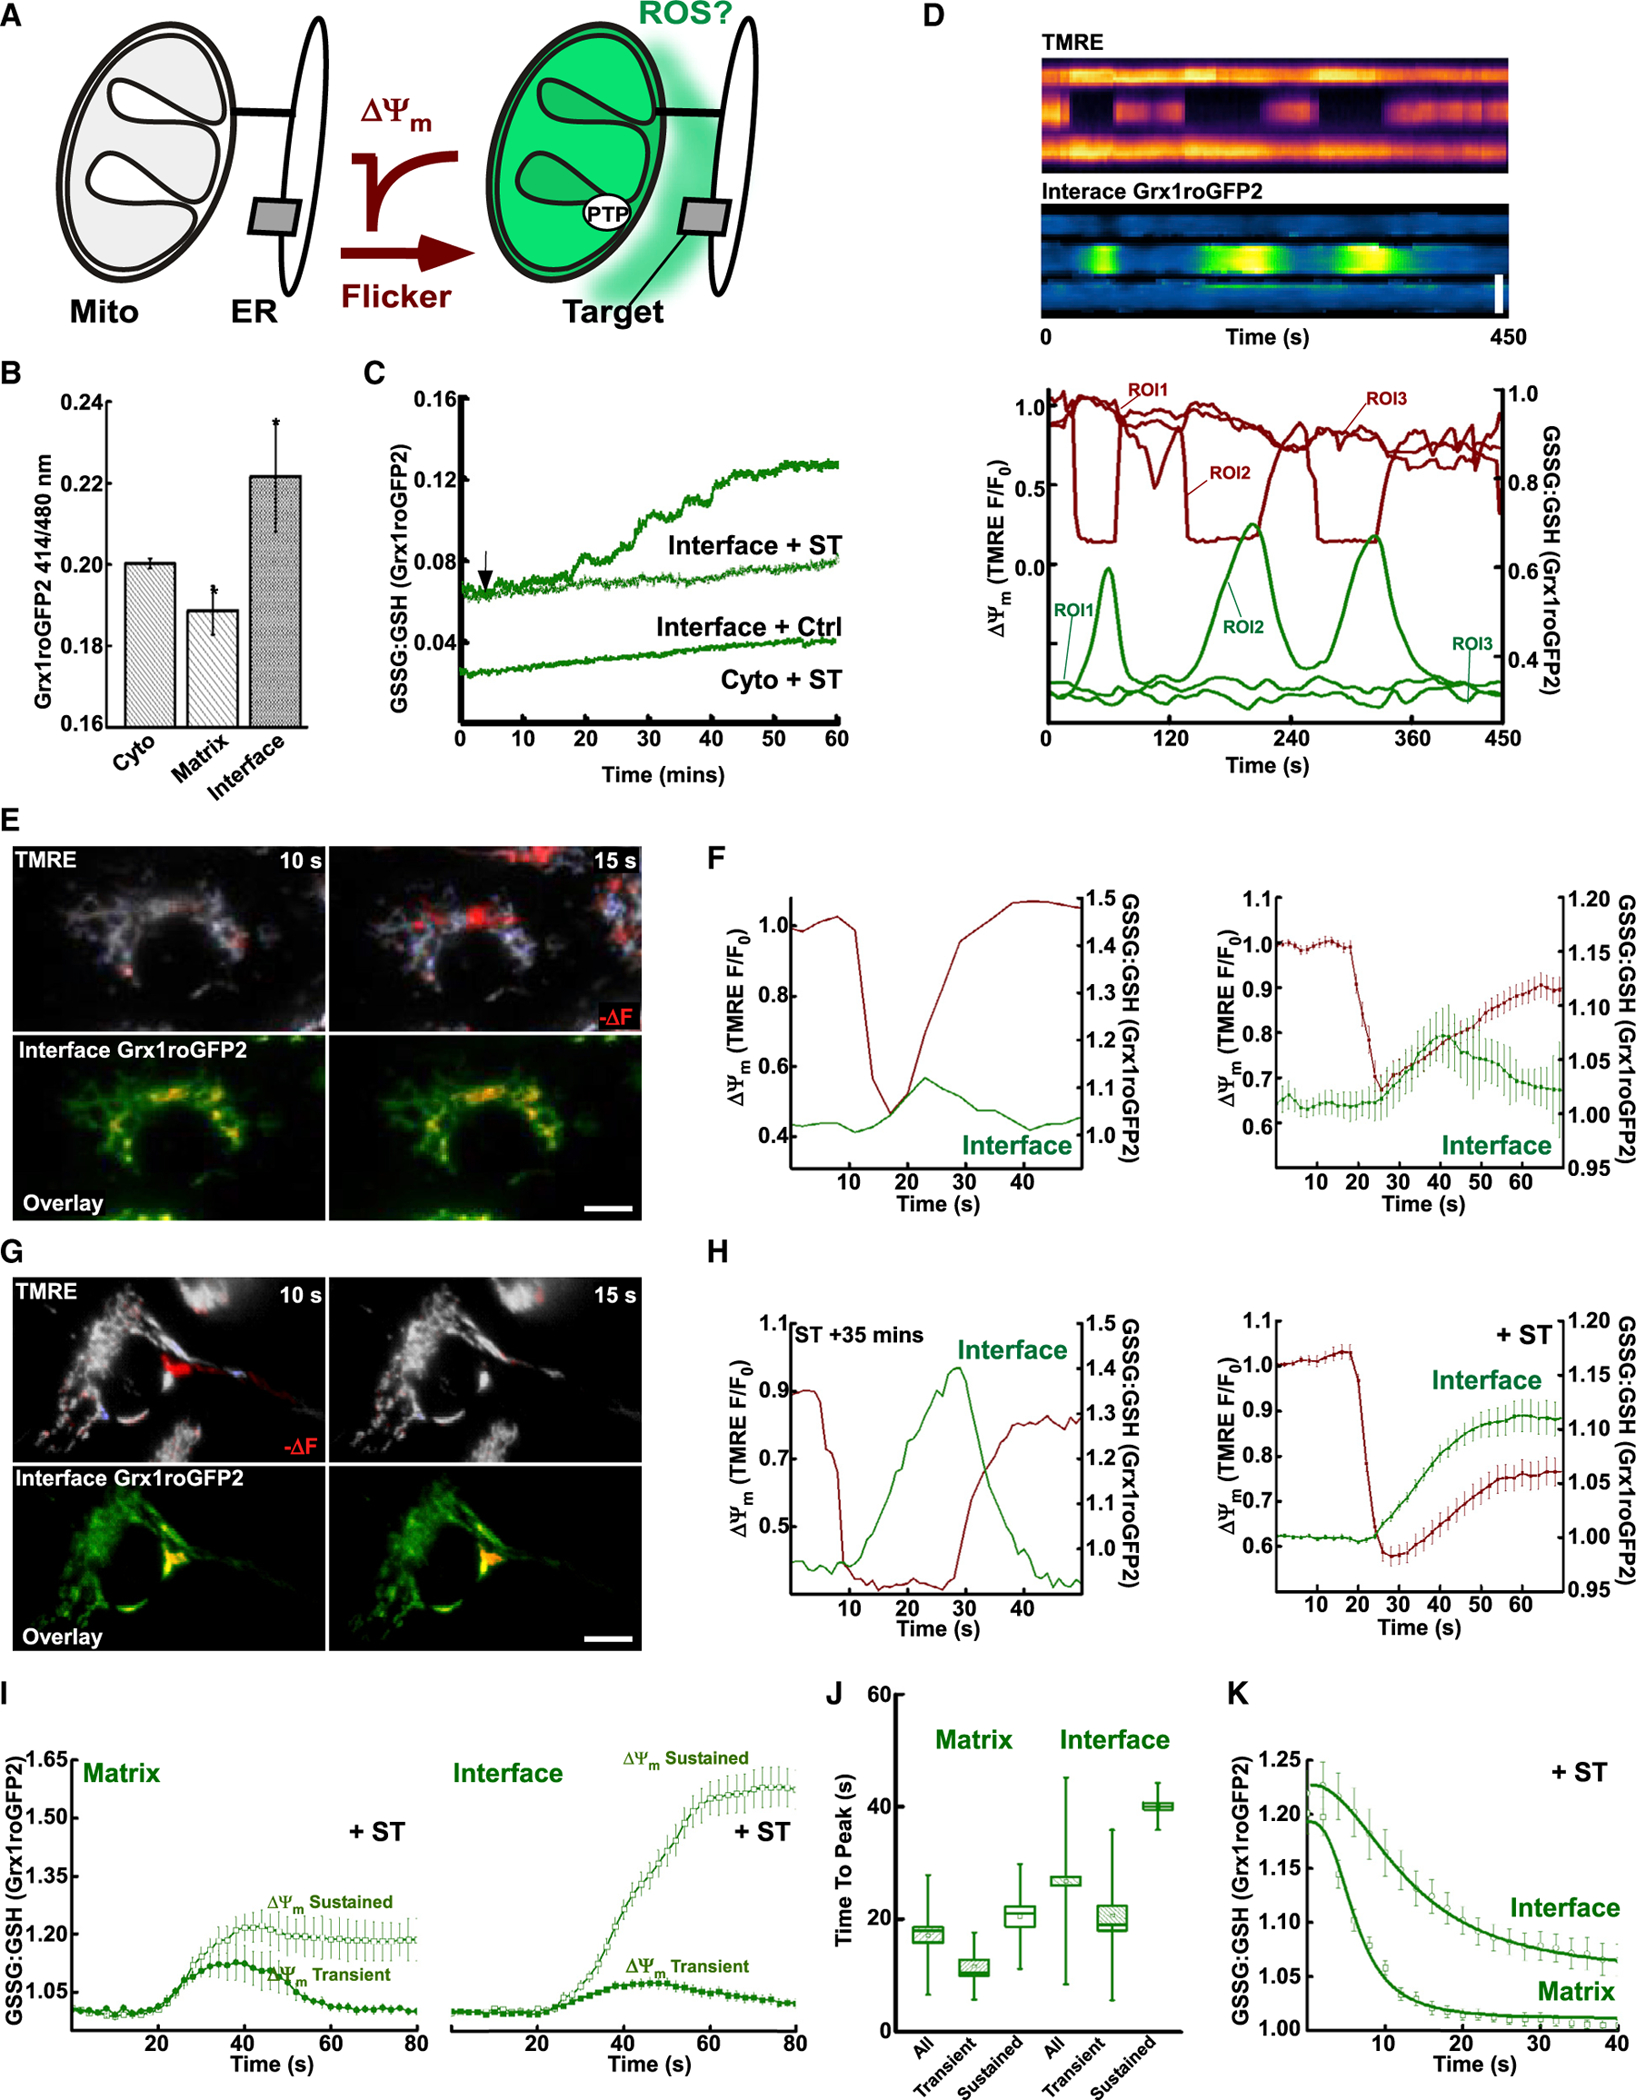
(A) Schematic of hypothesis, flicker-induced oxidative redox shift (green) of interface.
(B) Redox poise (GSSG/GSH ratio) in unstimulated cells measured by Grx1-roGFP2 targeted to the cytosol (Cyto), mitochondrial matrix (Matrix), and ER-mitochondrial interface (Interface); *p < 0.05, two-way ANOVA.
(C) Redox poise following addition of ST.
(D) Kymograph of ΔΨm (TMRE, upper) and Interface GSSG/GSH ratio (Grx1roGFP2, lower) from a 1 × 4 µm ROI crossing three adjacent mitochondria. Line plots (lower) of the region split into three ROIs (ROI1–ROI3).
(E) Spontaneous transient depolarization (−ve ΔΨm: −ve ΔF TMRE, red) of single mitochondrion (upper) during flicker. Interface GSSG/GSH ratio adjacent to the parent organelle (left, lower row: Grx1roGFP2 overlay; 415 nm, red; 485 nm, green). ΔΨm (right) (TMRE 577 nm F/F0, deep red) and GSSG/GSH (Grx1roGFP2, green).
(F) ΔΨm and interface GSSG/GSH in unstimulated cells, single example event (left) and flickers synchronized to half ΔTMRE (TMRE F/F0 mean ± SEM, deep red; Grx1roGFP Ratio/Ratio0, green, right).
(G) Flicker (−ve ΔΨm: −ve ΔF TMRE, red) of single mitochondrion (upper row) during ST treatment. Interface GSSG/GSH.
(H) ΔΨm and interface GSSG/GSH during flicker. Example event (left) and synchronized events (right) to half ΔTMRE (TMRE F/F0, deep red; Grx1roGFP Ratio/Ratio0, green).
(I) Matrix (left) and Interface (right) of GSSG/GSH responses to transient (filled) and sustained (empty) flickers.
(J) Time to peak of Grx1roGFP2 response normalized to half ΔTMRE. Matrix (left) and Interface divided into responses from transient ΔΨm (<20 s) and sustained (>20 s) flickers.
(K) Mean and logistic fits of Matrix and Interface GSSG/GSH normalized to half ΔTMRE recovery
(F), (H) right, (I), and (K) present mean ± SEM. (J) Mean, median, 25th/75th percentile and outliers. Scale bars, 10 µm.
To monitor subcellular redox, we used Grx1roGFP2, a ratiometric, pH-stable reporter for the oxidized/reduced glutathione ratio (GSSG/GSH) (Gutscher et al., 2008). We concentrated the probes at the ER-mitochondrial interface (Interface) using drug-inducible synthetic linker pairs containing ER membrane and OMM targeting sequences (see scheme in Figure S2A) (Booth et al., 2016; Csordás et al., 2010). Transient expression of Grx1roGFP2 targeted to multiple subcellular compartments, including the cytosolic face of the ER (ER-M) and OMM, were further targeted to the interface with a rapamycin pulse protocol. Targeting probes to the interface was without effect on unstimulated flicker activity (Figure S2B) or the dynamic range of the redox probes (Figure S2C). Measurements in unstimulated cells revealed the interface as significantly oxidized (Figure 2B), consistent with our previous measurements with HyPer (Booth et al., 2016), while the bulk cytosol and mitochondrial matrix are reduced, in line with previous reports (Kojer et al., 2012). Stimulation of mitochondrial flickers with ST showed a minimal shift in global cytosolic GSH/GSSG over time (Figure 2C), while interface-targeted probes were selectively oxidized compared with Ctrl (Figure 2C). Interface oxidation following ST challenge was composed of two components, oxidation associated with transient flickering (Figure 1C) followed by a permanent, complete oxidation associated with wave-like collapse of mitochondrial membrane potential in the whole-cell mitochondrial network (Figure S2D). The redox gradients between the matrix, intermembrane space, cytosol, ER lumen, and ER-mitochondrial interface have been shown (Booth et al., 2016; Enyedi et al., 2010), which we now extend to the glutathione status (Figure 2B). Stimulation of flicker activity caused oxidation of the ER-mitochondrial interface selectively (Figure 2C) in a manner that was CsA sensitive while controlling for calcineurin inhibition with FK506 (Figure S2E), whereas oxidation of the cytosolic GSH occurred only following permanent ΔΨm loss matching the kinetics of the whole-cell interface signal (Figure S2D).
To evaluate the diffusion characteristics of ER-mitochondrial interface oxidative bursts, we recorded three parallel mitochondria confined to a 4-µm-wide cell projection. Following ΔΨm flickers in the central mitochondrion (Figure 2D, TMRE kymograph, upper), oxidation of the associated interface was observed (Grx1roGFP2 kymograph, lower and line graph, ROI 2), without diffusion to the adjacent organelles (Figure 2D, ROIs 1 and 3). In unchallenged cells, we observed flicker-associated bursts of GSH oxidation at the interface in approximately 15% of recordings (Figure 2E). Notably, smaller local GSH oxidation events might have remained undetected because of the limitations of the reporter. To establish the time course, the oxidative bursts were pooled and synchronized to half depolarization (Figure 2F). The oxidative bursts started after the rapid depolarization and rose for 10–15 s, followed by a gradual reversal (Figure 2F). In cells in which flicker rate and duration were enhanced with ST, 100% of flickers induced oxidative bursts at the interface (Figure 2G). Furthermore, the pooled response showed prolongation of the rising phase of the oxidative bursts (Figure 2H).
ΔΨm flickers are coupled to mitochondrial matrix ROS elevations (Wang et al., 2016) that likely feed the ER-mitochondrial interface oxidative bursts via mPTP-mediated release of ROS. To understand the temporal relationship between the matrix and interface ROS fluctuations, we recorded both mitochondrial matrix (Figure 2I, left) and interface (Figure 2I, right) targeted Grx1roGFP2 each simultaneously with ΔΨm. We plotted separately the redox responses associated with transient and sustained flickers, respectively (<20 versus >20 s duration at half maximum). The matrix oxidation was closely followed by interface oxidation in each group (Figure 2I, left versus right). In both compartments, sustained flickers generated greater oxidation amplitude and duration (Figures 2I and 2J). Although the matrix oxidizes quickly during flickers, the variation in amplitude between transient and sustained flickers was modest and did not progress beyond 20 s (Figure 2I). Oxidation of the interface showed divergent behavior dependent upon the transient or sustained nature of the flicker. Transient events showed reduced amplitude relative to the matrix, whereas sustained flickers continued to oxidize the interface for >20 s periods following matrix oxidation maximum (Figure 2I). Upon restoration of ΔΨm, both matrix and interface environments reduced (Figure 2K). Grx1roGFP2 responses synchronized to half TMRE recovery demonstrated that the matrix redox state was tightly linked to the ΔΨm and returned to the pre-flicker baseline, whereas the interface GSSG/GSH restored with slower kinetics and often incompletely (Figure 2K).
The ΔΨm flicker-associated matrix oxidation rise was capped to ~20 s, also the upper limit of alkalinization (Figure 2I; Figures S1G and S1H). Combined with ETC dependence, this suggested that pH and redox transients originated from enhanced H+ pumping when the electrical gradient is removed by mPTP. The stronger nature of interface oxidative bursts (Figures 2I and 2J) provides enhanced signal/noise ratio and persistence, while successive oxidative bursts allowed frequency modulation of flickers to generate additive increases in redox signal amplitude (Figures S2F–S2H). The different kinetics of interface and matrix suggests limited reducing capacity within the interface volume. Conversely, matrix oxidation may be restricted by resident enzymes and rapidly restored by access to a large NADPH pool fed by high-capacity regeneration systems, including cross-feed from the NADH pool via nicotinamide nucleotide transhydrogenase (Rydström, 2006).
To explore if ΔΨm flicker-induced oxidations represent true interorganelle signals, we identified the IP3R Ca2+ channel as a candidate redox receptor that resides on the ER side of the interface. By fusing the hydrogen peroxide (H2O2) sensor HyPer to the cytosol-facing N terminus of IP3R1, we created a functional probe with a comparable response profile to the legacy cytosolic sensor (Figure 3A; Video S1). Imaging of unstimulated cells showed that HyPer-IP3R1 is constitutively oxidized (Figure 3B), indicating that IP3Rs occupy an H2O2-rich environment, consistent with our previous measurements of H2O2 at the interface (Booth et al., 2016). Using cells expressing HyPer-IP3R1 or cytosolic HyPer, we found that the HyPer-IP3R1 is progressively and preferentially exposed to H2O2 during flickering compared with the bulk cytosol (Figure 3C) in a manner that is sensitive to CsA (Figure 3D; Figures S3A and S3B, right). Importantly, the increase in HyPer signal was not due to shifts in pH, as measurements with HyPer-IP3R1 and HyPer-Cyto are normalized to parallel experiments performed with the H2O2-insensitive SypHer-IP3R1 and SypHer-Cyto (Figures 3C and 3D; Figures S3A and S3B, left). These measurements demonstrated that the interface is exposed to H2O2 during flickers and that resident IP3Rs are subject to an oxidative shift while cytoplasmic ROS targets remain unaffected.
Figure 3. Mitochondrial flickers promote local Ca2+ signals via oxidation of the IP3R.
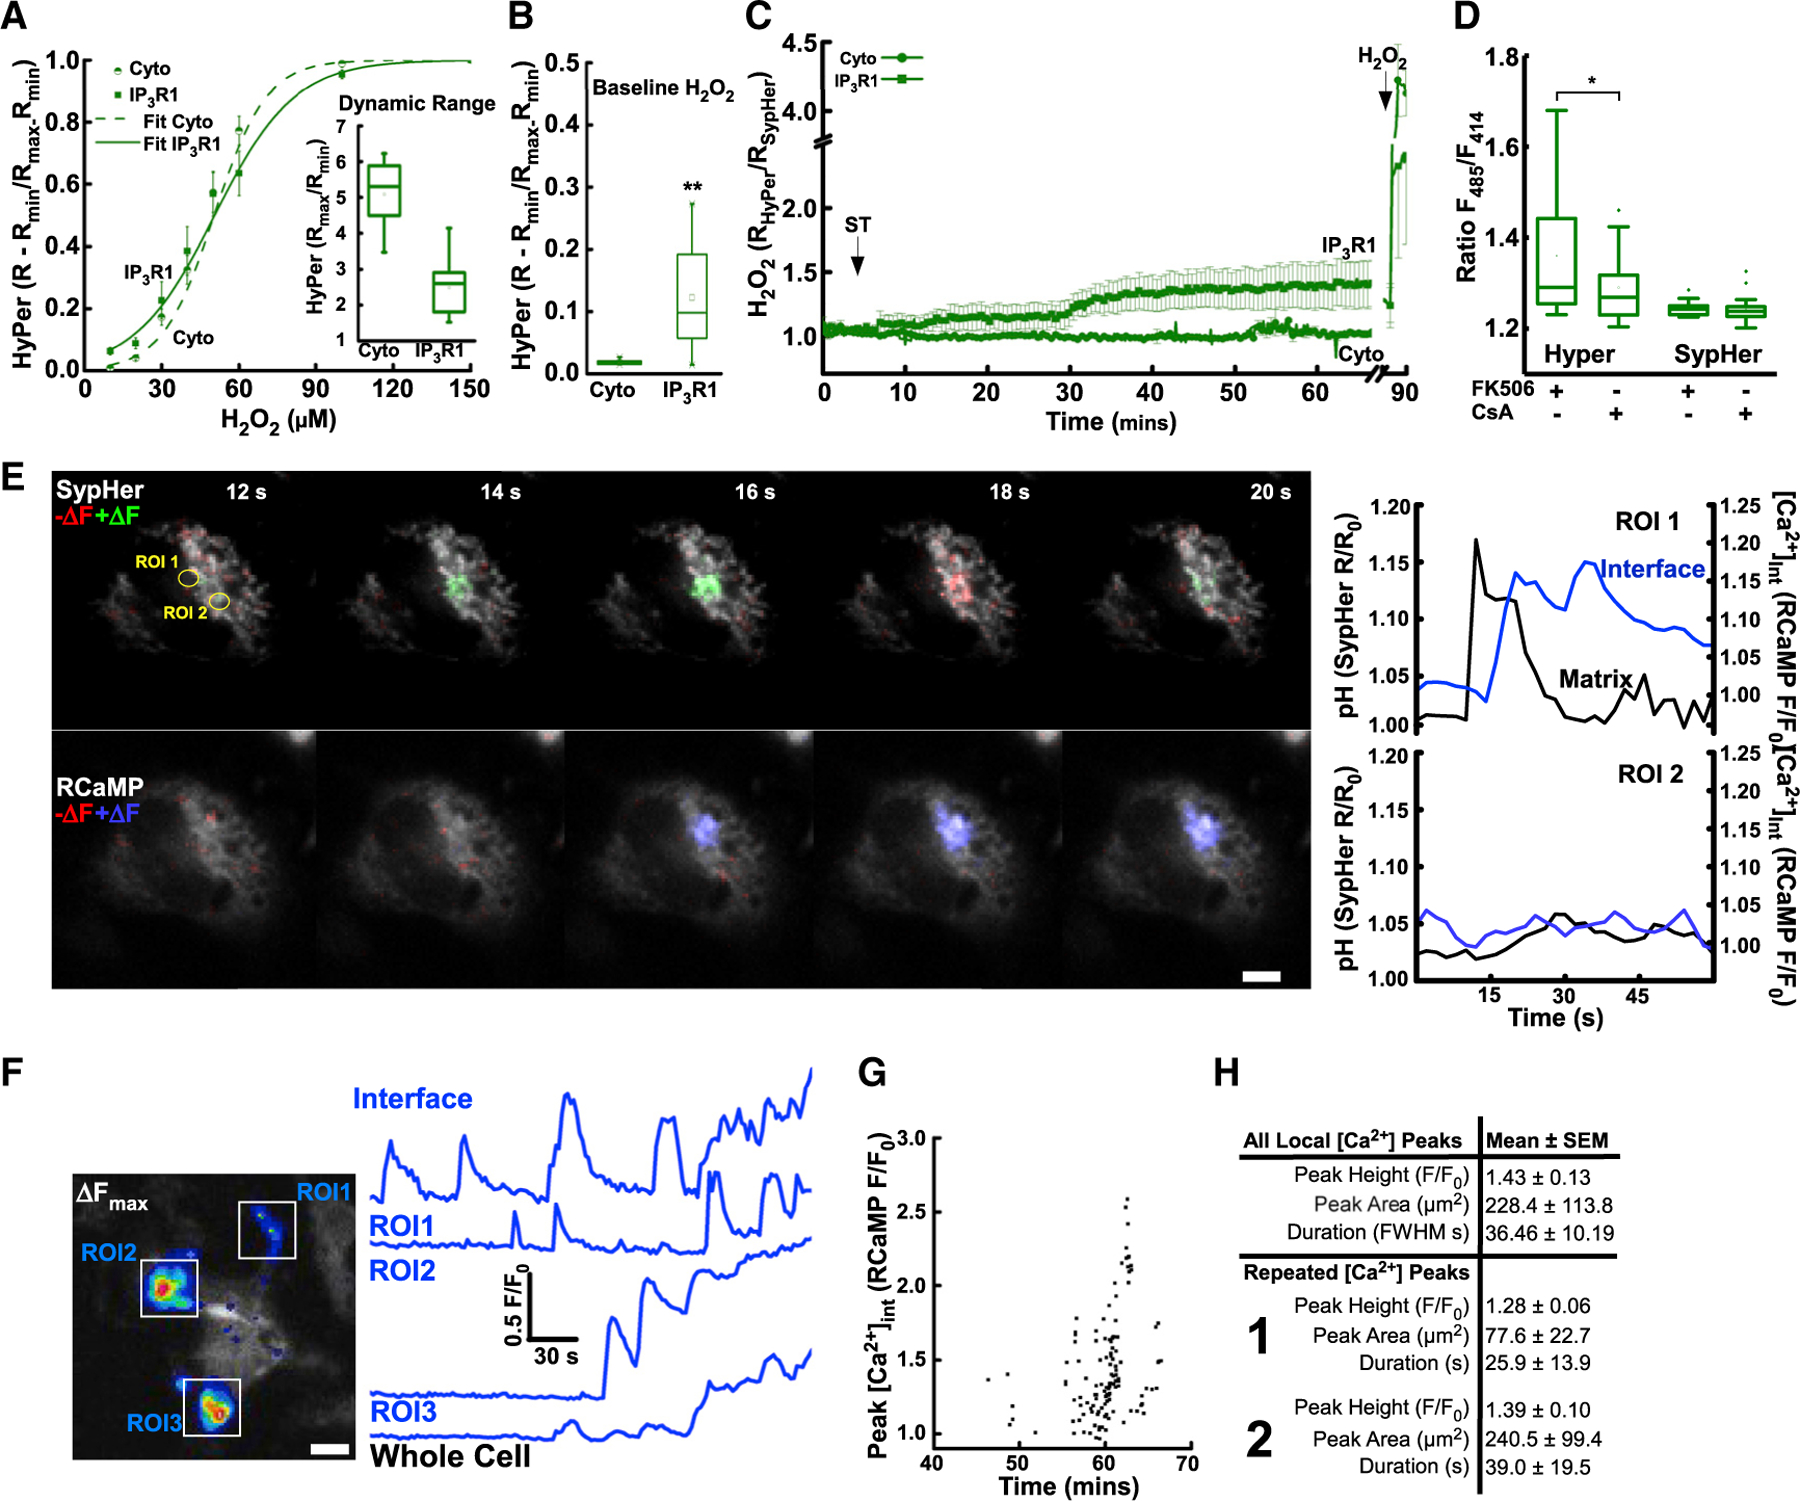
(A) Functional calibration of HyPer-IP3R1 versus cytosolic HyPer (Cyto) oxidized with stepwise H2O2 and fully reduced with DTT, mean ± SEM, with dose response (logistic) curve (fit). Inset: sensor dynamic range, ratio (Rmin: DTT) to (Rmax: H2O2).
(B) Baseline oxidation of HyPer cytosol (Cyto) or IP3R (IP3R1) in HepG2. **Significance, Mann-Whitney U = 9, p = 0.003.
(C) IP3R and cytosolic H2O2 levels following ST-induced flickers.
(D) ST-induced flicker oxidation of HyPer-IP3R and SypHer-IP3R control in the presence of CsA versus FK506 control.
(E) Flicker and local Ca2+ transient. Difference image analysis of matrix pH (SypHer480nm +ve and −ve change: first row +DF, green; −ΔF, blue). Difference imaging of interface Ca2+ (second row [Ca2+]Int RCaMP577nm +ve +DF, blue). pH (SypHer R/R0; black) and [Ca2+]Int (RCaMP F/F0; blue) (ROI 1, right upper; ROI 2, right lower). Lower: 3D renderings of matrix pH (SypHer 480/414 nm) and [Ca2+]Int (RCaMP, F577 nm) at 16 s time point.
(F) Independent subcellular release sites, maximum [Ca2+]Int in 300 s period increase (RCaMP577nm, ΔFmax). Traces of three independent release sites (ROI1–ROI3; and whole cell; lowest).
(G) Individual [Ca2+]Int transients, amplitude versus time.
(H) [Ca2+]Int amplitude (peak height, F/F0), area of [Ca2+]Int transient (peak area, µm2), and duration at half maximum amplitude. Repeated [Ca2+]Int with first (upper) and second iteration (lower) assessed separately. (A) inset, (B), and (D), mean, median, 25th/75th percentile and outliers. Scale bars, 10 µm.
Oxidation is an established modulator of IP3R-mediated [Ca2+]c signals, although experiments often rely upon exogenous oxidants (Joseph et al., 2018). To monitor local Ca2+ ([Ca2+]Int), we used interface-targeted linkers equipped with low-affinity RCaMP (Booth et al., 2016). We observed individual flicker events confined to single mitochondria (Figure 3E, ROI 1, upper images) followed by [Ca2+]Int elevations (Figure 3E, ROI 1, middle and lower three-dimensional [3D] reconstruction). The [Ca2+]Int transients were spatially confined, as demonstrated by the absence of change in other regions of the cell (Figure 3E, ROI 2). However, during repetitive flickering, the magnitude and the area of the [Ca2+]Int transients increased, and distant subcellular regions became engaged in [Ca2+]Int spiking in an unsynchronized manner (Figure 3F). When repeated [Ca2+]Int were considered separately, there was a progressive trend with amplitude, area, and duration (Figures 3G and 3H). The [Ca2+]Int transients increased in frequency and magnitude later (Figure 3G) than flicker activity (Figures 1F and 1G), and ER-mitochondrial interface oxidation (Figure 2C) emerged during challenge by ST. The relatively late appearance of the [Ca2+]Int events might be because of the lesser dynamic range and relatively low affinity of the Ca2+ sensor protein compared with the ΔΨm reporting dye.
To investigate the relevance of ΔΨm flicker activity upon interorganelle [Ca2+] signaling and cell stress caused by ST, we exploited HEK cells deficient in key proteins of the ER-mitochondrial Ca2+ transfer: MCU, the pore forming protein of the mitochondrial Ca2+ uniporter (MCU-KO) (Baughman et al., 2011; De Stefani et al., 2011), or all three isoforms of the IP3R channels (IP3R-TKO) (Alzayady et al., 2016). MCU-KO cells that fail to propagate cytoplasmic [Ca2+] signals to the mitochondria (De Stefani et al., 2011) showed increased flickering in response to ST. However, this response was attenuated relative to that observed in MCU-KO cells rescued by MCU (MCU-Rescue) (Figure 4A). Cell death, assessed by global permanent mitochondrial depolarization, followed a similar pattern with MCU-KO showing resistance (Figure 4C). The presence of a gradual [Ca2+]m rise in MCU-Rescue and its absence in the MCU-KO was directly validated by imaging mitochondrial matrix targeted Cepia (mtCepia) simultaneously with TMRE (Figure 4B). Notably, the slow upward change in MCU-KO (Figure 4B) documented by mtCepia, a single wavelength excitation and emission Ca2+ sensor, was absent when mtGEM-GECO, a ratiometric reporter was used, confirming the lack of a [Ca2+]m rise (Figure S4A).
Figure 4. Mitochondrial flicker activity interacts with ER-mitochondrial Ca2+ transport.
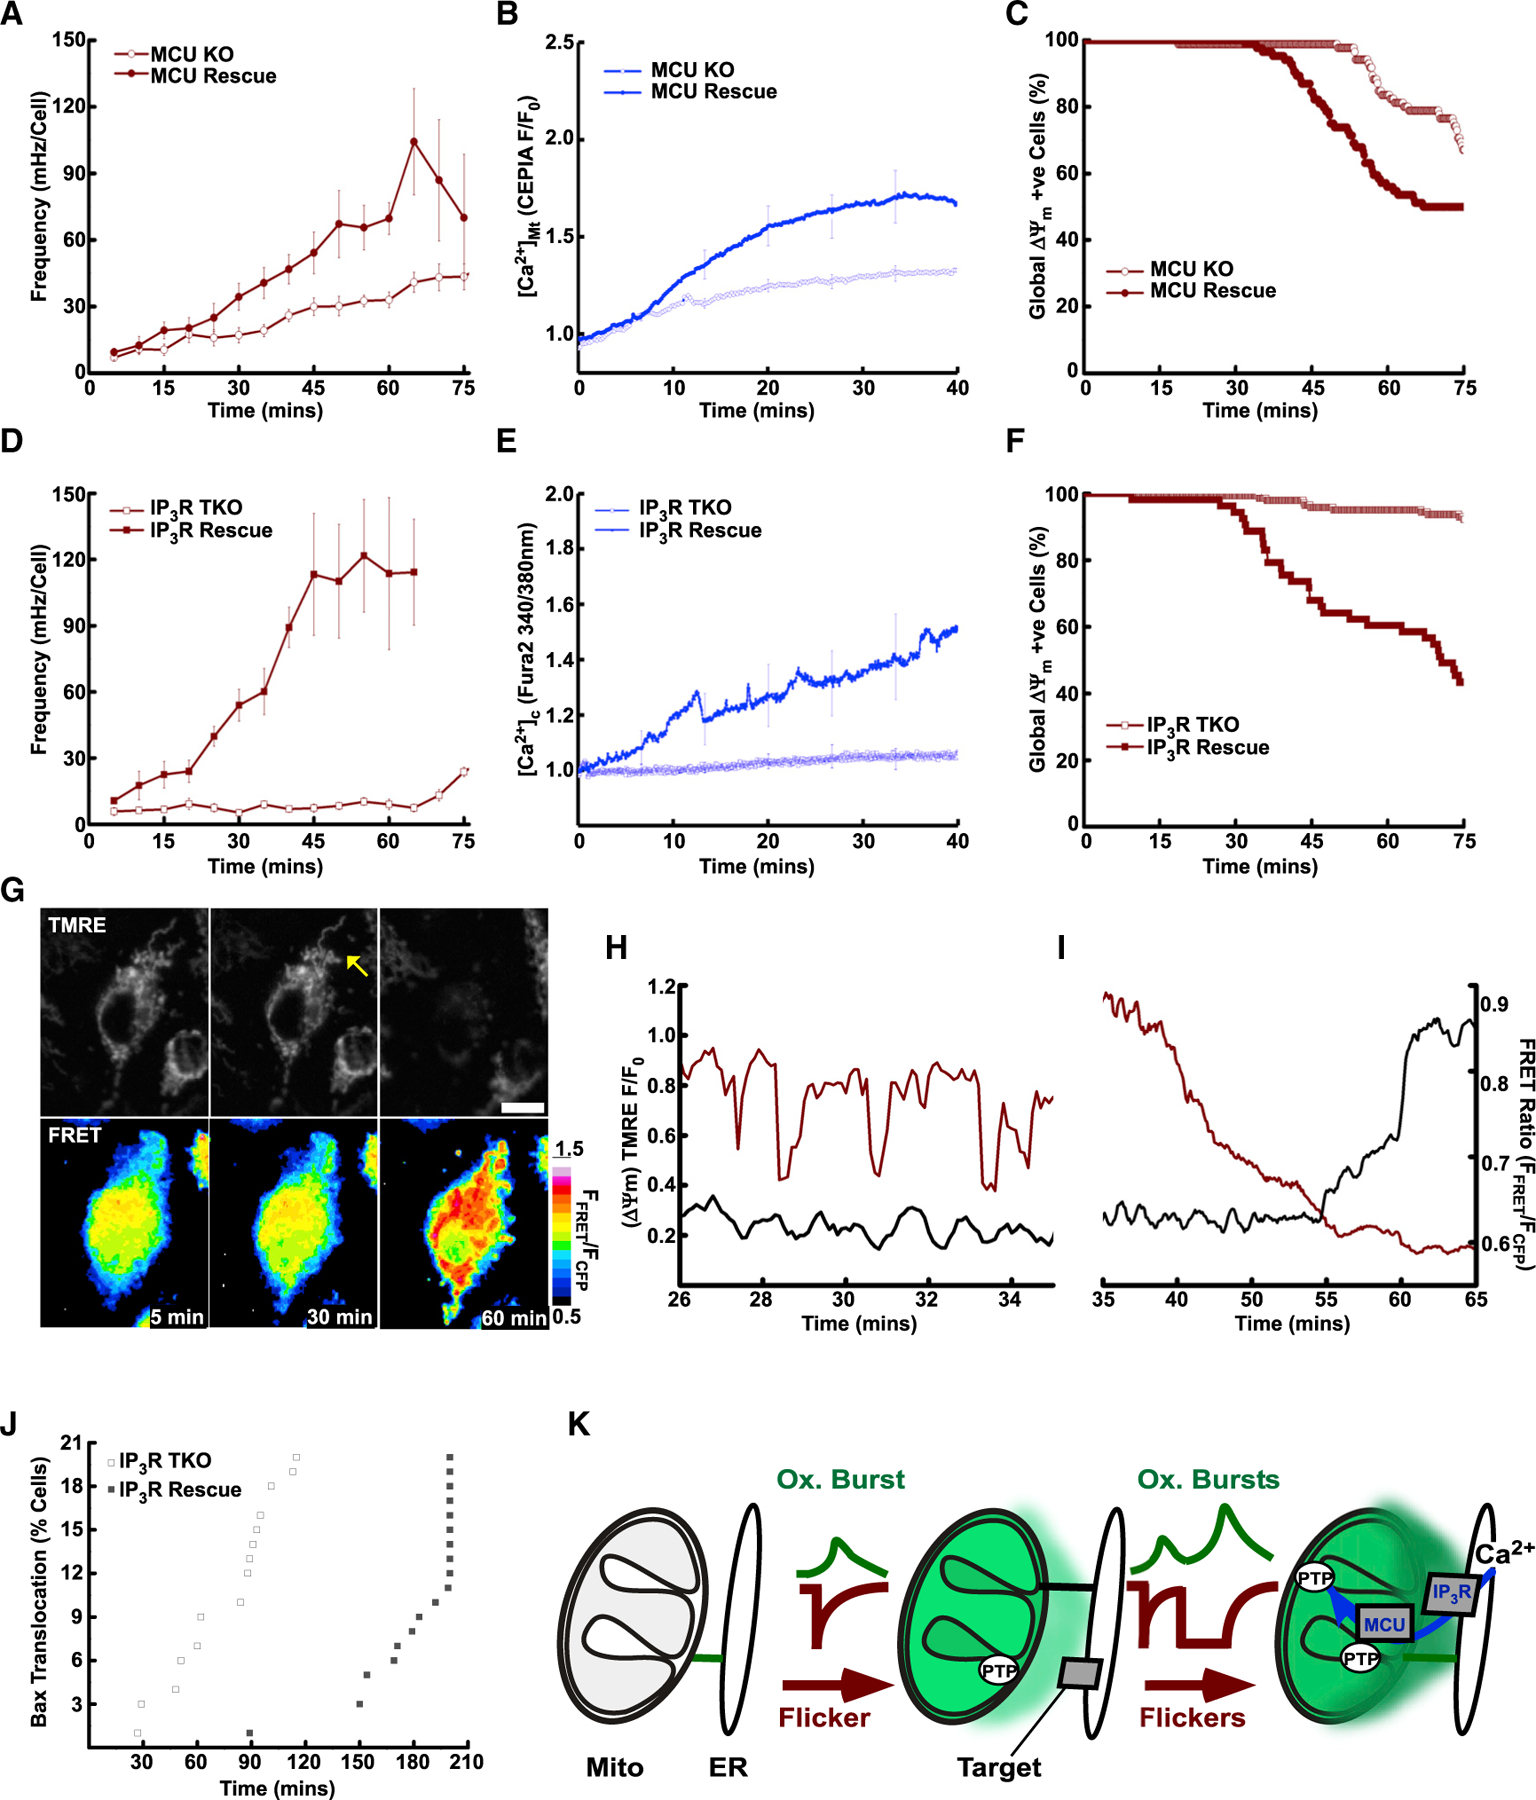
(A) Flicker frequency in MCU-KO and cells rescued with MCU-FLAG (MCU-Rescue; filled) following stimulation with ST.
(B) Matrix Ca2+ rise assessed with mtCEPIA3 ([Ca2+]Mt: CEPIA 485 nm F/F0) in MCU KO (empty) and Rescue (filled).
(C) Kaplan-Meier plots of cell survival indicated by permanent global depolarization of ΔΨm in MCU-KO (empty) and MCU-Rescue cells (filled).
(D) Flicker frequency in IP3R-TKO without (empty) and with YFP-IP3R1 rescue (IP3R Rescue; filled) following stimulation with ST (addition: 5 min).
(E) Changes in cytoplasmic Ca2+ measured with Fura2 ([Ca2+]Cyt Fura2 340/380 nm).
(F) Kaplan-Meier plots global ΔΨm loss in IP3R TKO and IP3R1 Rescue.
(G) ΔΨm (top) flicker (arrow) and terminal depolarization (right) of the mitochondrial network and oligomerization of Bax CFP-Bax and YFP-Bax FRET pair (lower).
(H) ΔΨm flickers (TMRM F/F0 red) with Bax FRET (FFRET/FCFP, black).
(I) Continuation of (H), Bax FRET increase (black) coincident with global ΔΨm loss (red).
(J) Bax oligomerization in IP3R TKO and IP3R Rescue cells treated with ST.
(K) Schematic of flicker-induced oxidation of the interface (green) engaging targets of the Ca2+ signaling network (IP3R&MCU). Scale bars, 10 µm.
(A), (B), (D), and (E) present mean ± SEM.
IP3R-TKO cells showed a modest and delayed increase in flickering upon ST treatment compared with cells acutely rescued with YFP-IP3R1 (IP3R Rescue) (Figure 4D). In IP3R Rescue, ST also elicited a rise in mean [Ca2+]C (Figure 4E) and global ΔΨm depolarization (Figure 4F). In the IP3R-TKO, these responses were absent (Figure 4E) and suppressed (Figure 4F), respectively. To further dissect the proposed mechanism of flicker-induced redox signals as an amplifier of flicker activity and cell fate, we used IP3R1 mutants deficient in Ca2+ release (IP3R1-Pore Dead) and redox sensitivity (IP3R1-Cys Less). Without Ca2+ release, IP3R1-Pore Dead rescue cells were indistinguishable from IP3R-TKO in terms of flicker amplification and depolarization of the mitochondrial network (Figures S4B and S4C, gold). Similarly, deletion of the cytosol-facing cysteine residues inhibited both facets (Figures S4B and S4C, blue). Together with the results in Figures 2 and 3, the relative resistance of MCU-KO and IP3R-TKO cells supports the general hypothesis that Ca2+ and redox pathways are engaged in mutual amplification and that redox nanodomain-induced sensitization of IP3R Ca2+ release is proximal to the MCU-mediated Ca2+ overload.
As ST is apoptogenic, we sought to understand how interorganelle redox signals fit with the apoptotic cascade, where mitochondria undergo Bax/Bak-mediated OMM permeabilization to release factors activating caspases and other cell executioner enzymes. First, we confirmed in HepG2 cells that flickering preceded global wave-like depolarization of the mitochondrial network, which in turn preceded two classical markers of apoptosis, activation of the executioner caspases 3/7 and condensation of the nucleus (Figure S4D). Furthermore, we were able to confirm in the HEK model that absence of IP3R profoundly effects executioner caspase activation (Figure S4E) downstream of both flickering and global depolarization of the mitochondrial population Figure S4F.
Second, we found that MEFs lacking Bax and Bak display ST-sensitive flickers and pH flashes indistinguishable from those in wild-type MEFs (Figures S4G and S4H), and these events were followed by oxidative bursts at the ER-mitochondrial interface (Figure S4I). Using HepG2 cells expressing both CFP-Bax and YFP-Bax (De Giorgi et al., 2002), we performed Förster resonance energy transfer (FRET) imaging to assay translocation and oligomerization of Bax to the mitochondrial surface simultaneously with recording the ΔΨm. ST treatment promotes a time-dependent increase and shift toward a mitochondrial distribution in the FRET signal (Figures S4J and S4K). ST-enhanced flickering started before the Bax FRET rose (Figures 4G and 4H), and concerted depolarization of the mitochondria was accompanied by a cell-wide increase in Bax FRET (Figures 4G and 4I). Furthermore, the time course of Bax FRET was insensitive to pre-incubation with the pan-caspase inhibitor Z-VAD-FMK (Figure S4L). Bax translocation was sensitive to IP3R expression because IP3R-TKO cells showed a marked delay in the Bax-FRET assay (Figure 4J). Thus, flickers/ER-mitochondrial oxidative bursts and the ensuing IP3R-mediated [Ca2+]Int spiking are upstream of Bax translocation and oligomerization, which precede the activation of the executioner caspases.
DISCUSSION
We have provided evidence that individual mitochondria can initiate communication with the neighboring ER stack by miniature oxidative bursts (Figure 4K, center). We validated the IP3Rs as a sensor of (Figure 4K, center) and responder to (Figure 4K, right) this redox signal. Under conditions of prolonged mitochondrial stress, this communication is reciprocated and amplified by IP3R-mediated Ca2+ release locally, supporting mitochondrial Ca2+ uptake (Figure 4K, right). In the cascade to cell death initiated by apoptotic stimuli such as ST, the miniature oxidative bursts and local Ca2+ feedback form cycles at the ER-mitochondrial interface, which precede and promote Bax translocation to the mitochondria.
We directly visualized the output of single mitochondrial flickers/flashes as frequency and amplitude modulated redox oscillations at the ER-mitochondrial interface. It has been shown that flickers originate from autonomous mitochondrial activity via mPTP opening and have an impact on some physiological and pathophysiological processes (Feng et al., 2017). However, we have expanded these studies to show the presence of a heterotypic retrograde communication with the neighboring ER. Redox signals broadcast by mitochondria are likely governed by proximity and not specific to ER-mitochondrial contacts. Closely apposed mitochondria show wave-like ROS-induced ROS release (Zorov et al., 2006), while junctions with other organelles interacting with mitochondria are likely exposed to similar local communication.
The local output directly impinges upon IP3R (Figure 3C), a redox sensor central to Ca2+ signaling (Joseph et al., 2018). We directly observe the transduction by the IP3R of the redox signal to local [Ca2+]Int spiking (Figures 3E–3H). The ER-mitochondrial interface redox signals often last longer (Figure 2) than the parental flickers/flashes, allowing a prolonged response, which is also controlled by the activity of enzymes reverting the oxidative modifications of the IP3R and other potential targets. Our recordings indicate that the interface redox and [Ca2+] fluctuations are commonly confined to the area of the flickering mitochondrion (Figures 2D and 3E), though repetitive [Ca2+]Int spikes were observed to spread to larger regions of the cell (Figure 3F).
Ca2+-redox systems interact dynamically, MCU and IP3R knockout and rescue show that Ca2+ release and mitochondrial Ca2+ uptake accelerate flicker activity (Figures 4A, 4B, 4D, and 4E), while flicker activity enhances Ca2+ release (Figure 3). That mPTP open probability is enhanced, synergistically, by oxidation and Ca2+ implies an amplification loop with oxidation increasing the Po of IP3R and Ca2+ enhancing the Po of the mPTP. Where flickers fit into early apoptosis remains to be elucidated, but studies have reported increased, decreased, or heterogeneous mitochondrial membrane potentials that may be explained by flickers (Molinari et al., 2017; Salvioli et al., 2000), and our data show that Bax and caspase activation are downstream of flickers, Ca2+, and depolarization of the mitochondrial network (Figures 4G–4I; Figures S4D–S4F). Conversely, in the absence of Bax/Bak, flickers are unaffected (Figures S4G–S4I), suggesting no upstream role for these proteins.
The physiological function for interface redox signals is linked here to apoptosis but likely extends further. Homeostatic crosstalk can also occur with Ca2+ signals. An example scenario is when an oxidized pyridine pool stimulates a mitochondrion to flicker and, in turn, selectively generate local Ca2+ release. Subsequent Ca2+ stimulated Krebs cycle activity would enhance metabolite flow and promote NAD(P)+ reduction, restoring homeostasis. Current technology allowed us to dissect a pathway initiated by oxidation of an adjacent subset of the IP3Rs, but many other interface-resident proteins are likely targets of oxidizing signals and can serve as mediators of functional changes. In our cellular stress paradigm, the individual mitochondrial oxidative bursts were amplified and propagated via positive feedback loops. However, one can speculate about situations in which the response to the mitochondrial signal is confined to the same mitochondrion. For example, the quality control of a damaged mitochondrion might involve heterotypic organellar talk to promote selective mitophagy (Barazzuol et al., 2020). Last, the increasing ties between mitochondrial dysfunction and ER-mitochondrial contacts in a wide range of diseases, including various neurodegenerative and metabolic diseases (Filadi et al., 2017), stimulate studying a possible role for impaired communication between mitochondrion and neighboring organelles.
Limitations
The instantaneous ΔΨm loss during short-lasting flickers might have been tracked inaccurately because of the diffusion kinetics of TMRE and the time resolution of the imaging, which must be balanced against phototoxicity. In addition to the redox bursts, the flicker-linked perimitochondrial pH changes (Figure 1L) can also serve signaling (e.g., acidification increases local [Ca2+]). Notably, IP3Rs fail to sense a pH change (Figures S3A and S3B), and acidification would be a negative regulator of the IP3R-mediated Ca2+ release (De Smet et al., 1999). Our measurements of the ER-mitochondrial interface use inducible tethering species. Although the induction used here did not alter the two-dimensional (2D) ultrastructure of the contacts (Csordás et al., 2010), changes in the contact dynamics cannot be excluded. Also, future studies will be needed to test if the quality and quantity of contact sites are altered by Oligo and ST treatment, because this might shape the effect of the local oxidative bursts.
STAR★METHODS
RESOURCE AVAILABILITY
Lead contact
Further information and requests for resources and reagents should be directed to and will be fulfilled by the lead contact, György Hajnóczky (gyorgy.hajnoczky@jefferson.edu).
Materials availability
Plasmids generated in this study are freely available upon request from the lead contact.
Data and code availability
Original imaging data have been deposited atMendeley Data: https://doi.org/10.17632/h4k9tk8y53.1 and are publicly available as of the date of publication. DOIs are listed in the key resources table.
This paper does not report original code.
Any additional information required to reanalyze the data reported in this paper is available from the lead contact upon request.
KEY RESOURCES TABLE
| REAGENT or RESOURCE | SOURCE | IDENTIFIER |
|---|---|---|
| Chemicals, peptides, and recombinant proteins | ||
| CellEvent | ThermoFisher | C10423 |
| Cyclosporine A | Enzo | BML-A195 |
| Fura-2 (AM) | Teflabs | 0–103 |
| Lipofectamine 3000 | Life Technologies | L3000008 |
| Oligomycin | Enzo | ALX-380–037 |
| FK506 | Enzo | ALX-380–008 |
| Staurosporine | Enzo | ALX-380–014 |
| Tetramethylrhodamine, Ethyl Ester, Perchlorate | ThermoFisher | T669 |
| Deposited data | ||
| Grx1roGFP2 415nm (Oxidized).tif | This paper | DOI: http://dx.doi.org/10.17632/h4k9tk8y53.1#file-41147cb6-c623–40fc-8bb8–3c9c6bb87f37 |
| Grx1roGFP2 485nm (Reduced).tif | This paper | DOI: http://dx.doi.org/10.17632/h4k9tk8y53.1#file-975a3d95–247f-43a8–9613-05a97e72ef5d |
| Mitochondrial Membrane Potential (TMRE F577nm).tif | This paper | DOI: http://dx.doi.org/10.17632/h4k9tk8y53.1#file-9f805b22–703e-47a8–8626-6cf76e95a76b |
| Experimental models: Cell lines | ||
| HepG2 | ATCC | 30–2003 |
| HEK293T MCU-KO | Sancak et al., 2013 | N/A |
| HEK293 IP3R TKO | Alzayady et al., 2016 | N/A |
| Recombinant DNA | ||
| Hyper/SypHer-HA-FRB-rIP3R1 | This paper | N/A |
| ER-M Grx1roGFP2/RCaMP | This paper | N/A |
| OMM Grx1roGFP2/RCaMP | This paper | N/A |
| MtGEM-GECO | Zhao et al 2011 | N/A |
| MtCepia | Paillard et al 2018 | N/A |
| Software and algorithms | ||
| Canvas X | N/A | https://www.canvasgfx.com/ |
| OriginPro 2017 | OriginLabs | https://www.originlab.com/2017 |
| Fiji | https://imagej.net/Fiji | 1.42 |
EXPERIMENTAL MODEL AND SUBJECT DETAILS
Cell lines
HepG2 cells were acquired from ATCC and cultured in EMEM (ATCC, Cat# 30–2003) supplemented with 10% FBS (GIBCO, Cat# 16000 004), Penicillin/Streptomycin (Lonza, Cat# 17602E) and 2mM glutamine (GIBCO, Cat# 25030–81). MCU-KO (Sancak et al., 2013) and IP3R-TKO HEK293 cells (Alzayady et al., 2016) and Bax/Bak DKO MEF cells (Roy et al., 2009) were cultured in DMEM (high glucose, ATCC, Cat# 30–2002) with identical supplements. Cells were transfected with Lipofectamine 3000 (ThermoFisher Scientific Cat#: L300000) according to manufacturer’s instructions.
METHOD DETAILS
DNA constructs for subcellular redox/Ca2+ measurements
Cytosol and mitochondrial matrix-targeted HyPer, SypHer (Enyedi et al., 2010; Poburko et al., 2011), Grx1roGFP2 (Gutscher et al., 2008) and RCaMP (Akerboom et al., 2013) plasmids were integrated into drug-inducible linker constructs as previously described (Booth et al., 2016). Hyper/SypHer-HA-FRB-rIP3R1 was created by replacing the mCherry in the mCherry-rIP3R1 (pEGFP-C1 back-bone) (Alzayady et al., 2016) with the Sypher/Hyper-HA-FRB fusion protein from the previously used ER-targeted construct (Booth et al., 2016) using the NdeI/XhoI restriction sites. This design did not affect the previously existing linker between Hyper and HA-FRB (YSDLELKLT) and resulted in a short linker (GSRA) between HA-FRB and the rat IP3R1. CFP-Bax and YFP-Bax were as described(De Giorgi et al., 2002). [Ca2+]Mt was assessed using mitochondrially targeted CEPIA (pCMV CEPIA3mt, Addgene: Cat#58219) as described (Suzuki et al., 2014) or GEM-GECO (CMV-mito-GEM-GECO1 Addgene: Cat#32461) as described (Zhao et al., 2011).
Live cell imaging
Cells were pre-incubated in an extracellular-like medium ECM; 121 mM NaCl, 5 mM NaHCO3, 4.7 mM KCl, 1.2 mM KH2PO4, 1.2 mM MgSO4, 2 mM CaCl2,10 mM Na-HEPES, pH 7.4, and 10 mM glucose, containing 2% BSA. For imaging, cells were washed and transferred to a similar solution containing reduced BSA (0.25%) as described (Booth et al., 2016). Mitochondrial membrane potential (ΔΨm) was assessed by equilibrating cells in 20 nM tetramethylrhodamine ethyl-ester (TMRE, Thermo Fisher Cat# T669) until stable and maintained throughout. Calcein-AM Co2+ assay was adapted from (Petronilli et al., 1999). Briefly, cells were incubated in 1µM Calcein-AM (ThermoFisher Scientific Cat #: C3100MP) dissolved with 0.03% Pluronic F127 (ThermoFisher Scientific Cat: # P6867) for 30mins @ 37°C in the presence of 1mM Co2+ and absence of sulfinpyrazone. Following washing, cells were imaged ± Oligomycin (Oligo, 2.5 µM) or Staurosporine (ST, 2µM; Enzo Cat# ALX-380–014), cyclosporine A (CsA, 5µM). In all ΔΨm experiments a depolarization cocktail of 5 µM FCCP, 2.5 µM Oligo was added at the end of each experiment as a reference.
[Ca2+]C was assessed using cells loaded with 1µM Fura2-AM (ThermoFisher Scientific Cat# F1221) in the presence of 0.03% pluronic F127 ThermoFisher Scientific Cat# P6867) and 200µM sulfinpyrazone (Sigma; S9509) for 20 mins at 30°C. Following loading, cells were washed and placed into the imaging media with 200µM sulfinpyrazone present throughout.
Linker constructs were concentrated to the interface as described (Booth et al., 2016). Briefly, cells were subject to a pulse of rapamycin (3 mins, 100 nM. Enzo, Cat# BML-A275), washed, then a pulse of FK506 (3 mins, 5µM. Enzo, Cat# ALX-380–008) and washed again before imaging.
Super resolution imaging was performed with a Zeiss LSM 880 Airyscan system using 488 and 561 nm lines. Images sequences (xyxt) were collected with 3 z-slices separated by 170nm collected at 5 s intervals. Initial image processing was performed with Zen2.3 software (Carl Zeiss, NY).
Epifluorescence imaging of GSSG:GSH, pH, [Ca2+]c, [Ca2+]m, [Ca2+]Int, and ΔΨm was carried out using a back-illuminated electron multiplying charge-coupled device (EMCCD) camera (EvolveEM 512×512 pixel. Photometrics), mounted to an Olympus IX70 inverted microscope or Hamamatsu ImageEM mounted to an Olympus IX81 fitted with a Prior H117 motorized stage. Both microscopes were equipped with a Sutter DG4 light source. Fluorescence excitation was achieved with a custom dichroic derived from Chroma #59022 modified to enhance short wavelength excitation and bandpass filters specific to fluorophores. HyPer, SypHer and Grx1roGFP2 were imaged with dual excitation of 414/10 & 480/15nm combined with a 515/30 nm emission filter to mitigate crosstalk with TMRE. Fura2: 340/11 and 380/11 nm CEPIA: 480/15 nm and TMRE/RCaMP excited using a 577/25 nm filter. Typical time resolution was 3 s. GEM-GECO was imaged using 402 nm excitation and 465/535 nm emission peaks.
Image analysis
Analysis was carried out using the FIJI variant of ImageJ (NIH, versions 1.42&1.52). Images were subject to background subtraction and registration (MultiStackreg plugin, registration matrices applied equally to all wavelengths). Flicker events were identified by creating stack difference image series of TMRE fluorescence images in FIJI with 3 s time offset and active mitochondria masked manually, and the graph kinetics curated to exclude movement artifacts. Flicker frequency was determined by counting ΔΨm depolarization events/s/cell. Calcein fluorescence was obtained from whole-cell ROI and compared to TMRE in the same ROI over time. GSSG:GSH was calculated using the formula (R-Rmin)/(Rmax-Rmin) where Rmin & Rmax values were obtained via complete reduction (DTT) and oxidation (H2O2) of Grx1roGFP at the end of each experiment. A similar procedure is performed for HyPer.
QUANTIFICATION AND STATISTICAL ANALYSIS
Data were subject to normality tests to guide selection of statistical tests. 2 component hypothesis testing was carried out with Student’s t Tests or Mann-Whitney u test. Multiple variable data was assessed with 2-way ANOVA and subject to Bonferoni post hoc analysis, or Kruskal-Wallis test as labeled. P values of < 0.05 (*) or < 0.01 (**) were considered significant. All measurements were repeated with a minimum of 5 separate experiments from each of ≥ 3 independent cell preparations, cell numbers are indicated in legends.
Supplementary Material
Highlights.
Single mitochondria generate oxidative bursts at the ER-mitochondrial interface
Bursts are initiated by openings of the permeability transition pore
ER Ca2+ release channels are sensitized by interface oxidation
Oxidative bursts constitute nanoscale retrograde redox signals
ACKNOWLEDGMENTS
We thank David Weaver for help with automated analysis, Janine H. Santos for comments on the manuscript, Dr. Vamsi Mootha for MCU-KO cells and plasmids, Dr. David I. Yule for IP3R TKO cells, Dr. Nicolas Demaurex for HyPer/SypHer plasmids, Dr. Lawrence Robb-Gaspers for Grx1roGFP2, and Dr. Franç ois Ichas for CFP/YFP Bax. This work was supported by NIH grants GM59419, ES025672, 5T32AA007463, and a Foundation Leducq Mitocardia grant to G.H.
Footnotes
SUPPLEMENTAL INFORMATION
Supplemental information can be found online at https://doi.org/10.1016/j.molcel.2021.07.014.
DECLARATION OF INTERESTS
The authors declare no competing interests.
INCLUSION AND DIVERSITY
The author list of this paper includes contributors from the location where the research was conducted who participated in the data collection, design, analysis, and/or interpretation of the work.
REFERENCES
- Akerboom J, Carreras Calderón N, Tian L, Wabnig S, Prigge M, Tolö J, Gordus A, Orger MB, Severi KE, Macklin JJ, et al. (2013). Genetically encoded calcium indicators for multi-color neural activity imaging and combination with optogenetics. Front. Mol. Neurosci 6, 2. [DOI] [PMC free article] [PubMed] [Google Scholar]
- Alzayady KJ, Wang L, Chandrasekhar R, Wagner LE 2nd, Van Petegem F, and Yule DI (2016). Defining the stoichiometry of inositol 1,4,5-trisphosphate binding required to initiate Ca2+ release. Sci. Signal 9, ra35. [DOI] [PMC free article] [PubMed] [Google Scholar]
- Aon MA, Cortassa S, Marbán E, and O’Rourke B. (2003). Synchronized whole cell oscillations in mitochondrial metabolism triggered by a local release of reactive oxygen species in cardiac myocytes. J. Biol. Chem 278, 44735–44744. [DOI] [PubMed] [Google Scholar]
- Aryaman J, Johnston IG, and Jones NS (2019). Mitochondrial heterogeneity. Front. Genet 9, 718. [DOI] [PMC free article] [PubMed] [Google Scholar]
- Bánsághi S, Golenár T, Madesh M, Csordás G, RamachandraRao S, Sharma K, Yule DI, Joseph SK, and Hajnóczky G. (2014). Isoform- and species-specific control of inositol 1,4,5-trisphosphate (IP3) receptors by reactive oxygen species. J. Biol. Chem 289, 8170–8181. [DOI] [PMC free article] [PubMed] [Google Scholar]
- Barazzuol L, Giamogante F, Brini M, and Calì T. (2020). PINK1/parkin mediated mitophagy, Ca2+ signalling, and ER-mitochondria contacts in Parkinson’s disease. Int. J. Mol. Sci 21, 1772. [DOI] [PMC free article] [PubMed] [Google Scholar]
- Baughman JM, Perocchi F, Girgis HS, Plovanich M, Belcher-Timme CA, Sancak Y, Bao XR, Strittmatter L, Goldberger O, Bogorad RL, et al. (2011). Integrative genomics identifies MCU as an essential component of the mitochondrial calcium uniporter. Nature 476, 341–345. [DOI] [PMC free article] [PubMed] [Google Scholar]
- Booth DM, Enyedi B, Geiszt M, Várnai P, and Hajnóczky G. (2016). Redox nanodomains are induced by and control calcium signaling at the ER-mitochondrial interface. Mol. Cell 63, 240–248. [DOI] [PMC free article] [PubMed] [Google Scholar]
- Butow RA, and Avadhani NG (2004). Mitochondrial signaling: the retrograde response. Mol. Cell 14, 1–15. [DOI] [PubMed] [Google Scholar]
- Csordás G, Renken C, Várnai P, Walter L, Weaver D, Buttle KF, Balla T, Mannella CA, and Hajnóczky G. (2006). Structural and functional features and significance of the physical linkage between ER and mitochondria. J. Cell Biol 174, 915–921. [DOI] [PMC free article] [PubMed] [Google Scholar]
- Csordás G, Várnai P, Golenár T, Roy S, Purkins G, Schneider TG, Balla T, and Hajnóczky G. (2010). Imaging interorganelle contacts and local calcium dynamics at the ER-mitochondrial interface. Mol. Cell 39, 121–132. [DOI] [PMC free article] [PubMed] [Google Scholar]
- Csordás G, Weaver D, and Hajnóczky G. (2018). Endoplasmic reticulum-mitochondrial contactology: structure and signaling functions. Trends Cell Biol. 28, 523–540. [DOI] [PMC free article] [PubMed] [Google Scholar]
- De Giorgi F, Lartigue L, Bauer MK, Schubert A, Grimm S, Hanson GT, Remington SJ, Youle RJ, and Ichas F. (2002). The permeability transition pore signals apoptosis by directing Bax translocation and multimerization. FASEB J 16, 607–609. [DOI] [PubMed] [Google Scholar]
- De Smet P, Parys JB, Vanlingen S, Bultynck G, Callewaert G, Galione A, De Smedt H, and Missiaen L. (1999). The relative order of IP3 sensitivity of types 1 and 3 IP3 receptors is pH dependent. Pflugers Arch 438, 154–158. [DOI] [PubMed] [Google Scholar]
- De Stefani D, Raffaello A, Teardo E, Szabò I, and Rizzuto R. (2011). A forty-kilodalton protein of the inner membrane is the mitochondrial calcium uniporter. Nature 476, 336–340. [DOI] [PMC free article] [PubMed] [Google Scholar]
- Demaurex N, and Schwarzlönder M. (2016). Mitochondrial flashes: dump superoxide and dance with protons now. Antioxid. Redox Signal 25, 550–551. [DOI] [PMC free article] [PubMed] [Google Scholar]
- Duchen MR, Leyssens A, and Crompton M. (1998). Transient mitochondrial depolarizations reflect focal sarcoplasmic reticular calcium release in single rat cardiomyocytes. J. Cell Biol 142, 975–988. [DOI] [PMC free article] [PubMed] [Google Scholar]
- Enyedi B, Várnai P, and Geiszt M. (2010). Redox state of the endoplasmic reticulum is controlled by Ero1L-alpha and intraluminal calcium. Antioxid. Redox Signal. 13, 721–729. [DOI] [PubMed] [Google Scholar]
- Fan Y, and Simmen T. (2019). Mechanistic connections between endoplasmic reticulum (ER) redox control and mitochondrial metabolism. Cells 8, 1071. [DOI] [PMC free article] [PubMed] [Google Scholar]
- Feng G, Liu B, Hou T, Wang X, and Cheng H. (2017). Mitochondrial flashes: elemental signaling events in eukaryotic cells. Handb. Exp. Pharmacol 240, 403–422. [DOI] [PubMed] [Google Scholar]
- Filadi R, Theurey P, and Pizzo P. (2017). The endoplasmic reticulum-mitochondria coupling in health and disease: Molecules, functions and significance. Cell Calcium 62, 1–15. [DOI] [PubMed] [Google Scholar]
- Giacomello M, Pyakurel A, Glytsou C, and Scorrano L. (2020). The cell biology of mitochondrial membrane dynamics. Nat. Rev. Mol. Cell Biol 21, 204–224. [DOI] [PubMed] [Google Scholar]
- Gutscher M, Pauleau AL, Marty L, Brach T, Wabnitz GH, Samstag Y, Meyer AJ, and Dick TP (2008). Real-time imaging of the intracellular glutathione redox potential. Nat. Methods 5, 553–559. [DOI] [PubMed] [Google Scholar]
- Hüser J, and Blatter LA (1999). Fluctuations in mitochondrial membrane potential caused by repetitive gating of the permeability transition pore. Biochem. J 343, 311–317. [PMC free article] [PubMed] [Google Scholar]
- Joseph SK, Young MP, Alzayady K, Yule DI, Ali M, Booth DM, and Hajnóczky G. (2018). Redox regulation of type-I inositol trisphosphate receptors in intact mammalian cells. J. Biol. Chem 293, 17464–17476. [DOI] [PMC free article] [PubMed] [Google Scholar]
- Kojer K, Bien M, Gangel H, Morgan B, Dick TP, and Riemer J. (2012). Glutathione redox potential in the mitochondrial intermembrane space is linked to the cytosol and impacts the Mia40 redox state. EMBO J 31, 3169–3182. [DOI] [PMC free article] [PubMed] [Google Scholar]
- Madreiter-Sokolowski CT, Ramadani-Muja J, Ziomek G, Burgstaller S, Bischof H, Koshenov Z, Gottschalk B, Malli R, and Graier WF (2019). Tracking intra- and inter-organelle signaling of mitochondria. FEBS J 286, 4378–4401. [DOI] [PMC free article] [PubMed] [Google Scholar]
- Martínez-Reyes I, and Chandel NS (2020). Mitochondrial TCA cycle metabolites control physiology and disease. Nat. Commun 11, 102. [DOI] [PMC free article] [PubMed] [Google Scholar]
- Molinari F, Pin F, Gorini S, Chiandotto S, Pontecorvo L, Penna F, Rizzuto E, Pisu S, Musarò A, Costelli P., et al. (2017). The mitochondrial metabolic reprogramming agent trimetazidine as an ‘exercise mimetic’ in cachectic C26-bearing mice. J. Cachexia Sarcopenia Muscle 8, 954–973. [DOI] [PMC free article] [PubMed] [Google Scholar]
- Morciano G, Marchi S, Morganti C, Sbano L, Bittremieux M, Kerkhofs M, Corricelli M, Danese A, Karkucinska-Wieckowska A, Wieckowski MR, et al. (2018). Role of mitochondria-associated ER membranes in calcium regulation in cancer-specific settings. Neoplasia 20, 510–523. [DOI] [PMC free article] [PubMed] [Google Scholar]
- Nieminen AL, Saylor AK, Tesfai SA, Herman B, and Lemasters JJ (1995). Contribution of the mitochondrial permeability transition to lethal injury after exposure of hepatocytes to t-butylhydroperoxide. Biochem. J 307, 99–106. [DOI] [PMC free article] [PubMed] [Google Scholar]
- Oakes SA, Opferman JT, Pozzan T, Korsmeyer SJ, and Scorrano L. (2003). Regulation of endoplasmic reticulum Ca2+ dynamics by proapoptotic BCL-2 family members. Biochem. Pharmacol 66, 1335–1340. [DOI] [PubMed] [Google Scholar]
- Petronilli V, Miotto G, Canton M, Colonna R, Bernardi P, and Di Lisa F. (1998). Imaging the mitochondrial permeability transition pore in intact cells. Biofactors 8, 263–272. [DOI] [PubMed] [Google Scholar]
- Petronilli V, Miotto G, Canton M, Brini M, Colonna R, Bernardi P, and Di Lisa F. (1999). Transient and long-lasting openings of the mitochondrial permeability transition pore can be monitored directly in intact cells by changes in mitochondrial calcein fluorescence. Biophys. J 76, 725–734. [DOI] [PMC free article] [PubMed] [Google Scholar]
- Poburko D, Santo-Domingo J, and Demaurex N. (2011). Dynamic regulation of the mitochondrial proton gradient during cytosolic calcium elevations. J. Biol. Chem 286, 11672–11684. [DOI] [PMC free article] [PubMed] [Google Scholar]
- Raffaello A, Mammucari C, Gherardi G, and Rizzuto R. (2016). Calcium at the center of cell signaling: interplay between endoplasmic reticulum, mitochondria, and lysosomes. Trends Biochem. Sci 41, 1035–1049. [DOI] [PMC free article] [PubMed] [Google Scholar]
- Roy SS, Ehrlich AM, Craigen WJ, and Hajnóczky G. (2009). VDAC2 is required for truncated BID-induced mitochondrial apoptosis by recruiting BAK to the mitochondria. EMBO Rep 10, 1341–1347. [DOI] [PMC free article] [PubMed] [Google Scholar]
- Rydström J. (2006). Mitochondrial NADPH, transhydrogenase and disease. Biochim. Biophys. Acta 1757, 721–726. [DOI] [PubMed] [Google Scholar]
- Salvioli S, Dobrucki J, Moretti L, Troiano L, Fernandez MG, Pinti M, Pedrazzi J, Franceschi C, and Cossarizza A. (2000). Mitochondrial heterogeneity during staurosporine-induced apoptosis in HL60 cells: analysis at the single cell and single organelle level. Cytometry 40, 189–197. [DOI] [PubMed] [Google Scholar]
- Sancak Y, Markhard AL, Kitami T, Kovács-Bogdán E, Kamer KJ, Udeshi ND, Carr SA, Chaudhuri D, Clapham DE, Li AA, et al. (2013). EMRE is an essential component of the mitochondrial calcium uniporter complex. Science 342, 1379–1382. [DOI] [PMC free article] [PubMed] [Google Scholar]
- Santo-Domingo J, Giacomello M, Poburko D, Scorrano L, and Demaurex N. (2013). OPA1 promotes pH flashes that spread between contiguous mitochondria without matrix protein exchange. EMBO J 32, 1927–1940. [DOI] [PMC free article] [PubMed] [Google Scholar]
- Sies H, and Jones DP (2020). Reactive oxygen species (ROS) as pleiotropic physiological signalling agents. Nat. Rev. Mol. Cell Biol 21, 363–383. [DOI] [PubMed] [Google Scholar]
- Suzuki J, Kanemaru K, Ishii K, Ohkura M, Okubo Y, and Iino M. (2014). Imaging intraorganellar Ca2+ at subcellular resolution using CEPIA. Nat. Commun 5, 4153. [DOI] [PMC free article] [PubMed] [Google Scholar]
- Tan JX, and Finkel T. (2020). Mitochondria as intracellular signaling platforms in health and disease. J. Cell Biol 219, e202002179. [DOI] [PMC free article] [PubMed] [Google Scholar]
- Vallese F, Barazzuol L, Maso L, Brini M, and Calì T. (2020). ER-mitochondria calcium transfer, organelle contacts and neurodegenerative diseases. Adv. Exp. Med. Biol 1131, 719–746. [DOI] [PubMed] [Google Scholar]
- Wang W, Fang H, Groom L, Cheng A, Zhang W, Liu J, Wang X, Li K, Han P, Zheng M., et al. (2008). Superoxide flashes in single mitochondria. Cell 134, 279–290. [DOI] [PMC free article] [PubMed] [Google Scholar]
- Wang X, Jian C, Zhang X, Huang Z, Xu J, Hou T, Shang W, Ding Y, Zhang W, Ouyang M., et al. (2012). Superoxide flashes: elemental events of mitochondrial ROS signaling in the heart. J. Mol. Cell. Cardiol 52, 940–948. [DOI] [PubMed] [Google Scholar]
- Wang X, Zhang X, Huang Z, Wu D, Liu B, Zhang R, Yin R, Hou T, Jian C, Xu J., et al. (2016). Protons trigger mitochondrial flashes. Biophys. J 111, 386–394. [DOI] [PMC free article] [PubMed] [Google Scholar]
- Zhao Y, Araki S, Wu J, Teramoto T, Chang YF, Nakano M, Abdelfattah AS, Fujiwara M, Ishihara T, Nagai T, and Campbell RE (2011). An expanded palette of genetically encoded Ca2+ indicators. Science 333, 1888–1891. [DOI] [PMC free article] [PubMed] [Google Scholar]
- Zorov DB, Juhaszova M, and Sollott SJ (2006). Mitochondrial ROS-induced ROS release: an update and review. Biochim. Biophys. Acta 1757, 509–517. [DOI] [PubMed] [Google Scholar]
Associated Data
This section collects any data citations, data availability statements, or supplementary materials included in this article.
Supplementary Materials
Data Availability Statement
Original imaging data have been deposited atMendeley Data: https://doi.org/10.17632/h4k9tk8y53.1 and are publicly available as of the date of publication. DOIs are listed in the key resources table.
This paper does not report original code.
Any additional information required to reanalyze the data reported in this paper is available from the lead contact upon request.
KEY RESOURCES TABLE
| REAGENT or RESOURCE | SOURCE | IDENTIFIER |
|---|---|---|
| Chemicals, peptides, and recombinant proteins | ||
| CellEvent | ThermoFisher | C10423 |
| Cyclosporine A | Enzo | BML-A195 |
| Fura-2 (AM) | Teflabs | 0–103 |
| Lipofectamine 3000 | Life Technologies | L3000008 |
| Oligomycin | Enzo | ALX-380–037 |
| FK506 | Enzo | ALX-380–008 |
| Staurosporine | Enzo | ALX-380–014 |
| Tetramethylrhodamine, Ethyl Ester, Perchlorate | ThermoFisher | T669 |
| Deposited data | ||
| Grx1roGFP2 415nm (Oxidized).tif | This paper | DOI: http://dx.doi.org/10.17632/h4k9tk8y53.1#file-41147cb6-c623–40fc-8bb8–3c9c6bb87f37 |
| Grx1roGFP2 485nm (Reduced).tif | This paper | DOI: http://dx.doi.org/10.17632/h4k9tk8y53.1#file-975a3d95–247f-43a8–9613-05a97e72ef5d |
| Mitochondrial Membrane Potential (TMRE F577nm).tif | This paper | DOI: http://dx.doi.org/10.17632/h4k9tk8y53.1#file-9f805b22–703e-47a8–8626-6cf76e95a76b |
| Experimental models: Cell lines | ||
| HepG2 | ATCC | 30–2003 |
| HEK293T MCU-KO | Sancak et al., 2013 | N/A |
| HEK293 IP3R TKO | Alzayady et al., 2016 | N/A |
| Recombinant DNA | ||
| Hyper/SypHer-HA-FRB-rIP3R1 | This paper | N/A |
| ER-M Grx1roGFP2/RCaMP | This paper | N/A |
| OMM Grx1roGFP2/RCaMP | This paper | N/A |
| MtGEM-GECO | Zhao et al 2011 | N/A |
| MtCepia | Paillard et al 2018 | N/A |
| Software and algorithms | ||
| Canvas X | N/A | https://www.canvasgfx.com/ |
| OriginPro 2017 | OriginLabs | https://www.originlab.com/2017 |
| Fiji | https://imagej.net/Fiji | 1.42 |