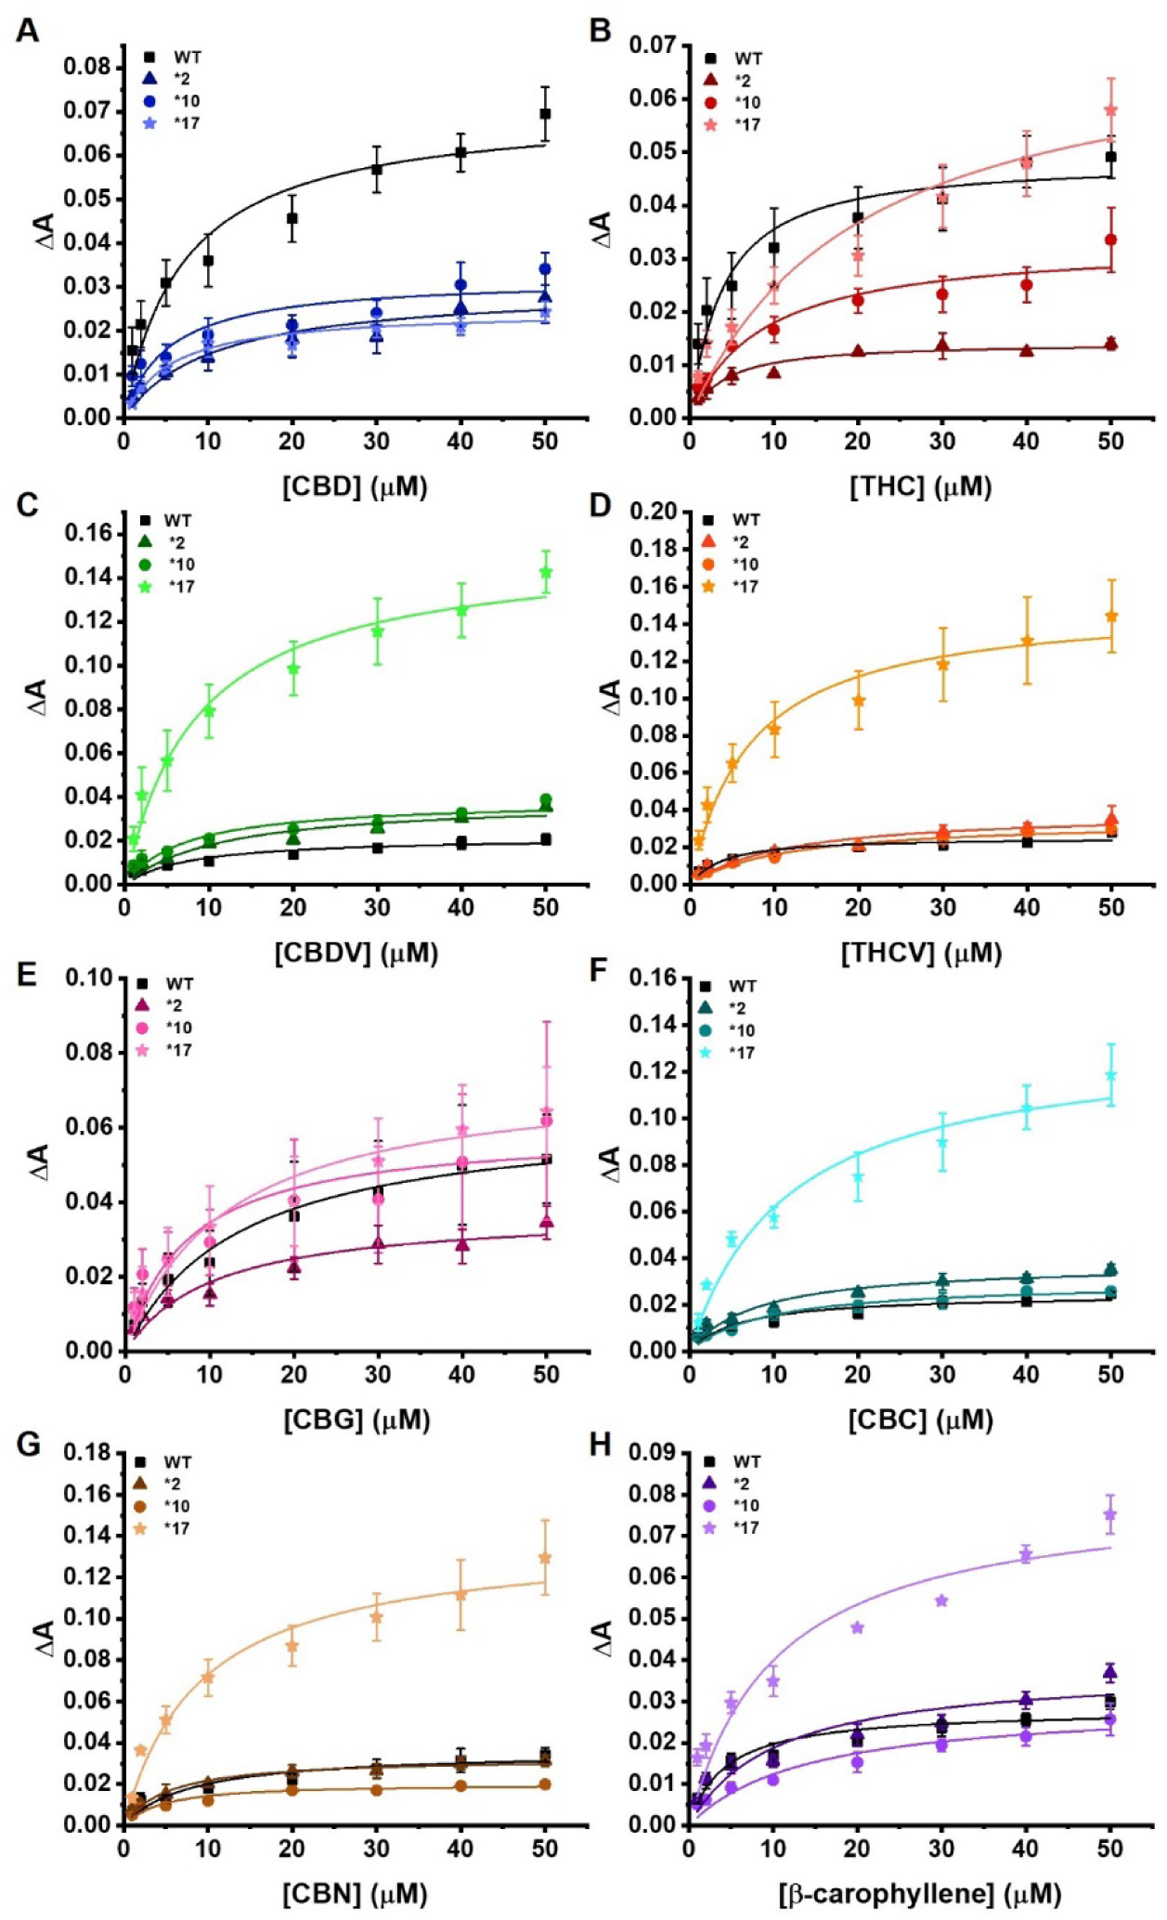
Figure 2.

Soret titration binding curves for each of the pCBs with all four CYP2D6 polymorphisms. (A) CBD, (B) THC, (C) CBDV, (D) THCV, (E) CBG, (F) CBC, (G) CBN, and (H) β-CP with all four CYP2D6 polymorphisms. WT is shown with squares, *2 with triangles, *10 with circles, and *17 with stars. All the binding spectra were fitted to a single binding isotherm. The phytocannabinoid was added incrementally from 0 to 50 μM. The change of absorbance (ΔA) from 393 to 417 nm was calculated for each titration and plotted against the corresponding phytocannabinoids concentration (μM). Data were fitted with Origin Lab to the single binding isotherm to determine the Ks. ΔA indicates the difference in absorbance between 393 nm and 417 nm. All experiments were done in triplicates data were produced from the means of three repeats (N=3). The error represents the standard error of the mean of three experiments.
