

Abstract
Objectives.
Regulation of nicotine vaping products (NVPs) varies between countries, impacting the availability and use of these products. This study updated the analyses of O’Connor et al. (2019) on types of NVPs used and examined changes in NVP features used over 18 months in four countries with differing regulatory environments.
Design.
Data are from 4734 adult current vapers in Australia, Canada, England, and the United States from Waves 1 (2016) and 2 (2018) of the ITC Four Country Smoking and Vaping Survey. NVP characteristics included device description, adjustable voltage, nicotine content, and tank size. Longitudinal analyses (n=1058) assessed movement towards or away from more complex/modifiable NVPs. A logistic regression was used to examine factors associated with changes in device description from 2016–2018.
Results.
Like 2016, box-tanks were the most popular NVP (37.3%) in all four countries in 2018. Over 80% of vapers continued using the same NVP and nicotine content between waves, though movement tended towards more complex/modifiable devices (14.4% of vapers). Box-tank users, exclusive daily vapers, and older vapers were most likely to continue using the same device description. Certain NVPs and features differed by country, such as higher nicotine contents in the US (11.5% use 21+ mg/ml) and greater device stability over time in AU (90.8% stability).
Conclusions.
Most vapers continued using the same vaping device and features over 18 months. Differences in NVP types and features were observed between countries, suggesting that differing NVP regulations affect consumer choices regarding the type of vaping device to use.
INTRODUCTION
NVPs may be classified as disposable, rechargeable devices with replaceable pre-filled cartridge/pods, or devices with refillable liquid containers (tanks). They may also differ in appearance, such as cigarette-like, pen-like, or box-like,[1] or on other features, including voltage/power adjustability, tank capacity, flavor, and nicotine concentration or formulation. “Cigalike” NVPs were the most popular products in 2012–2013,[2] though by 2016–2017, tank- and mod-style (i.e., modified) NVPs had supplanted existing products.[3–5] JUUL, a high-nicotine pod-style NVP, emerged in 2015 and grew to 40% of the US NVP retail market share by the end of 2017.[6] While high-nicotine NVPs appear to be growing,[7–8] these studies generally use US Nielsen data, which does not capture vape shops and e-commerce purchasing.[9–10] These studies also do not fully capture patterns outside the US, suggesting a need to gather data directly from consumers in various countries.
NVPs and popular features have evolved along with the marketplace. Vapers who started with cigalike devices more often transitioned to larger, more complex/modifiable models that can deliver nicotine more efficiently, as opposed to continuing with the same device.[1,11–12] Additionally, reducing nicotine content appears to be more common than increasing,[13] which may reflect more powerful batteries increasing the efficiency of nicotine delivery in more advanced models.[14] Few vapers move from more complex/modifiable to less complex/modifiable models.[11–12] Interviews with vapers suggest that cigalikes are perceived as starter products that are less satisfying than modifiable open systems.[15]
Few studies have examined how NVP designs and features may differentially impact public health. Different NVPs and features influence nicotine delivery and, ultimately, satisfaction,[11,16–17] and may impact smoking cessation.[18] For instance, users of open (i.e., refillable) systems may be exposed to more nicotine than users of closed systems,[19] and mod NVPs are associated with higher power, nicotine exposure, and liquid consumption compared to tank or cigalike NVPs.[14,20] NVP type (i.e., disposable, prefilled, tank) and brand influence total particulate matter yield,[21] suggesting certain NVPs may be associated with increased nicotine and toxicant delivery. Increased NVP power is associated with increased total particulate matter, and nicotine and toxicant yield.[21–23] However, determining the public health effects of device type is complicated by interactions among NVP features and the lack of long-term data on NVP health effects.
The regulatory environment shapes consumer behavior by influencing the availability of NVPs, their features, and purchasing.[9,24] Awareness and use of NVPs is negatively associated with the strength of regulatory policies in different countries.[24] In Australia (AU), where it is illegal to sell or buy nicotine for NVPs without a medical prescription,[25] NVPs are procured online from outside the country.[9]. In Canada (CA), prior to May 2018, independently owned vape shops were the primary NVP distributors due to regulations that discouraged mass marketed nicotine-containing NVPs. The 2018 Tobacco and Vaping Products Act removed pre-market restrictions, permitting entry of international brands, such as JUUL and Vype, and increasing the retail availability of nicotine containing NVPs.[28] In England (EN), the Tobacco Products Directive introduced restrictions on nicotine content (≤20 mg/ml or 2.0%), and tank and refill sizes.[26] In EN and the United States (US), NVPs are sourced across a broader set of venues: vape shops, online, and other locations.[9] Areas with more restrictive regulations generally have lower adult NVP use.[27]
The purpose of this study is to update and extend analyses conducted by O’Connor et al. (2019)[5] describing the features of NVPs used by vapers in 2016, using data from a 2018 follow-up survey. Specifically, we assessed whether products and specific features of NVPs used by adult vapers changed over 18 months in AU, CA, EN, and the US, where access and marketing of NVPs vary.
METHODS
The ITC Four Country Smoking and Vaping Survey Wave 2 (W2) is an expansion of the ITC Four Country Survey infrastructure, conceptual model,[29] and methodologies,[30] to examine NVP market and policy environments.[31] Data for this paper come from 4734 respondents who reported current daily, weekly, or monthly NVP use. W2 data were collected from February to July 2018, approximately 18 months after Wave 1 in 2016 (W1). Respondents were recruited via random-digit-dialing sampling frames, or a combination of random-digit-dialing and web-based or address-based panels. The survey sample consisted of 1) recontact smokers and former smokers who had participated in W1, 2) newly recruited current and former smokers from country-specific panels, 3) recontact vapers who had participated in W1, and 4) newly recruited current vapers from country-specific panels. Sampling and weighting were conducted to be representative of the respective countries’ smoking populations with calibration figures obtained from nationally representative surveys. Additional methodological details are available via the ITC website (http://www.itcproject.org/methods). There were two components of our study. First, we updated O’Connor et al. (2019)’s[5] analyses of NVPs and features to 2018. Second, we conducted longitudinal analyses (n=1058 current vapers at W1 and W2) to assess change in NVPs and features from 2016 to 2018.
Measures
Vaping/smoking status.
NVP use was dichotomized as daily or nondaily, as was cigarette smoking, and combined to create six use status categories: 1) exclusive daily vaper, 2) exclusive nondaily vaper, 3) dual daily (daily NVP/daily cigarette, 4) predominant vaper (daily NVP/nondaily cigarette), 5) predominant smoker (nondaily NVP/daily cigarette), and 6) concurrent nondaily (nondaily NVP/nondaily cigarette).[32]
NVP characteristics.
Questions and response options regarding NVPs were similar between W1 and W2 and asked participants to describe the NVP they currently use most (cf. O’Connor et al., 2019).[5] Five NVP types were based on two questions about NVP description (“Which of the following best describes the type of e-cigarette/vaping device you currently use most?”; i.e., disposable, prefilled cartridge, refillable tank) and appearance (“Which of the following best describes the appearance…?”; i.e., cigarette-like, cigarette-like but different color, pen-like, box-like, other). The five NVP types were 1) cigalike (disposable or prefilled cartridge, cigarette-like with same or different color), 2) pen-cartridge (pre-filled cartridge, pen-like3) pen-tank (refillable tank, pen-like), 4) box-tank (refillable tank, box-like), and 5) any other combinations inconsistent with options 1–4. Other combinations were as follows: 32.2% box-cartridge, 18.0% cigalike different color-tank, 16.4% pen-disposable, 13.6% other-tank, 10.4% cigalike-tank, 6.2% other-cartridge, 2.0% tank-disposable, and 1.1% other-disposable.
Reported NVP brand use was evaluated to further assess device type (“What specific brand of reusable/disposable…?”). Popular brands (e.g., Aspire, Smok, Blu) offer multiple NVP designs, complicating assessment of device type using brand. One exception is JUUL, which only sold one pod-style device, though JUUL users (n=82 at W2) selected multiple description and appearance combinations. For analytic purposes, we categorized JUUL as pen-cartridge, the closest approximation among the existing categories. Brand data were not used to classify any NVPs other than JUUL.
Longitudinal analyses to examine changes in product complexity/modifiability between W1 to W2. For NVP description, tanks were considered most complex, with cartridges then disposables being least complex. For NVP appearance, complexity was ranked as follows: box-shaped (most complex), pen-like, cigarette-like but different color/cigarette-like (others excluded). For NVP type, complexity was ranked as followed: box-tanks (most complex), pen-tanks, pen-cartridges, cigalikes (any other combinations excluded). Vapers who reported “don’t know” to either NVP description variable at W1 or W2 were excluded (n=43 at W2).
NVP features.
Vapers who reported cartridge or tank NVP use were asked if their products had adjustable voltage (“Can you adjust the power, voltage, or temperature…?), with response options: 1)“Yes, but I don’t change it,” 2)“Yes, and I change the settings occasionally,” 3)“Yes, and I regularly adjust the settings,” 4)“No,” and 5)“Don’t know.” Vapers who reported changing settings occasionally or regularly were combined for analyses. For longitudinal analyses on directionality, adjustable voltage was ranked as follows: “Yes, change” (most complex/modifiable), “Yes, don’t change,” and “No” (don’t know excluded).
Vapers who reported tank NVP use were asked about the capacity of their tank in ml (“What is the volume/capacity of the tank…?”), with response options: 1)“< 1,” 2)“1–1.5,” 3)“1.6–2.0,” 4)“2.1–3,” 5)“3.1–4.0,” and 6)“>4.” For longitudinal analyses, movement towards >4 ml was considered increased complexity and movement towards <1 ml was considered decreased complexity.
All vapers were asked about the nicotine strength of the currently used e-liquid (“What is the strength of the e-liquid…?”), with response options: 1)“0 mg/ml (0%),” 2)“1–4 mg/ml (0.1–0.4%),” 3)“5–8 mg/ml (0.5–0.8%),” 4)“9–14 mg/ml (0.9–1.4%),” 5)“15–20 mg/ml (1.5–2.0%),” 6)“21–24 mg/ml (2.1–2.4%),” and 7)“25 mg/ml (2.5%) or more.” Nicotine contents were combined into 3 groups: 0 mg/ml, ≤20 mg/ml (1–20 mg/ml), or 21+ mg/ml (21–25+ mg/ml) to assess nicotine content based on current EU TPD limits. For longitudinal analyses, movement towards 21+ mg/ml was considered increased complexity and movement towards 0 mg/ml was considered decreased complexity.
Demographics.
Participants were asked about their age, ethnicity, and education and income. Education was categorized into 3 levels: low (≤high school), moderate (technical/community college, some university), or high (≥university degree). Income was categorized into 3 levels with cutoffs differing by country. Low income was defined as <$44,999 (AU/CA), ≤$29,999 (US), or ≤£15,000 (EN). Moderate income was defined as $45,000-$74,999 (AU/CA), $30,000-$59,999 (US), or £15,001–40,000 (EN). High income was defined as ≥$75,000 (AU/CA), ≥60,000 (US), or ≥£40,001 (EN).
Data Analyses
All data were weighted to country-representative samples. Cross-sectional analyses were weighted to country-representative samples using the rescaled cross-sectional weight for current NVP users. Descriptive analyses were conducted on the full sample and by country, with chi-squared analyses used to test for differences and followed with post-hoc pairwise comparisons of proportions using the Bonferroni method. A multinomial logistic regression was conducted to examine if country and vaping/smoking status were associated with device type preference, while controlling for demographics. Pen-style cartridge was combined with “any other combinations”.[5] Missing data were deleted listwise without imputing.
Longitudinal analyses were weighted to country-representative samples using the rescaled longitudinal weight for continuing NVP users from W1 to W2. Those who reported “don’t know” at W1 or W2 were excluded from analyses for the corresponding variable, thus longitudinal results reflect NVPs/features among vapers who know their product characteristics. Descriptive analyses were used to report changes in NVP features from W1 to W2 and followed with post-hoc pairwise comparisons of proportions using the Bonferroni method. Logistic regression was used to predict the odds of changing device type based on W1 demographics, vaping/smoking status, device type, and nicotine content. Switchers (vapers that changed device type) to increased and decreased NVP type complexity were grouped together due to relatively small sample sizes compared to those who stayed stable in device type. Analyses were conducted using IBM SPSS Statistics version 25 (IBM, Armonk, NY, USA).
Ethics Approval
The survey protocols and all materials of W1 and/or W2 ITC Four Country Smoking and Vaping Survey, including the survey questionnaires, were cleared for ethics by Office of Research Ethics, University of Waterloo, Canada (ORE#20803/30570, ORE#21609/30878); Research Ethics Office, King’s College London, UK (RESCM-17/18–2240); Human Research Ethics, Cancer Council Victoria, Australia (HREC1603) and, Human Ethics, Research Management Office, University of Queensland, Australia (2016000330/HREC1603); and Institutional Review Board Medical University of South Carolina (waived due to minimal risk). All participants provided consent to participate.
RESULTS
NVP characteristics by country: Cross-sectional results from Wave 2 (2018)
The W2 sample of vapers was 40.40 (SD=15.37) years old, predominately white (84.9%) and male (57.3%), had moderate-high income (72.0%) and moderate-high education (75.4%). Table 1 shows vaping/smoking status and NVP characteristics for the full sample and each country in 2018. Exclusive daily vaping was the most common use status in all countries except CA. Overall, 42.8% were exclusive vapers and 60.9% of the sample used NVPs daily. Box-tanks were the most popular device overall and within each country (see Figure 1 for prevalence of device type by country and wave), although they were relatively more popular in US and AU (40.8% and 65.7%) than in CA and EN (30.3% and 35.6%). Pen-tanks were second-most common in all countries except the US, in which it was cigalikes. Reports of pen-cartridges (including JUUL) and “any other combinations” were less common than other device types (≤10.2%), with the exclusion of “any other combinations” in CA (18.5%). Cigalikes were less common in AU (7.1%) than other countries (17.5–23.2%), and the use of “any other combinations” was more common in CA (18.5%) than other countries (6.0–7.4%). Adjustable voltage use differed by country, with “yes, change” as the most common response in CA and AU (36.0% and 66.8%), but “not adjustable” being most common in US and EN (41.7% and 45.0%). The most common tank capacities were 1.6–2.0 ml, though larger tank sizes were more popular in AU (48.6% reported >3ml). Nearly one third (30.6%) of vapers did not know their tank capacity, with lowest rates in AU (12.1%). Approximately three-quarters used ≤20 mg/ml nicotine, with few reporting no nicotine (8.6%) and 21+ mg/ml (5.0%). Using 21+ mg/ml was more common in US (11.5%), with other countries ranging from 1.5–4.1%. A further 10.7% did not know the strength, with higher rates in CA (16.6%) compared to EN and AU (7.7% and 7.1%).
Table 1.
NVP characteristics overall and by country, ITC W2 (2018) survey
| Canada (n = 1152) | United States (n = 1092) | England (n = 2214) | Australia (n = 276) | Overall (n = 4734) | X2 | |
|---|---|---|---|---|---|---|
| Vaping/Smoking Status (n = 4734) | 521.90 | |||||
| Exclusive daily vaper | 17.3a | 34.3v | 40.2c | 63.3d | 34.6 | |
| Exclusive nondaily vaper | 13.0a | 5.8b | 7.2b | 4.7b | 8.2 | |
| Predominant vaper | 6.1a | 13.3b | 11.0b | 13.5b | 10.5 | |
| Predominant smoker | 27.2a | 20.6b | 18.3b | 11.1c | 20.6 | |
| Dual daily user | 15.2a | 15.5a | 17.3a | 6.8b | 15.8 | |
| Concurrent nondaily user | 21.2a | 10.4b | 5.9c | 0.6d | 10.4 | |
| Device characteristics | ||||||
| Type (n = 4691) | 328.58 | |||||
| Box-tank | 30.3a | 40.8b | 35.6b | 65.7c | 37.3 | |
| Pen-tank | 21.2a | 20.7a | 32.4b | 18.7a | 26.2 | |
| Pen-cartridge | 10.2a | 9.3a | 7.6a | 1.1b | 8.2 | |
| Cigalike | 19.8a | 23.2b | 17.5a | 7.1c | 18.7 | |
| All others | 18.5a | 6.0b | 7.0b | 7.4b | 9.6 | |
| Adjustable Voltage (n = 3867) | 246.98 | |||||
| Yes, change | 36.0a | 36.7a | 34.3a | 66.8b | 37.3 | |
| Yes, don’t change | 35.4a | 20.6b | 18.6b | 14.0b | 22.2 | |
| Not Adjustable | 25.1a | 41.7b | 45.0b | 17.0a | 38.3 | |
| Don’t Know | 3.5a | 1.1a | 2.1a | 2.2b | 2.2 | |
| Capacity (n = 4153) | 334.39 | |||||
| < 1ml | 3.3a | 5.2b | 1.6a | 1.8a,b | 2.8 | |
| 1 – 1.5 ml | 14.6a | 12.8a,b | 12.3a,b | 7.6b | 12.6 | |
| 1.6 – 2.0 ml | 22.5a | 15.4b | 29.6c | 18.6a,b | 24.1 | |
| 2.1 – 3ml | 12.2a | 14.3a | 13.0a | 11.3a | 13.0 | |
| 3.1 – 4.0 ml | 9.4a | 7.4a,b | 6.0b | 18.6c | 7.9 | |
| > 4ml | 8.5a | 10.7a | 5.7b | 30.0c | 9.0 | |
| Don’t Know | 29.5a | 34.2a | 31.7a | 12.1b | 30.6 | |
| Refill characteristics | ||||||
| Nicotine Content (n = 4730) | 262.32 | |||||
| No Nicotine | 12.9a | 8.6b | 6.0c | 11.4a,b | 8.6 | |
| ≤ 20 mg/ml | 69.0a | 68.4a | 82.3b | 79.6b | 75.6 | |
| 21+ mg/ml | 1.5a | 11.5b | 4.1c | 2.0a,c | 5.0 | |
| Don’t Know | 16.6a | 11.4b | 7.7c | 7.1b,c | 10.7 |
p < .001 for all X2 tests comparing across countries. Superscript letters reflect post-hoc comparisons across country, with different letters indicating significant differences.
dfstatus = 15; dftype = 12; dfvoltage = 9; dfcapacity = 18; dfnicotine = 9
Figure 1.
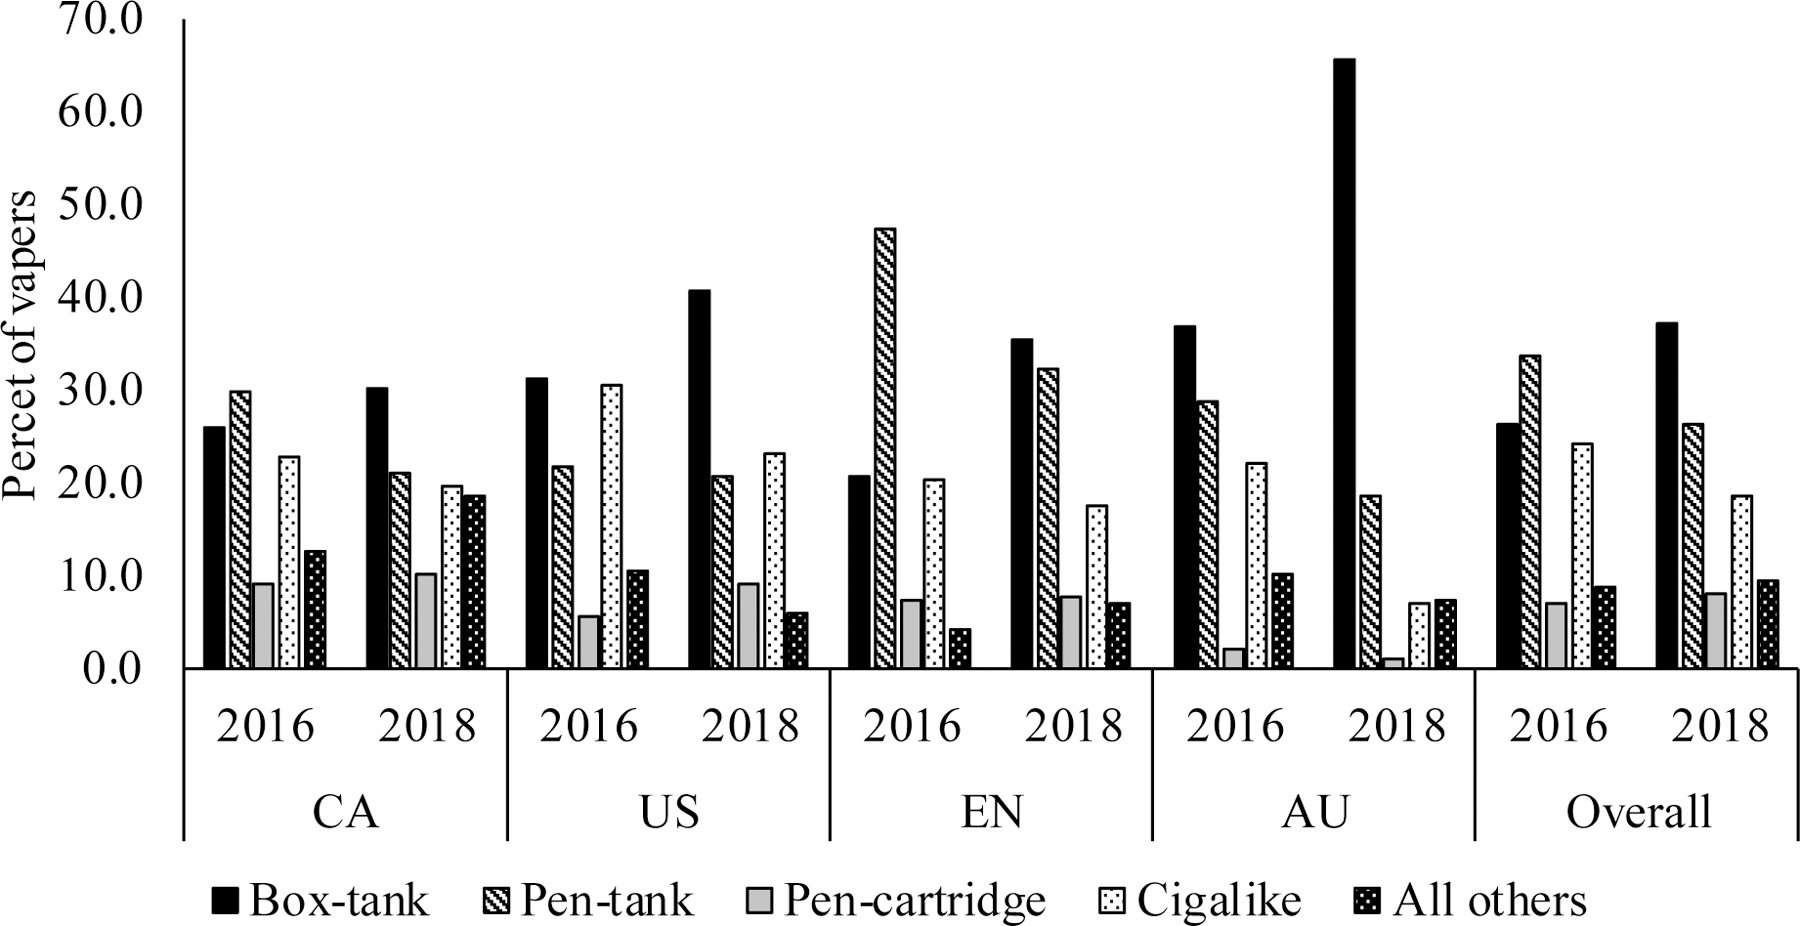
NVP type by country and overall at W1 (2016) and W2 (2018)
Supplementary Tables 1–4 provide more detailed descriptions of NVPs by use status and country. Supplementary Table 1 shows device type as a function of vaping/smoking status and country. Supplementary Table 2 shows results of a multinomial logistic regression model comparing characteristics of box-tank, pen-tank, and users of other combinations, to users of cigalikes in 2018. Supplementary Table 3 reports the self-reported nicotine content as a function of device type and country in 2018. Supplementary Table 4 shows the most commonly reported brands by country in 2016 and 2018.
Longitudinal change in device characteristics by country
Table 2 shows directional change in NVP characteristics from 2016 to 2018 overall and by country. More than 68% of vapers stayed the same from 2016 to 2018 for all NVP features except for tank capacity, where only 35.8% did. Directional change differed by country for all NVP features except tank capacity. Almost 80% of vapers remained with the same device type, though this stability was more common in AU (90.8%) than other countries (70.1–81.3%). Additionally, increasing device type complexity was more common than decreasing in all countries except US, where movement was similar in both directions. Supplementary Table 5 show device type change from 2016 to 2018.
Table 2.
Change in NVP characteristics from W1 (2016) to W2 (2018)
| Canada | United States | England | Australia | Overall | X 2 | p | |
|---|---|---|---|---|---|---|---|
| Device Type1 | n = 237 | n = 225 | n = 304 | n = 63 | n = 829 | 26.56 | <.001 |
| Same | 70.1a | 80.8b | 81.3b | 90.8b | 78.7 | ||
| Increase | 21.5a | 9.4b | 13.9a,b | 7.6a,b | 14.4 | ||
| Decrease | 8.4a | 9.8a | 4.7a | 1.6a | 6.9 | ||
| Device Description2 | n = 320 | n = 247 | n = 337 | n = 80 | n = 984 | 51.47 | <.001 |
| Same | 76.7a | 87.1b | 89.2b | 72.6a | 83.3 | ||
| Increase | 13.3a | 6.4b | 7.0b | 27.2c | 10.5 | ||
| Decrease | 10.0a | 6.5a,b | 3.8b | 0.2b | 6.2 | ||
| Device Appearance3 | n = 310 | n = 241 | n = 334 | n = 79 | n = 964 | 33.02 | <.001 |
| Same | 63.5a | 78.5b | 77.5b | 75.0a,b | 73.1 | ||
| Increase | 26.8a | 11.6b | 15.9b,c | 23.8a,c | 18.9 | ||
| Decrease | 9.7a | 9.9a | 6.6a | 1.3a | 8.0 | ||
| Nicotine Content5 | n = 277 | n = 218 | n = 289 | n = 74 | n = 859 | 21.41 | 0.002 |
| Same | 85.9a,b | 79.4b | 89.3a | 82.4a,b | 85.1 | ||
| Increase | 6.1a | 6.4a | 2.1a | 0.0a | 4.3 | ||
| Decrease | 7.9a | 14.2a | 8.7a | 17.6a | 10.6 | ||
| 0 mg/ml | n = 31 | n = 3 | n = 18 | n = 5 | n = 57 | 6.71 | 0.08 |
| Same | 54.8a | 33.3b | 54.8a | 100.0a | 64.9 | ||
| Increase | 45.2a | 66.7a | 45.2a | 0.0a | 35.1 | ||
| Decrease | n/a | n/a | n/a | n/a | n/a | ||
| ≤20 mg/ml | n = 238 | n = 188 | n = 251 | n = 55 | n = 732 | 24.74 | <.001 |
| Same | 92.9a | 87.2a | 96.8a | 98.2a | 93.2 | ||
| Increase | 1.7a,b | 6.4b | 0.4a | 0.0a,b | 2.3 | ||
| Decrease | 5.5a | 6.4a | 2.8a | 1.8a | 4.5 | ||
| 21+ mg/ml | n = 9 | n = 27 | n = 19 | n = 14 | n = 69 | 7.13 | 0.07 |
| Same | 0.0a | 29.6b | 5.3a,c | 14.3b,c | 15.9 | ||
| Increase | n/a | n/a | n/a | n/a | n/a | ||
| Decrease | 100.0a | 70.4a,b | 94.7a | 85.7b | 84.1 | ||
| Capacity | n = 160 | n = 131 | n = 187 | n = 55 | n = 532 | 8.54 | 0.2 |
| Same | 32.9a | 37.0a | 38.4a | 32.3a | 35.8 | ||
| Increase | 27.0a | 25.4a | 32.7a | 39.3a | 29.9 | ||
| Decrease | 40.2a | 37.5a | 28.8a | 28.4a | 34.3 | ||
| Adjustable Voltage4 | n = 207 | n = 192 | n = 276 | n = 69 | n = 745 | 15.44 | 0.017 |
| Same | 65.5a | 69.0a | 69.2a | 88.8b | 69.9 | ||
| Increase | 18.9a | 15.5a,b | 18.9a | 5.4b | 16.8 | ||
| Decrease | 15.6a,b | 15.4b | 11.9a | 5.8a,b | 13.3 |
Device Type Complexity (Most- ): Box-Tank, Pen-Tank, Pen-Cartridge, Cigalike (Excluded: all others)
Device Description Complexity (Most - Least): Tank, Cartridge, Disposable
Device Appearance Complexity (Most - Least): Box-like, Pen-like, Like cigarette different color, Like cigarette (Excluded: other)
Voltage Complexity (Most - Least): Yes/change, Yes/don’t change, No
Nicotine Content directionality are reported across nicotine content and within each nicotine content, separately
X2 used to compare change within NVP feature across countries. df = 6
Superscript letters reflect post-hoc comparisons across country, with different letters indicating significant differences.
Stability was commonly observed for adjustable voltage -- most vapers continued in the same adjustable voltage category, more commonly in AU (88.8%) than other countries (65.5–69.2%). Similar percentages of vapers stayed stable (35.8%), increased (29.9%), and decreased (34.3%) tank capacity. Supplementary Table 6 shows NVP feature change as a function of device type change.
Stability in nicotine content was the most common pattern, though the pattern of changes differed by country. Overall, 93.2% of vapers who had used ≤20 mg/ml nicotine continued using that nicotine content, while only 2.3% increased to 21+ mg/ml. Over 70% of vapers using 21+ mg/ml in each country in 2016 reduced their nicotine content by 2018. Increasing nicotine content was rare in EN (2.1%) and AU (0%), and nonsignificantly higher in the US and CA (6.4 and 6.1%). Most vapers (64.9%) using 0 mg/ml nicotine continued using that content across waves. When considering NVP change from 2016–2018, 86.5% of vapers that continued with the same device also continued with the same nicotine content, and 81.8% of vapers that changed device type continued with the same nicotine concentration (Supplementary Table 6).
Table 3 presents results of a logistic regression model assessing the likelihood of changing device types from 2016 to 2018. Vapers from 18–39 years old were more than twice as likely as 55+ years to change device type. All smoking/vaping statuses, except concurrent nondaily users, in 2016 were more likely to change device type by 2018 than exclusive daily vapers. Device type in 2016 also predicted device type changing, with box-tank users least likely to shift. Users of ≤20 mg/ml nicotine were half as likely to change device type than those who used 21+ mg/ml, though nicotine content was not a significant predictor in the regression model.
Table 3.
Predictors of changing device type from W1 (2016) to W2 (2018)
| Changing device description (n = 792) 95% CI |
||||
|---|---|---|---|---|
| aOR | Lower Bound | Upper Bound | p | |
| Country | 0.54 | |||
| AU | 0.97 | 0.47 | 1.98 | 0.93 |
| CA | 1.39 | 0.86 | 2.25 | 0.180 |
| EN | 1.19 | 0.71 | 1.99 | 0.52 |
| US | REF | |||
| Age | 0.014 | |||
| 18 – 24 | 2.46 | 1.17 | 5.18 | 0.017 |
| 25 – 39 | 2.10 | 1.27 | 3.47 | 0.004 |
| 40 – 54 | 1.34 | 0.83 | 2.15 | 0.24 |
| 55+ | REF | |||
| Education | 0.053 | |||
| Low | 1.25 | 0.75 | 2.07 | 0.39 |
| Moderate | 0.74 | 0.46 | 1.19 | 0.22 |
| High | REF | |||
| Income | 0.70 | |||
| Low | 0.82 | 0.52 | 1.30 | 0.40 |
| Moderate | 0.88 | 0.57 | 1.37 | 0.57 |
| High | REF | |||
| Sex | ||||
| Female | 0.93 | 0.66 | 1.33 | 0.70 |
| Male | REF | |||
| Ethnicity | ||||
| White | 0.92 | 0.54 | 1.55 | 0.75 |
| Nonwhite | REF | |||
| Vaping/Smoking Status at W1 | 0.001 | |||
| Exclusive daily vaper | REF | |||
| Exclusive nondaily vaper | 1.92 | 1.01 | 3.68 | 0.048 |
| Predominant vaper | 3.21 | 1.70 | 6.05 | < .001 |
| Predominant smoker | 2.16 | 1.26 | 3.70 | 0.005 |
| Dual daily user | 2.57 | 1.54 | 4.28 | < .001 |
| Concurrent nondaily user | 1.28 | 0.54 | 3.06 | 0.58 |
| Device Description at W1 | < .001 | |||
| Box-tank | REF | |||
| Pen-tank | 4.46 | 2.68 | 7.42 | < .001 |
| Pen-Cartridge | 9.98 | 4.67 | 21.31 | < .001 |
| Cigalike | 3.63 | 2.08 | 6.32 | < .001 |
| All others | 29.97 | 12.74 | 70.51 | < .001 |
| Nicotine Content at W1 | 0.09 | |||
| 0 mg/ml | 0.80 | 0.33 | 1.96 | 0.63 |
| ≤ 20 mg/ml | 0.53 | 0.29 | 0.99 | 0.045 |
| 21+ mg/ml | REF | |||
DISCUSSION
Overall, the type of NVPs used in 2018 were similar to those reported by vapers in 2016.[5] Refillable NVPs continued to be used by most vapers, adjustable voltage devices were more common than nonadjustable, and over 80% of vapers reported using NVPs that contain nicotine. Taken together, vapers seem to gravitate to NVPs and features that facilitate nicotine delivery.[14,20–21] Despite changes in the marketplace of products and changes in regulation governing access and marketing of NVPs, the general pattern of common NVPs and features remained similar. This finding of NVP consistency is in contrast with the rise in popularity of pod-style NVPs during 2015–2017 in the US.[6] JUUL use was low in the current sample (1.7%) and only was a popular brand in the US, though JUUL was not for sale in CA and became available in EN during data collection. The rapid rise in the popularity of JUUL among US adolescents by 2018[33–34] was not observed in our sample of adults in 2018. Though age differences may explain low JUUL use in this study, the characteristics of our sample of adult regular vapers are consistent with other reports from nationally representative samples.[35–36] However, the current study may underestimate the use of other JUUL-like pod NVPs, as no questions directly assessed these device types.
Still, some differences in NVP characteristic preferences emerged between 2016 and 2018 among vapers who know their product characteristics. Box-tank use increased, while cigalike and pen-tank use decreased, which may be related to greater nicotine exposure associated with these more complex NVPs.[14,20–21] Additionally, a larger percentage of vapers reported not knowing their nicotine content in 2018 compared to 2016, with highest rates in CA (16.6%) followed by the US (11.4%) and EN (7.7%) and AU (7.1%). There was a reduction in use of high nicotine contents, which may result from changing other features that may impact nicotine delivery. However, nicotine content was asked as either mg/ml or %, which may have led to confusion or misreporting among some participants (i.e., 49.5% of JUUL users reported ≤20 mg/ml, 25.9% reported ‘don’t know’).
Consistent with 2016 data,[5] most vapers (75.6%) reported using ≤20 mg/ml nicotine in 2018, with some differences observed between countries. Use of 21+ mg/ml nicotine was higher in the US and US vapers were more likely to increase nicotine content from ≤20 mg/ml to 21+ mg/ml compared to vapers in other countries. These patterns are consistent with the regulatory environment, as the US and CA did not restrict nicotine content of NVPs, while EN has had an upper limit of 20mg/ml, and the illegality of nicotine for NVPs in AU seemed to lead users to box-tanks with lower nicotine contents. These patterns may reflect a trend in the US market towards high nicotine contents,[6] despite lower levels of use than expected based on the proliferation of JUUL in the US.[6–8] As mentioned previously, there were high rates of “don’t know” and some misreporting of nicotine content among some vapers, which suggests that product labels may not be understood or particularly salient to consumers. Tank users reported not knowing their nicotine content less than other device type users, which may be a result of using refillable NVPs rather than prefilled. This difference in awareness has been observed among young adult pod-users in the US, which approximately half reported not knowing the nicotine concentration in their devices.[37] More awareness may reflect their use status or location of purchase (e.g., vape shop, online, tobacco retail outlet), which may influence salience of specific product features. It may also reflect a reduced interest among vapers in product characteristics as vaping becomes more normalized.
Most vapers were stable in their device type, nicotine content, and adjustable voltage use over time. Greater stability in device type in AU may reflect NVP illegality leading most consumers to purchase tank systems and nicotine solutions online.[9] Movement was mainly to more complex/modifiable designs, which may be followed by increases in nicotine exposure [19–20] and possibly total particulate matter exposure.[21] This pattern replicates findings from other studies in the US.[11–12,15] Exclusive daily vapers were less likely to change device type, suggesting that these vapers may have a more stable pattern of behavior and have identified the NVP that they found most satisfying.[11,16] If so, it would suggest no major improvements in product design have disseminated sufficiently to shift those who already have a satisfactory product. Future analyses should determine if pod NVPs such as JUUL have triggered any migration away from box-tanks by established users.
The rapidly changing NVP market and introduction of new and diverse products (e.g., pods, nicotine salts) complicate the monitoring of trends and may contribute to measurement error. W2 questions may not have completely captured recent trends such as pod systems. For instance, high prevalence of ‘any other combinations’ in CA in 2018 (18.5%) may reflect emerging device types that were not categorized in this study. The ITC W3 survey (2020) includes an additional NVP appearance of “USB/Flash Drive” to more directly assess use of pod systems. This study also focused on the most commonly used NVP by vapers, not accounting for those using multiple device types. Additionally, this study measured changes in NVPs used among those who know their product characteristics but may miss NVPs and features used by those who are less knowledgeable about their products. Regarding nicotine, this study did not specifically assess the use of salt-based nicotine products, which are common in pod NVPs and contain high nicotine concentrations[38] and reduce the pH to increase palatability, allowing high strength solutions which favors lower powered batteries and thus smaller devices.[7] Future research needs to take into account product innovation and seek novel ways to improve response accuracy. For example, uploading pictures of NVPs and liquid bottles within a survey may allow researchers to verify self-report data, but would only be workable if enough respondents were able and willing to provide such pictures.
Continued surveillance of NVPs in varying regulatory environments is crucial to assess how policies affect the NVP market and behavior of user groups. Despite changing regulations in countries such as CA at the time of the survey, the data presented here likely reflect the pre-regulation environment for changes that occurred in 2018. Additionally, the market in the US may change after the PMTA deadline in September 2020, highlighting the importance of ongoing monitoring. Possible changes in exposure and health in response to NVP market changes are also needed to evaluate the public health implications of these behaviors.
Supplementary Material
WHAT THIS PAPER ADDS.
NVP regulations can influence the availability of NVPs and their features, thereby influencing consumer behavior. The NVP market has experienced rapid change, demonstrating the need for surveillance of NVPs and assessment of how regulatory policies shape user behavior.
The influence of regulatory environment on change in NVPs over time has not been characterized.
The NVP and features chosen by vapers generally stayed stable from 2016 – 2018, with over 80% of vapers continuing to use the same device description and same nicotine content. Changes in NVPs and features often differed in countries with different regulatory environments, demonstrating that regulations may influence the NVP market and behavior over time.
FUNDING
The ITC Four Country Smoking and Vaping Survey was supported by grants from the US National Cancer Institute (P01 CA200512), the Canadian Institutes of Health Research (FDN148477), and the National Health and Medical Research Council of Australia (APP1106451).
Footnotes
CONFLICTS OF INTEREST
NJF: Nothing to declare
BVF: Nothing to declare
AM is a UK National Institute for Health Research (NIHR) Senior Investigator. The views expressed in this article are hers and not necessarily those of the NIHR, or the UK Department of Health and Social Care.
KMC has received payment as a consultant to Pfizer, Inc. for service on an external advisory panel to assess ways to improve smoking cessation delivery in health care settings. KMC and DH also have served as a paid expert witness in litigation filed against cigarette manufacturers.
MLG has received a research grant from Pfizer and served as a member of scientific advisory board to Johnson & Johnson.
DH and GTF have served as expert witnesses on behalf of governments in litigation involving the tobacco industry and vaping industry (DH).
RB: Nothing to declare
BWH: Nothing to declare
MB: Nothing to declare
SG: Nothing to declare
SCH: Nothing to declare
DTL: Nothing to declare
RJO: Nothing to declare.
REFERENCES
- 1.National Academies of Sciences, Engineering, and Medicine. Public Health Consequences of E-cigarettes Washington, DC: The National Academies Press; 2018. [PubMed] [Google Scholar]
- 2.Giovenco DP, Hammond D, Corey CG, Ambrose BK, Delnevo CD. E-cigarette market trends in traditional U.S. retail channels, 2012–2013. Nicotine Tob Res 2015;17(10):1279–1283. [DOI] [PMC free article] [PubMed] [Google Scholar]
- 3.Action on Smoking and Health. Use of e-cigarettes (vaporisers) among adults in Great Britain 2019. https://ash.org.uk/wp-content/uploads/2019/09/Use-of-e-cigarettes-among-adults-2019.pdf (accessed July 2020).
- 4.Hsu G, Sun JY, Zhu SH. Evolution of electronic cigarette brands from 2013–2014 to 2016–2017: Analysis of brand websites. J Med Internet Res 2018;20(3):e80. [DOI] [PMC free article] [PubMed] [Google Scholar]
- 5.O’Connor RJ, Fix BV, McNeill A, et al. Characteristics of nicotine vaping products used by participants in the 2016 ITC Four Country Smoking and Vaping Survey. Addiction 2019;114(Suppl 1):15–23. [DOI] [PMC free article] [PubMed] [Google Scholar]
- 6.Huang J, Duan Z, Kwok J, et al. Vaping versus JUULing: how the extraordinary growth and marketing of JUUL transformed the US retail e-cigarette market. Tob Control 2019;28:146–151. [DOI] [PMC free article] [PubMed] [Google Scholar]
- 7.Jackler RK, Ramamurthi D. Nicotine arms race: JUUL and the high-nicotine product market. Tob Control 2019;28:623–628. [DOI] [PubMed] [Google Scholar]
- 8.Romberg AR, Miller Lo EJ, Cuccia AF, et al. Patterns of nicotine concentrations in electronic cigarettes sold in the United States, 2013–2018. Drug Alc Dep 2019;203:1–7. [DOI] [PMC free article] [PubMed] [Google Scholar]
- 9.Braak DC, Cummings KM, Nanhas GJ, et al. Where do vapers buy their vaping supplies? Findings from the International Tobacco Control (ITC) 4 Country Smoking and Vaping Survey. Int J Environ Res Public Health 2019;16:338. [DOI] [PMC free article] [PubMed] [Google Scholar]
- 10.Zhu SH, Sun JY, Bonnevie E, et al. Four hundred and sixty brands of e-cigarettes and counting: implications for product regulation. Tob Control 2014;23:iii3–iii9. [DOI] [PMC free article] [PubMed] [Google Scholar]
- 11.Yingst JM, Veldheer S, Hrabovsky S, et al. Factors association with electronic cigarette users’ device preferences and transition from first generation to advanced generation devices. Nicotine Tob Res 2015;17(10):1242–1246. [DOI] [PMC free article] [PubMed] [Google Scholar]
- 12.Yingst JM, Foulds J, Veldheer S, Du P. Device characteristics of long term electronic cigarette users: A follow-up study. Addict Behav 2019;91:238–243. [DOI] [PMC free article] [PubMed] [Google Scholar]
- 13.McNeill A, Brose L, Calder R, Bauld L, Robson D. Vaping in England: an evidence update including mental health and pregnancy, March 2020: a report commissioned by Public Health England London: Public Health England. 2020. [Google Scholar]
- 14.Farsalinos KE, Spyrou A, Tsimopoulou K, et al. Nicotine absorption from electronic cigarette use: Comparison between first and new-generation devices. Sci Rep 2014;4:4133. [DOI] [PMC free article] [PubMed] [Google Scholar]
- 15.Cooper M, Harrell MB, Perry CL. A qualitative approach to understanding real-world electronic cigarette use: implications for measurement and regulation. Prev Chronic Dis 2016;13:15052. [DOI] [PMC free article] [PubMed] [Google Scholar]
- 16.Etter JF. Characteristics of users and usage of different types of electronic cigarettes: Findings from an online survey. Addiction 2016;111(4):724–733. [DOI] [PubMed] [Google Scholar]
- 17.Yong HH, Borland R, Cummings KM, et al. Reasons for regular vaping and for its discontinuation among smokers and recent ex-smokers: findings from the 2016 ITC Four Country Smoking and Vaping Survey. Addiction 2019;114(Suppl 1):35–48. [DOI] [PMC free article] [PubMed] [Google Scholar]
- 18.Hitchman SC, Brose LS, Brown J, Robson D, McNeill A. Associations between e-cigarette type, frequency of use, and quitting smoking: Findings from a longitudinal online panel survey in Great Britain. Nicotine Tob Res 2015;17(10):1187–1194. [DOI] [PMC free article] [PubMed] [Google Scholar]
- 19.Rostron BL, Coleman B, Cheng YC, et al. Nicotine exposure by device type among adult electronic nicotine delivery system users in the Population Assessment of Tobacco and Health Study, 2015–2016. Cancer Epidemiol Biomarkers Prev 2020;29(10):1968–1972. [DOI] [PMC free article] [PubMed] [Google Scholar]
- 20.Wagener TL, Floyd EL, Stepanov I, et al. Have combustible cigarettes met their match? The nicotine delivery profiles and harmful constituent exposures of second-generation and third-generation electronic cigarette users [DOI] [PMC free article] [PubMed] [Google Scholar]
- 21.El-Hellani A, Salman R, El-Hage R, et al. Nicotine and carbonyl emissions from popular electronic cigarette products: correlation to liquid composition and design characteristics. Nicotine Tob Res 2018;20(2):215–223. [DOI] [PMC free article] [PubMed] [Google Scholar]
- 22.Talih S, Balhas Z, Eissenberg T, et al. Effects of user puff topography, device voltage, and liquid nicotine concentration on electronic cigarette nicotine yield: measurements and model predictions. Nicotine Tob Res 2015;17(2):150–157. [DOI] [PMC free article] [PubMed] [Google Scholar]
- 23.Ward AM, Yaman R, Ebbert JO. Electronic nicotine delivery system design and aerosol toxicants: a systematic review. PLoS One 2020;15(6):e0234189. [DOI] [PMC free article] [PubMed] [Google Scholar]
- 24.Gravely S, Driezen P, Ouimet J, et al. Prevalence of awareness, ever-use and current use of nicotine vaping products (NVPs) among adult current smokers and ex-smokers in 14 countries with different regulations on sales and marketing of NVPs: cross-sectional findings from the ITC Project. Addiction 2019;114:1060–1073. [DOI] [PMC free article] [PubMed] [Google Scholar]
- 25.Australian Government Department of Health. Smoking and tobacco laws in Australia https://www.health.gov.au/health-topics/smoking-and-tobacco/about-smoking-and-tobacco/smoking-and-tobacco-laws-in-australia#ecigarette-laws (accessed April, 2020)
- 26.Medicines and Healthcare Products Regulatory Agency. E-cigarettes: Regulations for consumer products https://www.gov.uk/guidance/e-cigarettes-regulations-for-consumer-products (accessed April, 2020)
- 27.Du Y, Liu B, Xu G, et al. Association of electronic cigarette regulations with electronic cigarette use among adults in the United States. JAMA Netw Open 2020;3(1):e1920255. doi: 10.1001/jamanetworkopen.2019.20255 [DOI] [PMC free article] [PubMed] [Google Scholar]
- 28.Health Canada. Vaping product regulations https://www.canada.ca/en/health-canada/services/smoking-tobacco/vaping/product-safety-regulation.html (accessed April, 2020)
- 29.Fong GT, Cummings KM, Borland R, et al. The conceptual framework of the International Tobacco Control (ITC) Policy Evaluation Project. Tob Control 2006;15:iii3–iii11. [DOI] [PMC free article] [PubMed] [Google Scholar]
- 30.Thompson ME, Fong GT, Hammond D, et al. Methods of the International Tobacco Control (ITC) Four Country Survey. Tob Control 2006;15:iii12–iii18. [DOI] [PMC free article] [PubMed] [Google Scholar]
- 31.ITC Project (2020, January). ITC Four Country Smoking and Vaping Survey, Wave 2 (2018) Technical Report University of Waterloo, Waterloo, Ontario, Canada; Medical University of South Carolina, Charleston, South Carolina, United States; Cancer Council Victoria, Melbourne, Australia; the University of Queensland, Australia; King’s College London, London, United Kingdom. [Google Scholar]
- 32.Borland R, Murray K, Gravely S, et al. A new classification system for describing concurrent use of nicotine and vaping products alongside cigarettes (so-called ‘dual use’): findings from the ITC-4 Country Smoking and Vaping wave 1 Survey. Addiction 2019;114: 24–34. [DOI] [PMC free article] [PubMed] [Google Scholar]
- 33.Hammond D, Reid JL, Raynard V, et al. Prevalence of vaping and smoking among adolescents in Canada, England, and the United States: repeat national cross sectional surveys. BMJ 2019;365:l2219. [DOI] [PMC free article] [PubMed] [Google Scholar]
- 34.Vallone DM, Bennett M, Xiao H, Pitzer L, Hair EC. Prevalence and correlates of JUUL use among a national sample of youth and young adults. Tob Control 2019;28:603–609. [DOI] [PubMed] [Google Scholar]
- 35.Coleman B, Chang JT, Rostron BL, et al. An examination of device types and features used by adult electronic nicotine delivery system (ENDS) users in the PATH study, 2015–2016. Int J Environ Res Public Health 2019;16(13):2329. [DOI] [PMC free article] [PubMed] [Google Scholar]
- 36.Mayer M, Reyes-Guzman C, Grana R, Choi K, Freedman ND. Demographic characteristics, cigarette smoking, and e-cigarette use among US adults. JAMA Netw Open 2020;3(10):e20200694. [DOI] [PMC free article] [PubMed] [Google Scholar]
- 37.McKelvey K, Halpern-Felsher B. How and why California young adults are using different brands of pod-type electronic cigarettes in 2019: Implications for researchers and regulators. J Adolescent Health 2020. doi: 10.1016/j.adohealth.2020.01.017 [DOI] [PMC free article] [PubMed] [Google Scholar]
- 38.Eissenberg T, Soule E, Saliba N, et al. JUUL: the prototypical “pod mod”: design characteristics, toxicant yield, and preliminary nicotine delivery and subjective effect profile. Presented at: National Institutes of Health (NIH) Tobacco Regulatory Science Meeting; June 19, 2018; Bethesda, MD. [Google Scholar]
Associated Data
This section collects any data citations, data availability statements, or supplementary materials included in this article.